Download to read offline


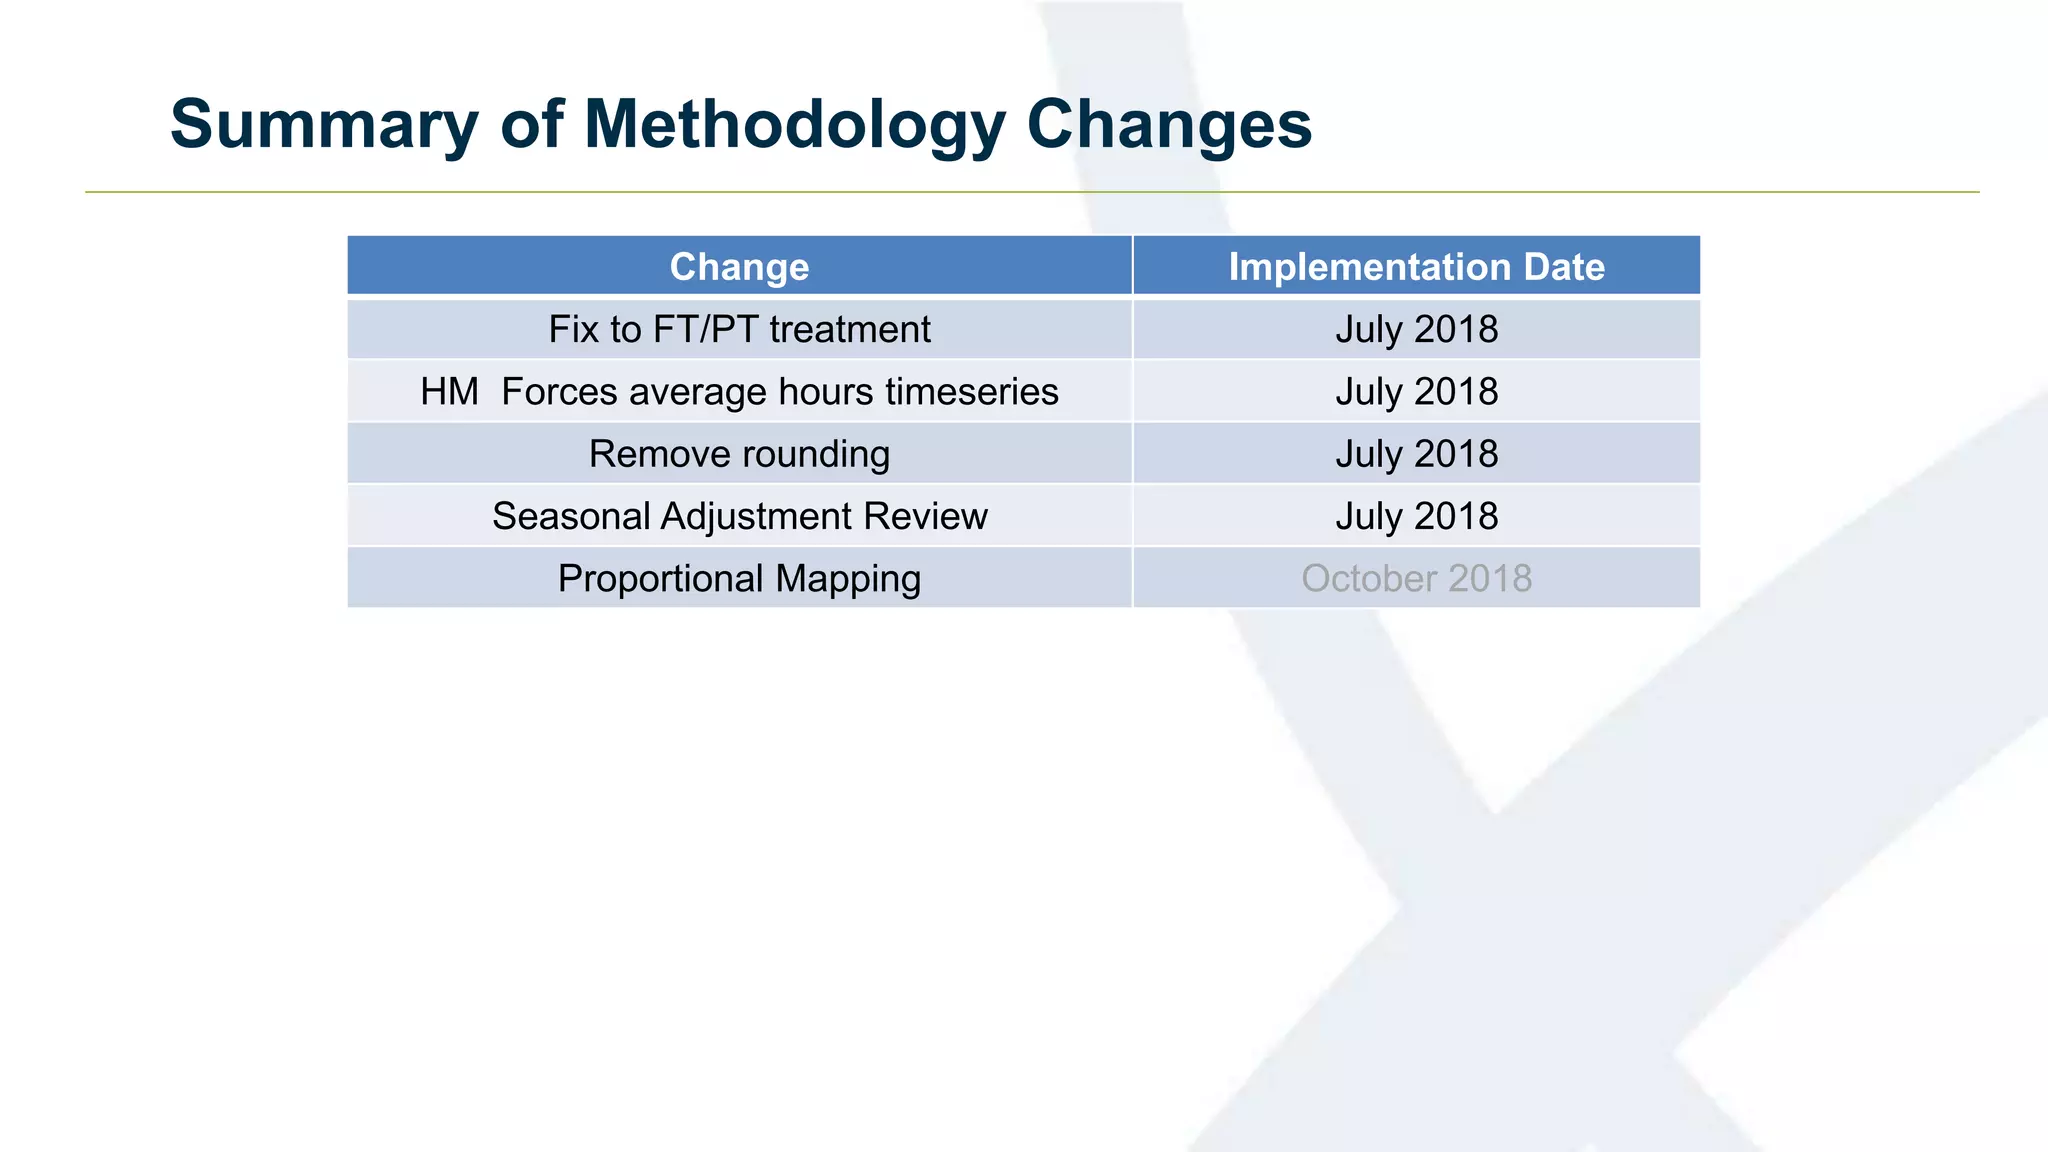


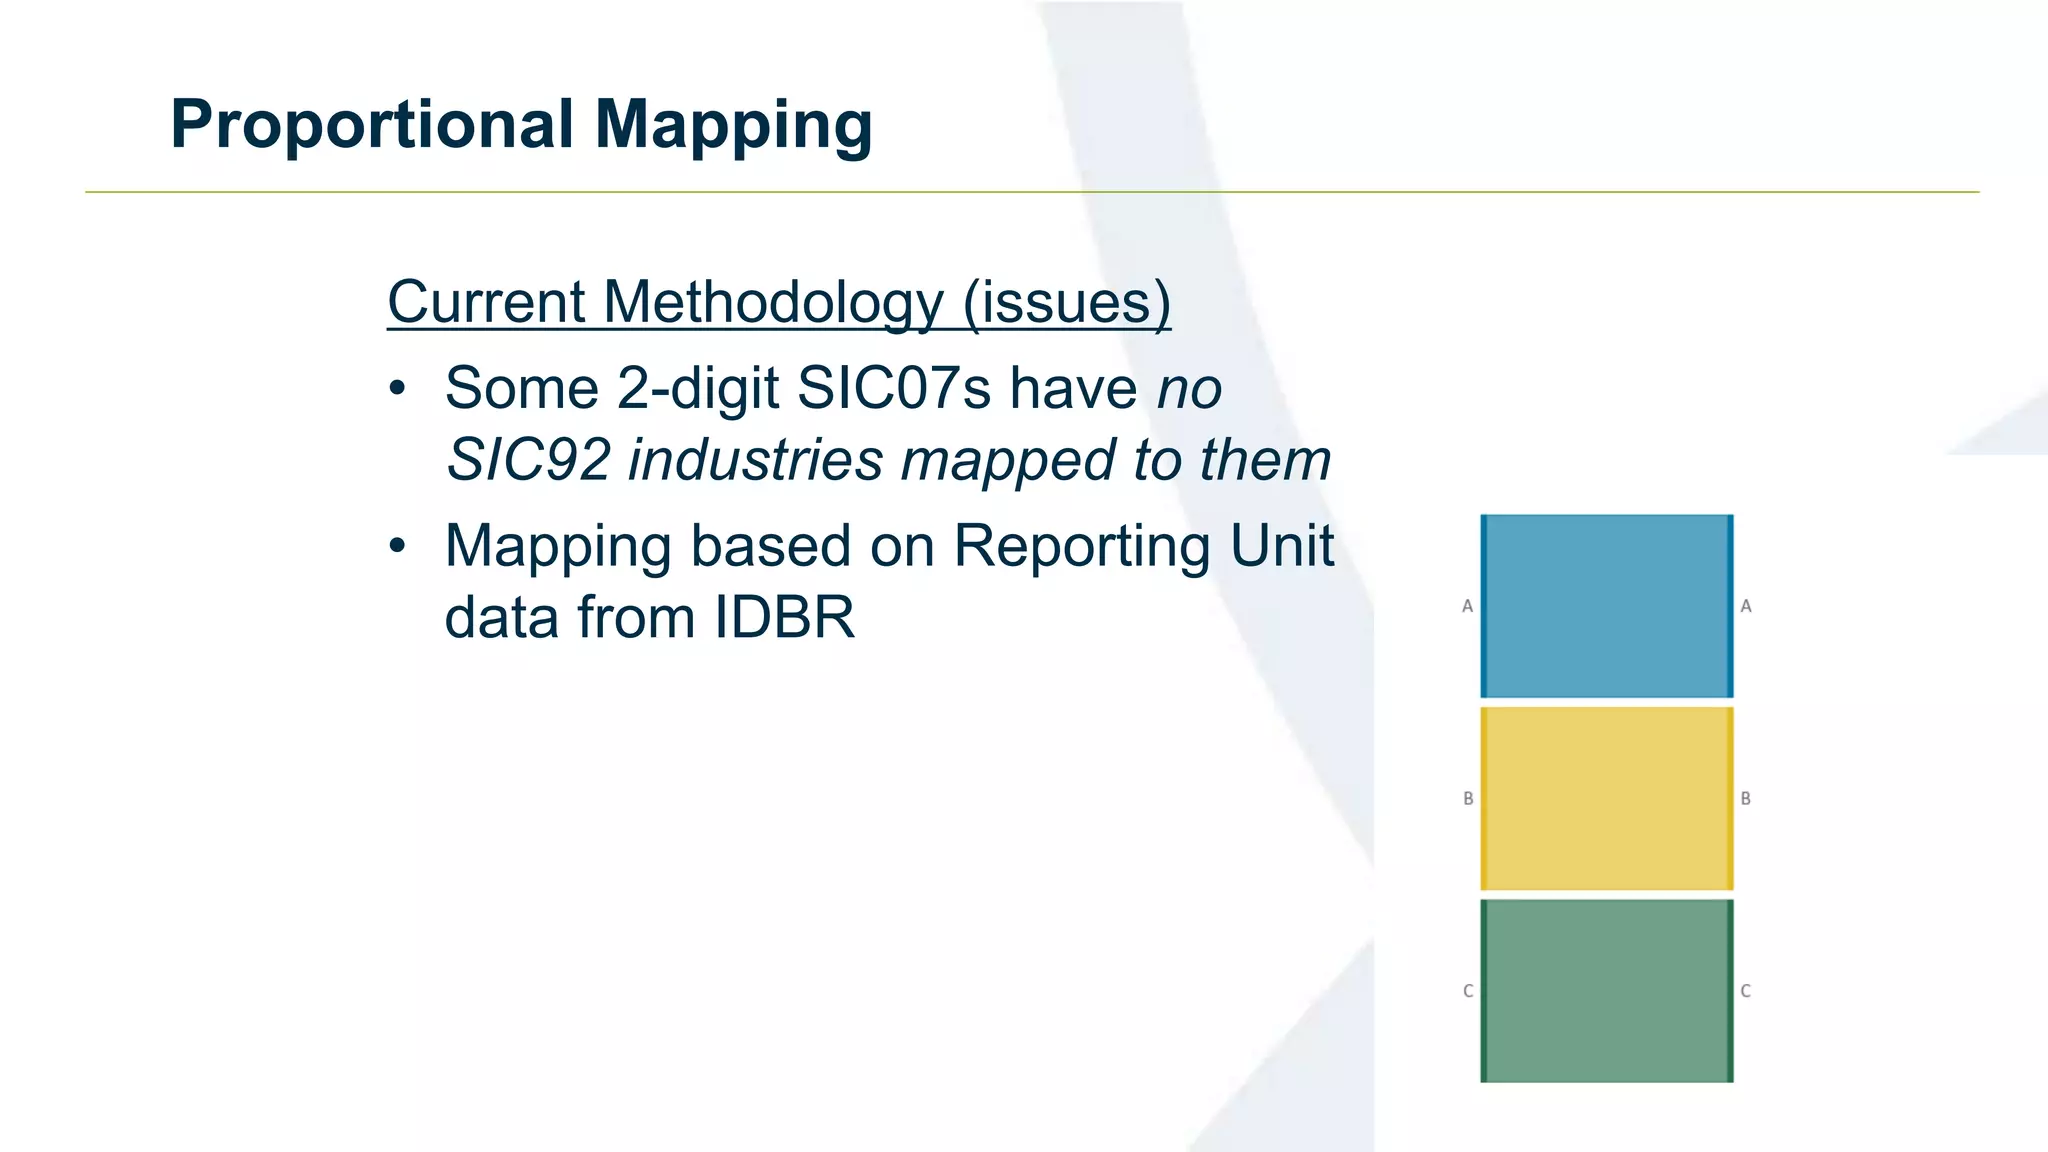
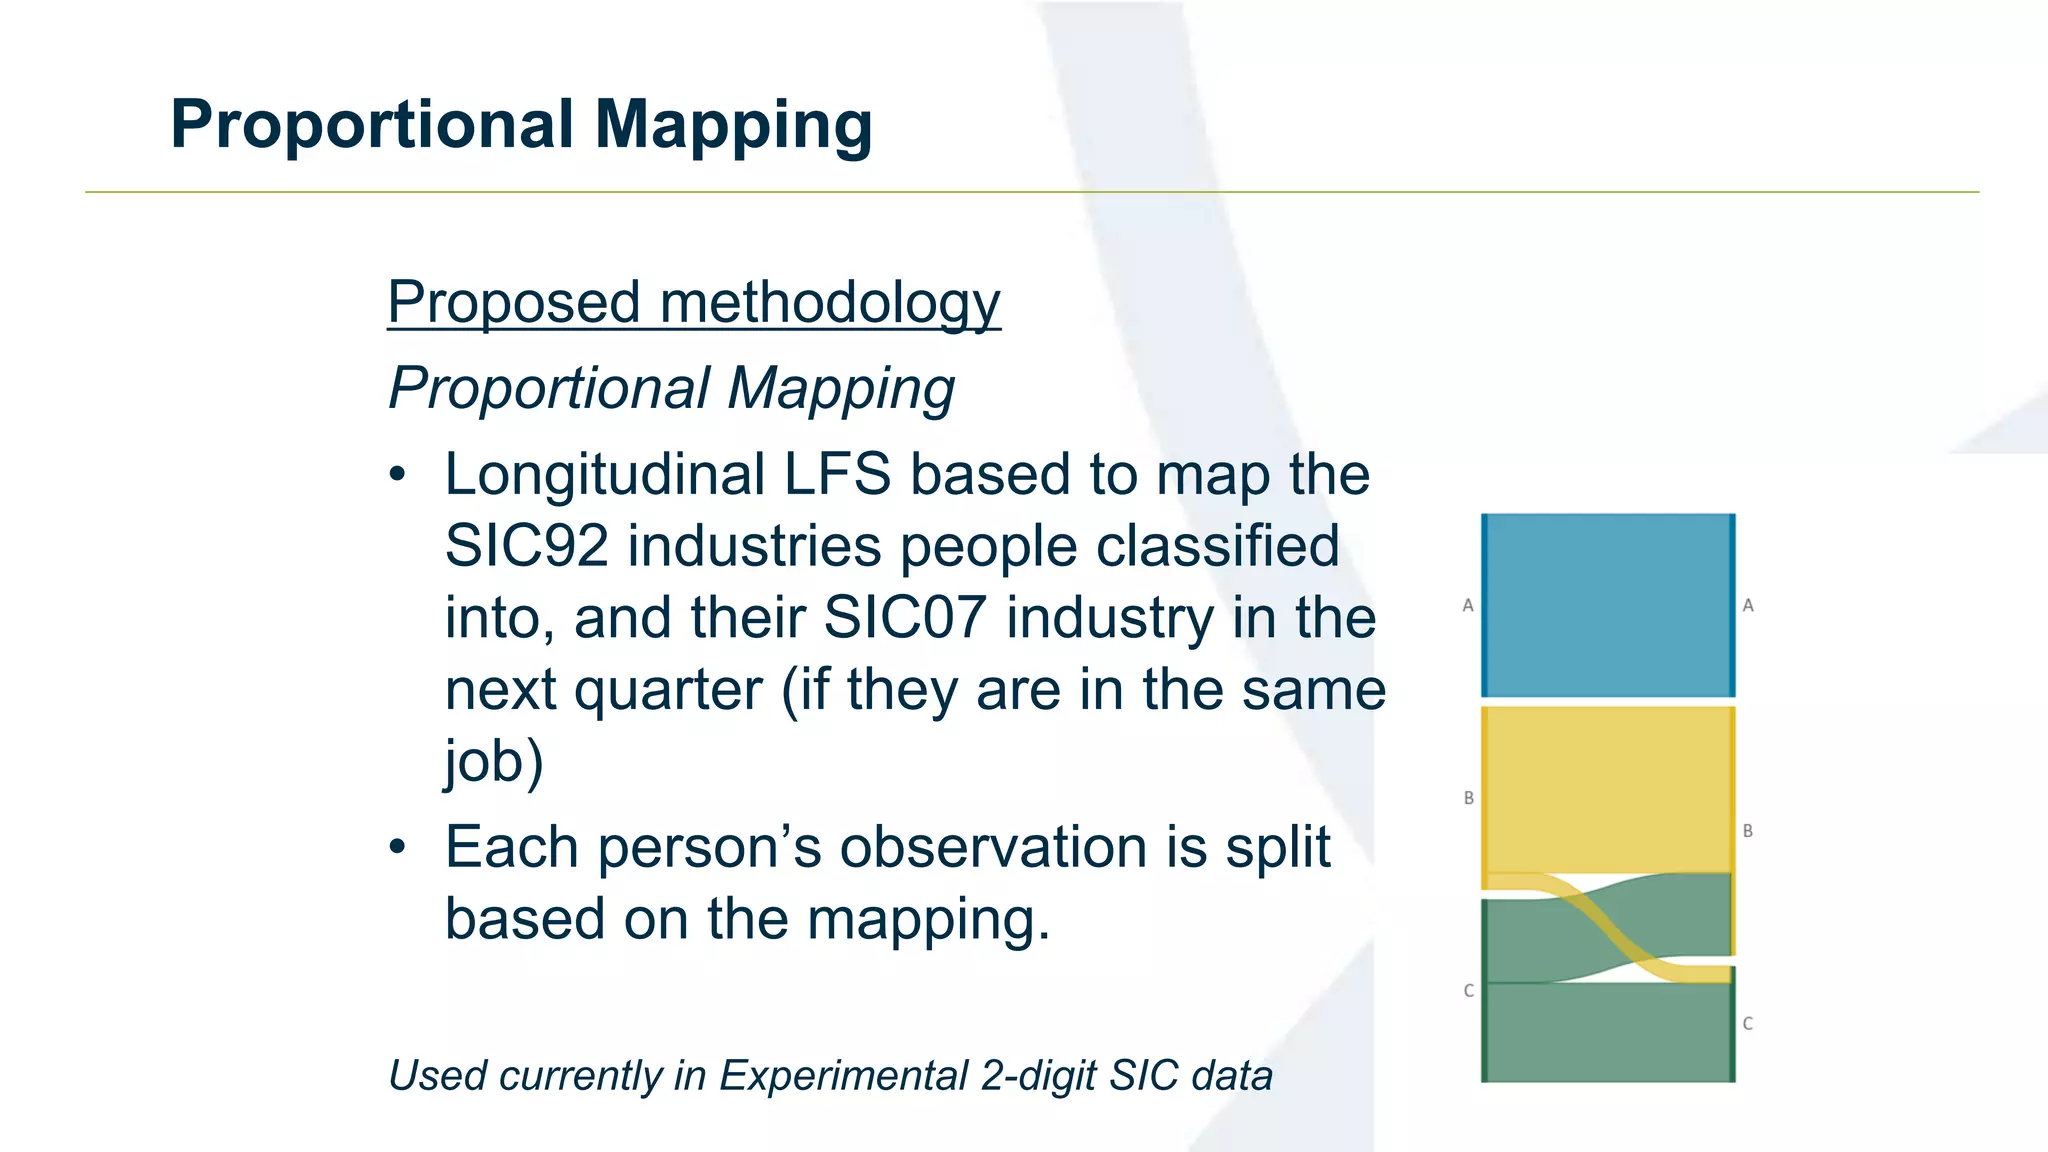

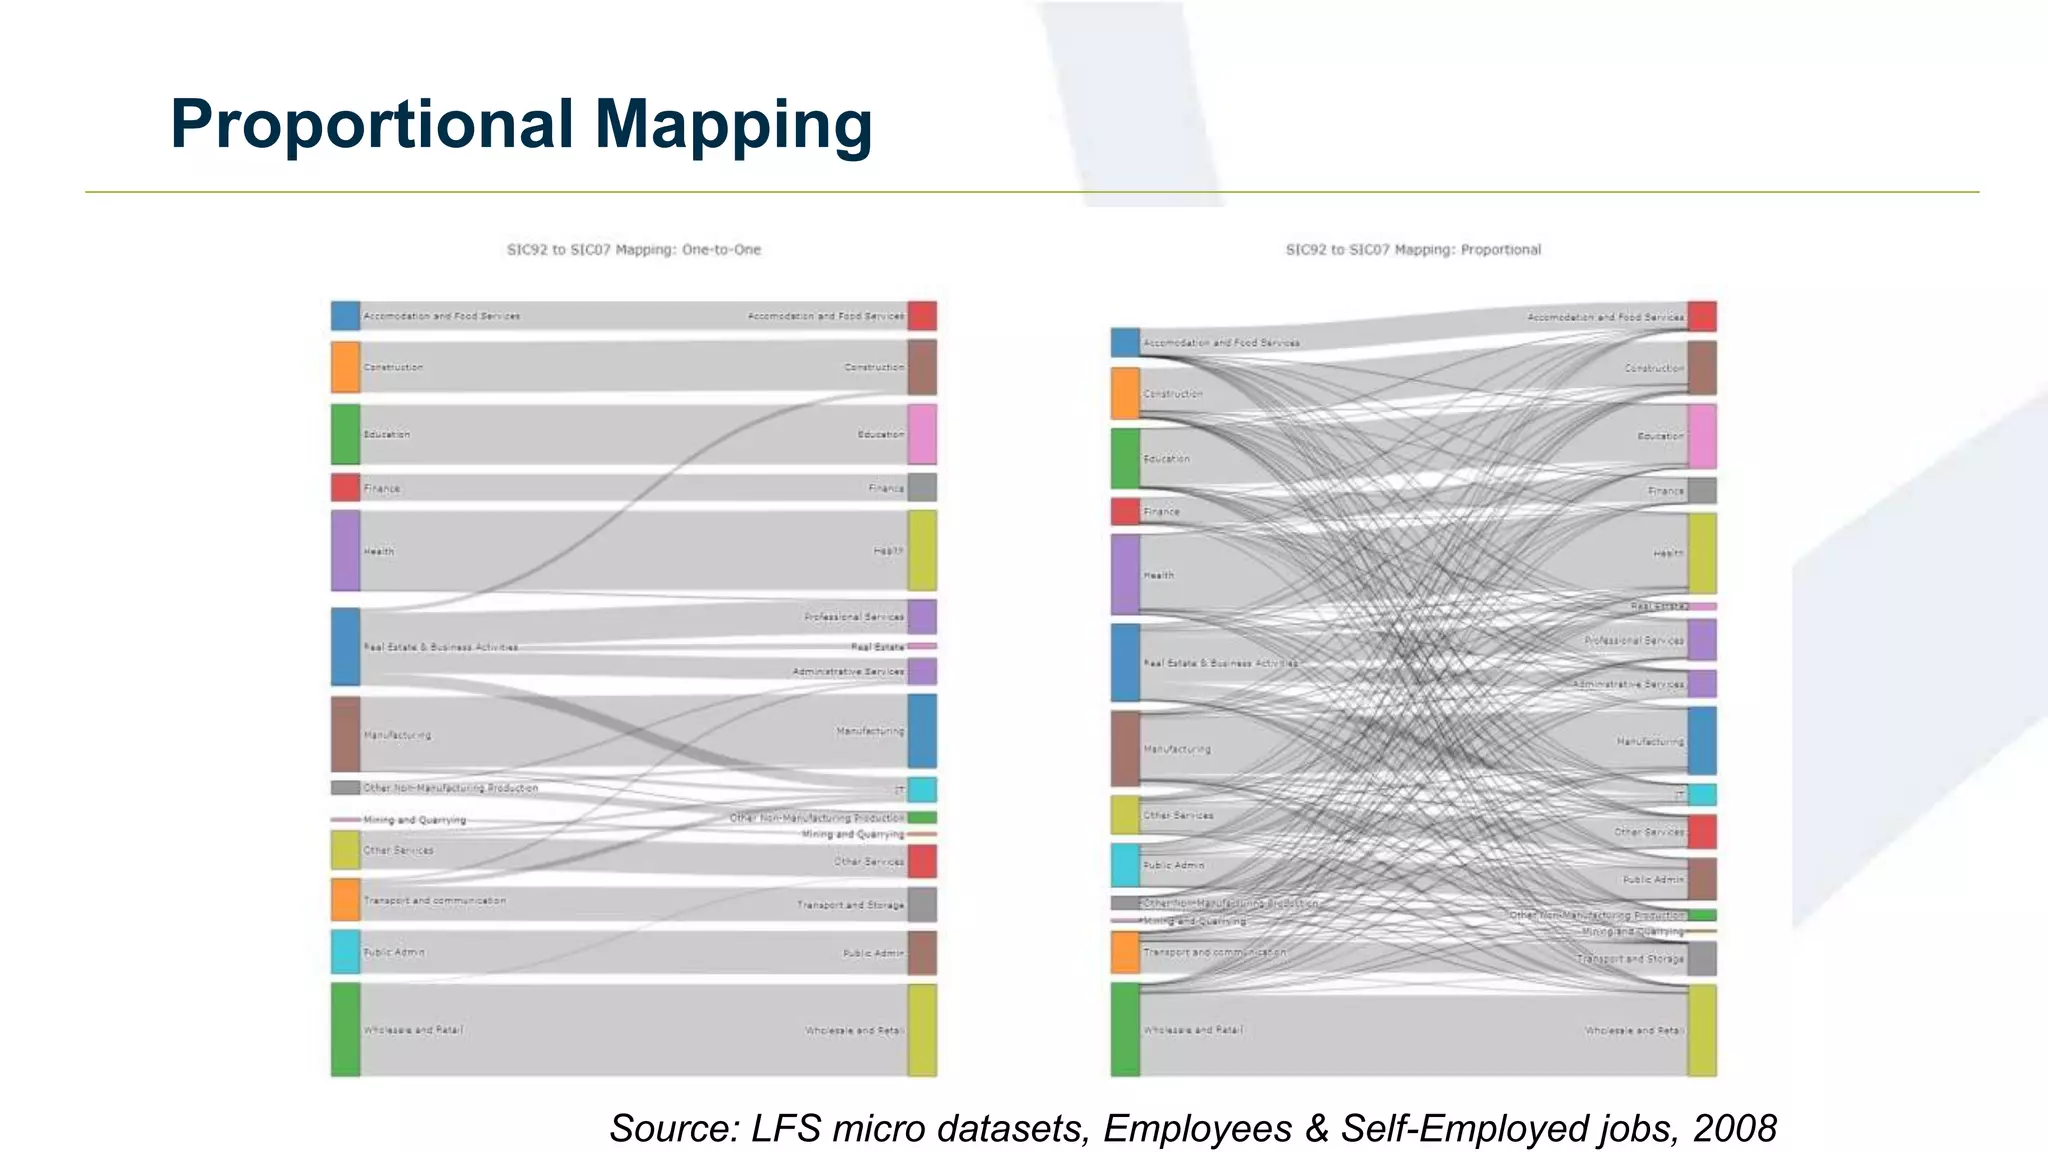
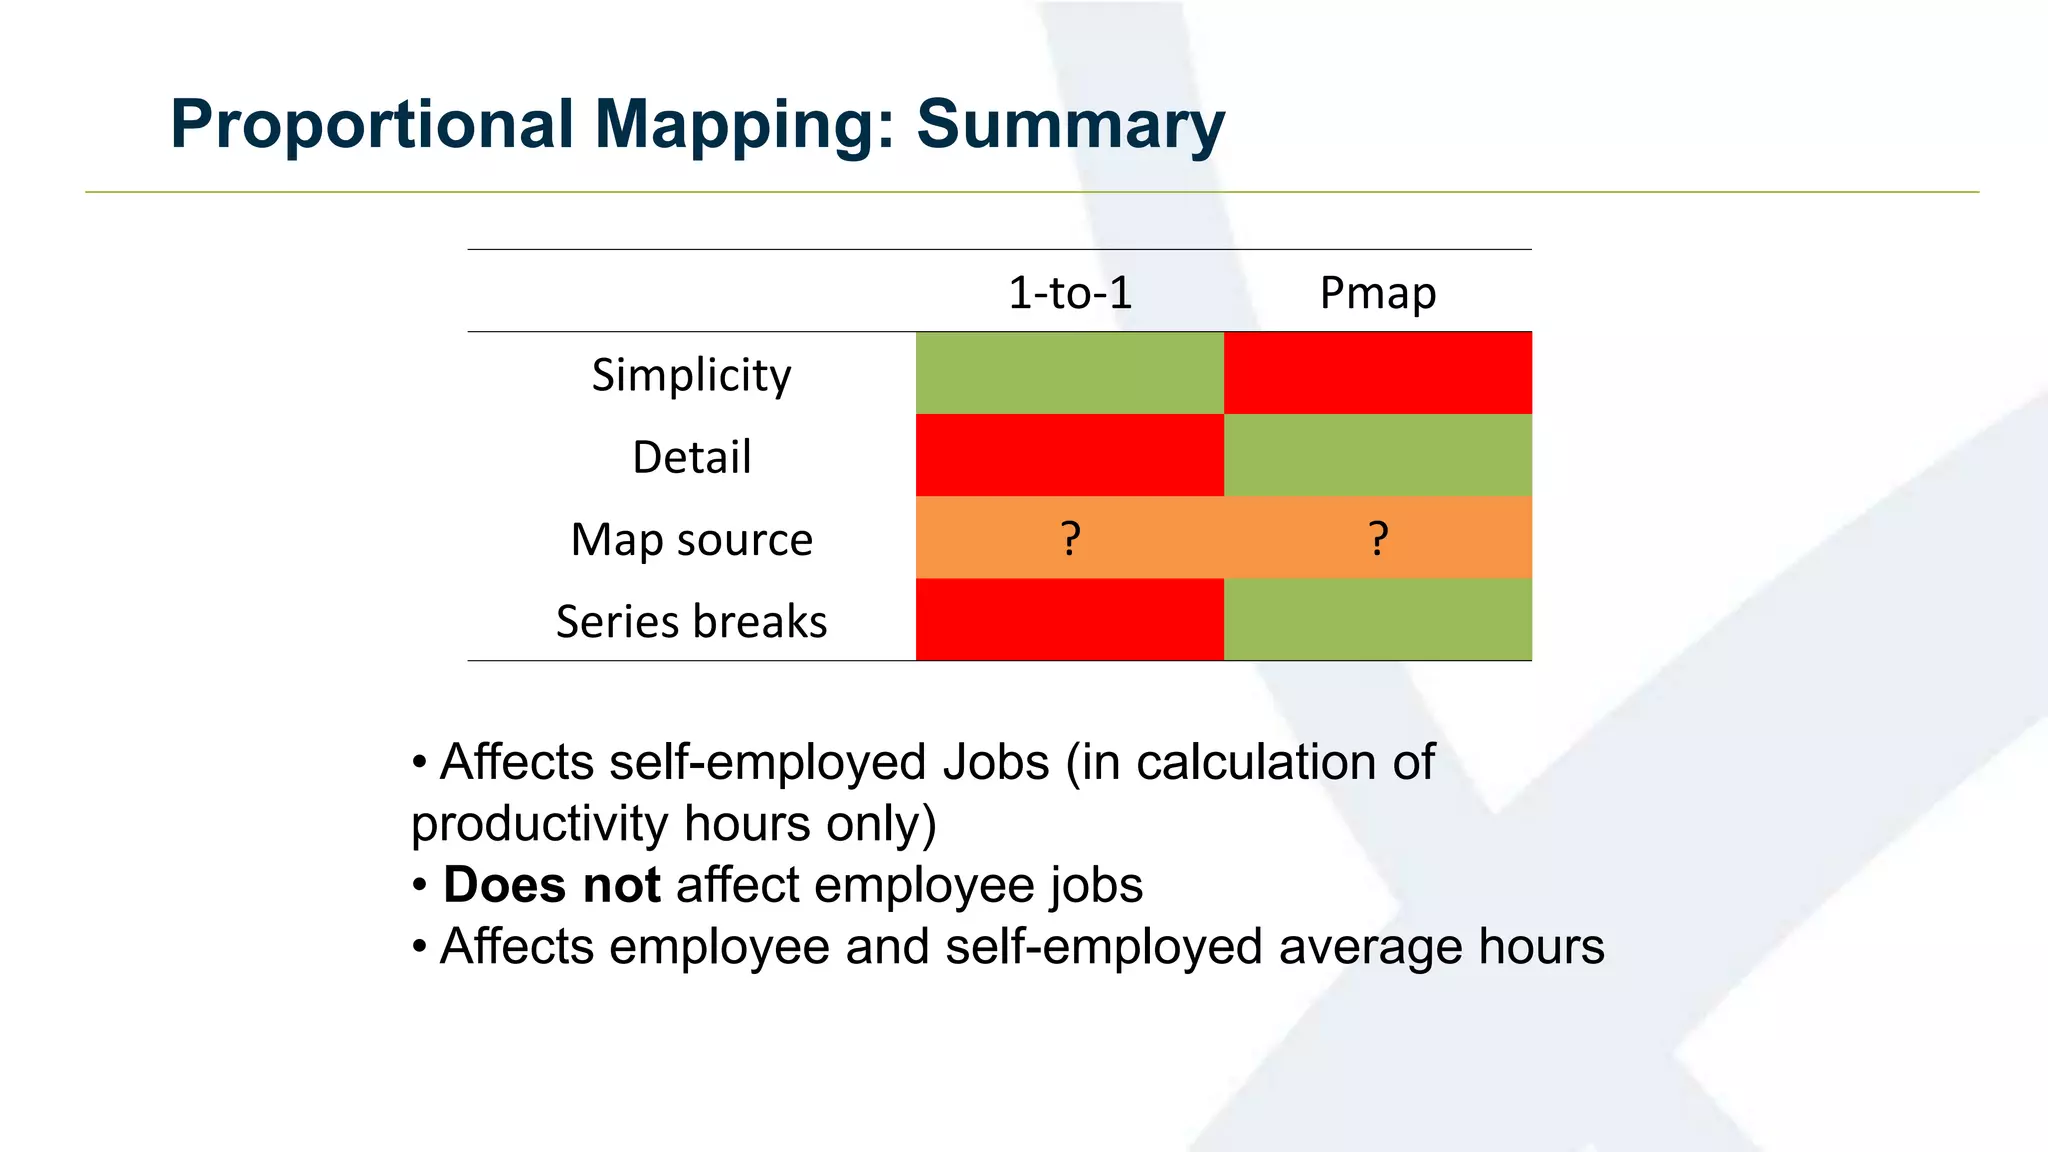
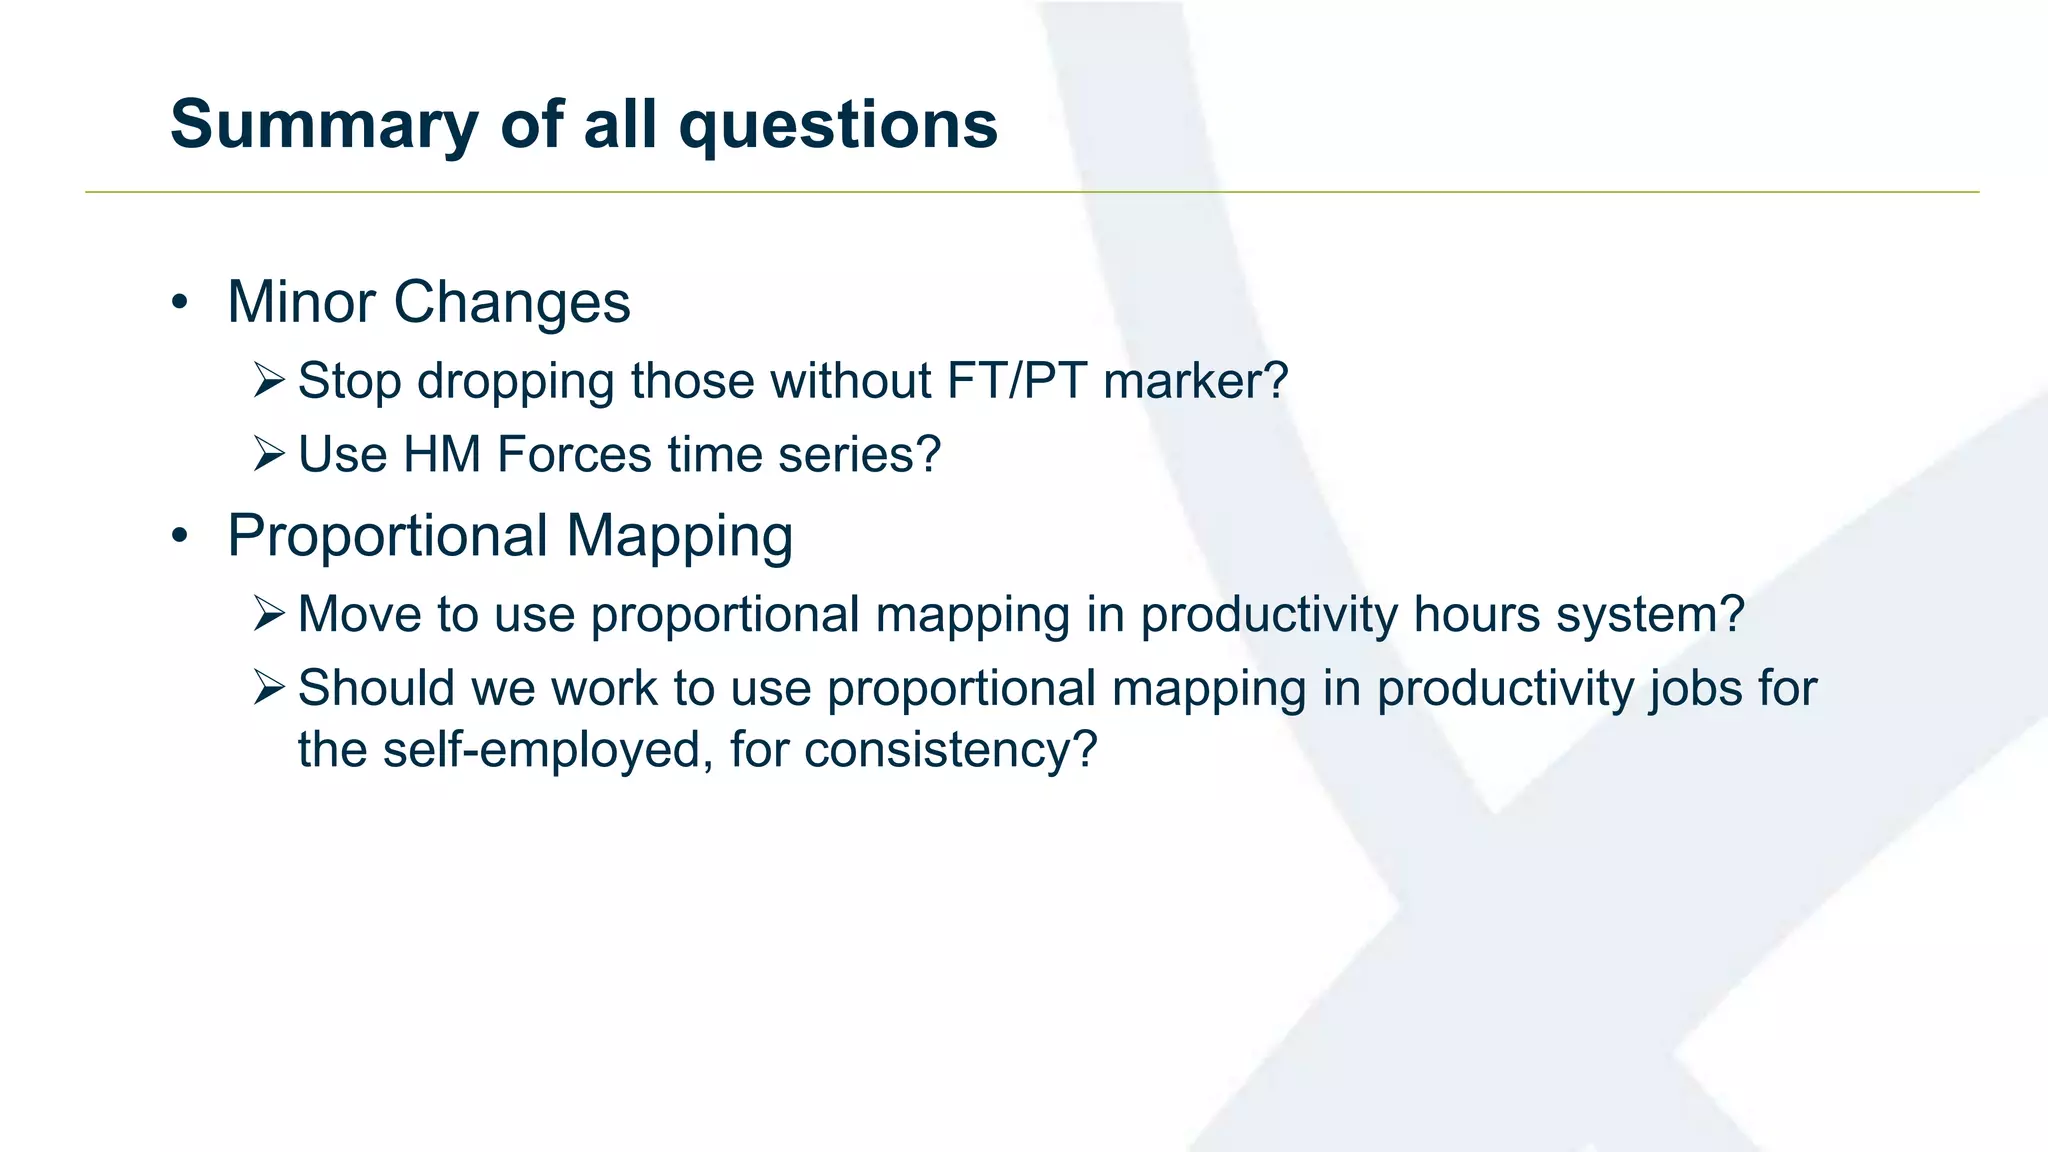


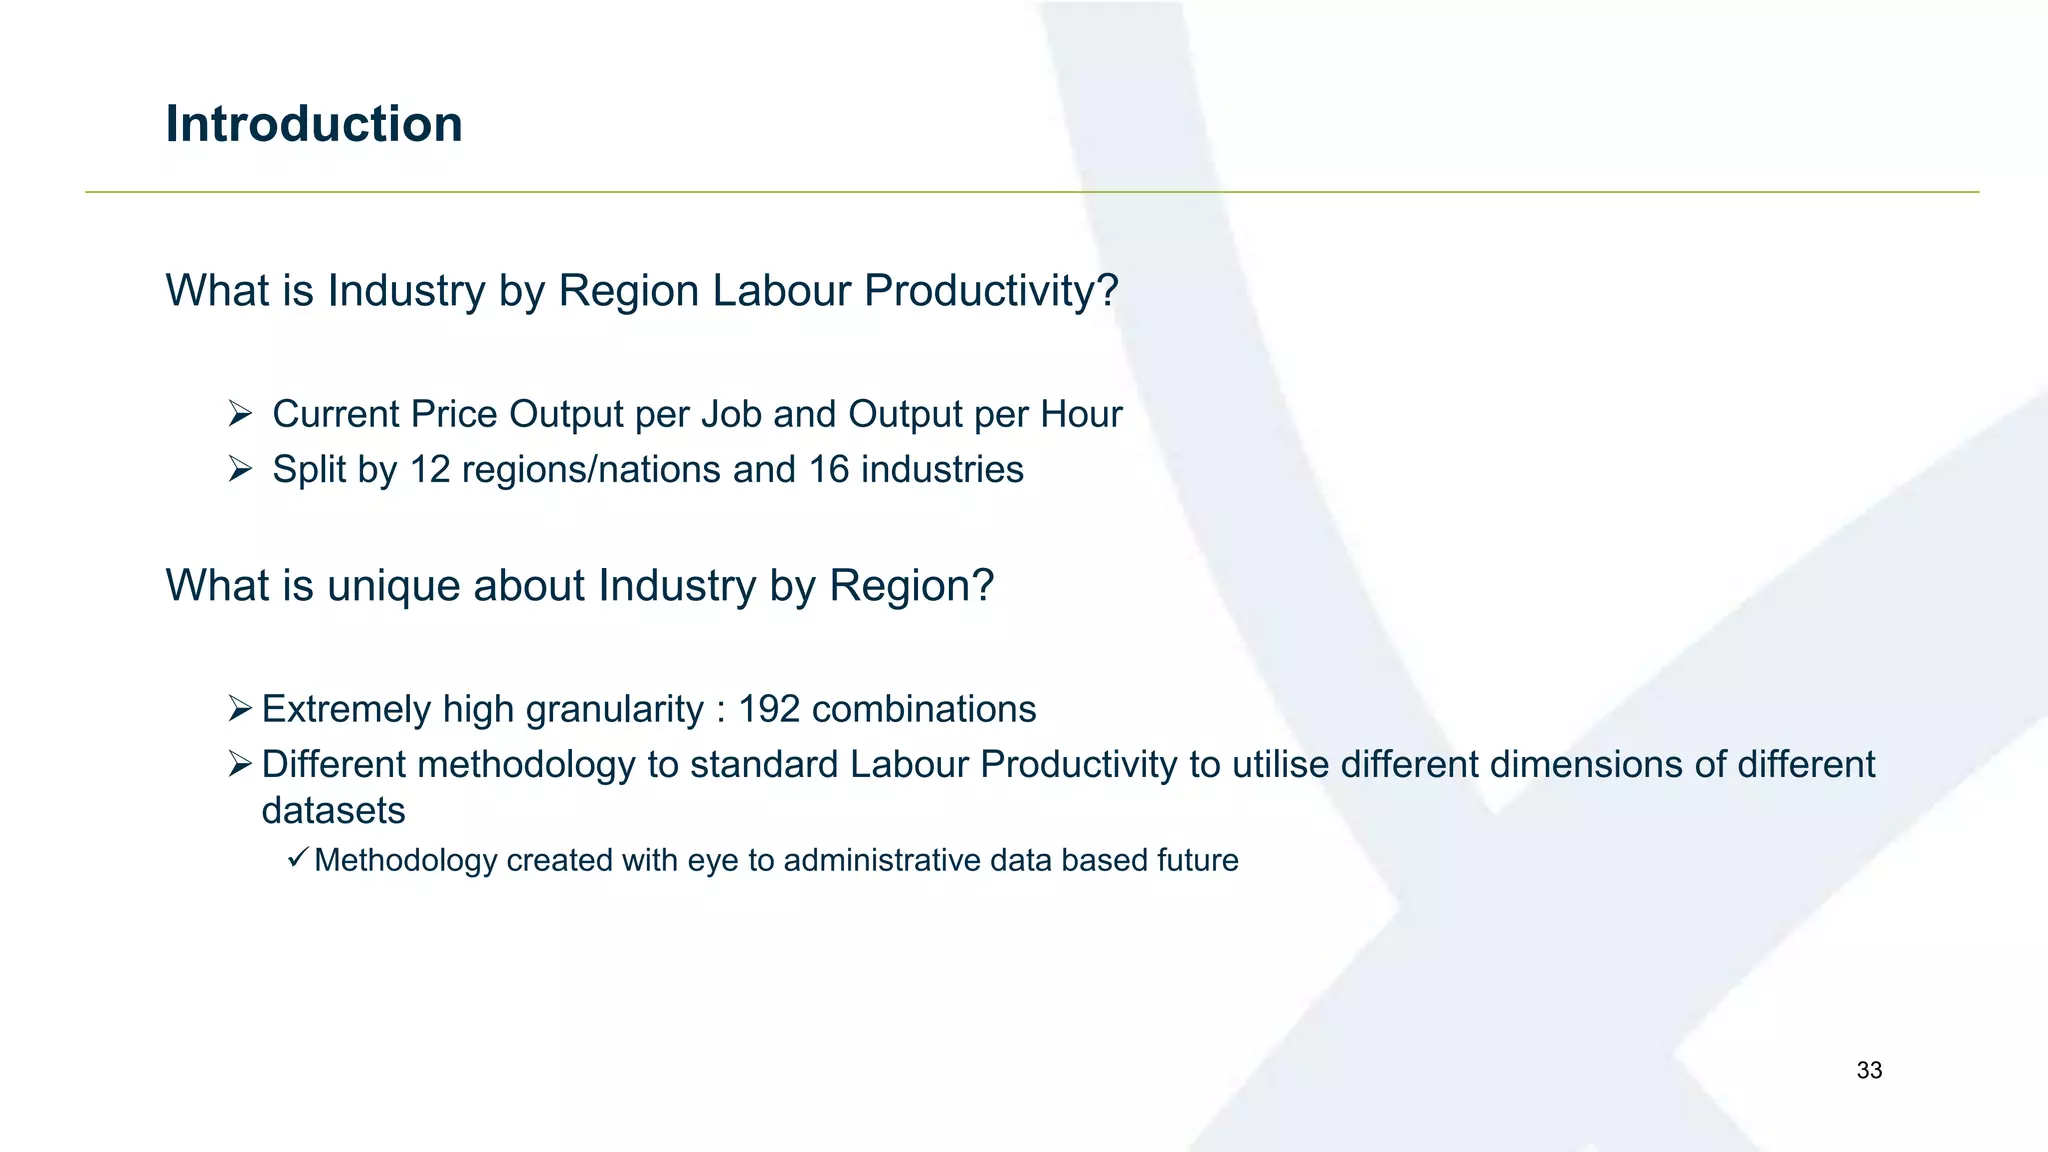


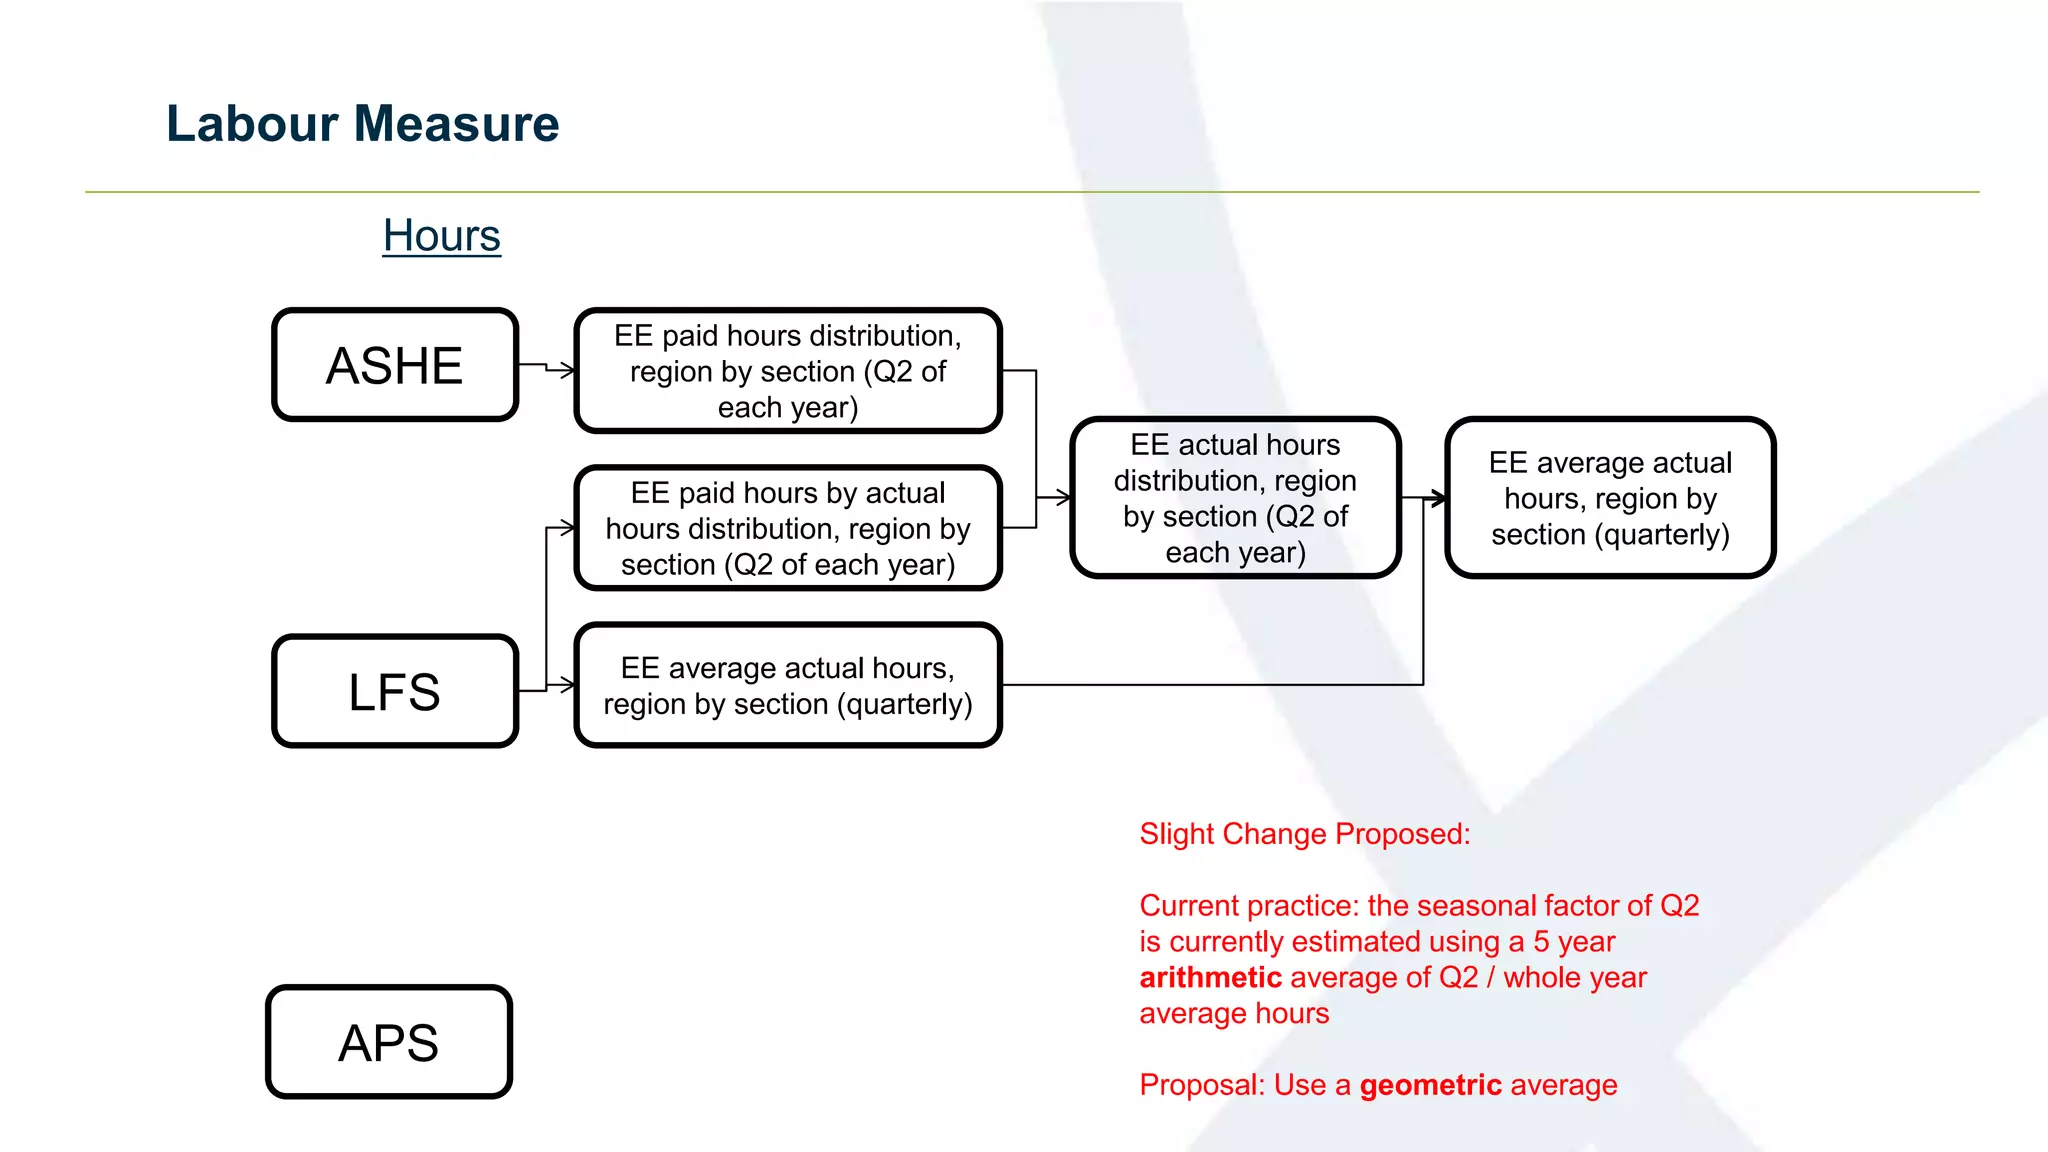
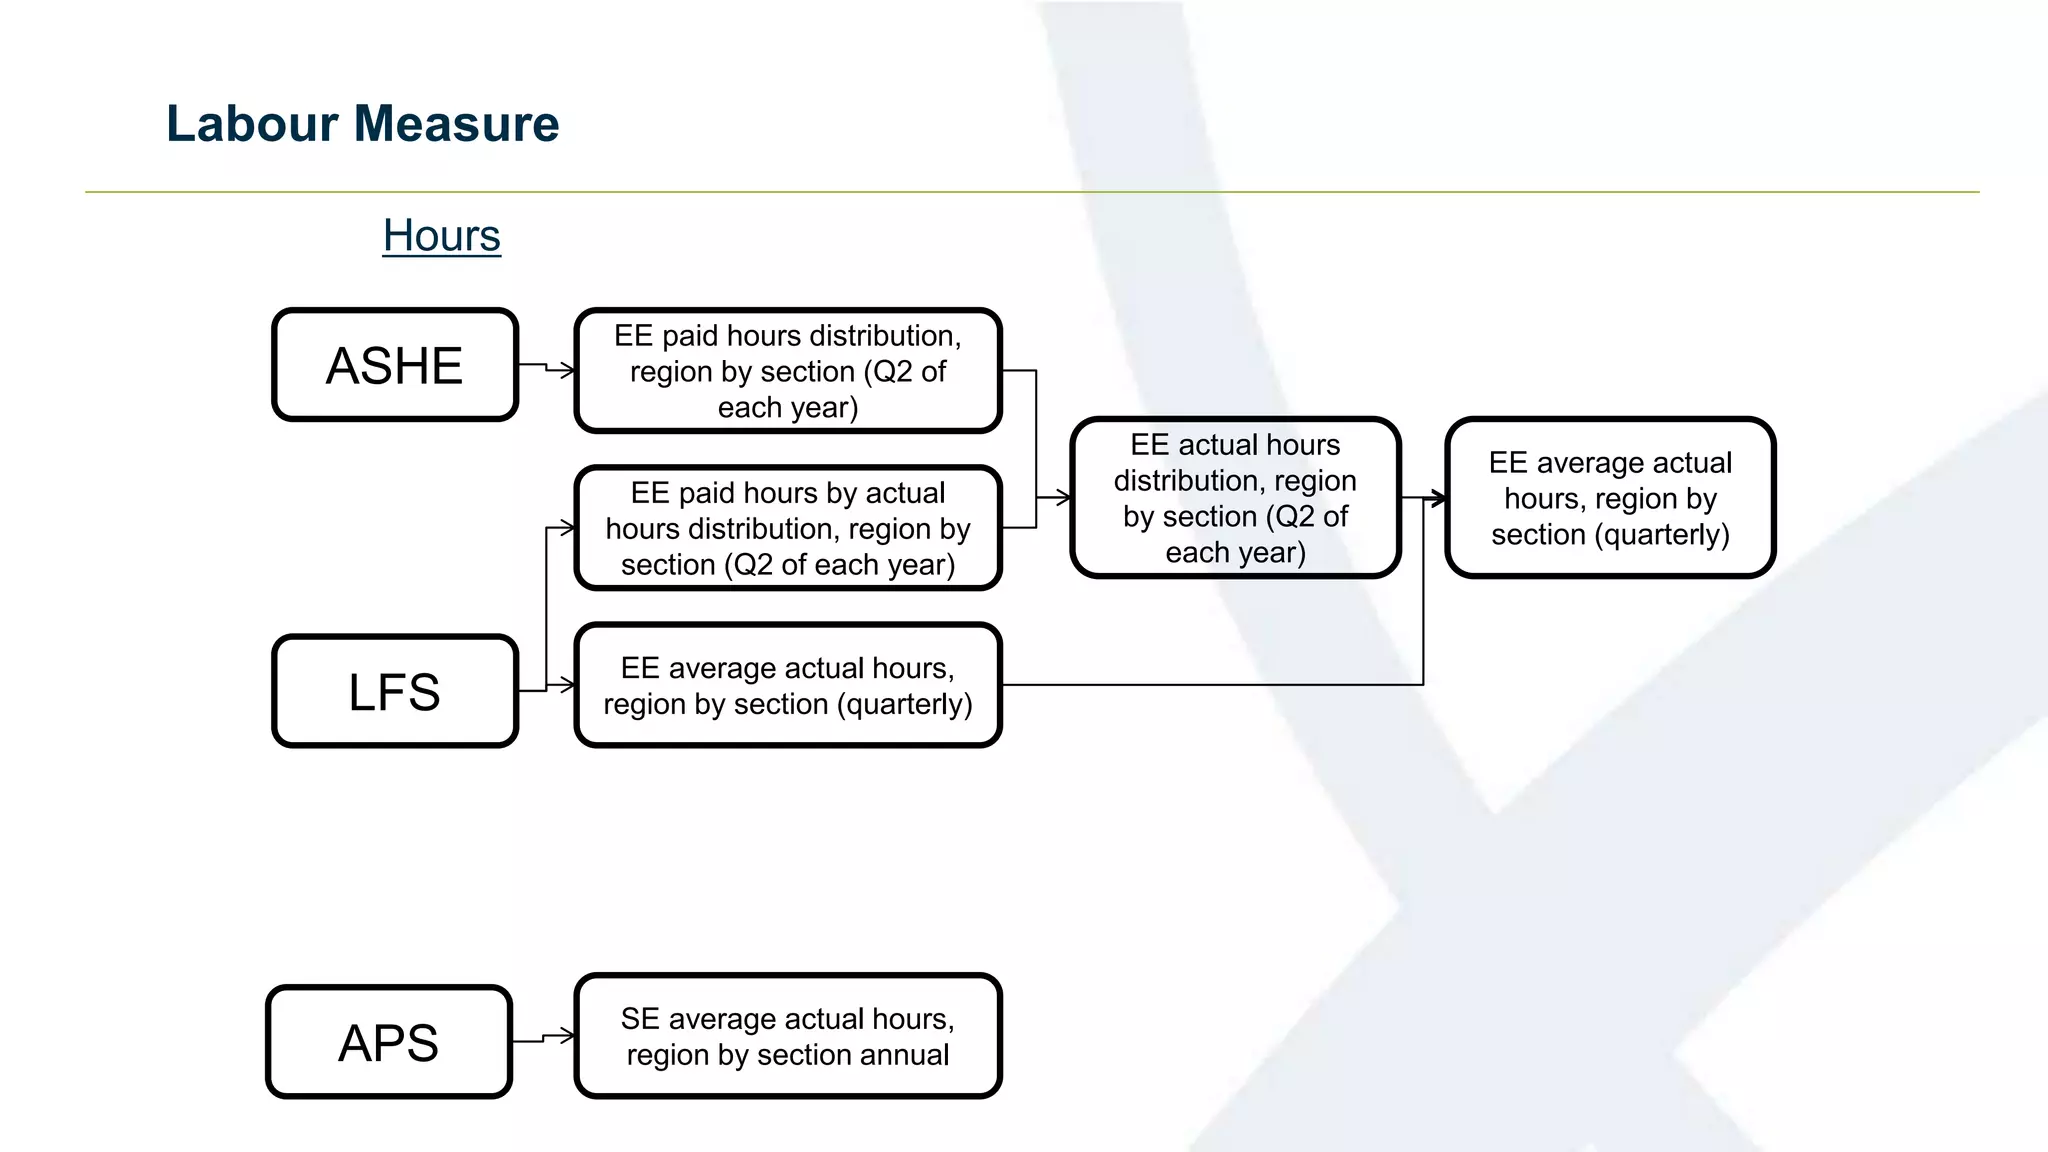


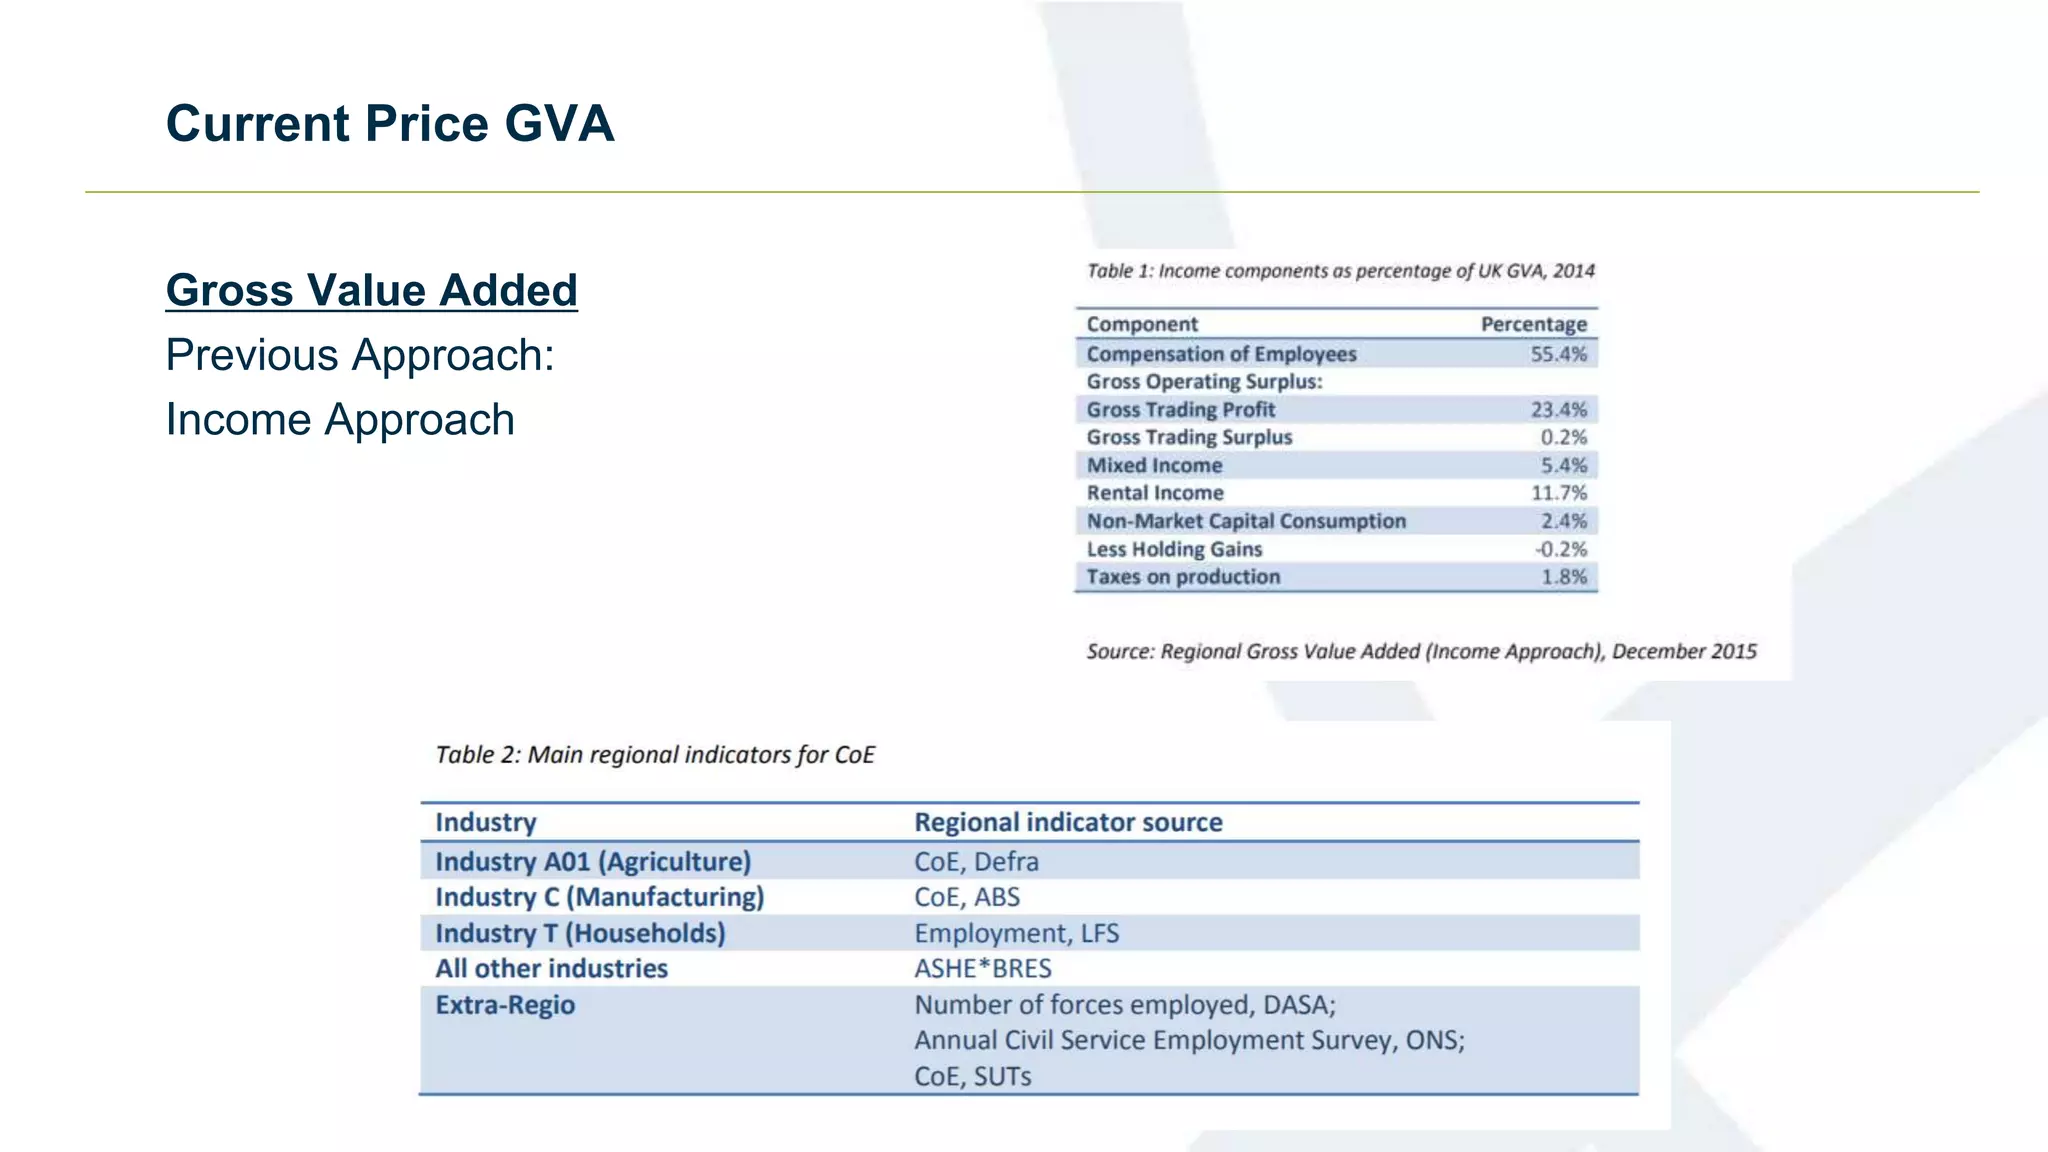


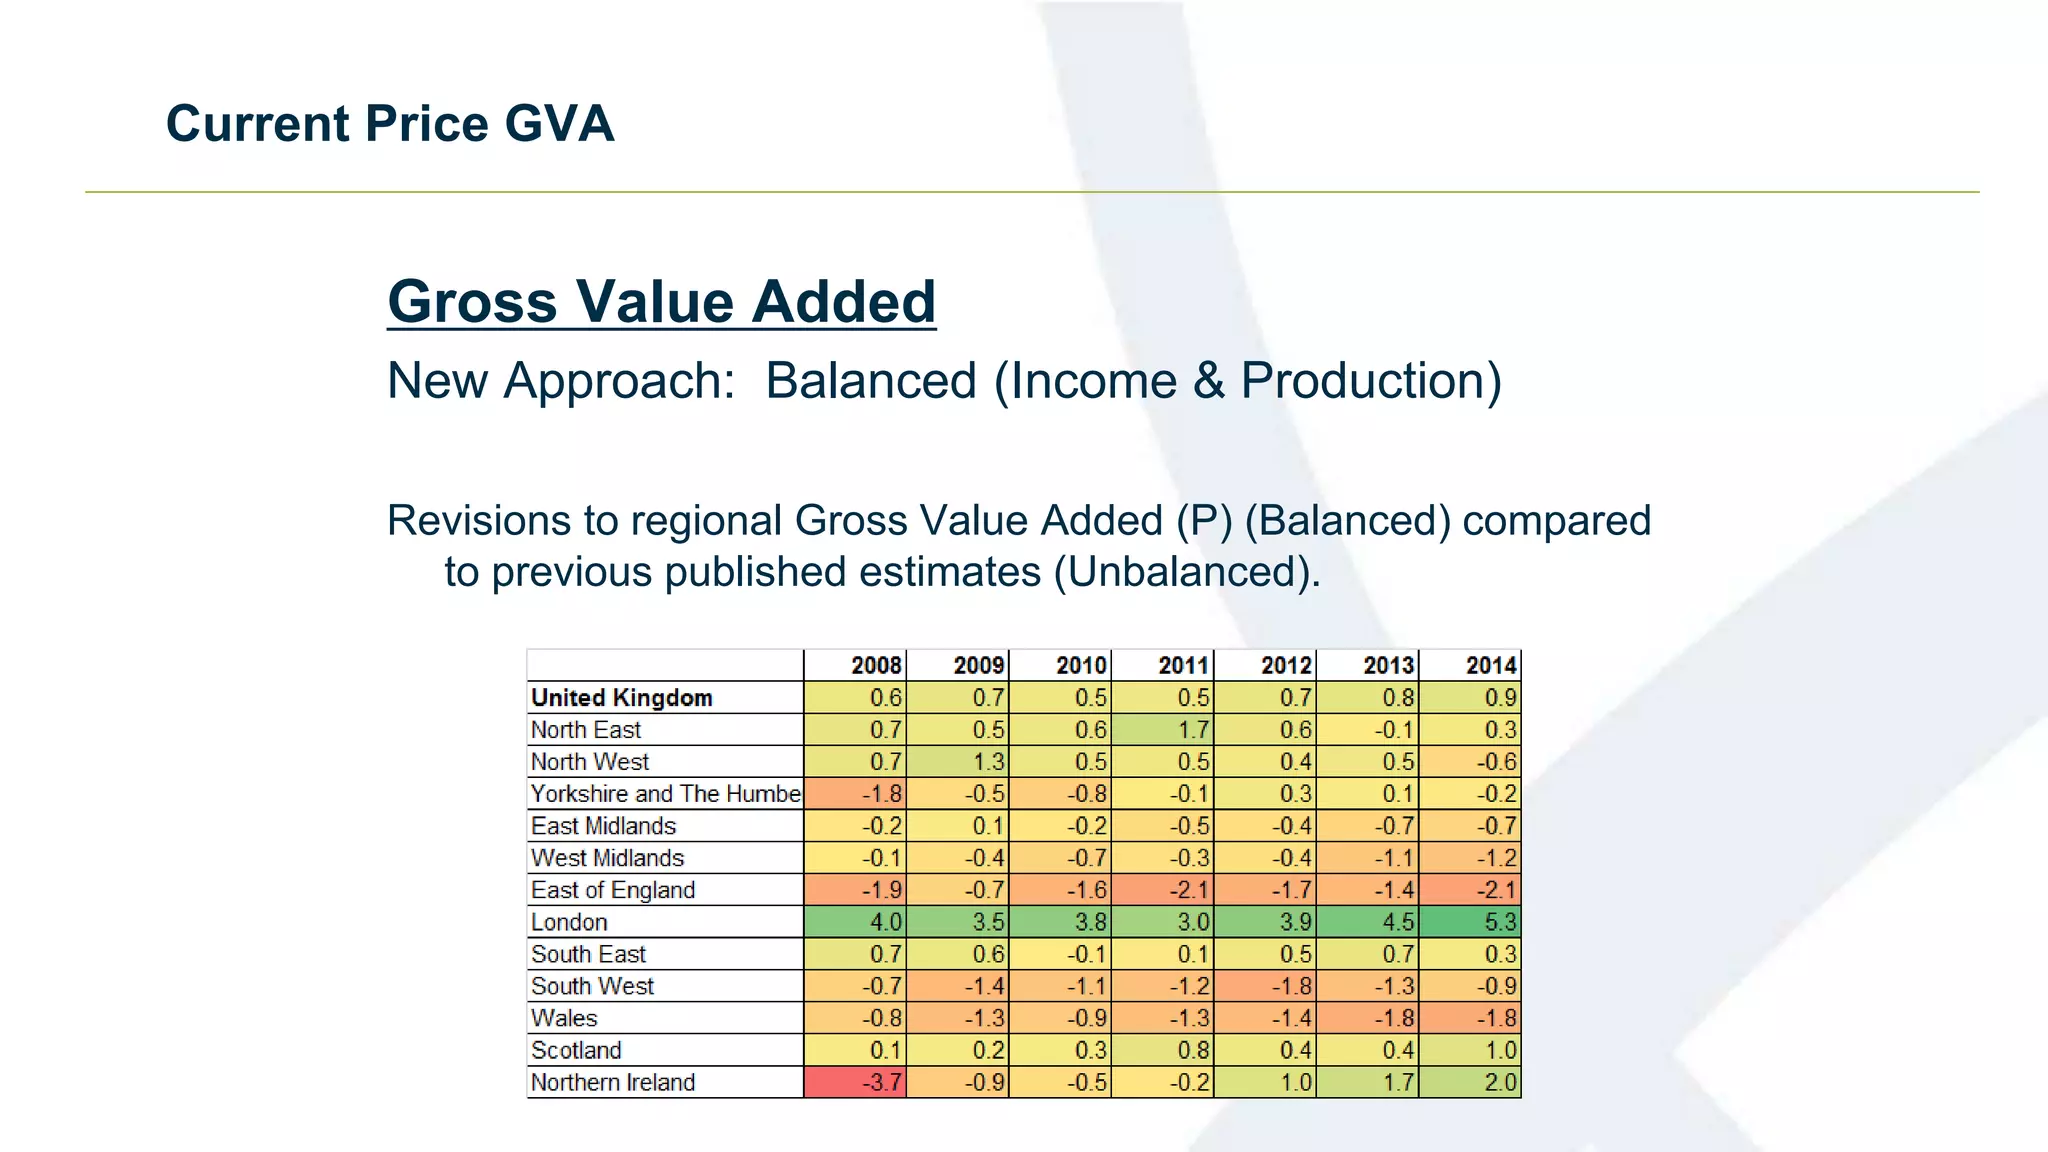


The document discusses proposed methodological changes to how labour productivity is calculated in the UK. It summarizes changes to: [1] Stop dropping observations without full-time/part-time markers and use an updated time series for average HM Forces hours; [2] Move to proportional mapping for self-employed jobs; and [3] Use a geometric average when adjusting seasonal factors for average hours data. The document also provides an overview of regional labour productivity calculations and proposes moving to a balanced approach for current price GVA and creating a new chained volume measure at the industry-region level.


