Operations Management VTU BE Mechanical 2015 Solved paper

The document provides information about operations management concepts including scientific management, productivity, ABC analysis, economic order quantity, and materials requirements planning. It defines each concept and provides examples to illustrate how they are applied. Scientific management aims to improve efficiency through systematic analysis of work processes. Productivity is a measure of output per unit of input. ABC analysis categorizes inventory items based on their value and usage to determine appropriate control methods. Economic order quantity and ordering cycle determine optimal replenishment amounts and frequencies to minimize total inventory costs. Materials requirements planning is a technique to plan material needs at different production levels based on a product structure tree.

Recommended
More Related Content
Similar to Operations Management VTU BE Mechanical 2015 Solved paper
Similar to Operations Management VTU BE Mechanical 2015 Solved paper (19)
More from Somashekar S.M
More from Somashekar S.M (20)
Recently uploaded
Recently uploaded (20)
Operations Management VTU BE Mechanical 2015 Solved paper
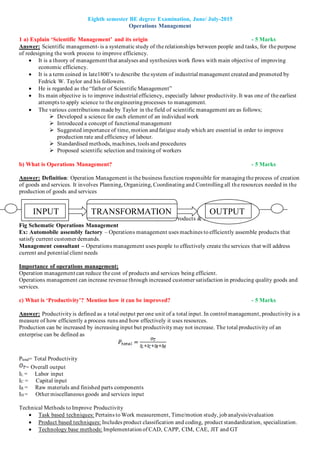
- 1. Eighth semester BE degree Examination, June/ July-2015 Operations Management 1 a) Explain ‘Scientific Management’ and its origin - 5 Marks Answer: Scientific management- is a systematic study of the relationships between people and tasks, for the purpose of redesigning the work process to improve efficiency. • It is a theory of management that analyses and synthesizes work flows with main objective of improving economic efficiency. • It is a term coined in late1800’s to describe the system of industrial management created and promoted by Fedrick W. Taylor and his followers. • He is regarded as the “father of Scientific Management” • Its main objective is to improve industrial efficiency, especially labour productivity. It was one of the earliest attempts to apply science to the engineering processes to management. • The various contributions made by Taylor in the field of scientific management are as follows; ➢ Developed a science for each element of an individual work ➢ Introduced a concept of functional management ➢ Suggested importance of time, motion and fatigue study which are essential in order to improve production rate and efficiency of labour. ➢ Standardised methods, machines, tools and procedures ➢ Proposed scientific selection and training of workers b) What is Operations Management? - 5 Marks Answer: Definition: Operation Management is the business function responsible for managing the process of creation of goods and services. It involves Planning, Organizing, Coordinating and Controlling all the resources needed in the production of goods and services (Resources) (Goods/Products & Services) Fig Schematic Operations Management Ex: Automobile assembly factory – Operations management uses machines to efficiently assemble products that satisfy current customer demands. Management consultant – Operations management uses people to effectively create the services that will address current and potential client needs Importance of operations management; Operation management can reduce the cost of products and services being efficient. Operations management can increase revenue through increased customer satisfaction in producing quality goods and services. c) What is ‘Productivity’? Mention how it can be improved? - 5 Marks Answer: Productivity is defined as a total output per one unit of a total input. In control management, productivity is a measure of how efficiently a process runs and how effectively it uses resources. Production can be increased by increasing input but productivity may not increase. The total productivity of an enterprise can be defined as Ptotal= Total Productivity = Overall output IL = Labor input IC = Capital input IR = Raw materials and finished parts components IH = Other miscellaneous goods and services input Technical Methods to Improve Productivity • Task based techniques: Pertains to Work measurement, Time/motion study, job analysis/evaluation • Product based techniques: Includes product classification and coding, product standardization, specialization. • Technology base methods: Implementation of CAD, CAPP, CIM, CAE, JIT and GT INPUT TRANSFORMATION ON OUTPUT
- 2. • Material based techniques: Related to MRP, Inventory Management & Control, and Material handling systems. • Employee based methods: Adopting various incentives schemes for both individual and group of employees, total quantity management etc. d) Suppose a company produced 300 standard book cases last week using 8 workers and it produced 240 standard book cases this week using 6 workers. In which week was productivity higher? The above problem pertains to productivity which defines labour efficiency. - 5 Marks Answer: 2 a) Explain what ‘Uncertainty’ is and how this can be overcome in operations management? - 8 Marks Answer: When the decision maker faces multiple states of nature but he has no means to arrive at probability values to the likelihood of occurrence of these states of nature, this problem is a decision problem under uncertainty. Such situations arise when a new product is introduced in the market or a new plant is setup. In business, there are many problems of this ‘nature’. Here the choice of decision largely depends on the personality of decision maker. The following choices are available before the decision maker in situations of uncertainty. Maximax criterion: is an abbreviation of the phrase ‘maximum of the maximums’ and an adventurous & aggressive decision maker may choose to take the action that would result in the maximum payoff possible. Suppose for each action there are three possible payoffs corresponding to three states of nature as given the following decision matrix. States of nature Decisions A1 A2 A3 S1 220 180 100 S2 160 190 180 S3 140 170 200 Maximax 220 190 200 Maximum of these three maximums is 220 Minimax criterion: is just opposite of maximax. Application of the minimax criteria requires a table of losses instead of gains. The losses are the costs to be incurred or the damages to be suffered for each of the alternative actions and states of nature. The term minimax is an abbreviation of the phrase minimum of the maximum. States of nature Decisions A1 A2 A3 S1 0 4 10 S2 3 0 6 S3 18 14 0 It shows that the maximum losses incurred b the various decisions. Minimax 18 14 10 Minimum of these three maximums is 10 Maximin criterion: The maximin criteria of decision making stands for choice between alternative courses of action assuming pessimistic view of nature. The below table consists of worst possible results in terms of payoff and select the act which maximizes the minimum payoff. States of nature Decisions A1 A2 A3 S1 -80 -60 -20 S2 -30 -10 -2
- 3. S3 30 15 7 S4 75 80 25 Maximin -80 -60 -20 Maximum of these three minimums is A3 Laplace criterion: As decision maker has no information about the probability of occurrence of various events, the decision maker makes a simple assumption that each probability is equally likely. The expected payoff is worked that each probability is equally likely. The act having maximum expected payoff is selected States of nature Decisions A1 A2 A3 E1 20 12 25 E2 25 15 30 E3 30 20 22 We associate equal probability for each event say 1/3: Expected payoff are b) Explain Baye’s theorem with notations. A study of old buses shows the probability of an accident by over speeding is 0.8, and the probability of over speeding alone is 0.3. The probability of an accident occurring due to non over speeding reduces to 0.1. Recently an accident occurred. What is the probability of that the bus was over speeding? - 6 Marks Answer: Baye’s theorem: It states that. P (A/O) = Probability of occurrence of accident because of over speeding = 0.8 P (O) = Probability of over speeding of bus = 0.3, To find probability that the bus was over speeding given that accident has occurred, is given by Baye’s rule c) Maximize by graphical method. - 6 Marks Solution: Objective function Subjected constraints
- 4. Graphical representation: The coordinates at which two lines intersect away from the origin at last corner of the solution space gives the solution x1=1000 x2=500 If we substitute these values in Z equation, we get x1=1000 x2=500 3. a) Explain the “Moving Average” and “Simple Exponential Smoothing” methods of forecasting. - 8 Marks Answer: Simple moving average: In this model, the arithmetic average of the actual sales for specific number of recent past time periods is taken as the forecast for the next time period. Extending the moving average to include more periods may increase the smootheningeffect but decreases the sensitivityof the forecast.Long periods provide too many opportunities for significant changes to occur in demand pattern. To reduce this risk, the organizations can base its forecast on average demand during short periods say three months. n= number of periods, Di=demand in the ith period Simple Exponential Smoothing In these methods, the forecast sales for the last period are modified by information about the forecast error of the last periods. This modification of the last year’s forecasts is the forecasts for the next time periods. Note: The plotted graph may not be according to the scale. Keep mention appropriate scale when you plot such graphs
- 5. In this methods, the weight assigned to a previous period’s demand decreases exponentially as that data gets older. Thus, recent demand data receive a higher weight than does the older demand data. A simple exponential smoothing technique considers only trend values and does not take into account seasonal indexes or seasonal adjustments. b) Explain linear regression method for trend analysis by least squares. Explain any simplification possible. - 6 Marks Answer: Regression Analysis Regression analysis is a forecasting technique that establishes a relationship between variables – one dependent and other(s) independent. In simple regression, there is only one independent variable. In multiple regressions there is more than one independent variable. Least squares concept is used for regression and correlative analysis between any set of dependent and independent variables. Least square is a widely used mathematical method of obtaining line of best fit between the dependent variable (usually demand) and an independent variable. It is so called as least squares method since the sum of the squares method since the sum of the square of the deviations of the various points from the line of best fit is minimum or least. It gives the equations of the line for which the sum of the squares of vertical distance between the actual values and line values are at minimum. In least squares or regression analysis, the relationship between the dependent variables Y and some independent variable X can be represented by a straight line. The method of least squares is to find the parameters m and c such that sum of squares of the errors is minimum. Let,
- 6. c) The data given below refers to past sales for eleven years. Using least squares estimate sales forecast for next two years. Also use moving average for 3 years and compare the forecasts. Years 1981 1982 1983 1984 1985 1986 1987 1988 1989 1990 1991 35 50 48 47 50 55 65 77 92 86 100 - 6 Marks To find constants m & c Year Code X Y Sales XY X2 1981 1 -175 25 1982 2 -200 16 1983 3 -144 9 1984 4 -94 4 1985 5 -50 1 1986 6 0 0 1987 7 65 1 1988 8 154 4 1989 9 276 9 1990 10 344 16 1991 11 500 25 n=11 Median
- 7. The equation of St.line is given by 6 a) Define ABC analysis, EOQ, Ordering Cycle - 6 Marks Answer: i) ABC Analysis: • One of the widely used techniques for control of inventories is the ABC (always better control) analysis. • The objective of ABC control is to vary the expenses associated with maintaining appropriate control according to the potential savings associated with a proper level of such control. • The ABC approach is a means of categorizing inventory items in to three classes “A”, “B”, & “C”, according to the potential amount to be controlled. • A Class items: These items hold approximately 70-80% of the total cost of the machinery, whereas its usage among all items is of in between 10-20% (i.e., items consumes more % of total cost but less % of usage). Ex: Engine in automobile. Also they, ➢ Requires strict control ➢ No need to maintain safety stocks ➢ Maximum efforts required to reduce lead time ➢ Ordering of these items managed by top management • B Class items: These items hold approximately 20-30% of the total cost of the machinery, whereas it’s usage among all items is of in between 40-50% (i.e., items consumes moderate % of the total cost and also medium amount of usage). Ex: Tyres in automobile. Also they, ➢ Need to maintain low safety stocks ➢ Ordering can be done once in three months ➢ Moderate efforts required to minimize lead time ➢ To be handled by middle level management • C Class items: These items hold approximately 10-20% of the total cost of the machinery, whereas it’s usage among all items is of in between 70-80%. (i.e., items consumes less % of the total cost of the machinery but high rate of usage can be made) Ex: Nuts, bolts, screws etc. Also they, ➢ Need to maintain high safety stocks ➢ Bulk ordering can be made once in 6 months ➢ Rough estimation ➢ Can be fully delegated ii )EOQ: Economic order quantity (EOQ) is the technique which solves the problem of the materials manager. EOQ or Opt Q (Optimum Quantity) is the order size at which the total cost, comprising ordering cost plus carrying cost, is the least. Below Fig illustrates the EOQ graphically ➢ EOQ technique is highly useful in inventory management, as it answers the question how much to order ? ➢ Its use causes the sum of the two (ordering & carrying) costs to be lower.
- 8. iii) Ordering Cycle: It is the time period between two successive orders is called ordering cycle. Ordering cycle may be decided on the basis of continuous review or a periodic review of the inventory items. b) Calculate the economic lot size with uniform rate of demand and instantaneous replacement. Give total costs and total annual costs. - 6 Marks Let,
- 10. c) A stockiest has to supply 800 units per week of a product of his customers. He gets the product at Rs.75 per unit from the manufacturer. The cost of ordering and transportation from the manufacturer is Rs100 per order. The cost of carrying is 10% per year of the cost of the product. Calculate the economic lot size, time to produce the economic lot size and total optimum cost per week. - 8 Marks Solution: Given; Annual Demand D = 800 units per week = Rate of interest on carrying cost i= 10% =0.1 7. What is MRP and give the inputs required. - 4 Marks Answer:
- 11. MRP Inputs • MRP is the scientific technique for planning the quantity to be ordered, usage of materials at various levels of production & for monitoring the stocks during these transactions. b) What is ERP? - 6 Marks • ERP is a software package developed for optimum use of resources of an enterprise in a planned manner. c) A work centre operates 6 days a week on a two shifts per day basis ( 8 hours per shift). It has four machines with the same capacity. If the machines are utilized 75% of the time at a system efficiency of 90%, what is the rated output in standard hours per week? - 6 Marks Answer: Standard hours= No of working days per week No. of shifts in each day No. of working hours per shift = Actual hours utilized by machines = Standard hours per week percentage of utilization Rated output = Actual hours utilized by machines System efficiency
- 12. d) Given the structure tree shown compute the net requirements of A, B, C, D, E, F to produce 10 units of end item X. No stock is on hand. - 6 Marks X A (1) C (3) B (2) F (3) C (3) C(1) D (4) E (1) 10 units 20 units 10 units 80 units 20 units 40 units 240 units 240 units 20 units NET REQUIREMENTS= GROSS REQUIREMENTS-STOCK ON HAND A=10UNITS B=20 UNITS C= 20+240=260 UNITS D= 80 UNITS E= 40+20 = 60 UNITS F=240 UNITS F= 240 UNITS