The document is a collection of endorsements for the Zero Carbon Australia 2020 plan published by Beyond Zero Emissions. Several key points are made in the endorsements:
1) The plan shows that transitioning Australia to 100% renewable energy by 2020 is technically feasible and affordable.
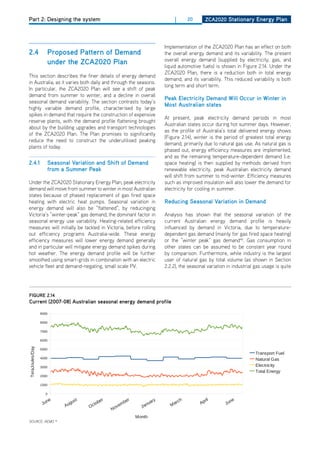
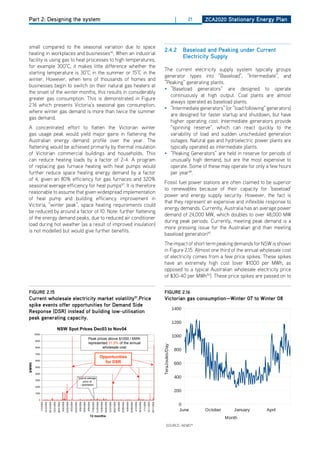
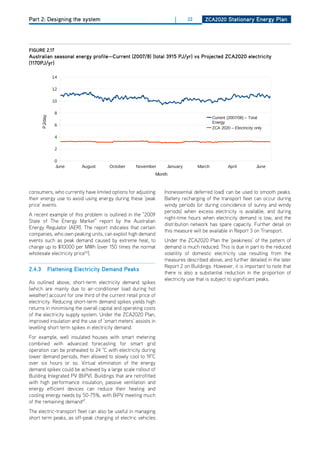
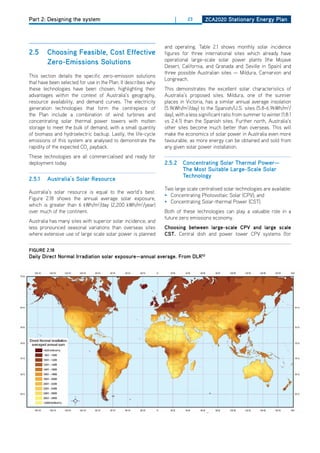
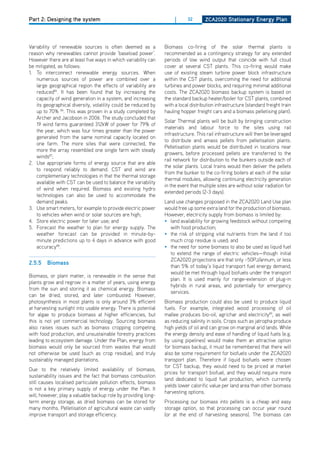
2) It provides a roadmap for how Australia can become a global leader in renewable energy given its natural resources.
3) Adopting the plan would help Australia meet its emissions reduction targets and shift to a sustainable energy future.


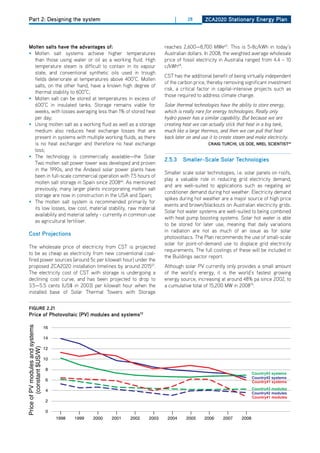
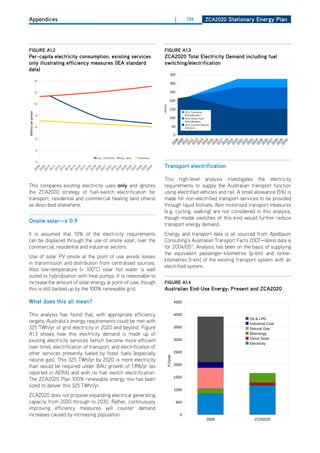
![Part 1: Introduction and overview | 2 ZCa2020 Stationary Energy Plan
the Zero Carbon australia 2020 Stationary “[t]his goal is achievable, affordable and transformative.“
u.S. viCE PrESidEnt al gorE, announCing hiS ProPoSal to
Energy Plan outlines a technically feasible,
rE-PowEr amEriCa with ClEan ElECtriCity in tEn yEarS1
practical, and economically attractive
transition to 100% renewable energy in “We know the country that harnesses the power of clean,
renewable energy will lead the 21st century”
australia in ten years. the plan is a rational u.S. PrESidEnt obama2
and necessary response to the risk of major
climate change.
1.1 why Zero Emissions?
As governments continue to grapple with the problem of
how to shift to low-carbon societies, the evidence mounts
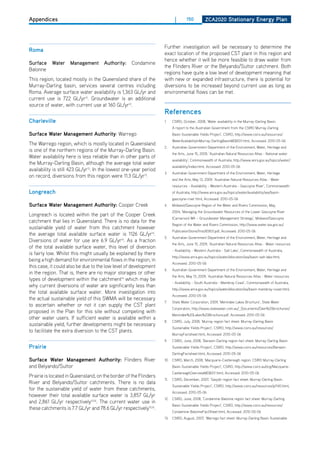
Present atmospheric levels of Co2 are at 390ppm3, well
that only a rapid transition to a zero-carbon economy can
above the pre-industrial levels of 275 to 285 ppm (Ad
ensure climate and energy security for us all. Mitigating
1000-1750)4. Furthermore, atmospheric Co2 concentration
climate change in an incremental manner ignores the
has been growing rapidly for the last 40 years [note 1].
potentially catastrophic effects we face if global warming
Many climate scientists now believe that Co2 levels must
“tipping points” are passed. Moving to a zero-carbon
be reduced from today’s concentrations to avoid triggering
economy requires concerted efforts across all national
dangerous “tipping point” mechanisms6,7 [note 2].
governments and across multiple sectors including
Stationary Energy, Transport, Building Efficiency, Industrial Tipping points are serious because once they are passed,
Processes and Land Use. a return to a normal climate situation may be impossible.
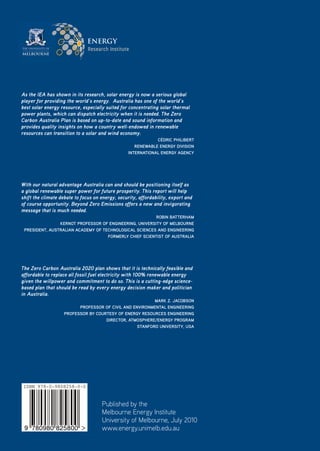
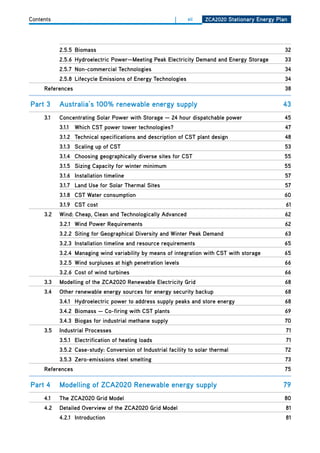
For example, if global average temperatures increase by
Many different factors shape action to mitigate climate
4°C , the huge carbon stores in the northern circumpolar
change. Societal and political barriers are quite
permafrost zone (estimated at 1,672 gigatonnes) may be
different from technical barriers. This report is aimed at
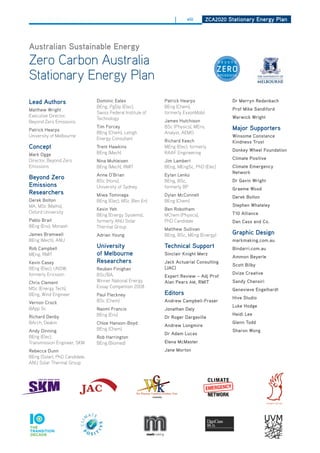
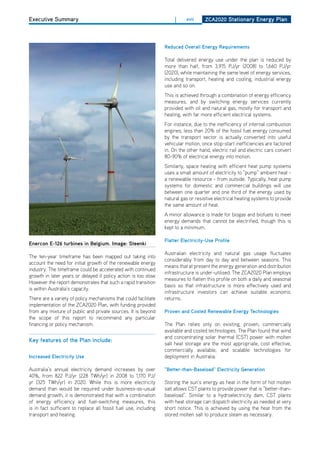
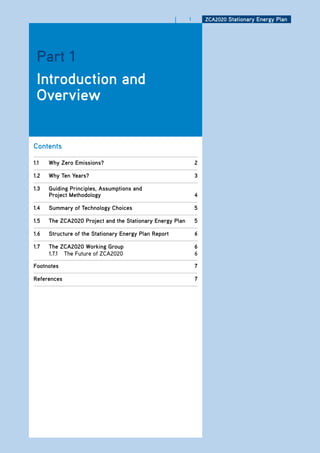
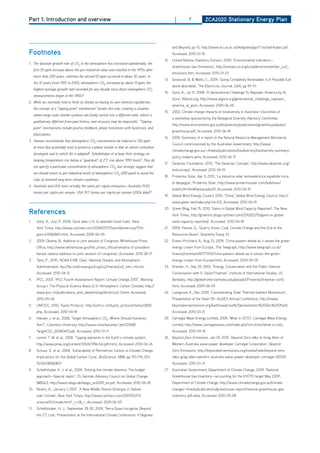
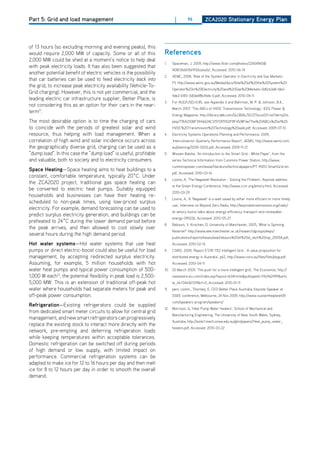
vulnerable to irreversible release8. Figure 1.1 shows that the
demonstrating the technical and financial feasibility of rolling
current rate of loss of summer arctic sea ice is exceeding
out a 100% renewable energy system in Australia over the
worst-case IPCC predictions.
next ten years. Importantly, only commercially available
technology is specified, to show that such a roll-out could Many scientists have stated that the maximum safe
start today. This report does not address the political and level of atmospheric Co2 concentration is 350 ppm or
social impediments to beginning such a Plan. It is aimed at less—a level significantly below the present atmospheric
concluding the debate about whether renewable energy has concentration of 390 ppm[note 3]. It is not too late—a rapid
the capability to keep the wheels of industry turning, in order and decisive reduction in Co2 emissions can return us to
to enable the social and political changes that will lead to the safe atmospheric levels with a reasonable probability of
transition to 100% renewable energy. The 2020 timeframe avoiding dangerous tipping points. however, this can only be
is motivated by the best available climate science. While any
delay to the roll-out of such a ten-year ‘decadal plan’ could
still see a 100% renewable sector achieved at a later date, figurE 1.1
this comes with greater risk of exceeding safe limits within arctic Sea ice Extent—observed loss versus iPCC
the Earth’s climate system. forecasts 9
This report focuses on the Stationary Energy sector in
Australia. Subsequent reports will address the other carbon 10
emitting sectors of the economy. The ZCA2020 Stationary
Energy Plan allows Australia to play a responsible,
(S ept. minimum) [millions of km2 ]
constructive and leading role in promoting decisive action 8
for climate protection around the world. For the remainder
Arctic s ea ice extent
of this document, unless otherwise defined, the ZCA2020
Stationary Energy Plan will be referred to as “the Plan” or 6
the “ZCA2020 Plan”. Obs ervations
There are a number of potential paths to a zero-emissions 4
stationary energy system. This Plan offers one possible
solution based on renewable resources, using existing
proven and reliable technologies, such that the costs and 2
liabilities of the Plan can be rigorously assessed. In this Mean and range of
IP C C models
regard, the Plan concords with an emerging view that
national scale renewable systems are not only technically 0
and economically viable, but are likely to accrue significant
benefits to the nations that first implement them. 1900 1950 2000 2050 2100
Year](https://image.slidesharecdn.com/zca2020stationaryenergyreportv1-1-100816052118-phpapp01/85/Zca2020-stationary-energy_report_v1-1-25-320.jpg)
![Part 1: Introduction and overview | 3 ZCa2020 Stationary Energy Plan
achieved through the implementation of urgent, purposeful would be that other rich countries, with the highest per-
action by governments to quickly reduce anthropogenic capita emissions, such as Australia12, would need to pursue
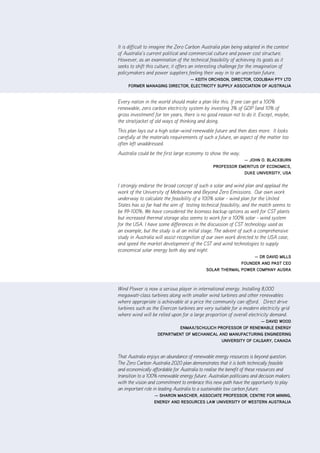
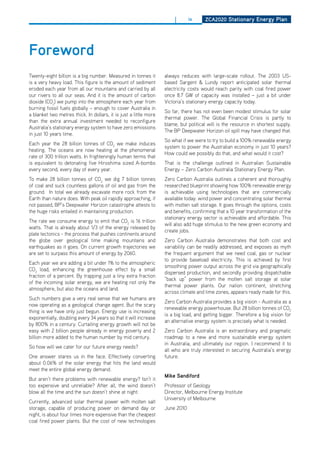
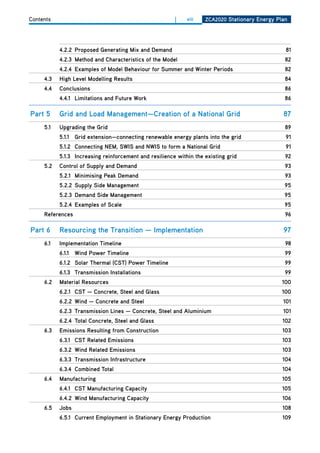
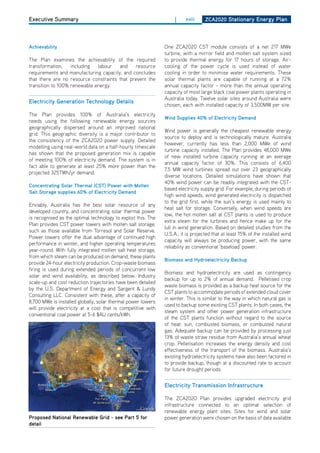
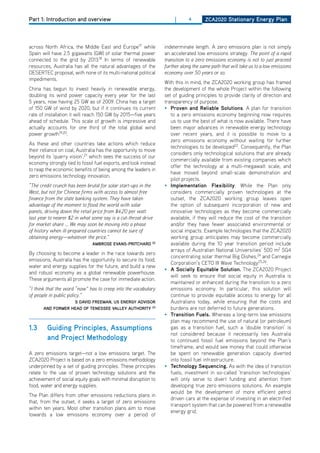
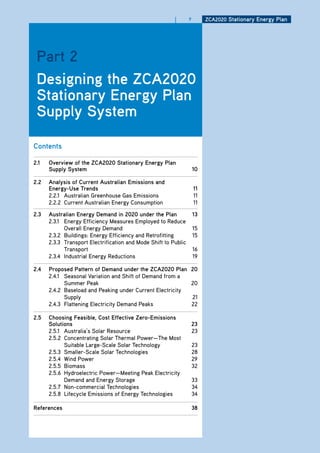
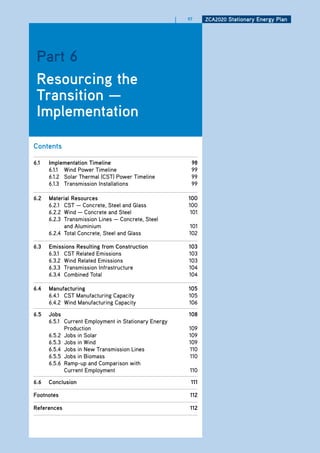
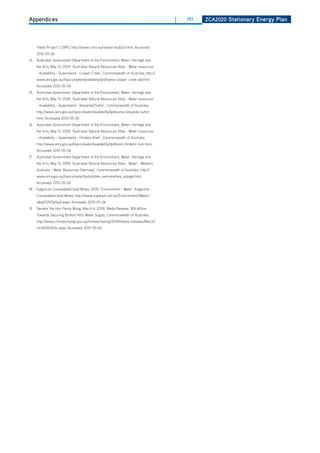
carbon emissions to zero. the same goal. As Figure 1.2 depicts, the “global budget
per-capita” (the blue block in the background) shows that
“If humanity wishes to preserve a planet similar to that on
the maximum per-capita emissions allowed across all
which civilization developed and to which life on Earth is
populations of the world would need to be limited to around
adapted .... CO2 will need to be reduced from its current 385
110 tonnes of Co2 per-capita (2.75 tonnes per-capita per
ppm to at most 350 ppm.”
annum over a period of 40 years).
hanSEn Et al, 20086
As such, countries with high per-capita emissions (such
“... any reasonably comprehensive and up-to-date look at the
as the USA or Australia [note 4]) have less than ten years
evidence makes clear that civilization has already generated
to cut their emissions to zero. At the current Australian
dangerous anthropogenic interference in the climate system.
emissions rate of about 20 tonnes per-capita per annum,
What keeps me going is my belief that there is still a chance
our emissions budget would run out in five years. If instead
of avoiding catastrophe.”
we begin 9/28/2009 emissions sooner, we could extend
reducing
John P. holdrEn, EnErgy and EnvironmEnt EXPErt
the budget to ten years. As a country with high per-capita
at harvard univErSity, PrESidEnt of thE amEriCan
emissions, Australia has the opportunity to be a catalyst
aSSoCiation for thE advanCEmEnt of SCiEnCE, and
for other countries (particularly countries with high total
PrESidEntial SCiEnCE adviSor to baraCK obama10
emissions but low per-capita emissions, such as China and
India) by inspiring action on climate change and developing
renewable energy industries.
1.2 why ten years?
A transition in ten years may seem challenging, but the
world has seen remarkably fast economic transitions in
The Plan looks not only at how to implement a zero-
the past; the restructuring of the United States economy
greenhouse gas emission energy sector, but also how to
during the Second World War is a notable example13. A ten
achieve this within a ten year timeframe, from a technical
year transformation period has also been nominated by Al
perspective. It is recognised that this is needed to properly
Gore14. In his 2008 speech calling for America to move to
address the threat of severe and potentially irreversible
100% renewable energy within ten years , Al Gore said: “To
climate change.
those who say ten years is not enough time, I respectfully
The premise of a ten year timeframe to achieve zero ask them to consider what the world’s scientists are telling
emissions echoes several leading academics and public us about the risks we face if we don’t act in ten years. Ten
figures. In a recent report from the German Advisory years is about the maximum time that we as a nation can
Council on Global Change (WBGU), Prof. hans Joachim hold a steady aim and hit our target.”14
Schellnhuber (director of the Potsdam Institute for Climate
There are many additional reasons for Australia planning
Impact Research) indicated that, in order to have a two-
immediate and deep cuts to emissions. Global warming has
in-three chance of keeping global warming below 2°C over
the potential to create irreversible ecological change, and
pre-industrial levels, and using a global per-capita carbon
Australia is at particular risk of biodiversity reduction15. With
budget approach, it would be necessary for the USA to
our agricultural and water systems also at particular risk,
reduce emissions to zero by 20209. An extension to this
climate change threatens our national security.
“Global average temperature increases of 1.5 or 2.0°C above
pre-industrial levels will likely lead to a massive loss of
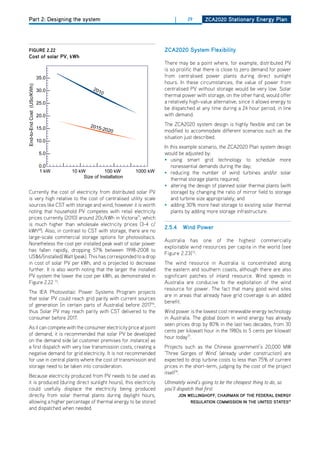
figurE 1.2
Scenario 2: Climate Compromise biodiversity worldwide. ... The more effectively the rate of
Carbon budget 2010—2050: Emissions paths per
T1 = 2010, T2 = 2050, TM = 2010, p climate change can be slowed and the sooner climate can be
capita for selected countries (adapted)11 = 2/3
stabilised, the better are the prospects that biodiversity loss
Emission paths per capita for selected countries
20
will be lessened.”
Summary of a rEPort to thE natural rESourCE
18
Germany
USA (& Australia)
managEmEnt miniStErial CounCil CommiSSionEd by thE
16
China auStralian govErnmEnt, 200916
India
14 Burkina Faso
There is widespread recognition that those who lead the
t CO2 per capita
12 Global budget per
capita assuming
constant annual
renewable energy race will reap significant economic
10 emissions
benefits. Already, several Australian renewable energy
8 technology firms have moved offshore to take advantage
6 of more supportive and forward-looking regulatory
4
environments. These include the now multi-million dollar
2
corporations Ausra (now French-owned) and Suntech (now
China-based). The dESERTEC program is pressing ahead
0
2005 2010 2015 2020 2025 2030 2035 2040 2045 2050 with plans to build a vast network of solar thermal plants](https://image.slidesharecdn.com/zca2020stationaryenergyreportv1-1-100816052118-phpapp01/85/Zca2020-stationary-energy_report_v1-1-26-320.jpg)

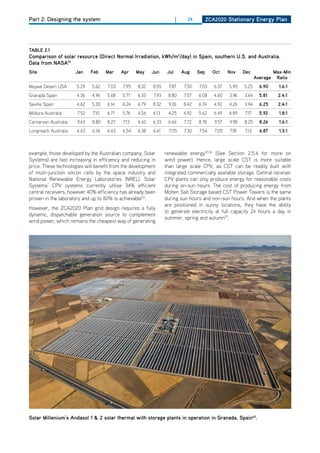
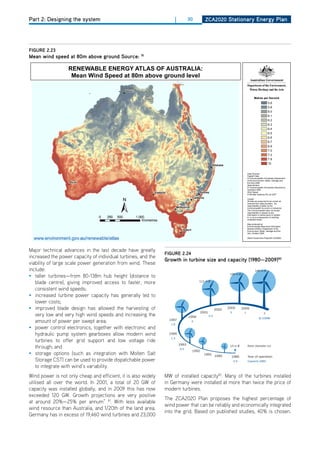
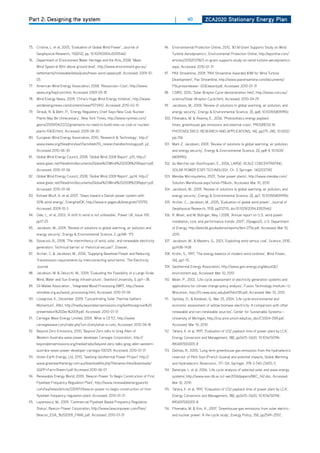

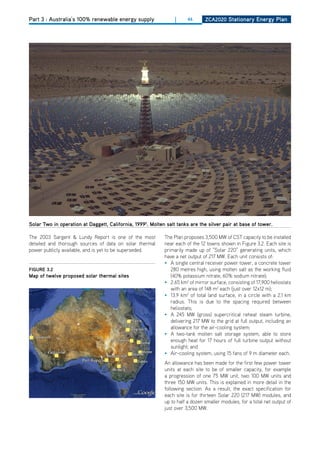
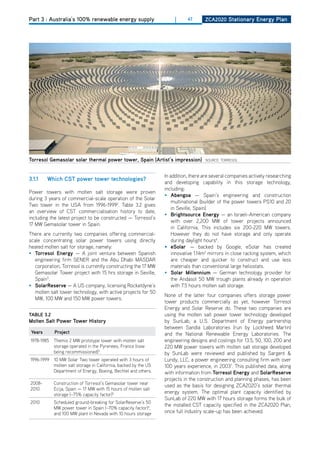
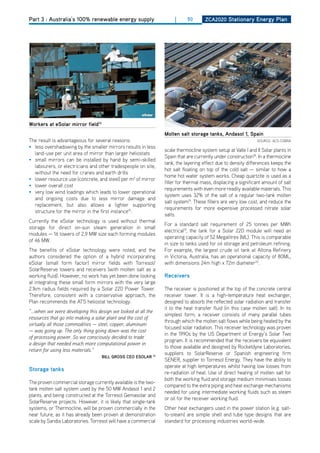
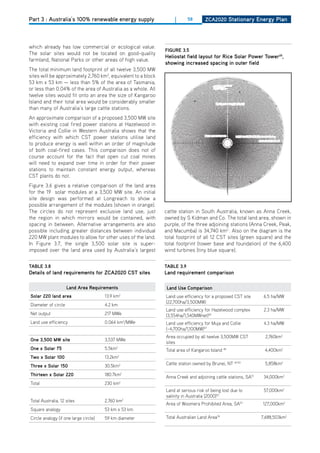
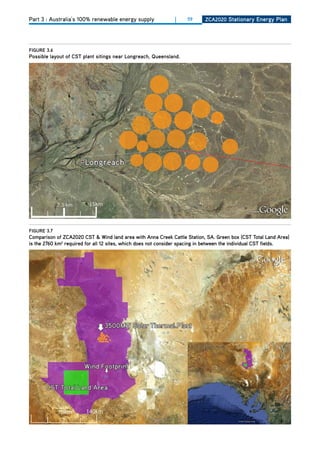
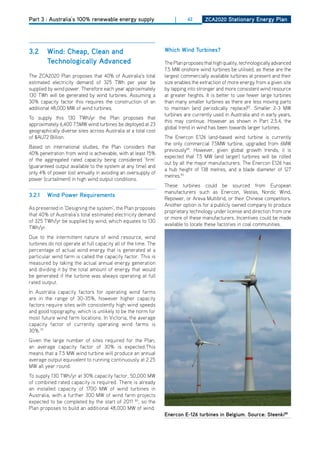
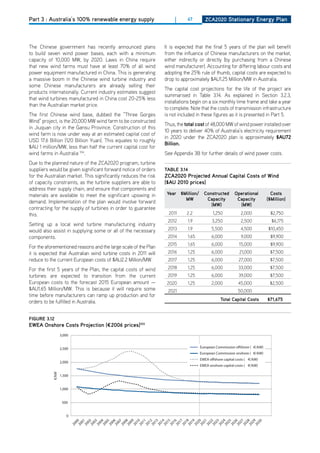
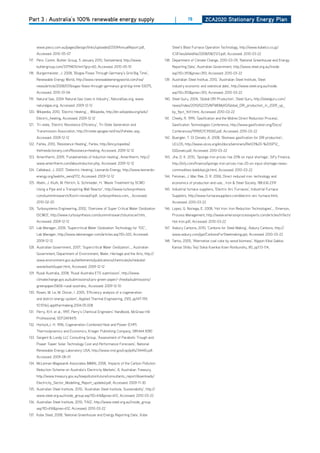
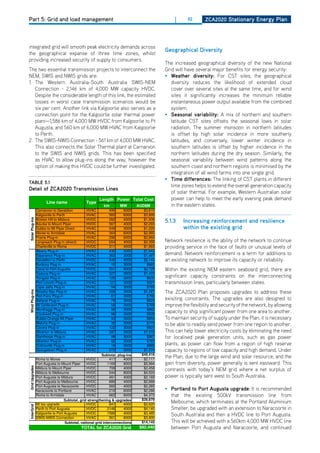
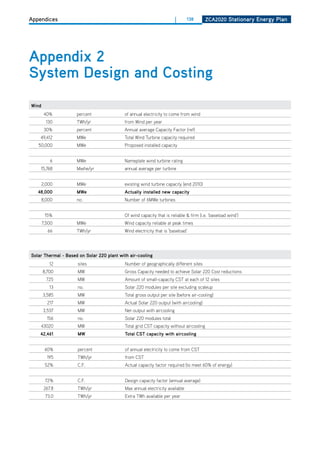
![Part 3 : Australia’s 100% renewable energy supply | 45 ZCa2020 Stationary Energy Plan
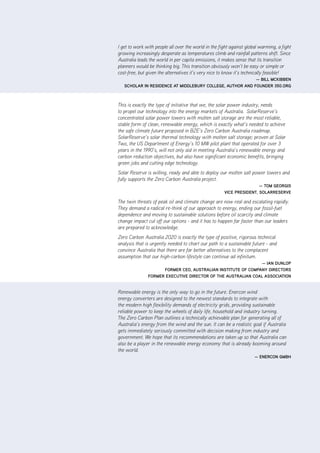
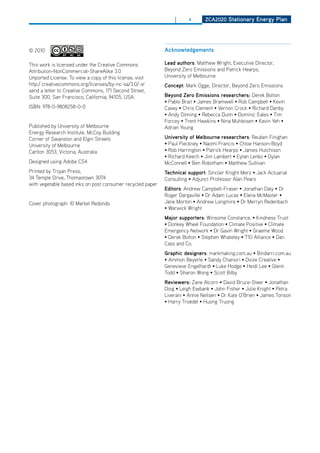
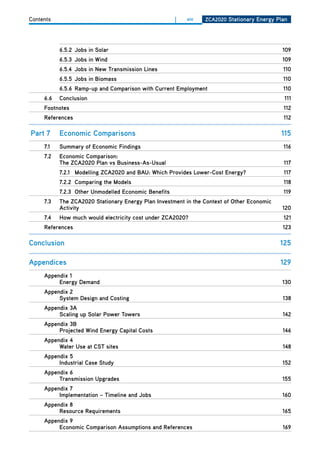
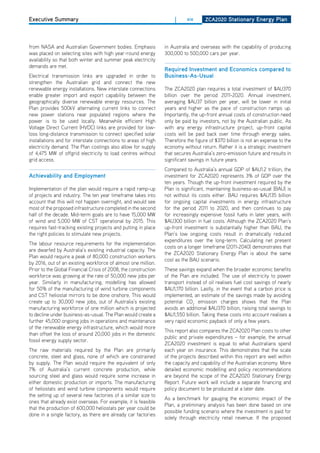
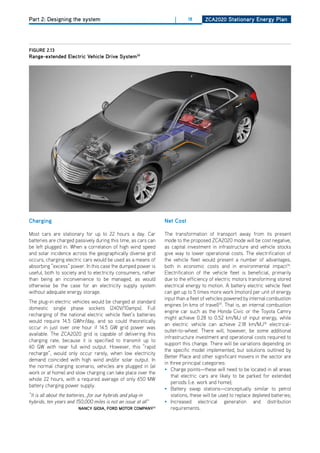
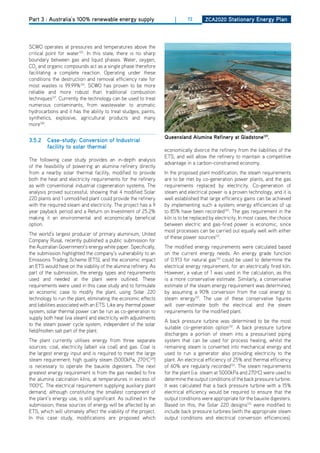
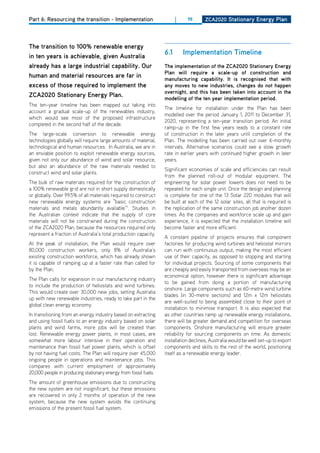
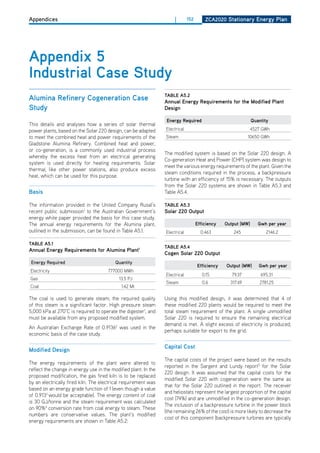
figurE 3.1
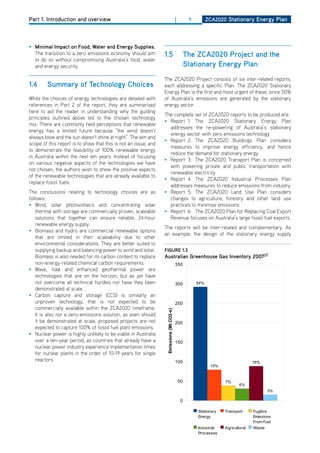
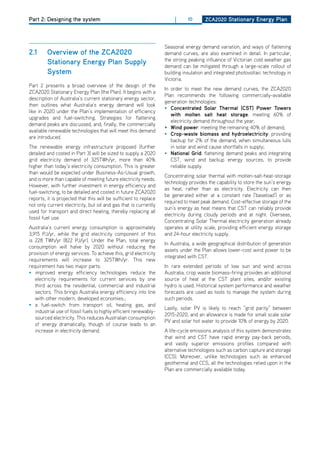
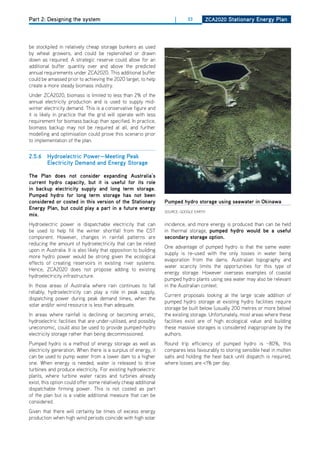
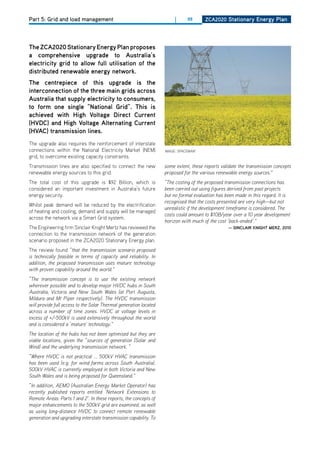
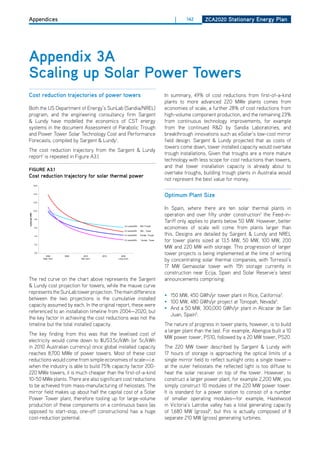
direct heating of molten salt in a power tower. dRAWING: ShARoN WoNG
flows down the tower into the hot tank (shown in red). To
3.1 Concentrating Solar Power with meet electricity demand as required, hot molten salt is taken
Storage — 24 hour dispatchable from the tank and passed through a heat exchanger to boil
water and generate steam. This flows to the steam turbine
power where the energy is used to spin an electric generator and
create the required amount of electricity. The heat energy
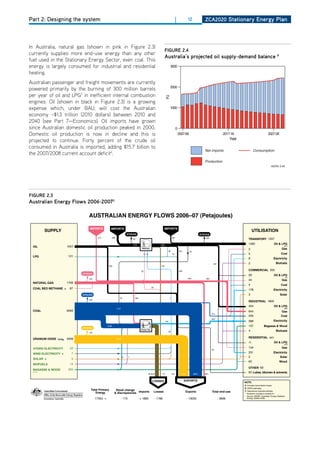
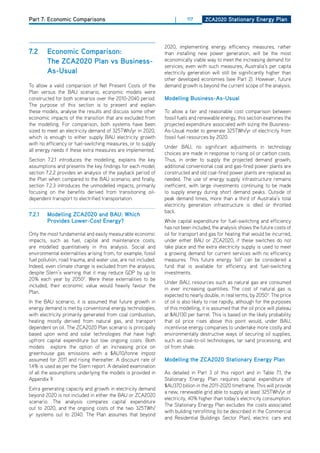
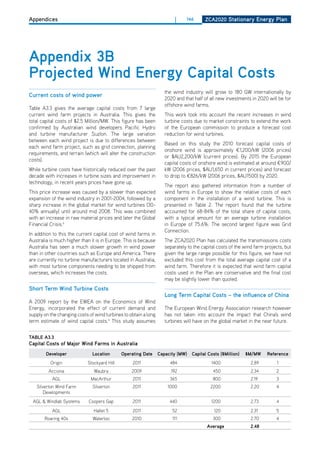
Under the ZCA 2020 plan, it is proposed that 60% of extracted from the molten salt in the exchanger cools it down
Australia’s estimated 2020 electricity usage (195 TWh/yr) be to 290°C, at which temperature it still remains molten, and
generated by large-scale, dispatchable Concentrating Solar returns to the cold tank (shown in yellow) where it awaits
Thermal Power (CST) plants with storage. Solar Power reheating again in the tower. The steam is re-condensed
Tower technology with molten salt storage is specified for to water again by dry air-cooling fans so it can be reused.
all of the CST installations. As described in Part 2.5.2, power
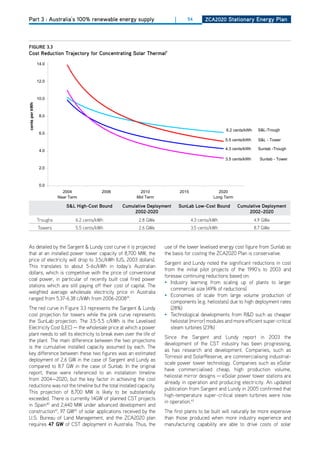
The technical specifications and costings for the CST
tower technology with molten salt as both working fluid and
plants have been referenced from the U.S. department of
storage medium is the most suitable technology.
Energy’s “SunLab” solar thermal program, a collaboration
The general principle of operation of the chosen CST Power of Sandia National Laboratories and the National Renewable
Tower technology to be used in the plan is shown in Figure Energy Laboratories. These have been published in detail
3.1. Note that for simplicity only six heliostats are depicted — in the subcontract report “Assessment of Parabolic Trough
in reality there are hundreds to thousands of heliostats for and Power Tower Solar Technology Cost and Performance
each tower. Forecasts” carried out by Sargent & Lundy Consulting
Group, LLC7.
The Sun’s rays are reflected by several thousand heliostat
tracking mirrors which follow the Sun’s path and keep “... it is S&L’s opinion that CSP [Concentrating Solar
maximum energy focused onto the central receiver located Power] technology is a proven technology for energy
on top of a central tower, which is up to 280 m high. The production, there is a potential market for CSP technology,
temperature generated in the receiver is 565-650°C, and the and that significant cost reductions are achievable assuming
received heat is transferred directly to molten salt, which reasonable deployment of CSP technologies occurs.”](https://image.slidesharecdn.com/zca2020stationaryenergyreportv1-1-100816052118-phpapp01/85/Zca2020-stationary-energy_report_v1-1-68-320.jpg)
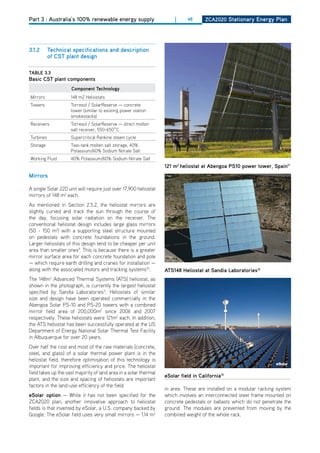
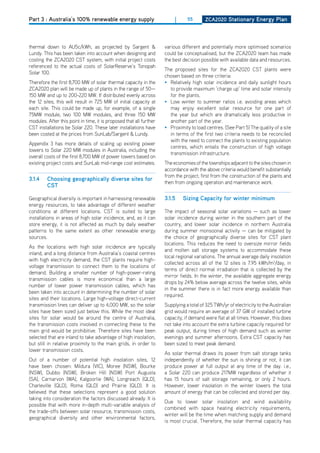
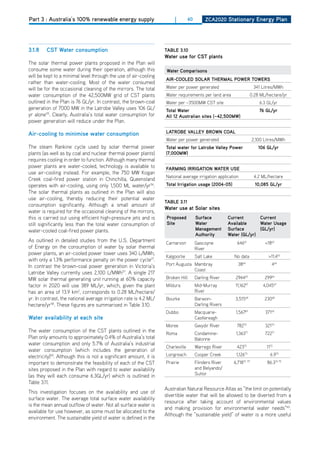
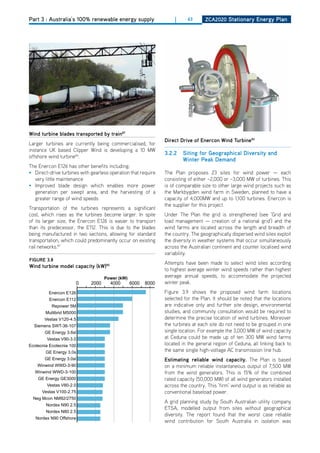
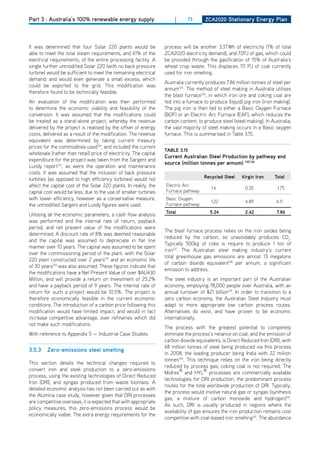
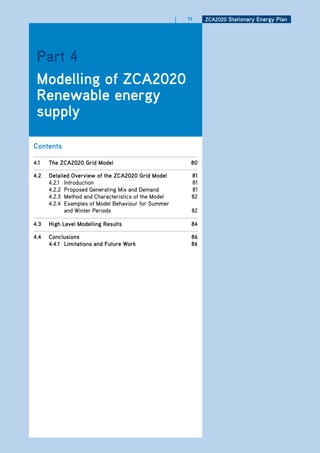
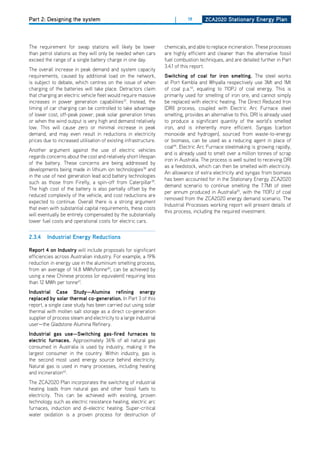
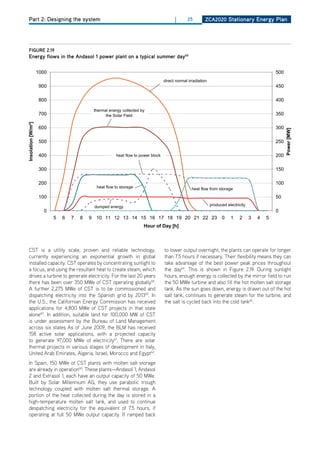
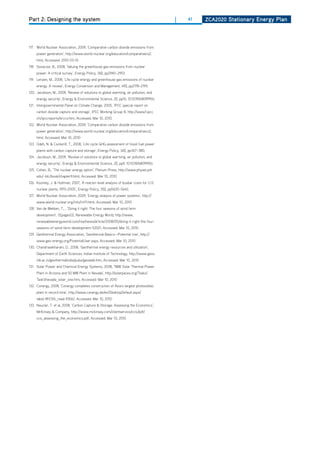
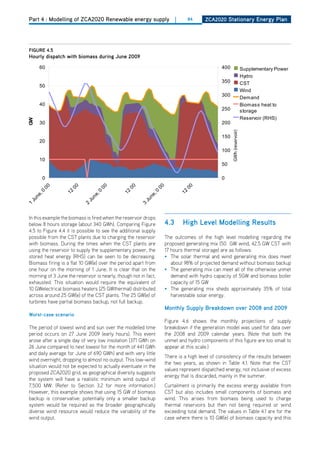
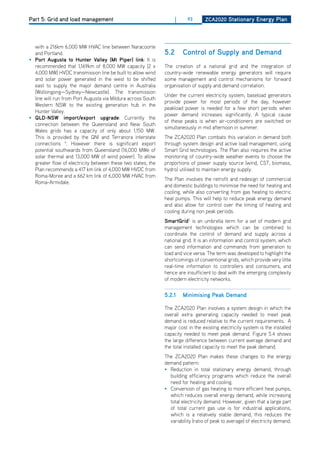
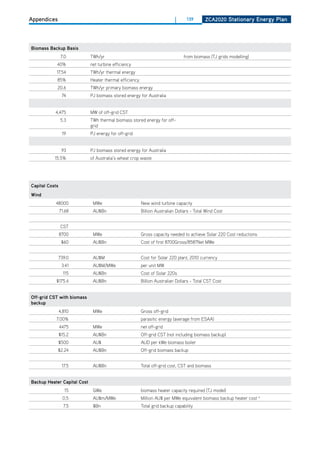
![Part 4 : Modelling of ZCA2020 Renewable energy supply | 80 ZCa2020 Stationary Energy Plan
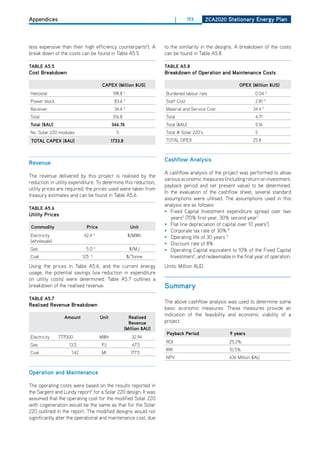
Explanatory notes for figure 4.1 and figure 4.2
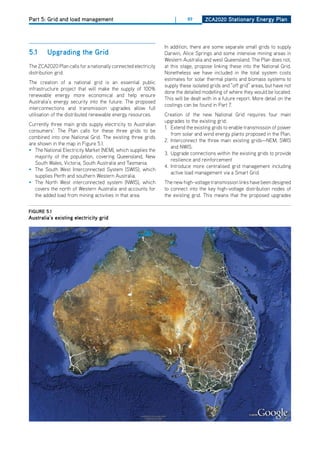
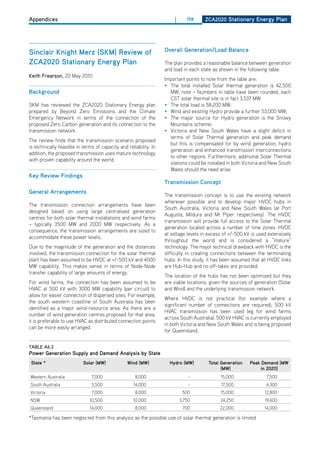
4.1 the ZCa2020 grid model
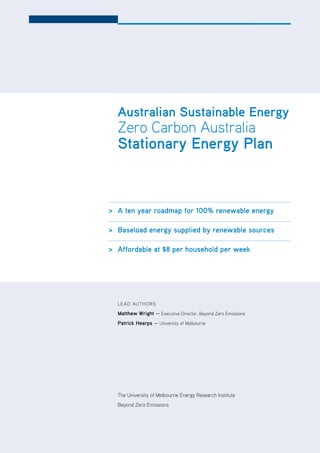
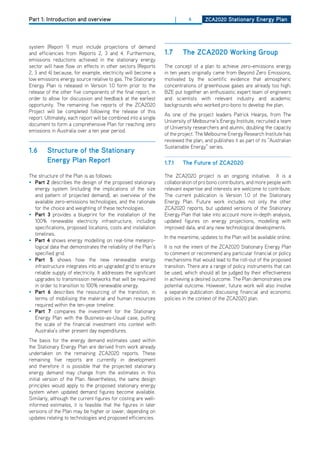
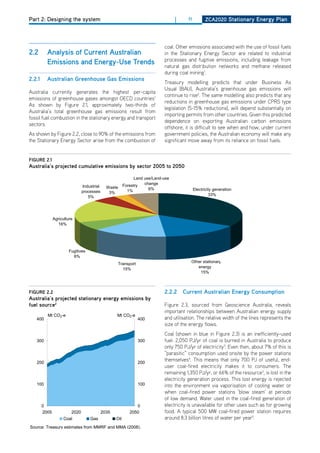
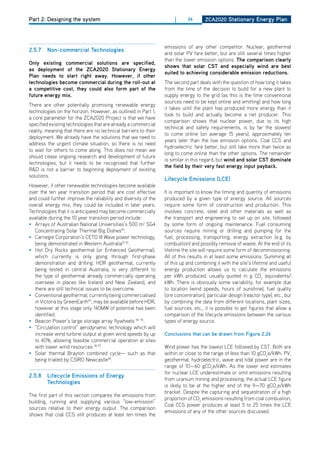
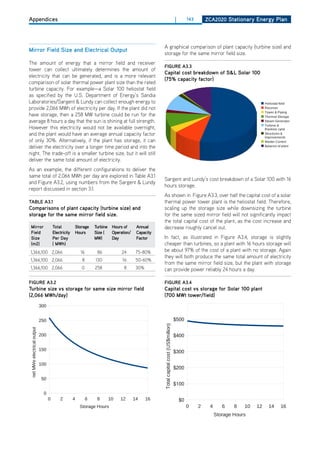
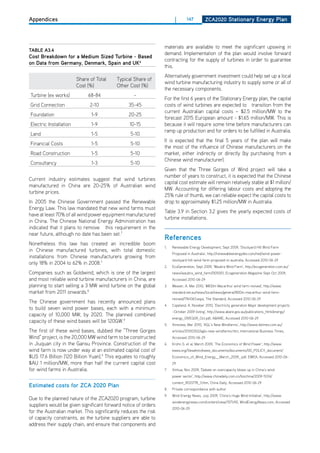
light blue, [wind] is electrical output from wind power.
In order to assist with the Stationary Energy Plan, Jack This is based on actual output from existing wind farms
Actuarial Consulting Pty Ltd (JAC) undertook to model, at across southern Australia, published by the Australian
fine time scales, the correlation of renewable resources Energy Market operator, which has been scaled to represent
(solar and wind) with demand. the 50 GW of wind power specified in the Plan. Note that
this model does not currently incorporate data from other
To confirm that the proposed system can reliably meet
regions, such as Western Australia and Queensland. As a
the projected demand, modelling has been carried out on
result, the scaled wind output data has higher variability
the proposed ZCA2020 generation mix on a half-hourly
than would be expected under the proposed system and
timescale, with data (insolation, wind and NEM demand)
occasionally drops to a lower output value than would be
from 2008 and 2009.
expected from the total number of 23 wind sites proposed.
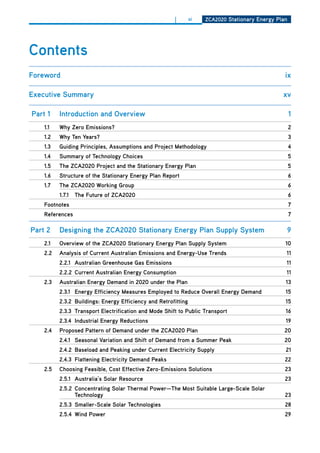
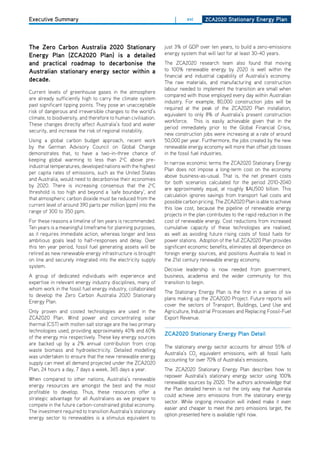
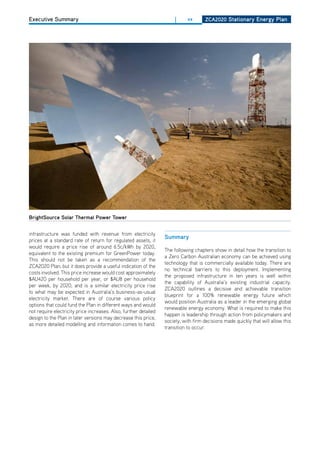
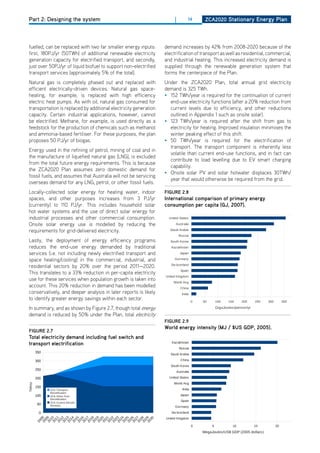
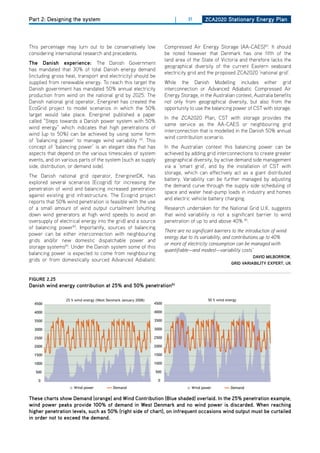
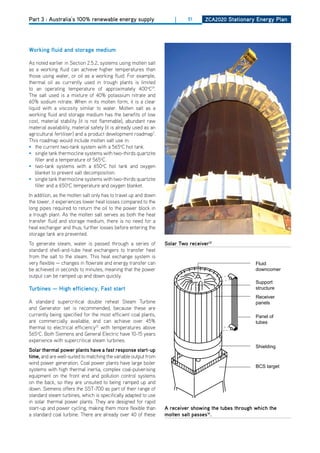
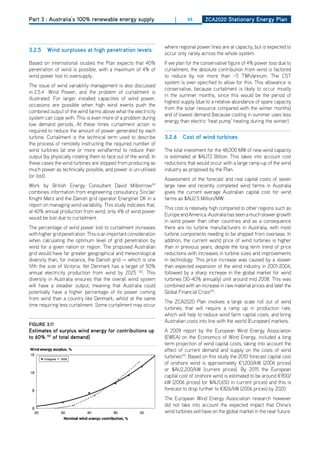
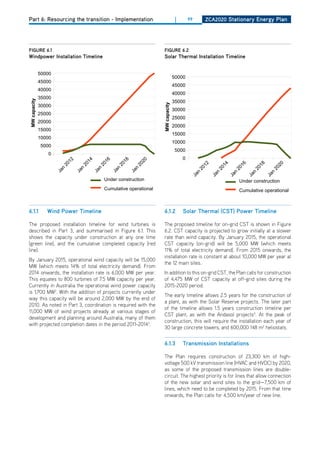
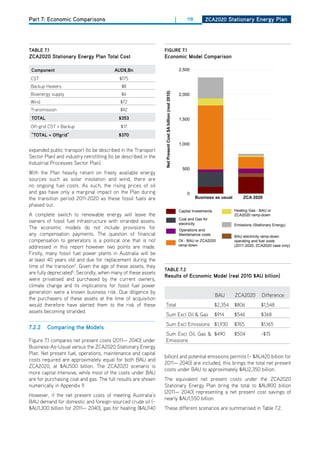
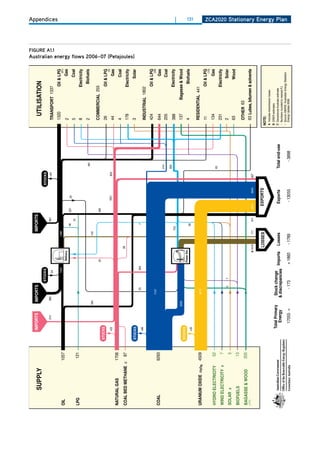
The modelling results show that the 50 GW of wind and 42.5 If, as discussed in Part 3, the geographically diverse wind
GW of concentrating solar thermal (CST) alone can meet power can be relied upon for 15% of rated capacity at all
98% of the projected electricity demand. The combination times, total wind output would not drop below 7,500 MW,
of existing hydro and biomass generation as backup at the whereas in the model it actually does drop below this figure
CST sites can meet the remaining 2% of total demand, on occasions. Therefore this modelling is conservative,
covering the few occasions where periods of low wind and compared to what could be modelled if more region-specific
extended low sun coincide. The model found that biomass data was available.
backup equivalent of 10 GW(electrical) on the CST should be
dark orange Shading, [CSt] is the electricity dispatched
sufficient to ensure reliable energy supply in most realistic
from the CST plants. This is calculated from satellite derived
low wind and sun periods, however the ZCA2020 Plan has
solar data from each of the 12 ZCA2020 sites, sourced from
allowed for 15 GWe biomass backup for conservatism.
the Australian Bureau of Meterology. The raw solar data
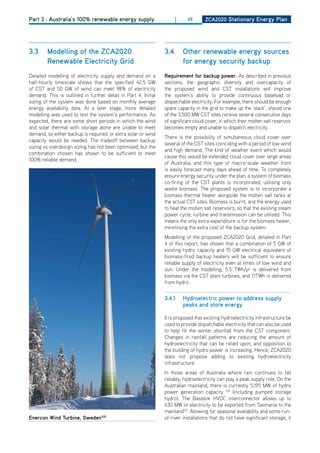
A further result of the modelling is that the ZCA2020 has been used to estimate the electrical output from the
generation mix allows for elasticity of demand with more solar thermal plants. This takes into account such values as
than 90 TWh per year of excess energy available from the the mirror field collection efficiency, steam cycle efficiency
specified renewable energy system. and other parameters. Underlying this data is the calculation
figurE 4.1
ZCa2020 grid model, 2008 (results shown in daily averages, underlying model on half-hourly data)
1,600
1,400
1,200
1,000
Excess
GWh / day
800 Biomass
Hydro
600 CST
Wind
400
200
0
08
08
08
8
08
08
8
08
08
08
8
08
l0
r0
v0
ar
b
n
n
g
p
ay
ct
c
Ju
Ap
No
Fe
Ju
Au
Ja
Se
De
O
M
M](https://image.slidesharecdn.com/zca2020stationaryenergyreportv1-1-100816052118-phpapp01/85/Zca2020-stationary-energy_report_v1-1-103-320.jpg)
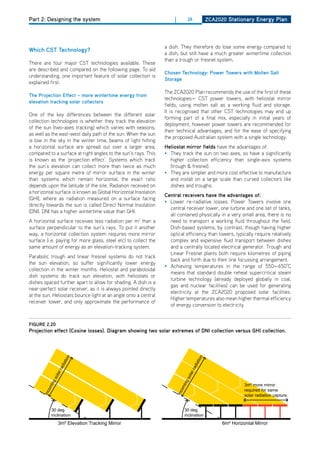
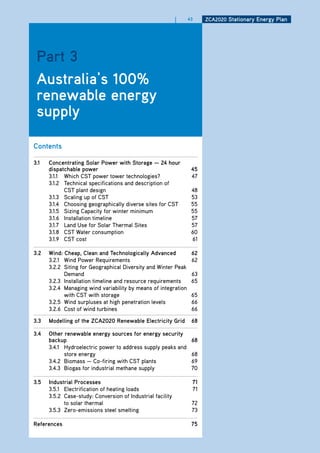
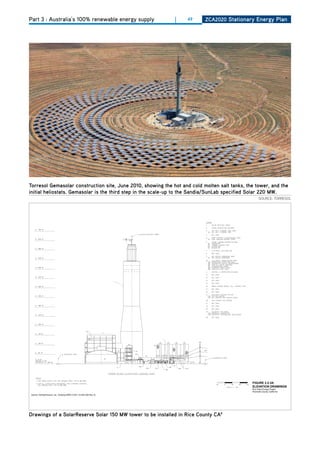
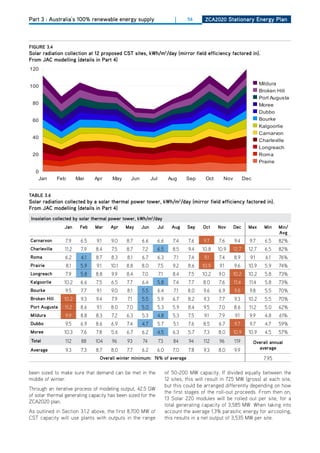
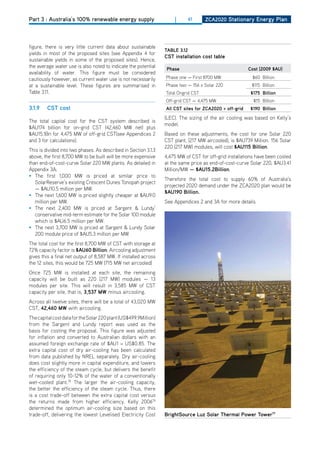
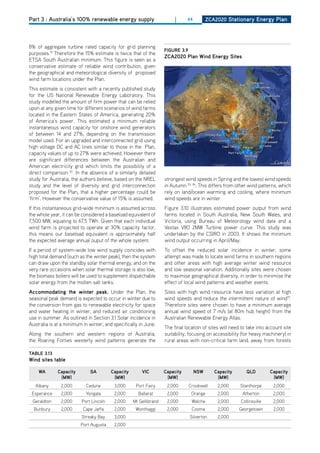
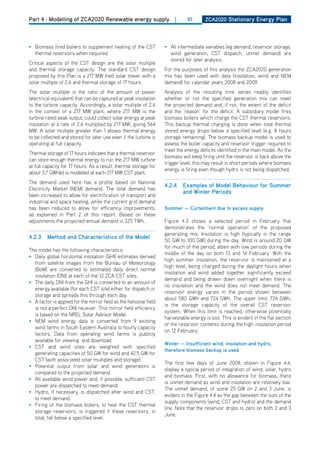
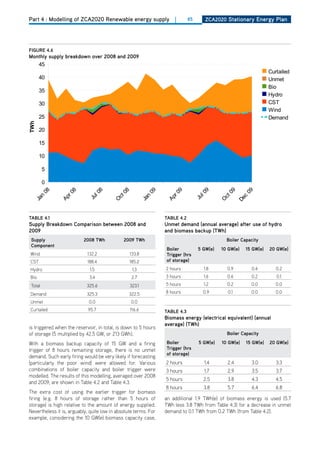
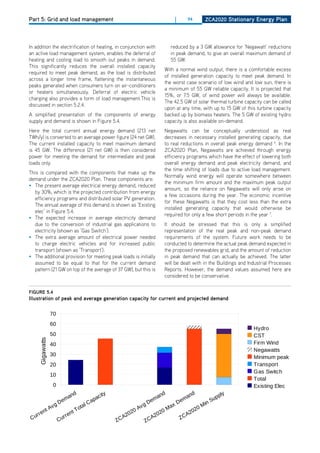
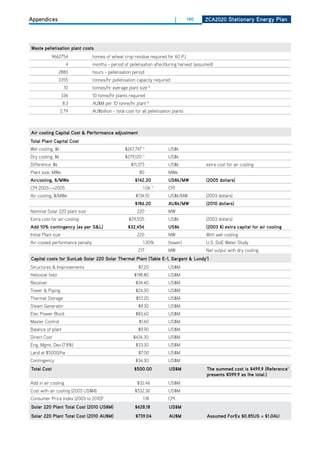
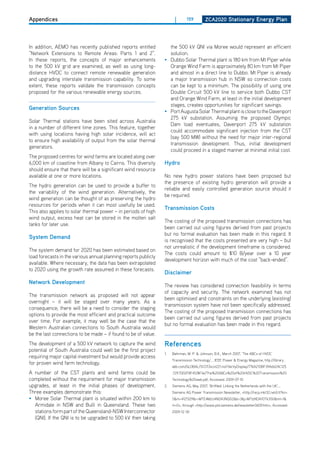
![Part 4 : Modelling of ZCA2020 Renewable energy supply | 81 ZCa2020 Stationary Energy Plan
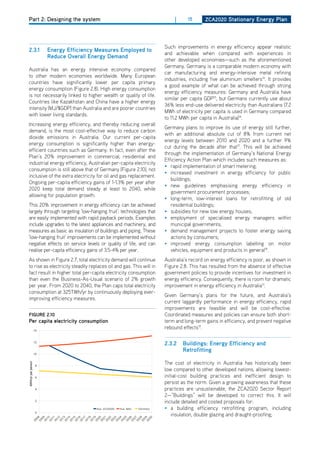
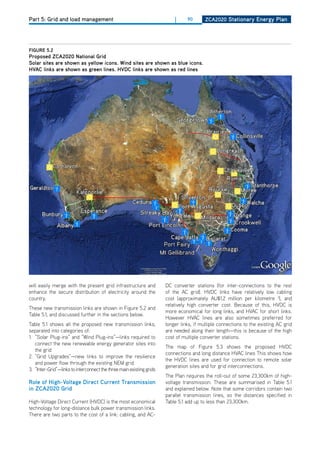
of the amount of energy sent to the heat storage tanks each
day for later dispatch. 4.2 detailed overview of the
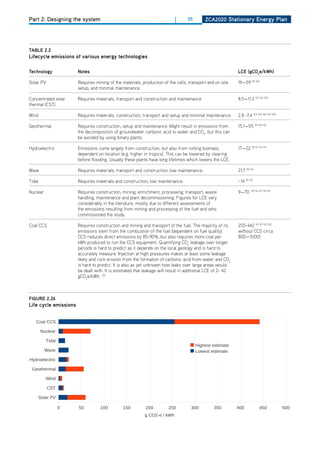
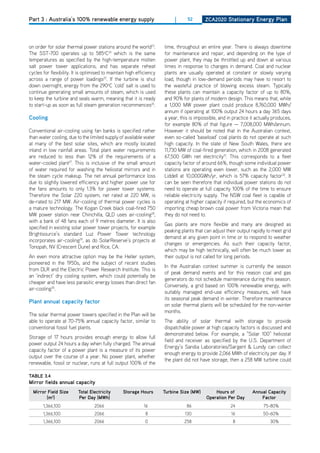
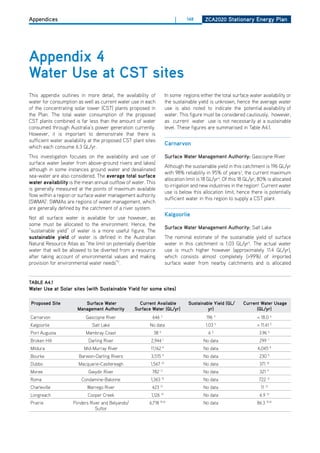
black line, [demand] projected electrical grid demand ZCa2020 grid model
based on actual data from the National Electricity Market
(NEM). This has been adjusted to take into account
4.2.1 introduction
electrification of transport and industrial and space heating.
The current baseline demand has also been reduced to
This model enables assessment, at a high level, of whether
allow for efficiency improvements. After these adjustments,
or not the proposed generation mix is a plausible means of
the demand totals 325 TWh/year.
meeting the projected demand. It uses fine time scales to
light orange Shading, [Excess] shows the excess correlate renewable energy resources (solar and wind) with
electricity that would be available from the solar sites, but is electricity demand.
not required by the demand.
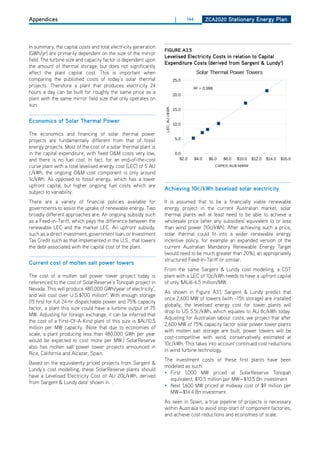
Although demand and supply have been modelled, no
dark blue Shading, [hydro] shows electricity dispatched allowance has been made for transmission constraints or
from the 5 GW of existing hydro capacity in periods of losses.
supply shortfall.
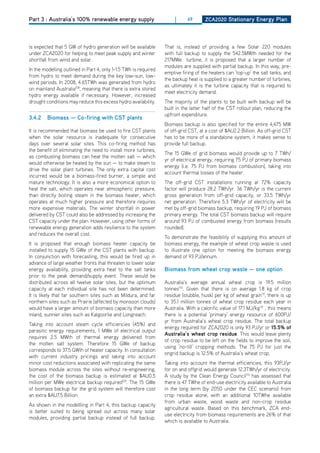
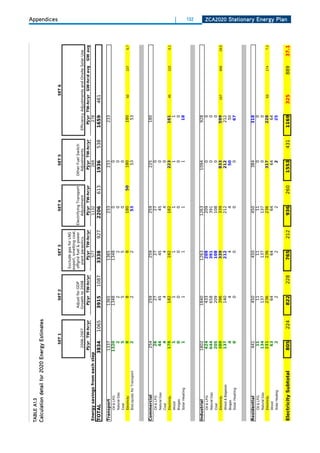
green Shading, [biomass] shows the electricity required 4.2.2 Proposed generating mix and demand
from the biomass backup system in periods of low sun and
wind availability. This is adjusted to reflect electrical output, The ZCA2020 Stationary Energy Plan proposes a stationary
though in reality the biomass system provides thermal energy sector with the following components:
energy to the heat storage tanks of the CST plants. • 325 TWh projected annual demand for grid supplied
electricity;
• 40% grid supply from 50 GW of wind generators installed
at 23 sites;
• 60% grid supply from 42.5 GW of concentrating solar
thermal (CST) power stations installed at 12 sites;
• 5 GW of hydro generation (the current mainland hydro
capacity); and
figurE 4.2
ZCa2020 grid model, 2009 (results shown in daily averages, underlying model on half-hourly data)
1,600
1,400
1,200
1,000
Excess
GWh / day
800 Biomass
Hydro
600 CST
Wind
400
200
0
09
9
09
09
09
09
09
09
09
9
09
9
r0
l0
v0
n
ar
n
b
g
p
ay
c
ct
Ju
Ap
No
Ju
Au
Ja
Fe
Se
De
O
M
M](https://image.slidesharecdn.com/zca2020stationaryenergyreportv1-1-100816052118-phpapp01/85/Zca2020-stationary-energy_report_v1-1-104-320.jpg)
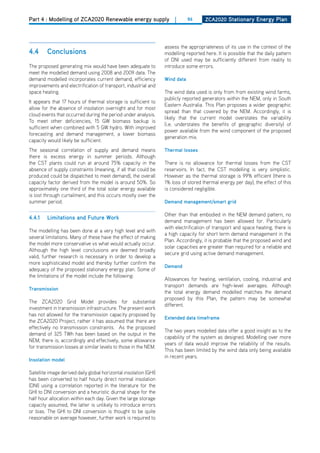
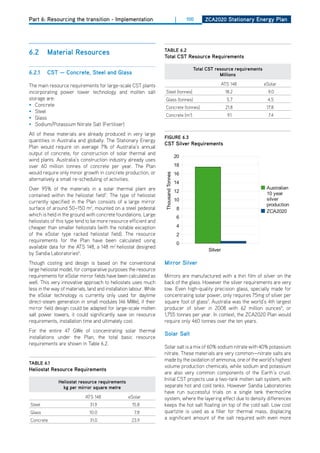
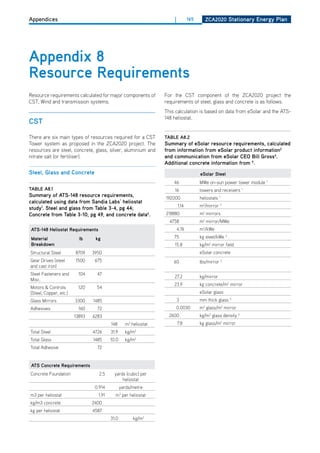
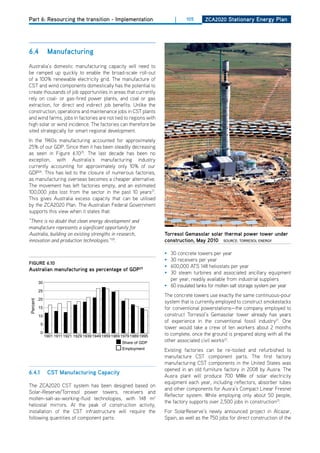
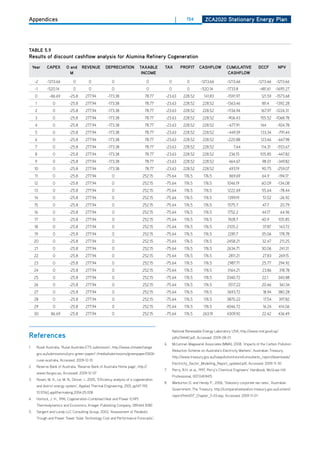
![Part 6: Resourcing the transition - Implementation | 102 ZCa2020 Stationary Energy Plan
figurE 6.5 6.2.4 total Concrete, Steel and glass
ZCa Concrete requirements
The following results show the total material resources
required for CST, Wind and Transmission lines.
Concrete
Australia currently produces 25,000,000 cubic metres
of concrete11 (60,000,000 tonnes) per year. over the 10
year period of construction, the ZCA2020 Plan requires
40,500,000 tonnes. This comprises the concrete for CST
plants, wind plants and transmission lines. This total is only
6.8% of Australia’s total concrete production over the 10
year time frame. It is therefore realistic that the required
amount of concrete could either be supplied from current
production, or by a small expansion of production capacity.
Steel
figurE 6.6
ZCa Steel requirements including Steel and ore
Australia currently produces 7,860,000 tonnes per year of
Exports
steel12. Therefore, over ten years, it is assumed that at least
78.6 million tonnes could be produced. Construction of solar
thermal, wind power plants and associated transmission
Potential Steel
from ore exports lines for the Plan requires 24.6 million tonnes of steel
(or 15.8 million tonnes if eSolar-style mirror fields were
deployed—this demonstrates the value of investing more
R&d into exploring the eSolar heliostat option). While the
Million Tonnes
Plan may appear to require a sizeable proportion (20%-
30%) of Australia’s steel production, it must be pointed out
that some of this requirement could be met by imports,
or by expanding the domestic industry. Australia exported
267 million tonnes of iron ore in 2007 alone13, which would
eventually be smelted into 183 million tonnes of steel[note 1].
When taking this ‘potential steel’ into account, it is clear that
meeting the ZCA2020 steel requirements from domestic
and international sources should not impose any significant
constraint.
glass
The amount of glass required for manufacturing heliostats
under ZCA2020 is large compared with current domestic
production. The Australian glass industry however is
figurE 6.7
relatively small, with Viridian (CSR) being the single major
CSt glass requirements including new factories
manufacturer (270,000 tonnes/year14). The required
10 quantity of 5.8 million tonnes (or 4.5 million tonnes for the
9 Potential glass eSolar heliostats) could be met from the output of two large
with new factories (300,000 tonne/yr) glass factories, similar to that recently
8
announced by glass manufacturer Saint-Gobain in India at a
7
cost of INR 10 billion, or $AU250 million15.
Million Tonnes
6
5
4
3
2
1
0](https://image.slidesharecdn.com/zca2020stationaryenergyreportv1-1-100816052118-phpapp01/85/Zca2020-stationary-energy_report_v1-1-125-320.jpg)
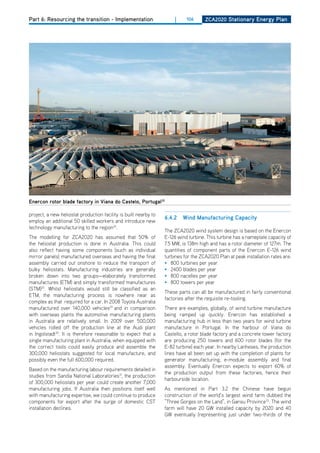
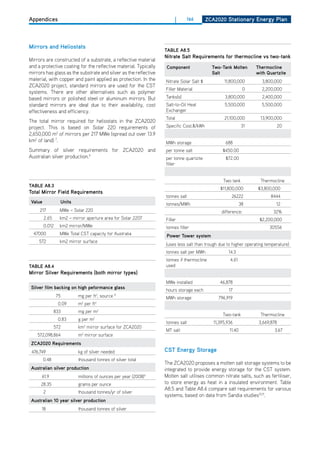
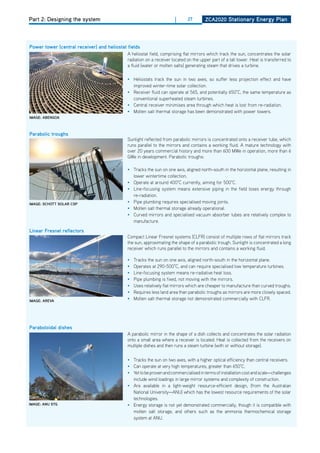
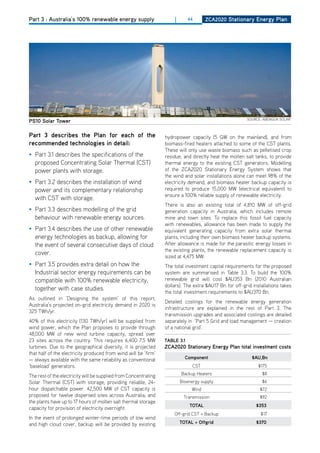
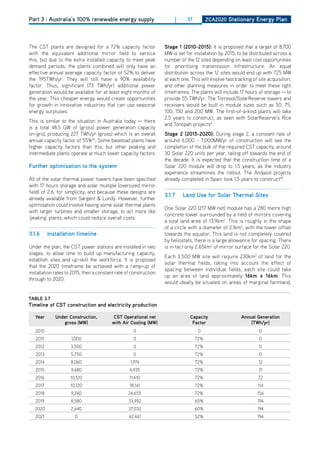
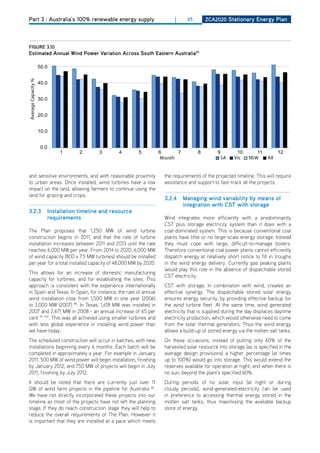
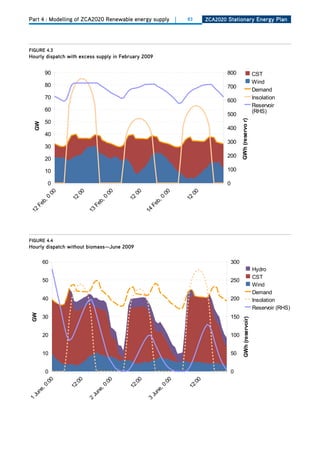
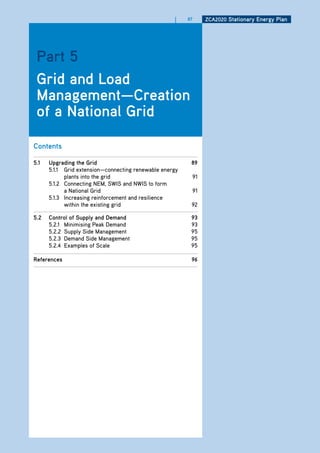
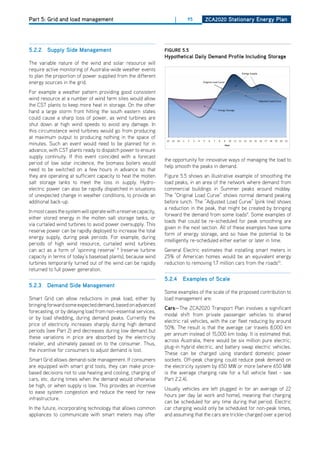
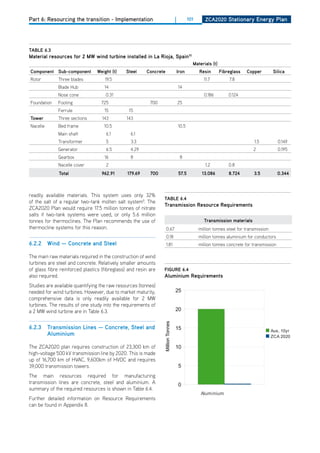
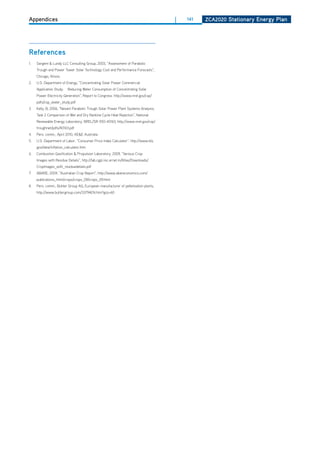
![Part 6: Resourcing the transition - Implementation | 109 ZCa2020 Stationary Energy Plan
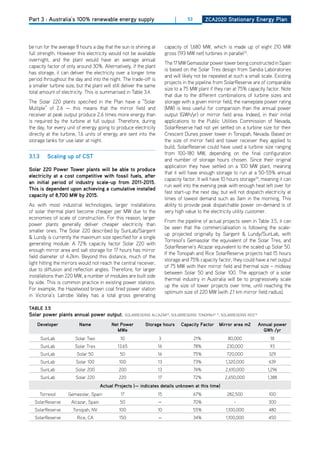
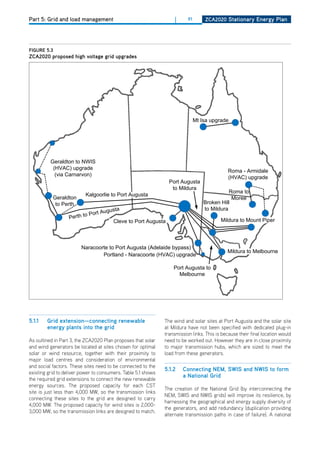
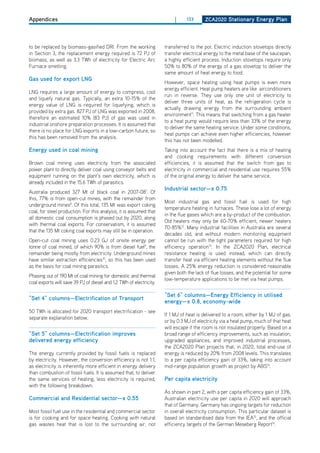
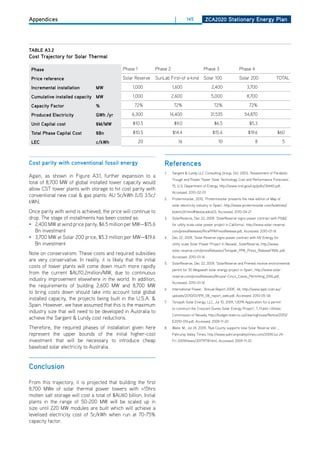
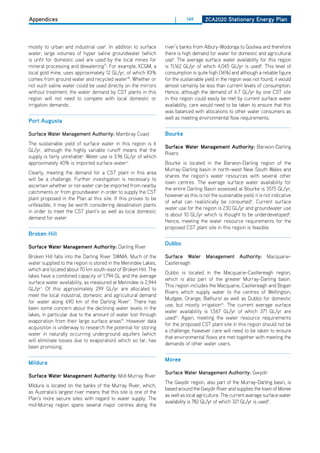
figurE 6.12 figurE 6.13
Jobs created by the ZCa2020 CSt plants. Jobs created by the ZCa2020 wind component.
100,000 60,000
No. of Jobs
80,000 40,000
No. of Jobs
60,000 20,000
40,000
0
20,000
12
14
16
18
20
20
20
20
20
20
0
n
n
n
n
n
Ja
Ja
Ja
Ja
Ja
12
14
16
18
20
Total Wind installation
20
20
20
20
20
n
n
n
n
n
Total Wind Manufacturing
Ja
Ja
Ja
Ja
Ja
Total CST installation Total Wind O&M
Total Heliostat Manufacturing
Total CST O&M
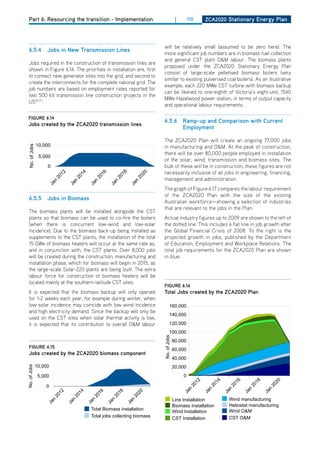
6.5.1 Current Employment in Stationary Energy 6.5.3 Jobs in wind
Production
The best wind sites in Australia are located along the
It is estimated that there are just over 20,000 people directly coast. This means that many of the wind sites chosen
employed in the production of stationary energy (electricity under ZCA2020 are situated in areas close to population
and heat) from fossil fuels currently. Most of those (just centres. during the construction phase of the ZCA2020
under 8,000) are employed in coal mining (not including wind component this will be convenient in terms of tapping
coal for export). 6,300 are directly employed in fossil- into large labour markets. Traditionally, construction and
fuel-fired power stations and around 6,100 are employed maintenance jobs in the wind sector can be very well-paid
in the extraction of natural gas for domestic purposes38,39. due to the heights at which some of the work is done.
The majority of Australia’s coal and natural gas reserves
Manufacturing of wind turbines and components is the
are extracted for export. only the people employed in
most significant source of jobs in wind power46. Assuming
the extraction of these resources for stationary energy
50% of the turbines are manufactured domestically, over
production domestically have been included in this study.
22,000 manufacturing jobs could be created by the time
the installation rate reaches 6,000 MW per year. The
6.5.2 Jobs in Solar ZCA modelling has assumed that the wind manufacturing
industry continues to grow at 1.5% p.a., as Australia begins
The construction and operation of the CST plants will to export high-quality wind turbines.
create many high-quality skilled and unskilled jobs. due
during the construction and installation phase, up to a
to the geographical diversity of the CST sites these job
further 7,000 jobs in installation will be created after the
opportunities will be dispersed throughout Australia. By
initial ramp-up to 2014, then a continuous steady rate of
coincidence many of the sites with high solar incidence
installation until completion in 2020. This matches the ramp-
where CST plants will be installed are in regions that support
up that has been achieved in other areas internationally,
a great deal of mining activity. This means that many jobs
such as Texas47,48.
lost in the mining sector can be replaced by jobs in the new
solar power industries. The construction and o&M jobs for over 17,000 permanent jobs will be created in the ongoing
CST have been based upon real-world employment figures operation and maintenance of the wind farms (see Appendix 7).
for SolarReserve’s announced molten salt power tower
Wind farms can bring a range of benefits to local
projects in Rice, CA43 and Tonopah, NV44.
communities and families. They create a significant change in
As shown in Figure 6.12, construction of the solar plants the dynamics of local towns, offering employment and more
will create around 65,000 direct jobs in the peak installation secure, steady incomes, supporting population growth instead
phase (2017), after a ramp-up of manufacturing and of decline, and allowing familities to stay together. They can
construction capacity[note 2]. help to reverse the trend of people leaving rural areas at
times of drought and hardship on the land. Many can now
Assuming that half of the heliostat manufacturing is done
enjoy a rural lifestyle without the hardships of toiling on the
in Australia, a further 7,000 jobs could be created in this
land.
industry, which can then be directed to offshore exports as
SuZlon—PowEring a grEEnEr tomorrow49
domestic demand declines [note 3]. once plants are brought
online, over 28,000 people will be employed in operation
and maintenance. This includes both grid-connected and
off-grid CST (see also Appendix 7).](https://image.slidesharecdn.com/zca2020stationaryenergyreportv1-1-100816052118-phpapp01/85/Zca2020-stationary-energy_report_v1-1-132-320.jpg)


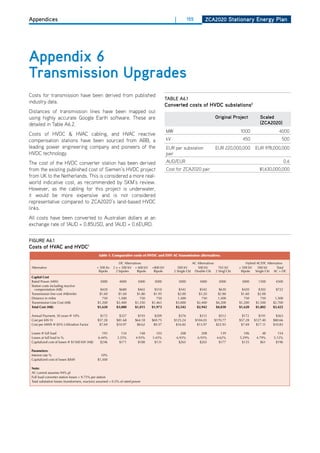
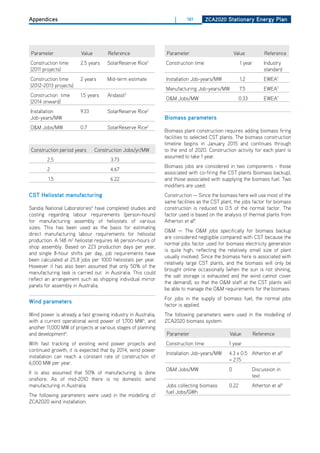
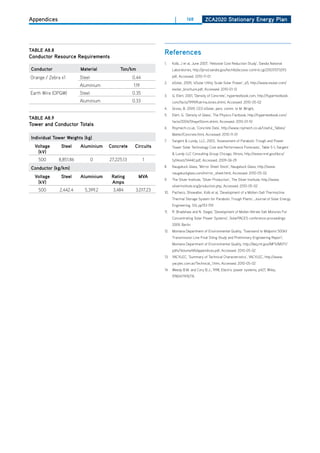
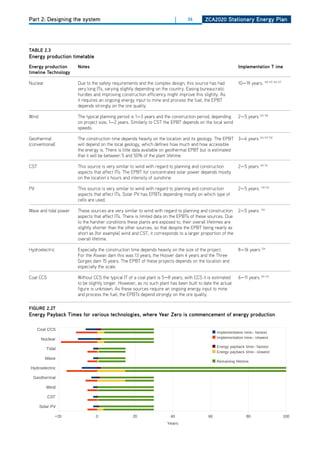
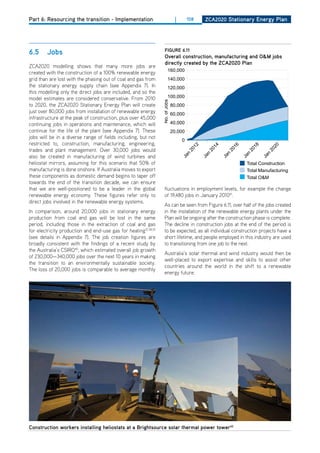
![Appendices | 160 ZCa2020 Stationary Energy Plan
appendix 7
implementation – timeline and Jobs
annual decline factors for various technologies
implementation timeline modelling
Technology Type Annual decline in Job Factors
The ten-year timeline for implementing the ZCA2020 Plan
has been modelled from January 2011 to december 2020. Coal 1.00%
The plan takes into account a ramp-up of the renewables
Gas 0.40%
industry over a number of years. This analysis is intended to
demonstrate the scale of installation that would be required Solar thermal 1.60%
to achieve the transition. It is recognised that there are social
Wind (on-shore) 1.40%
and political constraints that would need to be overcome to
allow this timeline to occur, along with fast-track planning Biomass 1.00%
approval for projects.
Solar PV 7.72%
The installation of the various components of the renewable
hydro -0.60%
energy system (wind, CST, transmission etc) have been
modelled in six monthly time intervals, to approximate a * These decline factors are based on Greenpeace’s Energy
steady stream of projects. Construction timelines vary with [R]evolution scenario which has a global (if more limited)
each particular technology. roll-out of renewable energy technologies. There are
considerable uncertainties in deciding how much these
factors would change under the ZCA2020 scenario, but
Jobs calculation methodology
they give a reasonable indication of the employment pattern
over time.
The methodology for calculating the jobs requirements is
based on similar work completed by Rutovitz and Atherton
manufacturing industry employment
analysing the rollout of renewable energy on a global scale1.
Construction jobs are calculated on the basis of the required It is assumed that as domestic demand declines towards
job-years per MW of capacity, using referenced industry the end of the construction period, we are able to continue
data. one job-year is the equivalent of one person employed manufacturing renewable equipment, and export it into the
for one year, and is considered the most relevant measure emerging international markets.
of the labour task required for construction projects. For
example, a project that requires 50 job-years to construct,
CSt parameters
could be completed in one year with 50 workers, or two
years with 25 workers.
As of 2010, there is not yet a CST industry in Australia. It
operations and Maintenance (o&M) jobs are calculated is therefore expected that it will take a number of years to
on the basis of jobs per MW of commissioned capacity. grow.
These job numbers progressively increase during the
SolarReserve currently expects a 2-2.5 year construction
project period, in line with the progressive increase in
timeline for its first CST tower plants in the USA2. The Rice
commissioned capacity.
Solar Energy Project is a tower plant that will produce over
‘decline factors’ are used to describe the way employment 450,000 MWh/yr of electricity in California. As outlined in
intensity (job-years per MW) reduces gradually over time, more detail in Appendices 3A and 3B, this is equivalent to
as skills and technology efficiency improve. This factor a 75 MW plant running at 70-75% capacity factor, as with
accounts for the projected reduction in employment per the configurations specified for ZCA2020. official project
MW of renewable and fossil fuel technologies over time, as documentation gives the labour requirements as an average
the technologies and companies become more efficient, and of 280 construction jobs over a 2.5-year construction
as economies of scale are realised. The decline factors are period, equivalent to 700 job-years – 9.33 job-years/MW, or
applied to all categories of jobs (manufacture, installation, an average of 3.73 jobs per year per MW. For later stages of
and operation and maintenance). the ZCA2020 Plan, employment for the shorter construction
timelines has been modelled as still requiring the same total
labour (job-years/MW), but with a larger number of jobs
over the period, to complete the task in a shorter timeframe.](https://image.slidesharecdn.com/zca2020stationaryenergyreportv1-1-100816052118-phpapp01/85/Zca2020-stationary-energy_report_v1-1-183-320.jpg)