Downloaded 20 times

![1.14 Maslow
17
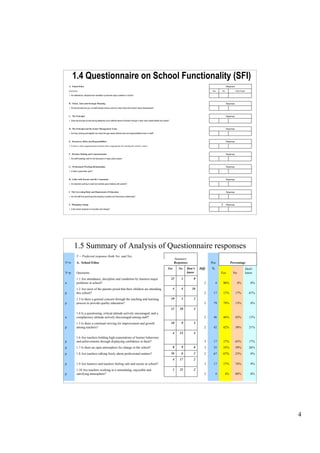
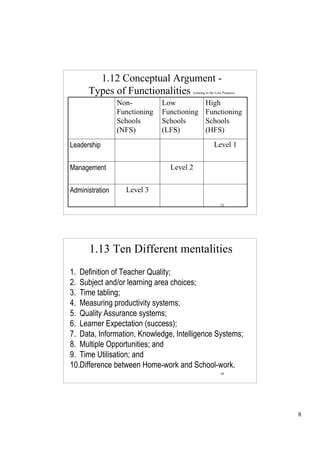
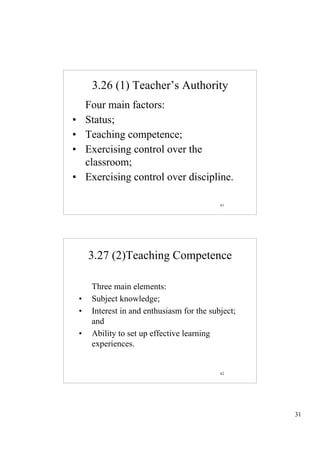
1.15 Activity 1
• Is your school Dysfunctional?
• Ten critical questions for every school leader
1. Does every teacher teach everyday in every class for 196 school days in the year? [10]
2. Do you as school leader regularly observe teachers teaching in their classrooms? [10]
3. Do you spend at least 70% of your time in school on matters of teaching and learning?
[10]
4. Do you regularly visit parents of learners in their homes? [10]
5. Is your school consistently clean, ordered and well-decorated in ways that convey
positive sentiments about the learning environment? [10]
6. Do more than 95% of learners pass the highest grade in the school every year for the
past five years? [10]
7. Do more than 98% of learners enrolled attend school everyday? [10]
8. Does every learner have a textbook in every subject? [10]
9. Does your school bring in at least R100,000 every year in external (private) funds e.g.
the business community? [10]
10. In the case of High Schools, do at least 80% of your learners go on to
university/university of technology? In the case of Primary Schools, do all your
learners go on to high school? 18
Prof. Jonathan Jansen (Executive Leadership Programme 2008)
9](https://image.slidesharecdn.com/wsoeelp1724oct2009-091014165535-phpapp01/85/WSoE-ELP-School-Functionality-9-320.jpg)

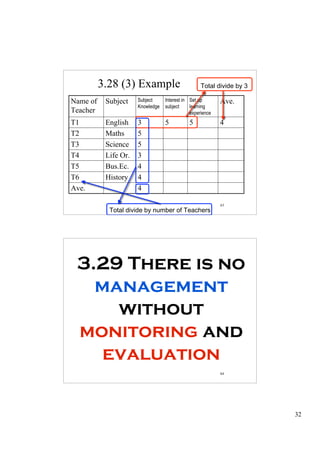
![5.6 Teacher Professional Path
1. First five to eight years (as teachers);
2. Second phase [nine to twelve years] as teacher;
3. First five to eight years (as senior teachers/mentor);
4. Second phase [nine to twelve years] as mentor;
5. First three to five years (as Head of Department);
6. First three to five years (as Deputy Principal);
7. First three to five years (as Principal);
8. Second phase [six to ten years] as Principal;
9. Third phase [eleven to twenty years +] as Principal;
10. Etc.
BT1- T5-8 T9- HoD1 HoD5 HoD9- Pr1- Pr5- Pr9- Pr13
4 12
ST1- -4
ST5-8 -8
ST9- 12
DP1-4 4
DP5 8
DP5- 12
22- 27- 4 31- 35-38 12
39-42 43-46 -8
47- 8
51- 55-58 59-62
83
26 30 34
4yrs 4yrs 4yrs 4yrs 4yrs 4yrs 50
4yrs 54
4yrs 4yrs 4yrs
5.7 Internal and external strength
84
42](https://image.slidesharecdn.com/wsoeelp1724oct2009-091014165535-phpapp01/85/WSoE-ELP-School-Functionality-42-320.jpg)

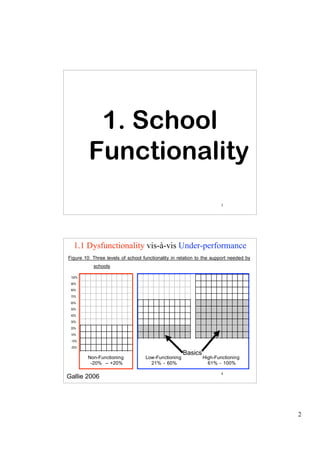
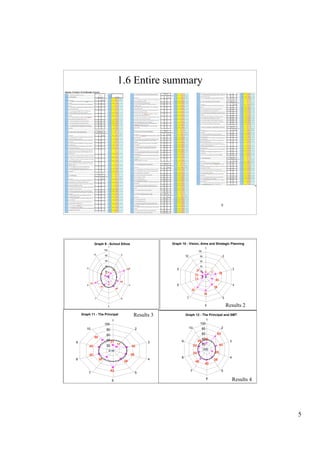
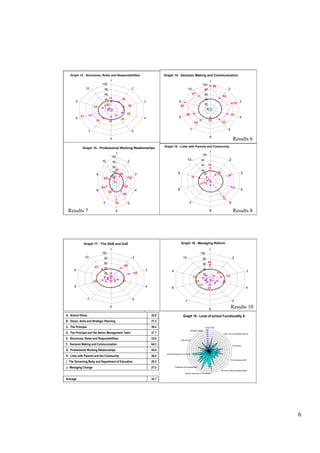
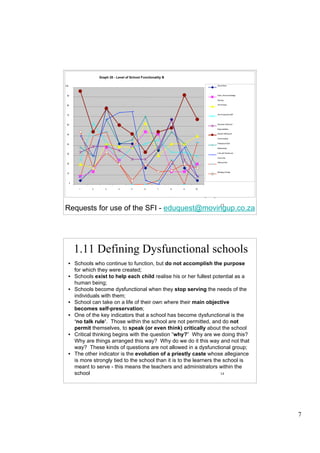
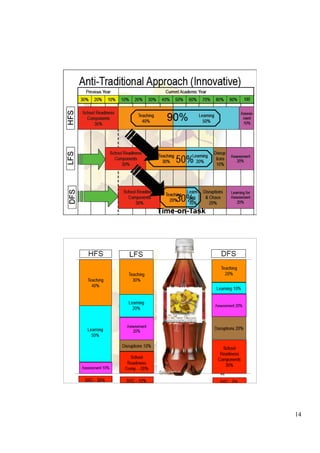
The document outlines a presentation on school functionality given by Dr. Muavia Gallie. It discusses three levels of school functionality: non-functioning, low-functioning, and high-functioning schools. It assesses school functionality based on ten factors, including school ethos, vision/aims, leadership, decision-making, relationships, and more. Schools are classified as dysfunctional below a score of 40. The presentation provides tools for analyzing a school's current functionality and identifying areas for improvement to increase its effectiveness in teaching and learning.


