Download to read offline


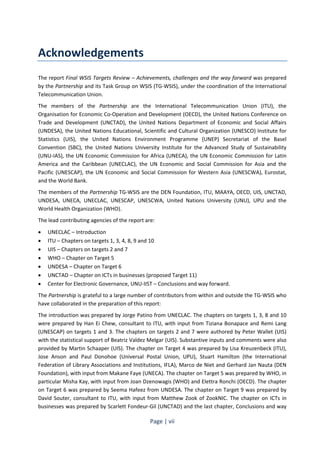


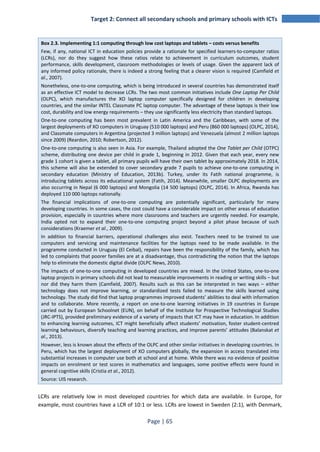


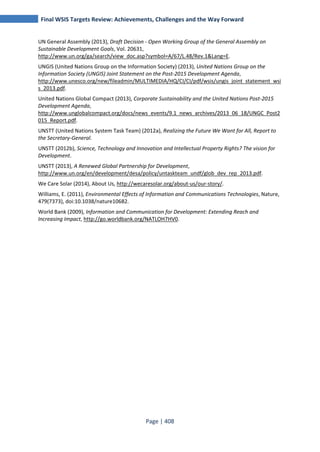
![Target 4: Connect all public libraries, museums, post offices and national archives with ICTs
Apart from a lack of globally available and comparable data on libraries and ICTs at the global level,
monitoring the subtarget is further complicated by issues concerning the definition of public libraries.
In some countries, public libraries are centrally administered while in others, the system is
decentralized. Therefore, it might not always be clear whether surveys capture all relevant public
library units. Furthermore, how a public library is defined might differ as well.9 For example, a study
conducted by the University of Washington’s TASCHA group revealed that “despite the information
in many administrative sources, the majority of public libraries in the core research countries did not
in fact meet the [study’s] definition of public access” (Sey et al., 2013).
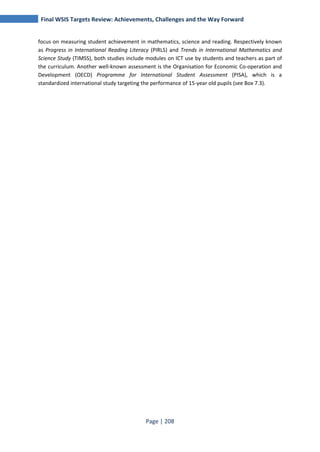
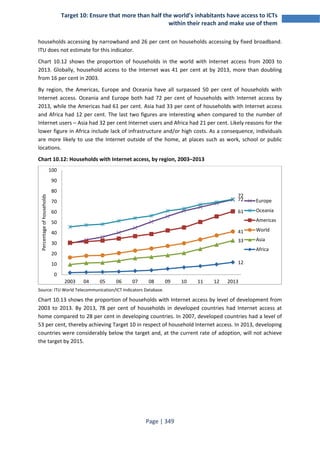
Status of the subtarget
The 2013 Partnership on Measuring ICT for Development WSIS Targets Questionnaire, 2013
(Partnership, 2013) collected information on the extent of ICT connectivity of public libraries.
However, given the very low response rate, the results do not allow for conclusions at the global or
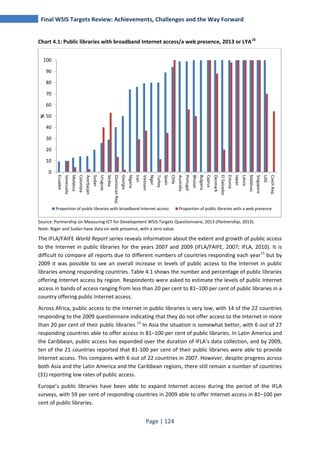
regional level. Chart 4.1 shows that in 13 out of 30 countries that provided data on the proportion of
public libraries with broadband Internet access, all (or nearly all) public libraries were connected in
2013. This includes mostly developed countries such as Denmark, Estonia, Japan and Latvia, but also
some developing countries such as Bhutan, El Salvador and the Maldives.
The proportion of public libraries with a web presence is generally much lower, with only 7 out of 26
countries reporting that all (or nearly all) of their public libraries had a web presence. In half of those
countries (13 out of 26), less than 50 per cent of the countries’ public libraries had a web presence. In
two countries, Niger and Sudan, no public library had a web presence and in Azerbaijan and Georgia
very few (under 3 per cent) public libraries had a web presence. A comparison over time regarding
the ICT connectivity of public libraries is very difficult to make, as the countries responding to the
2013 and 2009 WSIS targets questionnaires are almost completely different. Of the few countries
that responded in both years, Denmark, Latvia and Singapore already had connected all public
libraries by 2009. In the Czech Republic, the proportion of public libraries with a web presence
almost doubled from 30 per cent in 2009 to 54 per cent in 2012. Turkey also made good progress and
in 2013, 12 per cent of public libraries had a web presence, compared to only 3 per cent in 2009.
Page | 123](https://image.slidesharecdn.com/wsis2014review-141008195922-conversion-gate02/85/FINAL-WSIS-TARGETS-REVIEW-ACHIEVEMENTS-CHALLENGES-AND-THE-WAY-FORWARD-145-320.jpg)


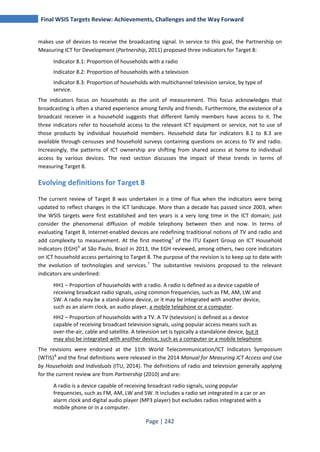


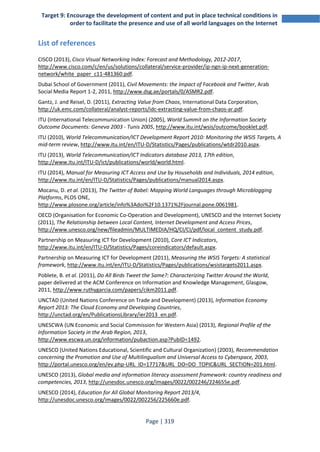


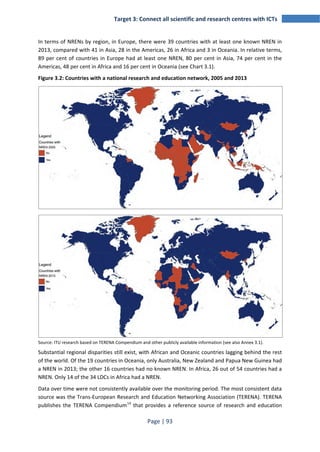
This document provides a review of achievements, challenges and recommendations regarding the 10 targets set at the World Summit on the Information Society (WSIS) in 2003 and 2005. It finds that: - Considerable progress has been made towards connecting villages, schools, research centres, libraries and other institutions, as well as ensuring access to ICTs, TV and radio for more of the world's population. - However, important gaps and challenges remain, such as reaching the most remote and marginalized communities. Measurement of many targets is also limited by a lack of consistent and comprehensive data. - Moving forward, the report recommends placing greater focus on the quality and effectiveness of ICT access and use, as well as


