Download to read offline


![Guizzo, E. (2007), How to keep 18 million people moving. Spectrum, IEEE 44.6: 32-35.
Gyaase, P. O. and Taki, A (2014), A Case for Public Financing of Broadband Internet Infrastructure in Ghana.
International Journal of Scientific Technology Research 3.1. http://www.ijstr.org/final-print/feb2014/A-
Case-For-Public-Financing-Of-Broadband-Internet-Infrastructure-In-Ghana.pdf
Hangil, J. (2014), Development of Mooring-Less Robotic Buoy System Using Wave Powered Renewable
Energy. Oceans- St. John’s. 14-19 Sept. 2014.
Harford, T. (2014), Big Data: A Big Mistake? Significance 11, no. 5.
Hauke, P., Baccelli, E., Wählisch, M., Schmidt, T. C. and Schiller J. (2014), The Role of IoT in Network
Resilience. [Research Report] RR-8552, INRIA. https://hal.inria.fr/hal-01010891v2/document
He, B. et al. (2007), Accessing the deep web. Communications of the Association for Computing Machines
(ACM), 50 (5), 94-101.
He, Y. et al. (2013), Crawling deep web entity pages. Proceedings of the sixth ACM international conference
on Web search and data mining (Rome, Italy: ACM), 355-64.
Heil, M. et al. (2012), EMPHASIS—Detection and Localization Of Illicit Bomb Factories In Urban Areas.
International Annual Conference of the Institute for Counter Terrorism.
Hidalgo, D. and Muñoz, J. C. (2014), A review of technological improvements in bus rapid transit (BRT) and
buses with high level of service (BHLS). Public Transport 6.3 (2014): 185-213.
Higginbotham, S. (2010), Sensor Networks Top Social Networks for Big Data. GigaOM Research, 13
September 2010.
Higginbotham, S. (2015), Now It’s A Whole Lot Harder To Compete With Nest. Fortune.Com: N.PAG.
Business Source Complete. Web. 22 Sept. 2015.
Hilbert, M. and López, P. (2011), The world’s technological capacity to store, communicate, and compute
information. Science 332.6025: 60-65.
Hoballah, I. (2010), Policy Measures for the Development of Telecom Sector in Lebanon.
Telecommunications Regulatory Authority, Lebanon. Beirut, Lebanon. 2010. http://www.tra.gov.lb/
library/files/uploaded%20files/trapresentations/021110%20-%20policy%20measures%20for%20the%20
development%20of%20telecom%20sector%20in%20lebanon%20-%20leaders%20in%20ict.pdf
Hornyak, T. (2015), Smartphone Beacons Power Crowdsourced Weather Forecasts. PC World. 15 June 2015.
Huang, Y. et al. (2013), Development and prospect of unmanned aerial vehicle technologies for agricultural
production management. International Journal of Agricultural and Biological Engineering 6.3: 1-10.
IDC (2011), Extracting Value from Chaos: Digital Universe Study. Hopkinton, MA: International Data
Corporation.
Intel (2013), A Vision for Big Data. Santa Clara, CA: Intel Corporation.
International Electrotechnical Commission (2014), Internet of Things: Wireless Sensor Networks. IEC White
Paper. 2014: Geneva, Switzerland.
Measuring the Information Society Report 177
Listofreferences](https://image.slidesharecdn.com/ituidireport-151130151434-lva1-app6892/75/Itu-idi-report-193-2048.jpg)


![Superintendencia de Telecomunicaciones, Costa Rica (2015), Estadísticas del Sector de Telecomunicaciones.
Costa Rica. Informe 2014. http://estadisticastelecom.sutel.go.cr
Sutherland, E. (2010), International Mobile Roaming: Competition, Economics and Regulation, 31 May
2010. http://ssrn.com/abstract=1622759 or http://dx.doi.org/10.2139/ssrn.1622759
Taveira Pinto, G. M. (2014), The Internet on Wheels and Hitachi Ltd. Santa Clara, CA: Hitachi Data Systems.
Tender, L. M. et al. (2008), The First Demonstration of a Microbial Fuel Cell as a Viable Power Supply:
Powering a Meteorological Buoy. Journal of Power Sources 179.2 (2008): 571-75.
Tilley, A. (2015), How Google’s Nest Will Make Residential Solar ‘Smarter’. Forbes.Com (2015): 11. Business
Source Complete. Web. 22 Sept. 2015.
Tilman, D. et al. (2002), Agricultural sustainability and intensive production practices. Nature 418.6898:
671-677.
TRA, Lebanon (2011), Mobile Broadband, DSL International Bandwidth Prices [press release]. http://
www.tra.gov.lb/library/files/uploaded%20files/trapresentations/20111104%20-%20tra%20press%20
conference%20-%203g%20mobile%20broadband%20%20dsl%20and%20international%20bandwidth%20
prices%20-%20mr.%20patrick%20eid.pdf
Trappeniers, L. et al. (2013), The Internet of Things: The Next Technological Revolution. Computer 46, no. 2
(2013).
Turner, V. et al. (2014), The Digital Universe of Opportunities: Rich Data and the Increasing Value of the
Internet of Things. Framingham, MA: International Data Corporation, White Paper, IDC_1672.
UN Global Pulse (2014), Big Data Climate Challenge Winners Announced. 2 September 2014. http://www.
unglobalpulse.org/big-data-climate-challenge-winners-announced
UN Global Pulse (2015), Data Visualisation and Interactive Mapping to Support Response to Disease
Outbreak. Global Pulse Project Series no. 21. http://www.unglobalpulse.org/mapping-infectious-diseases
UNCTAD (2015), Implementing WSIS Outcomes: a ten-year review. http://unctad.org/en/
PublicationsLibrary/dtlstict2015d3_en.pdf
UNESCAP (2014), An In-Depth Study of Broadband Infrastructure in North and Central Asia. http://www.
unescap.org/sites/default/files/Broadband%20Infrastructure%20in%20North%20and%20Central%20
Asia%20FINAL%20_English_0.pdf
UNESCO (2014), Islands of the Future: Building resilience in a changing world. 19.
United Nations (2014), World Urbanization Prospects. New York: United Nations Department of Economic
and Social Affairs.
United Nations (2015), Transforming our world: the 2030 Agenda for Sustainable Development, adopted at
the 70th session of the United Nations General Assembly, 2015. http://www.un.org/ga/search/view_doc.
asp?symbol=A/70/L.1Lang=E
Vermesan, O., Friess, P., Guillemin, P., Gusmeroli, S., Sundmaeker, H., Bassi, A., Soler Jubert, I., Mazura,
Mark Harrison, M. and Eisenhauer, M. (2011), Internet of Things Strategic Research Roadmap. Vermesan,
O., Friess, P., Guillemin, P., Gusmeroli, S., Sundmaeker, H. and Bassi, A. et al. (2011), Internet of Things:
Global Technological and Societal Trends 1: 11.
184 Measuring the Information Society Report](https://image.slidesharecdn.com/ituidireport-151130151434-lva1-app6892/75/Itu-idi-report-200-2048.jpg)


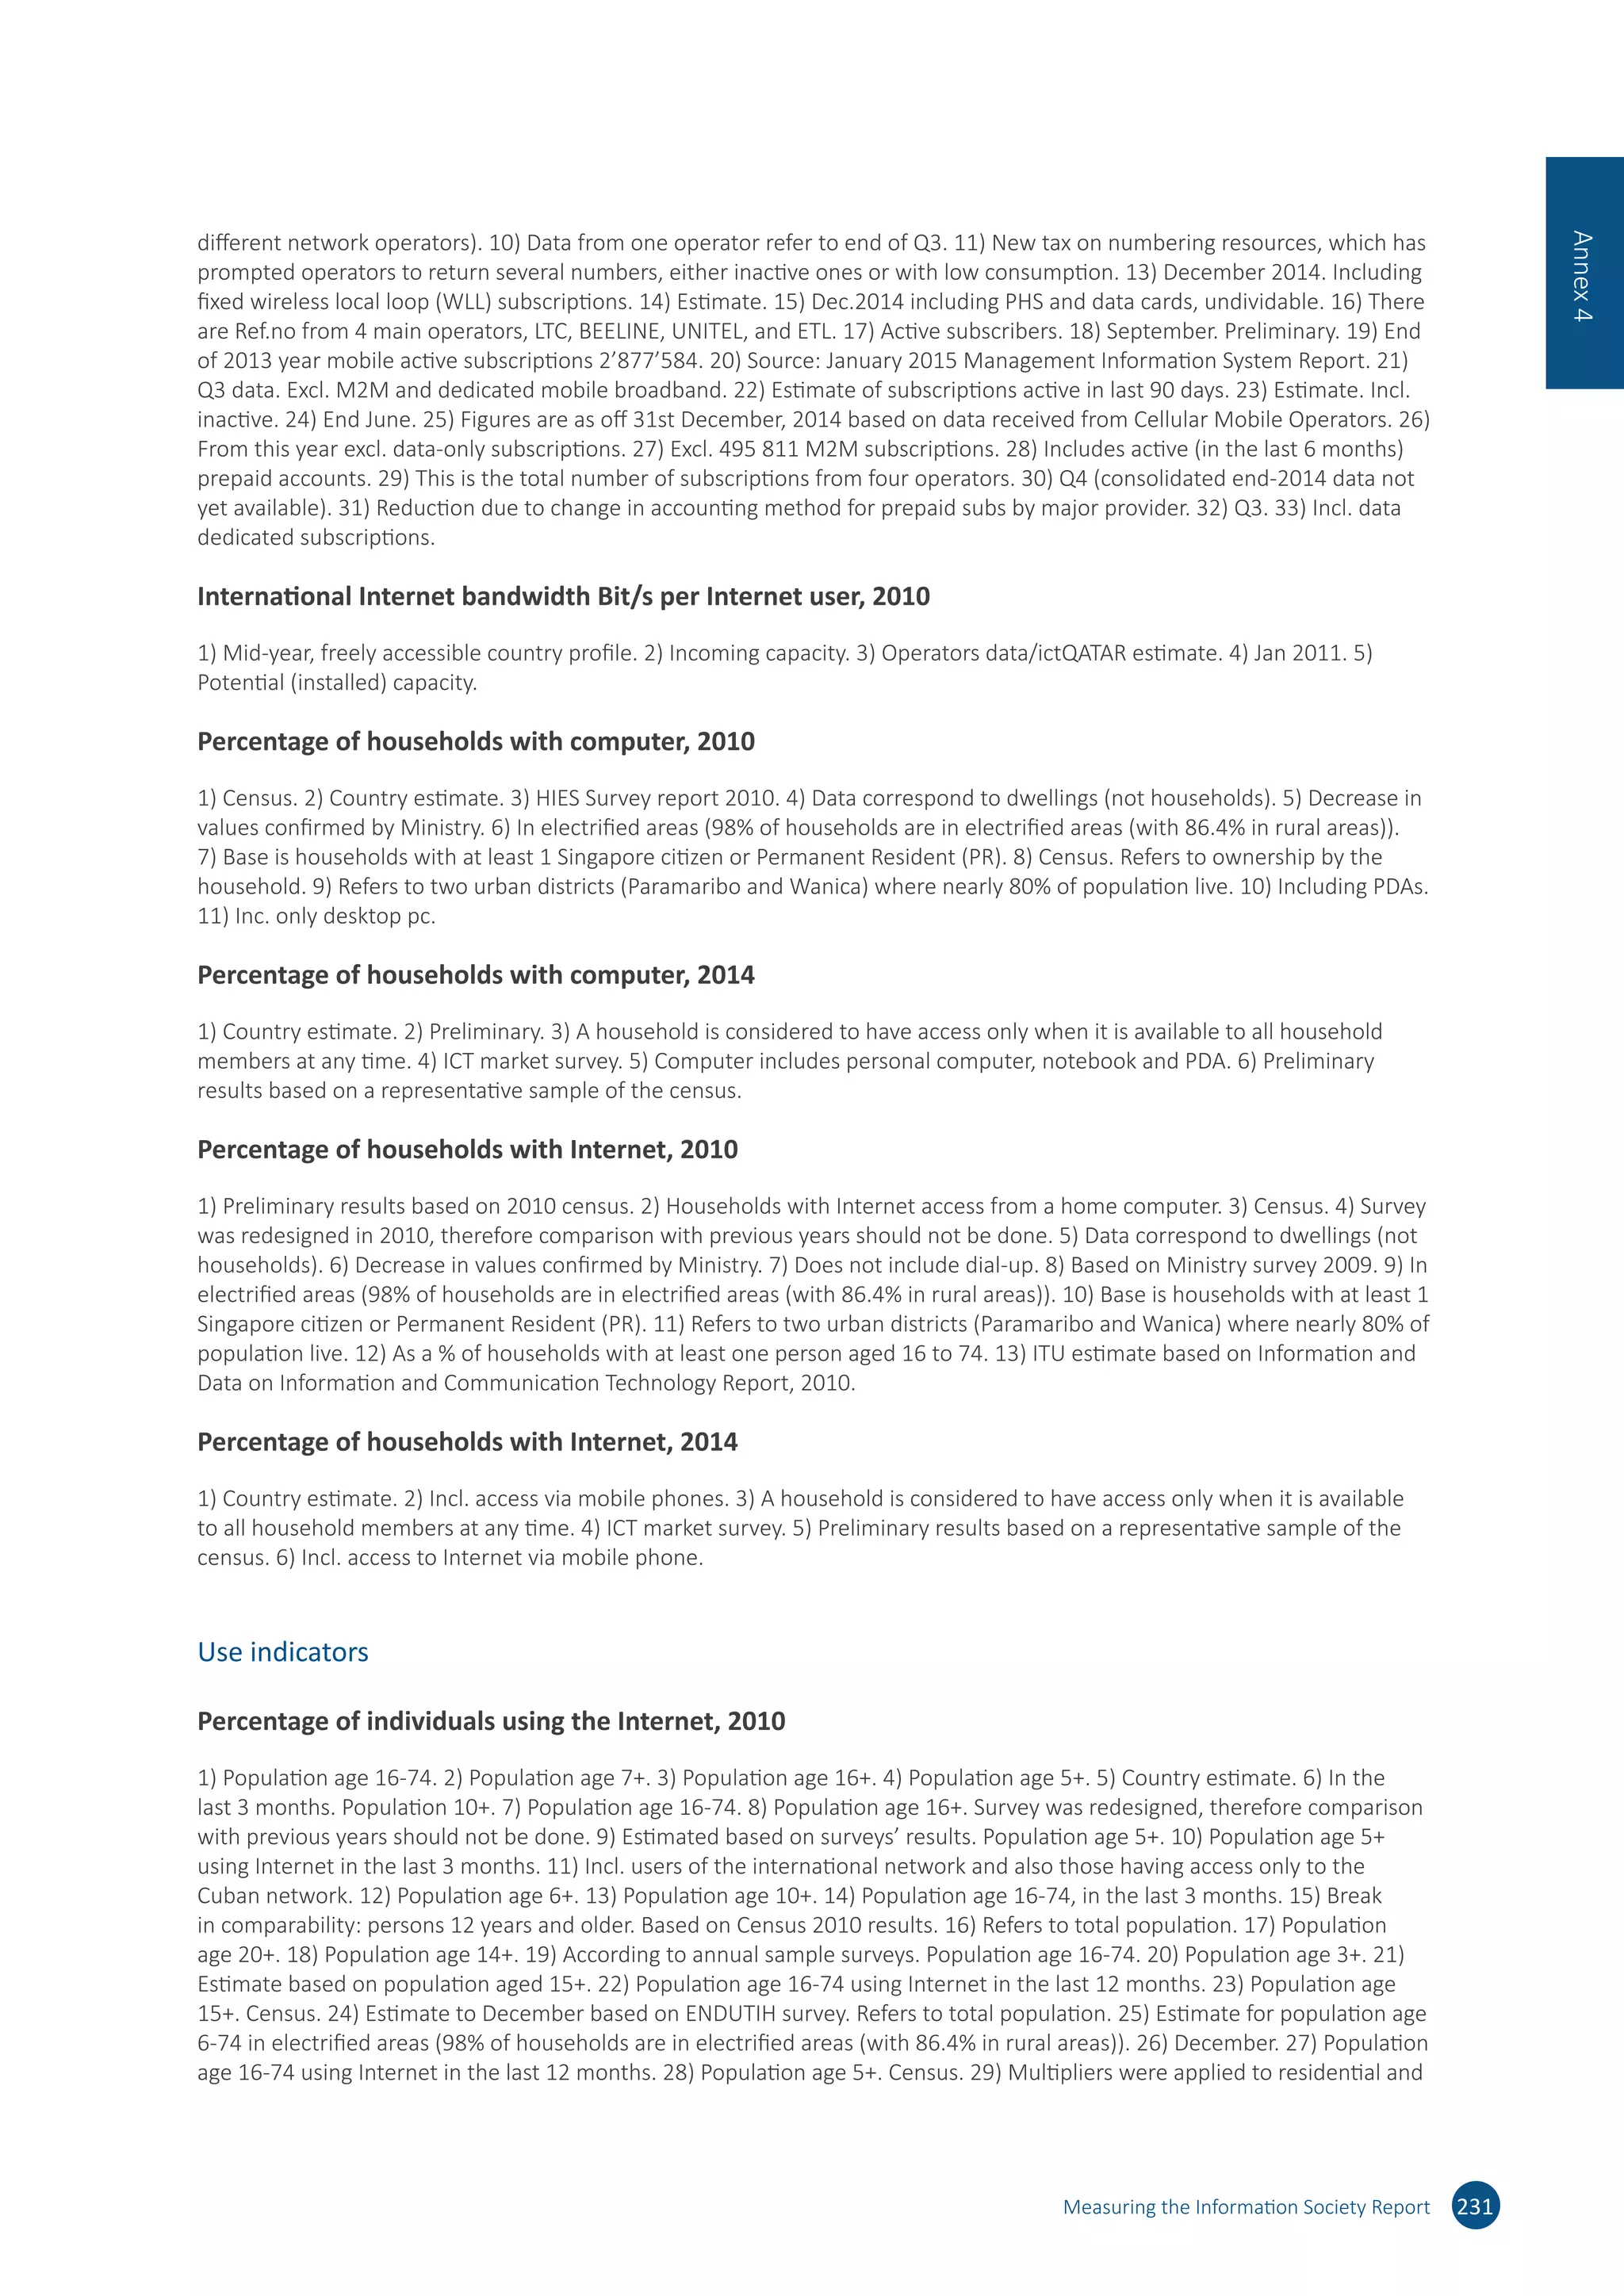
![200 Measuring the Information Society Report
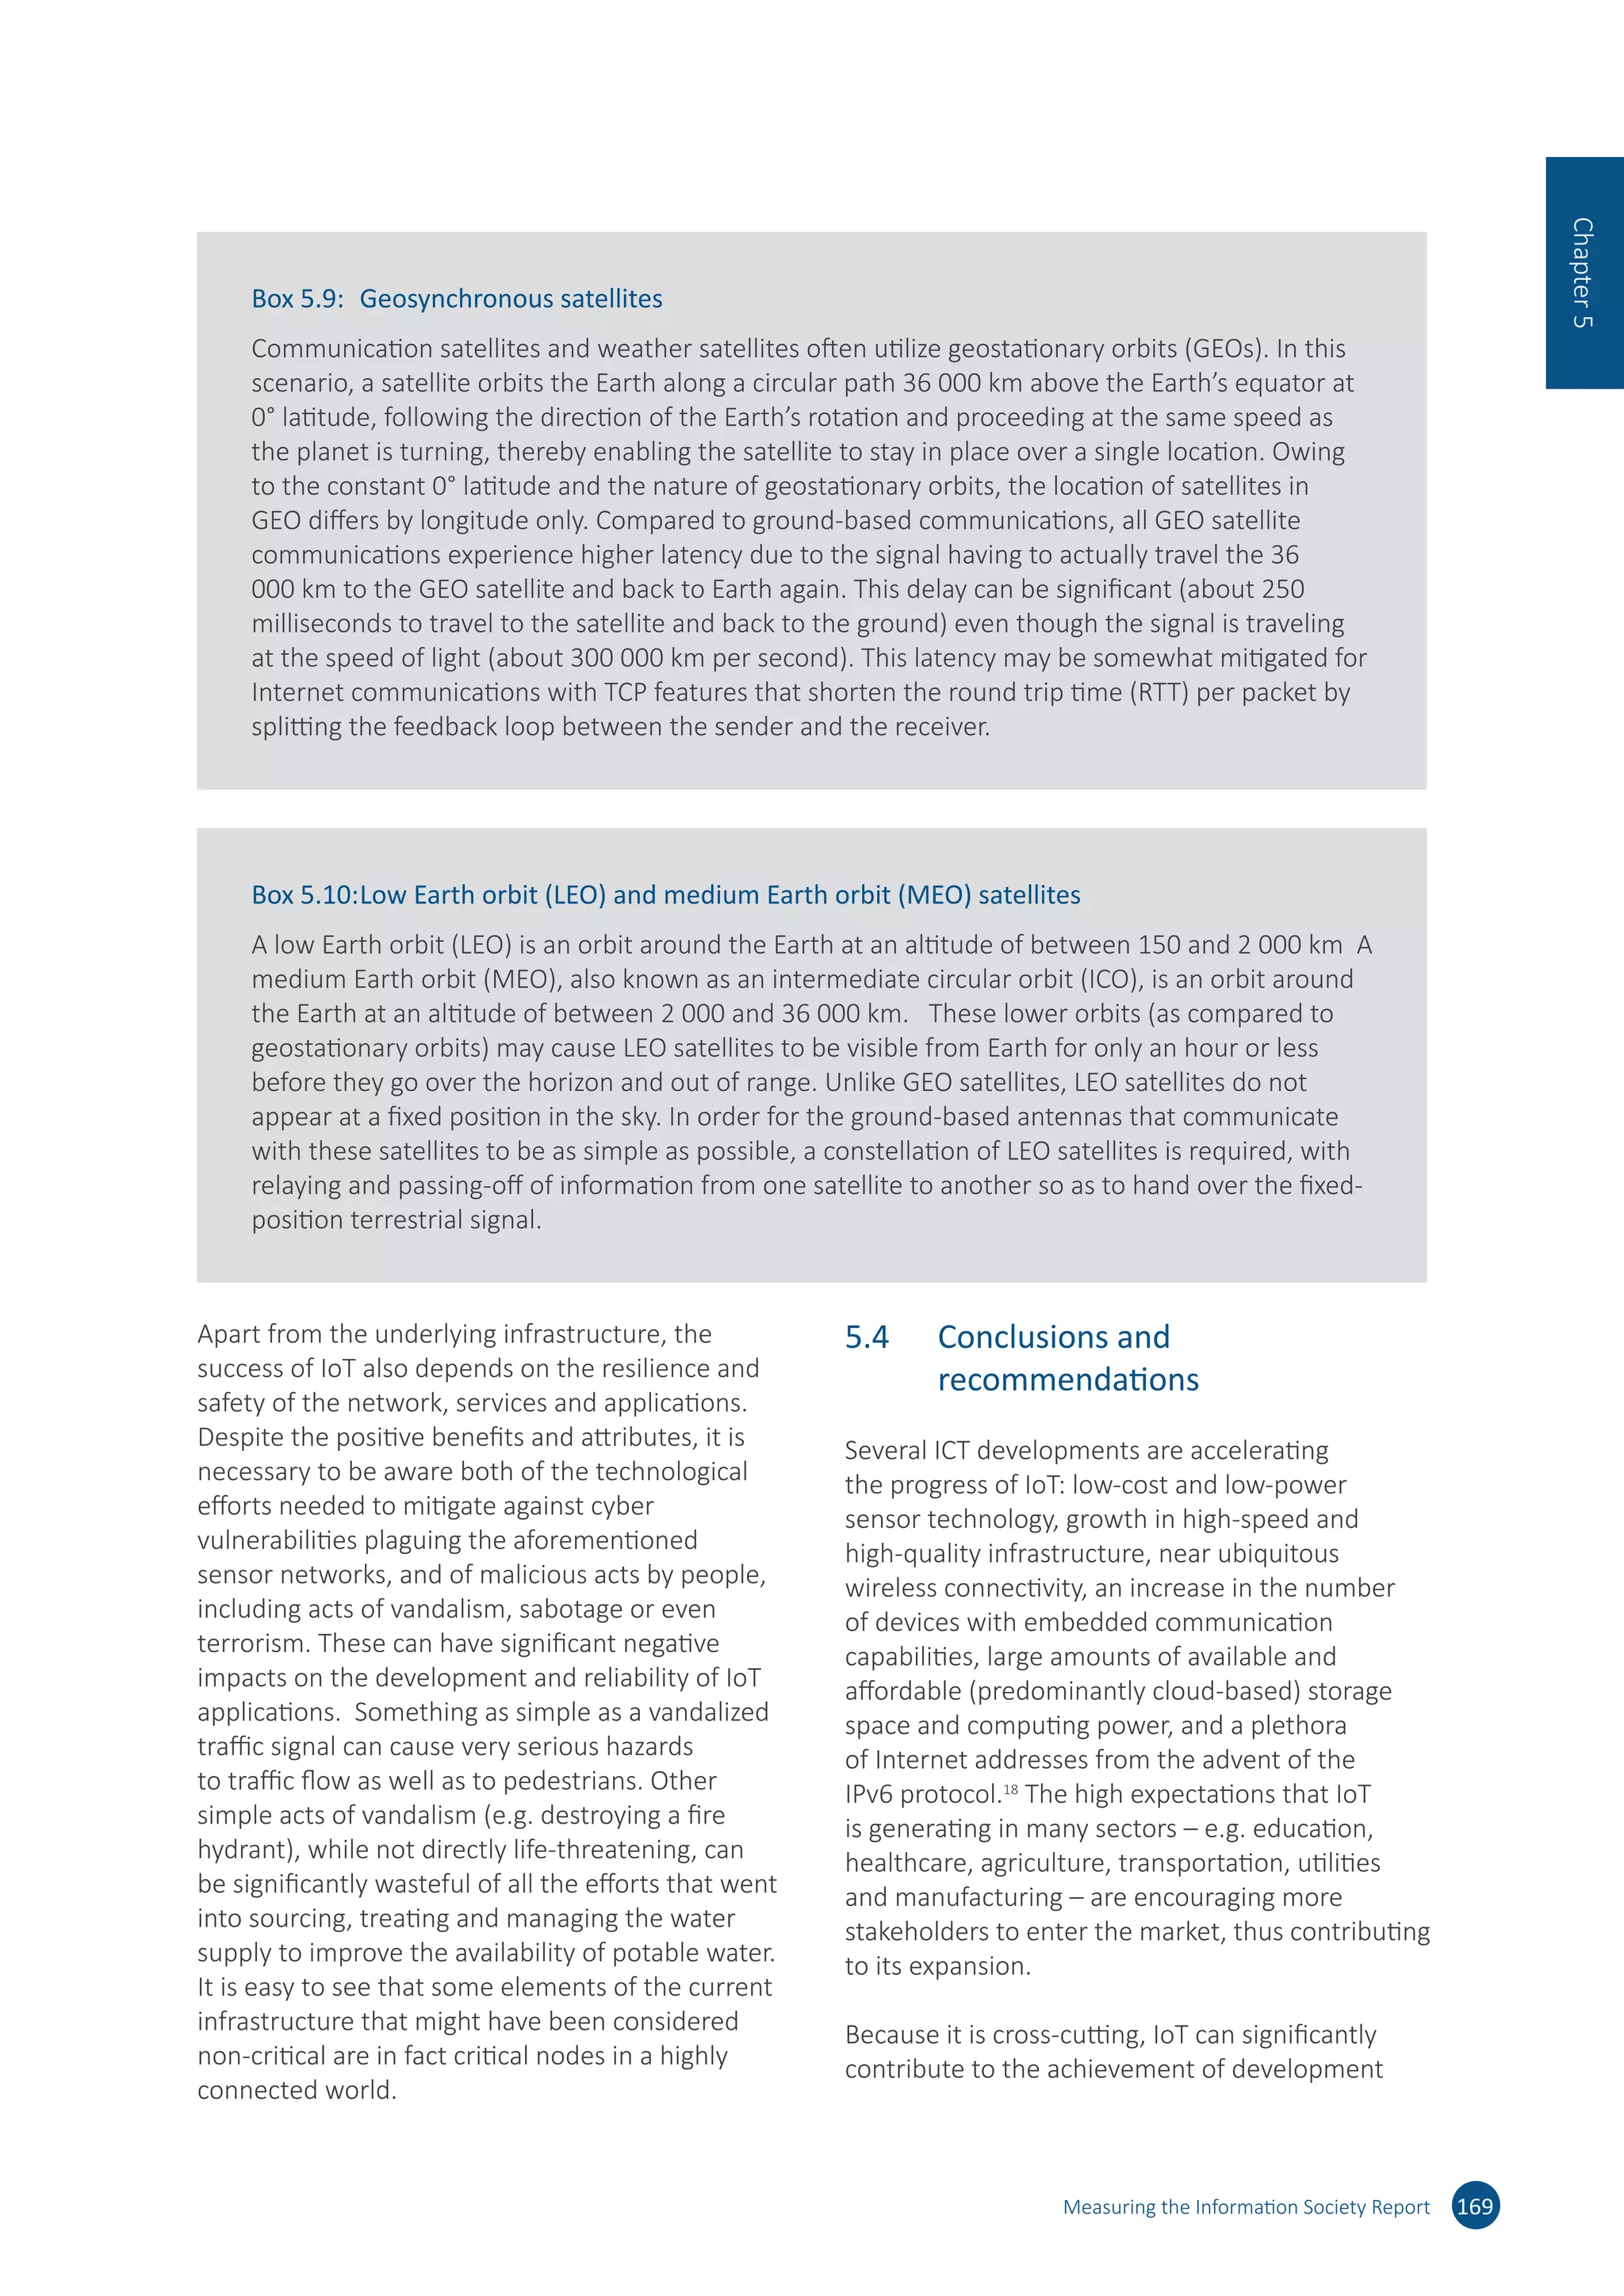
analysis or the need for ease of communication.
The aim of the uncertainty analysis is to assess
the extent to which ‒ and for which countries
in particular ‒ these choices might affect
country classification. We have dealt with these
uncertainties simultaneously in order to assess
their joint influence and fully acknowledge their
implications8
. The data are considered to be
error-free since the ITU team already undertook
a double-check control of possible errors and
corrected them during this phase.
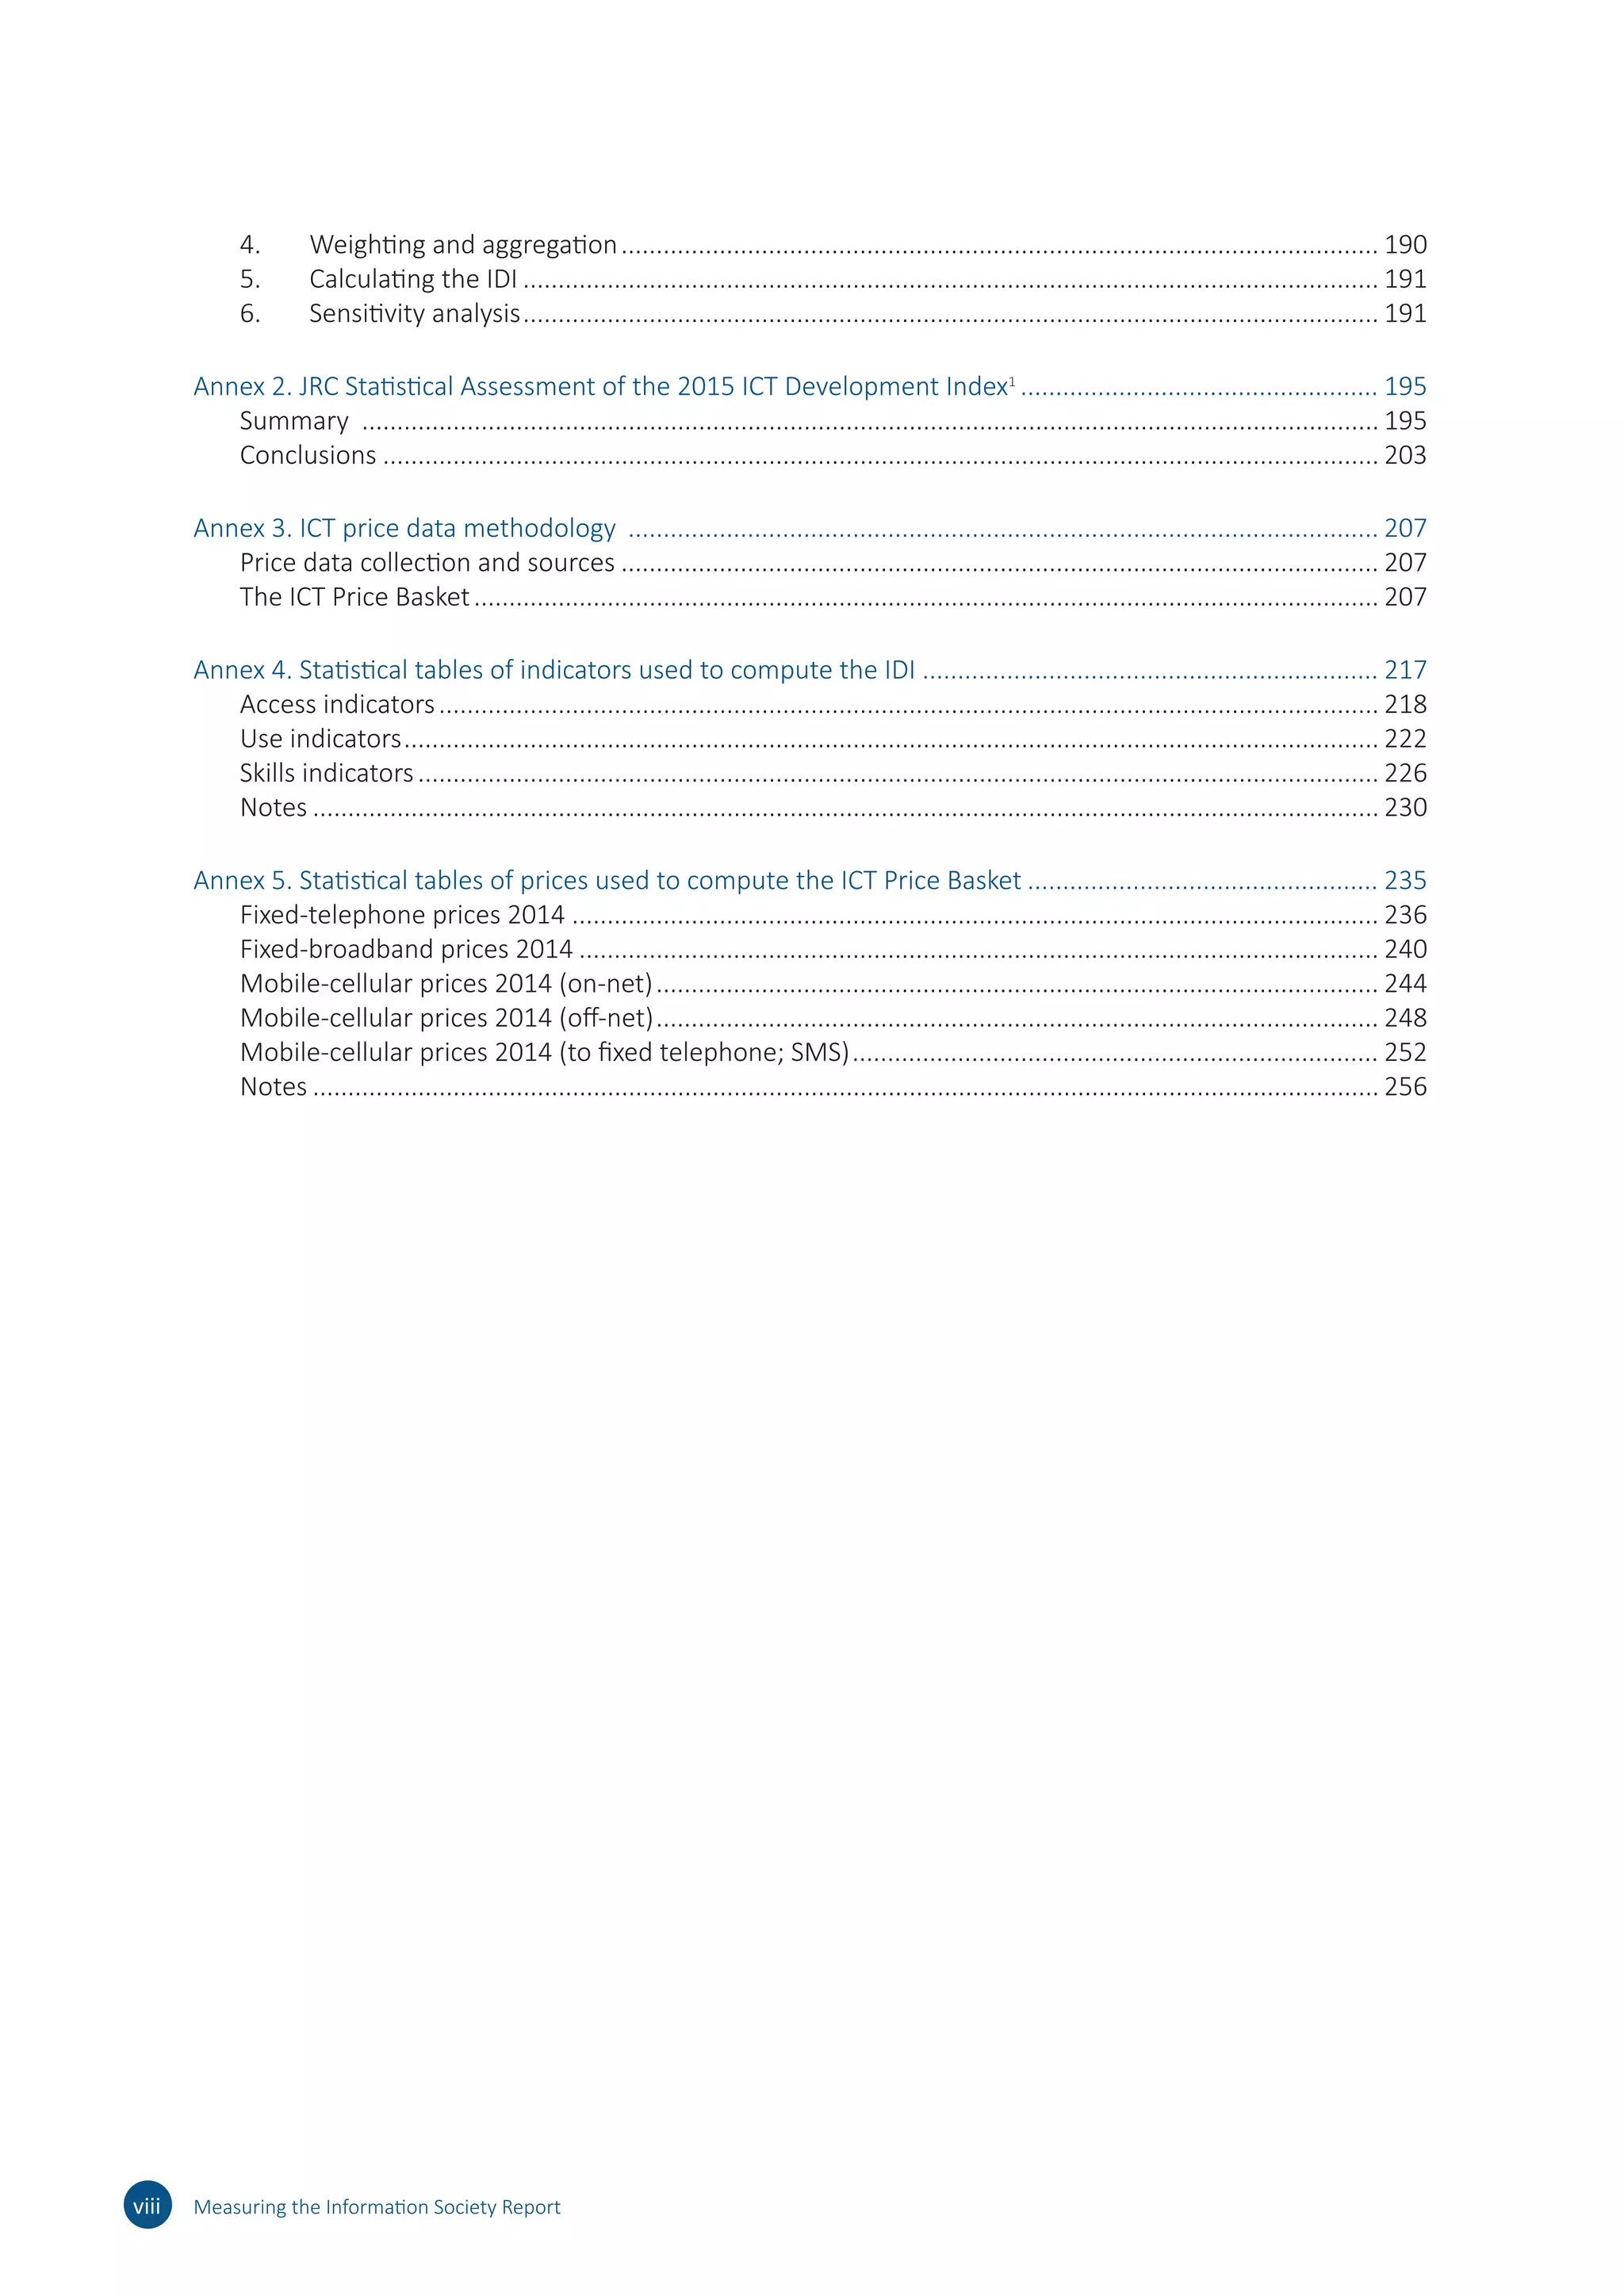
The robustness assessment of the IDI was based
on a combination of a Monte Carlo experiment
and a multi-modelling approach. This type of
assessment aims to respond to any criticism that
the country scores associated with aggregate
measures are generally not calculated under
conditions of certainty, even though they are
frequently presented as such9
. The Monte Carlo
simulation was played on the weights for the
three sub-indices and comprised 1 000 runs,
each corresponding to a different set of weights,
randomly sampled from uniform continuous
distributions in the range 15-25 per cent for the
ICT skills sub-index, and 30-50 per cent for the
ICT access and ICT use sub-indices. The sampled
weights were then rescaled to unity sum (Annex
Table 2.6). This choice of the range for the weights
variation ensures a wide enough interval to have
meaningful robustness checks (±25 per cent of the
reference value and a roughly three-to-one ratio
of the highest to the lowest weight). At the same
time, it reflects the ITU team’s rationale that the
ICT skills sub-index should be given less weight
than the ICT access and ICT use sub-indices.
The next type of uncertainty considered relates
to use of the arithmetic average in the calculation
of the index from the three ICT dimensions, a
formula that received statistical support from
principal component analysis and reliability item
analysis. However, decision-theory practitioners
have challenged the use of simple arithmetic
averages because of their fully compensatory
nature, in which a comparative high advantage on
a few indicators can compensate a comparative
disadvantage on many indicators10
. In order to
account for this criticism, the geometric average
was considered as an alternative. The geometric
average is a partially compensatory approach that
rewards countries with similar performance in
the three ICT dimensions or motivates countries
to improve in those ICT dimensions in which
they perform poorly, and not just in any ICT
dimension11
.
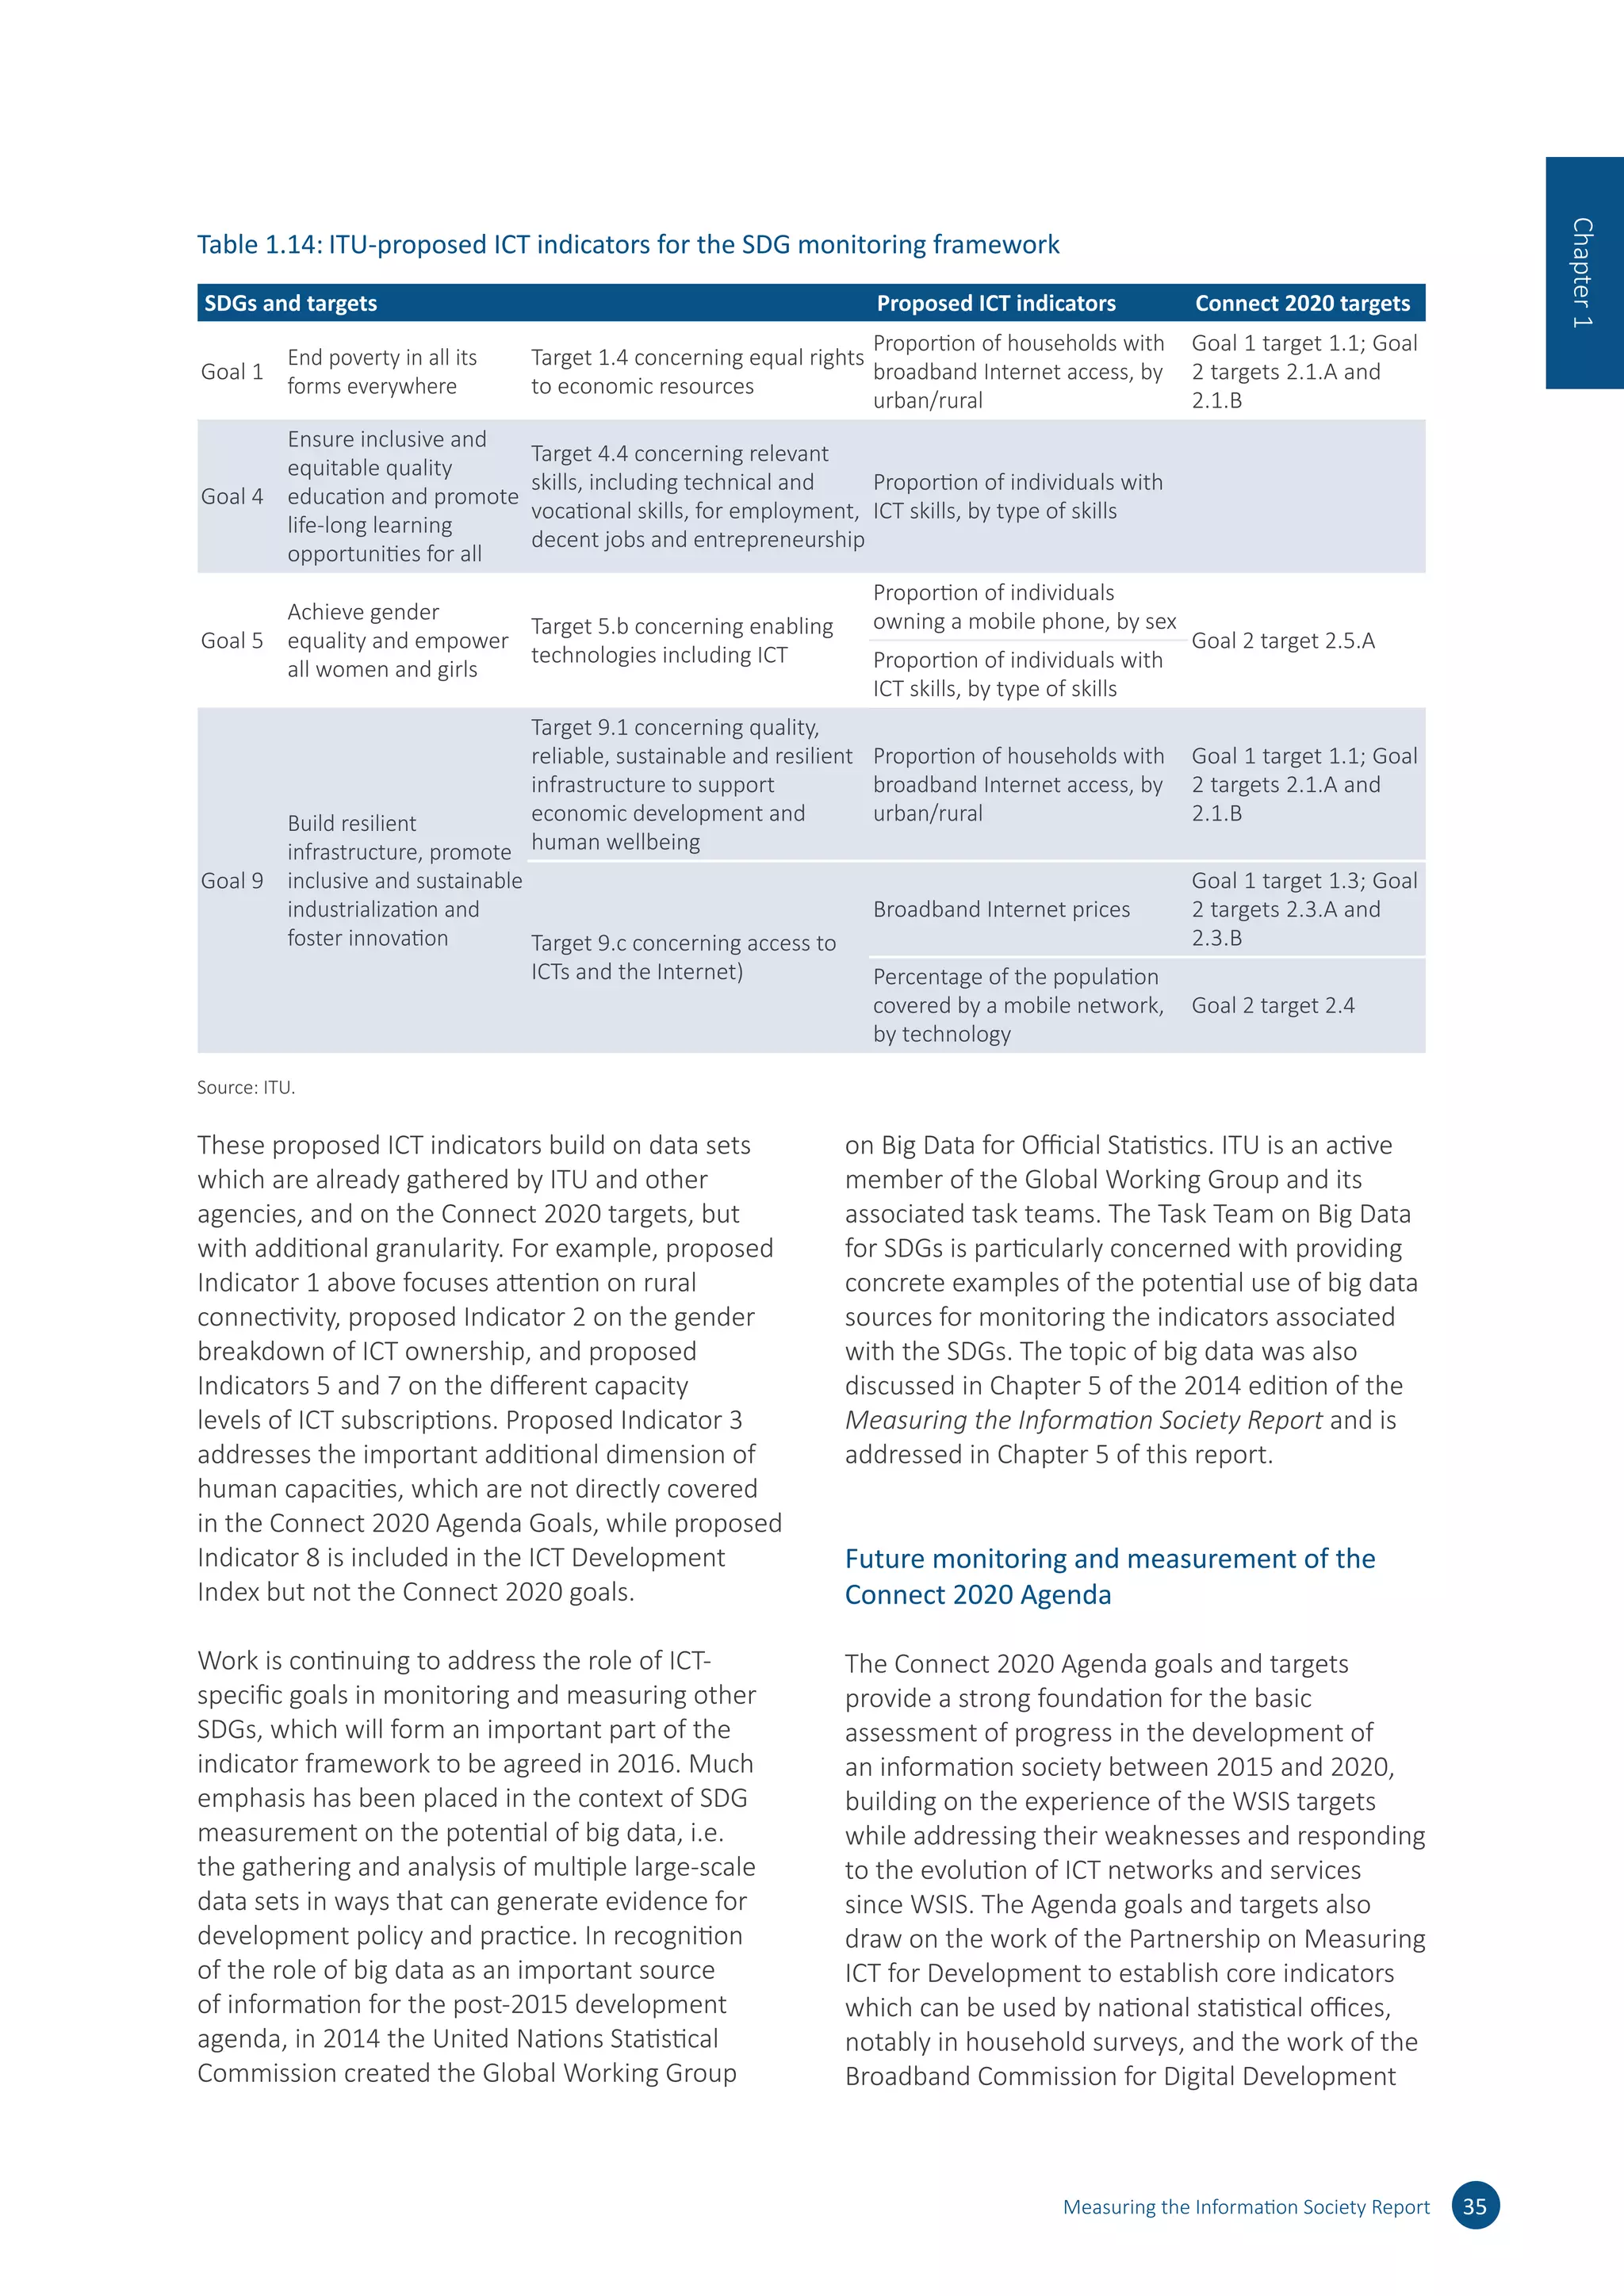
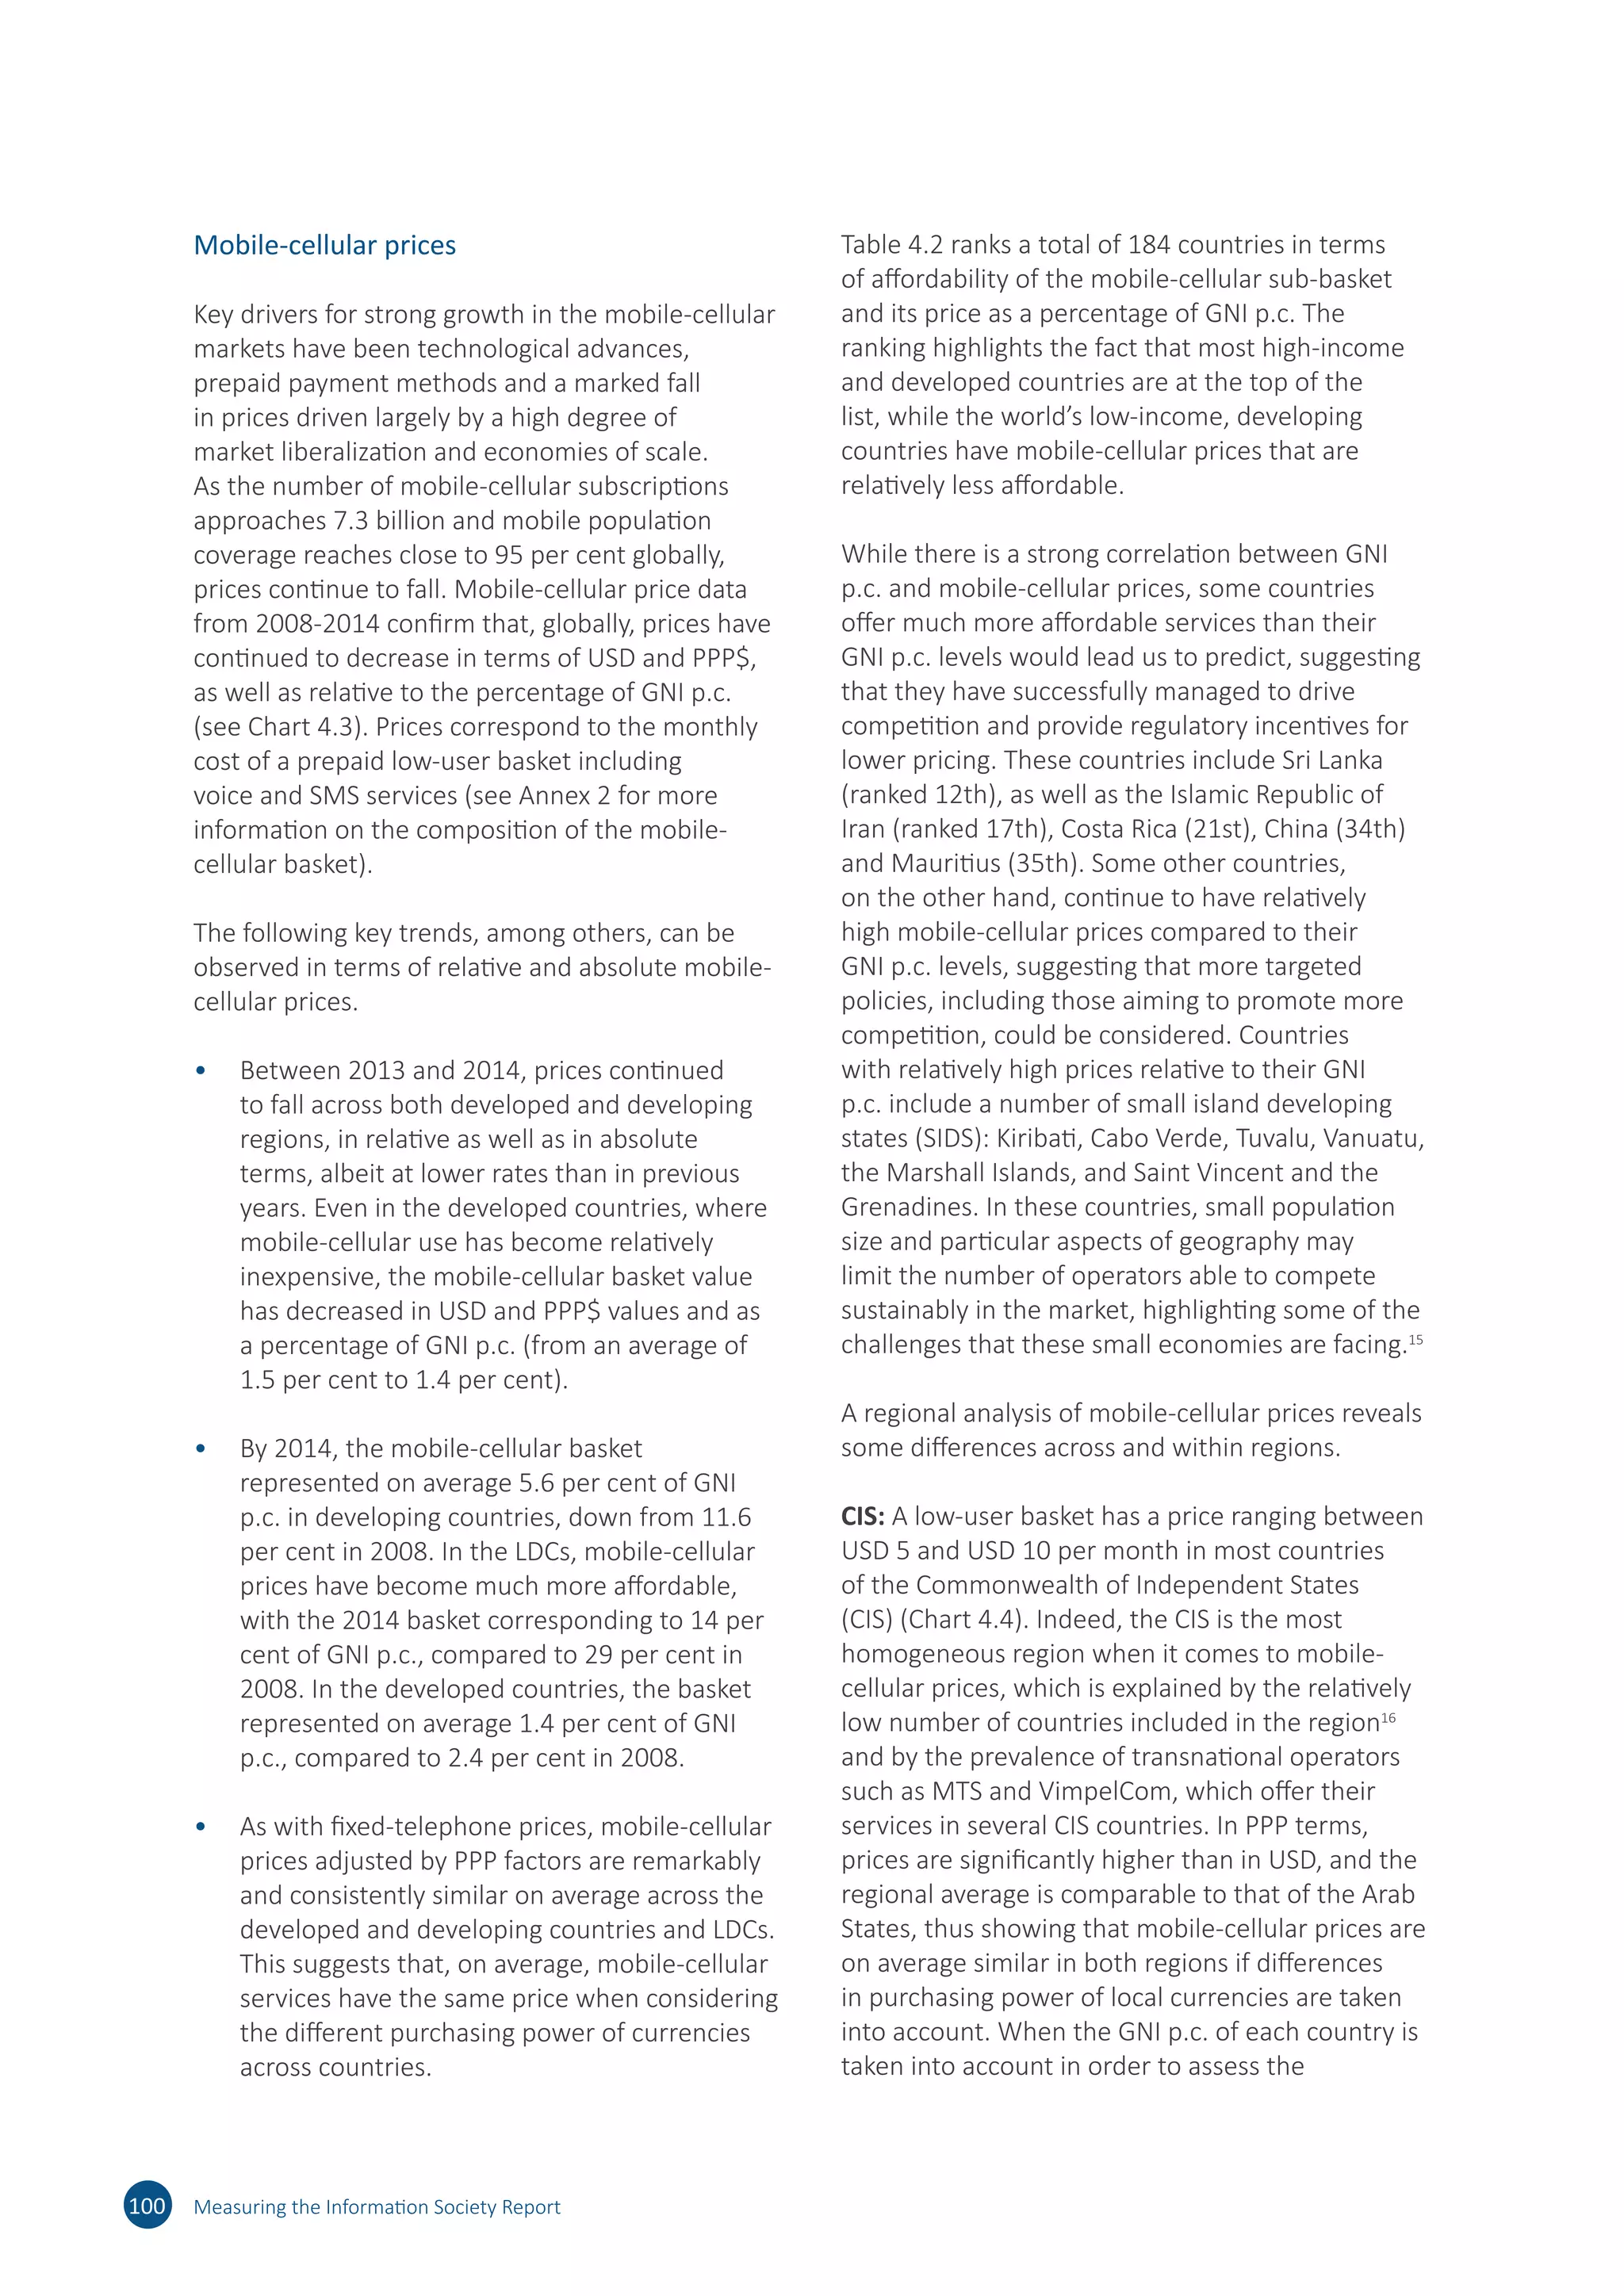
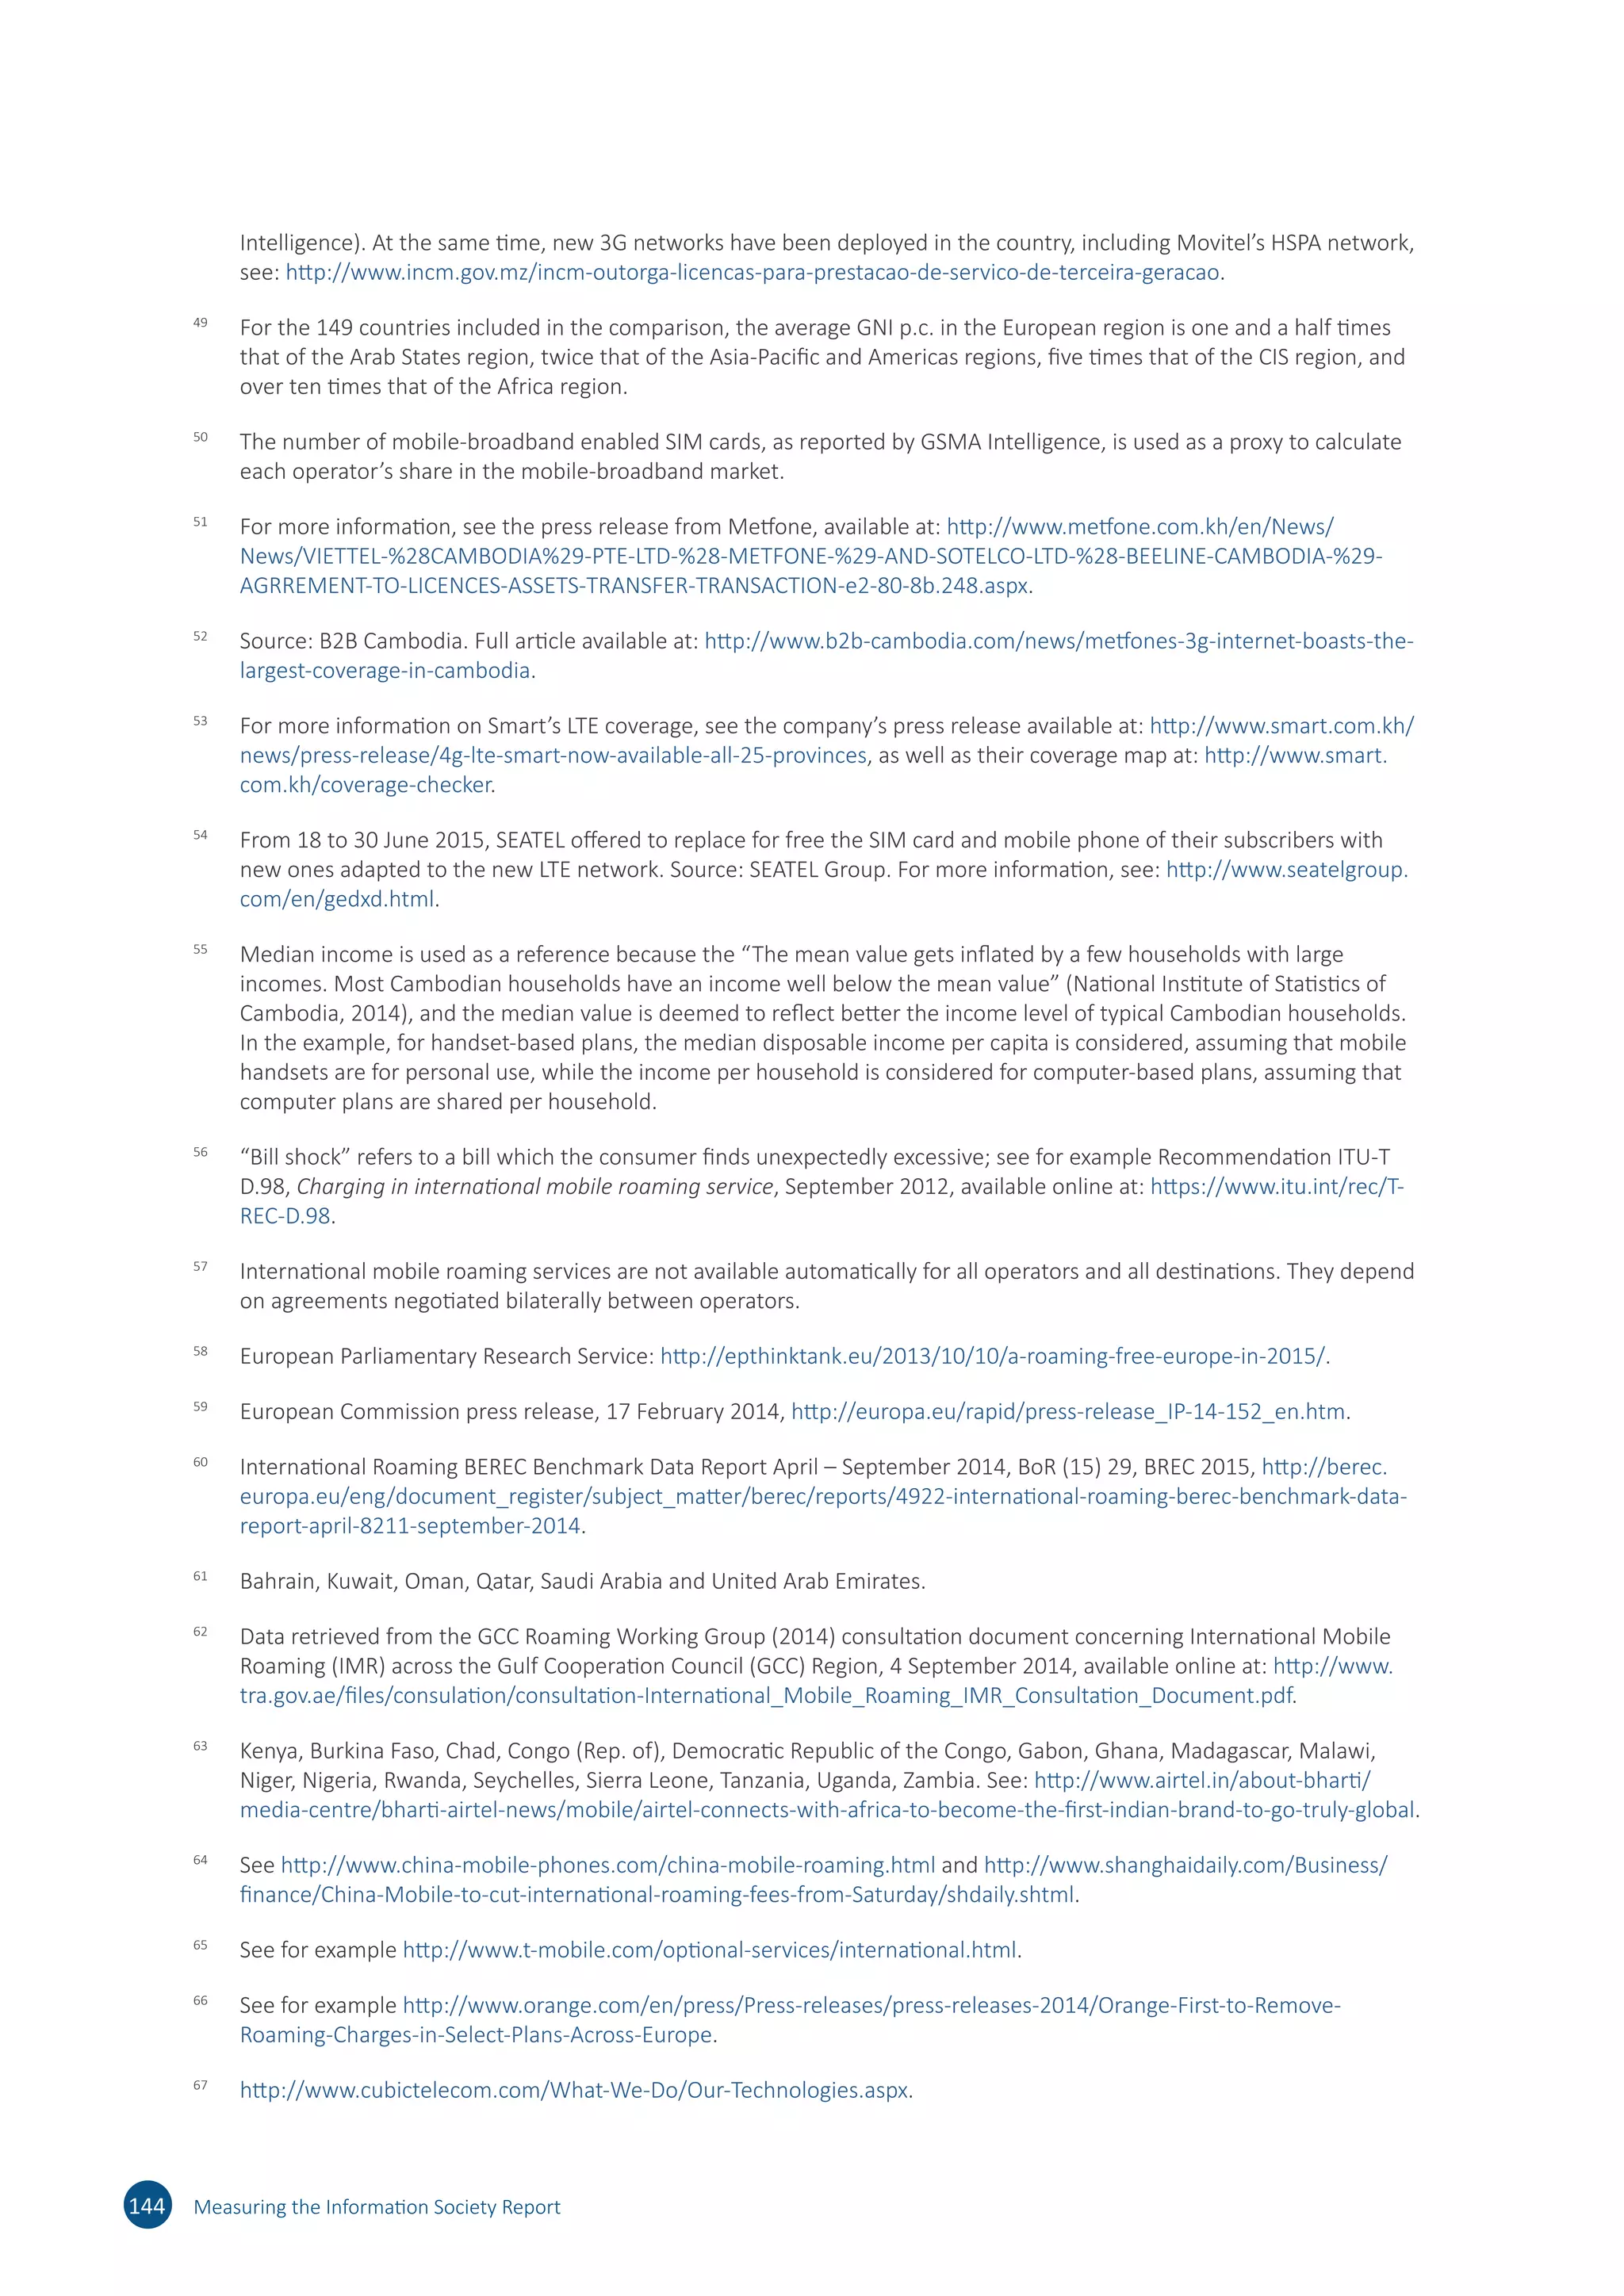
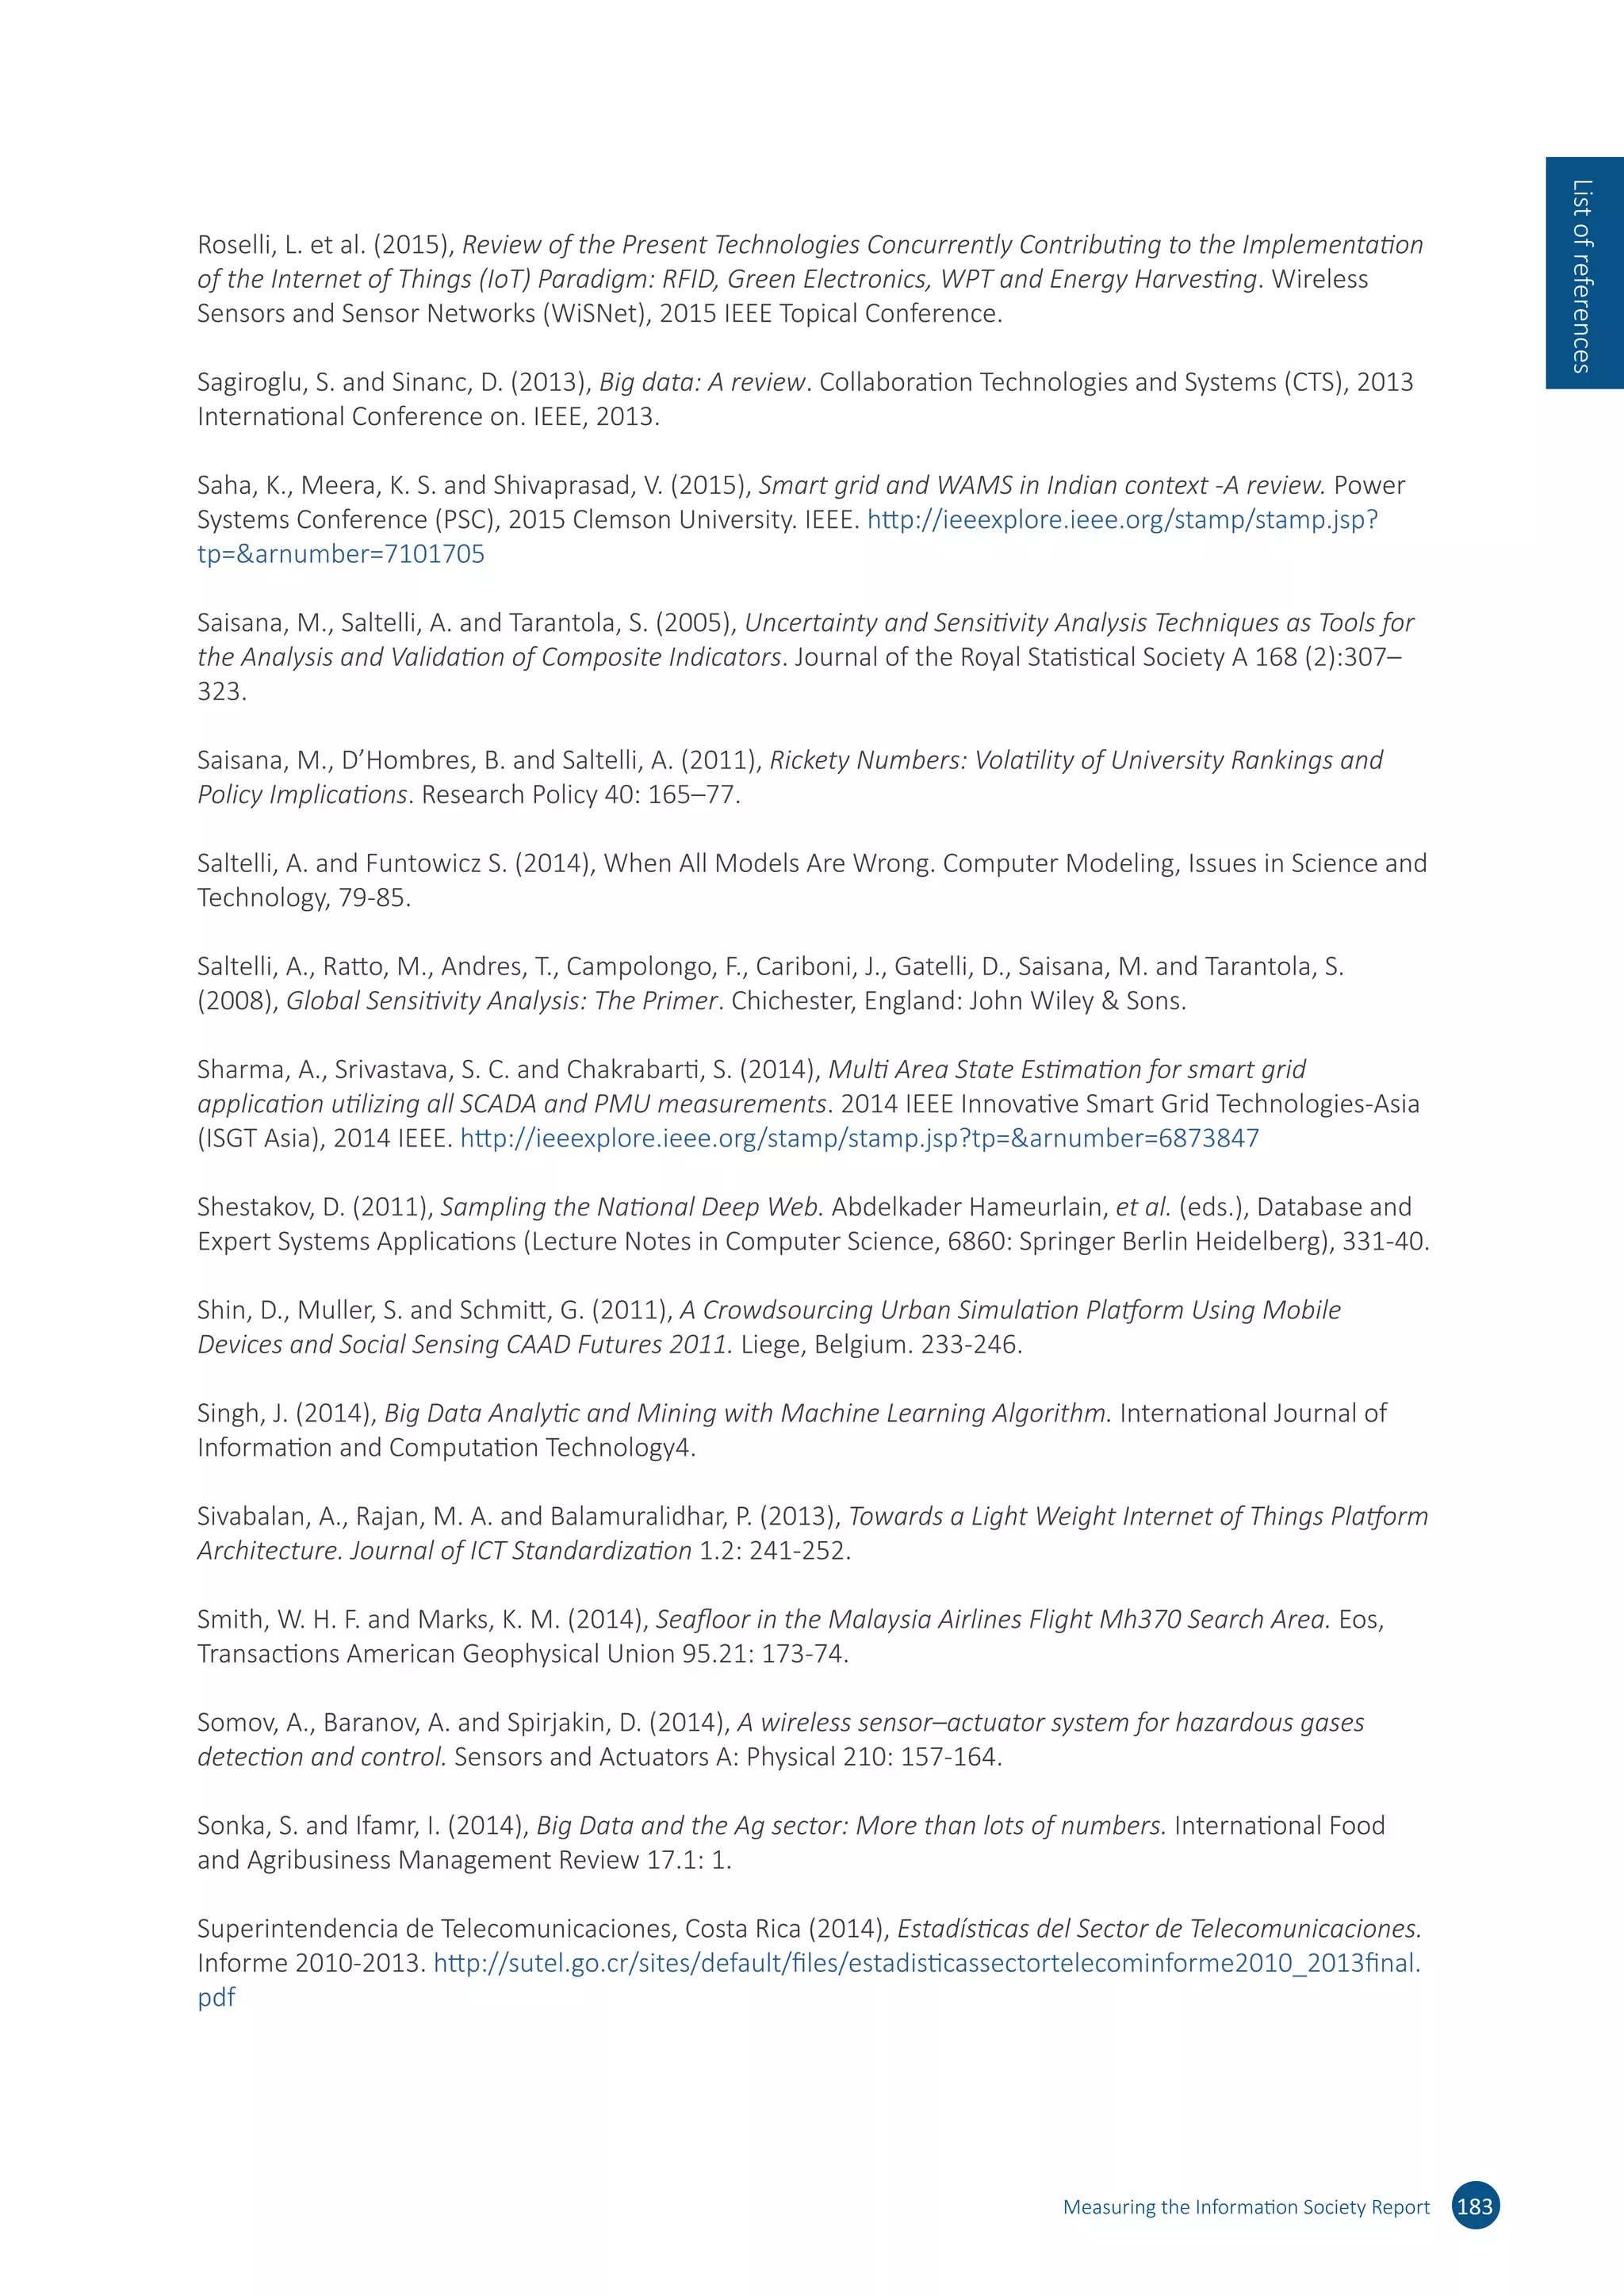
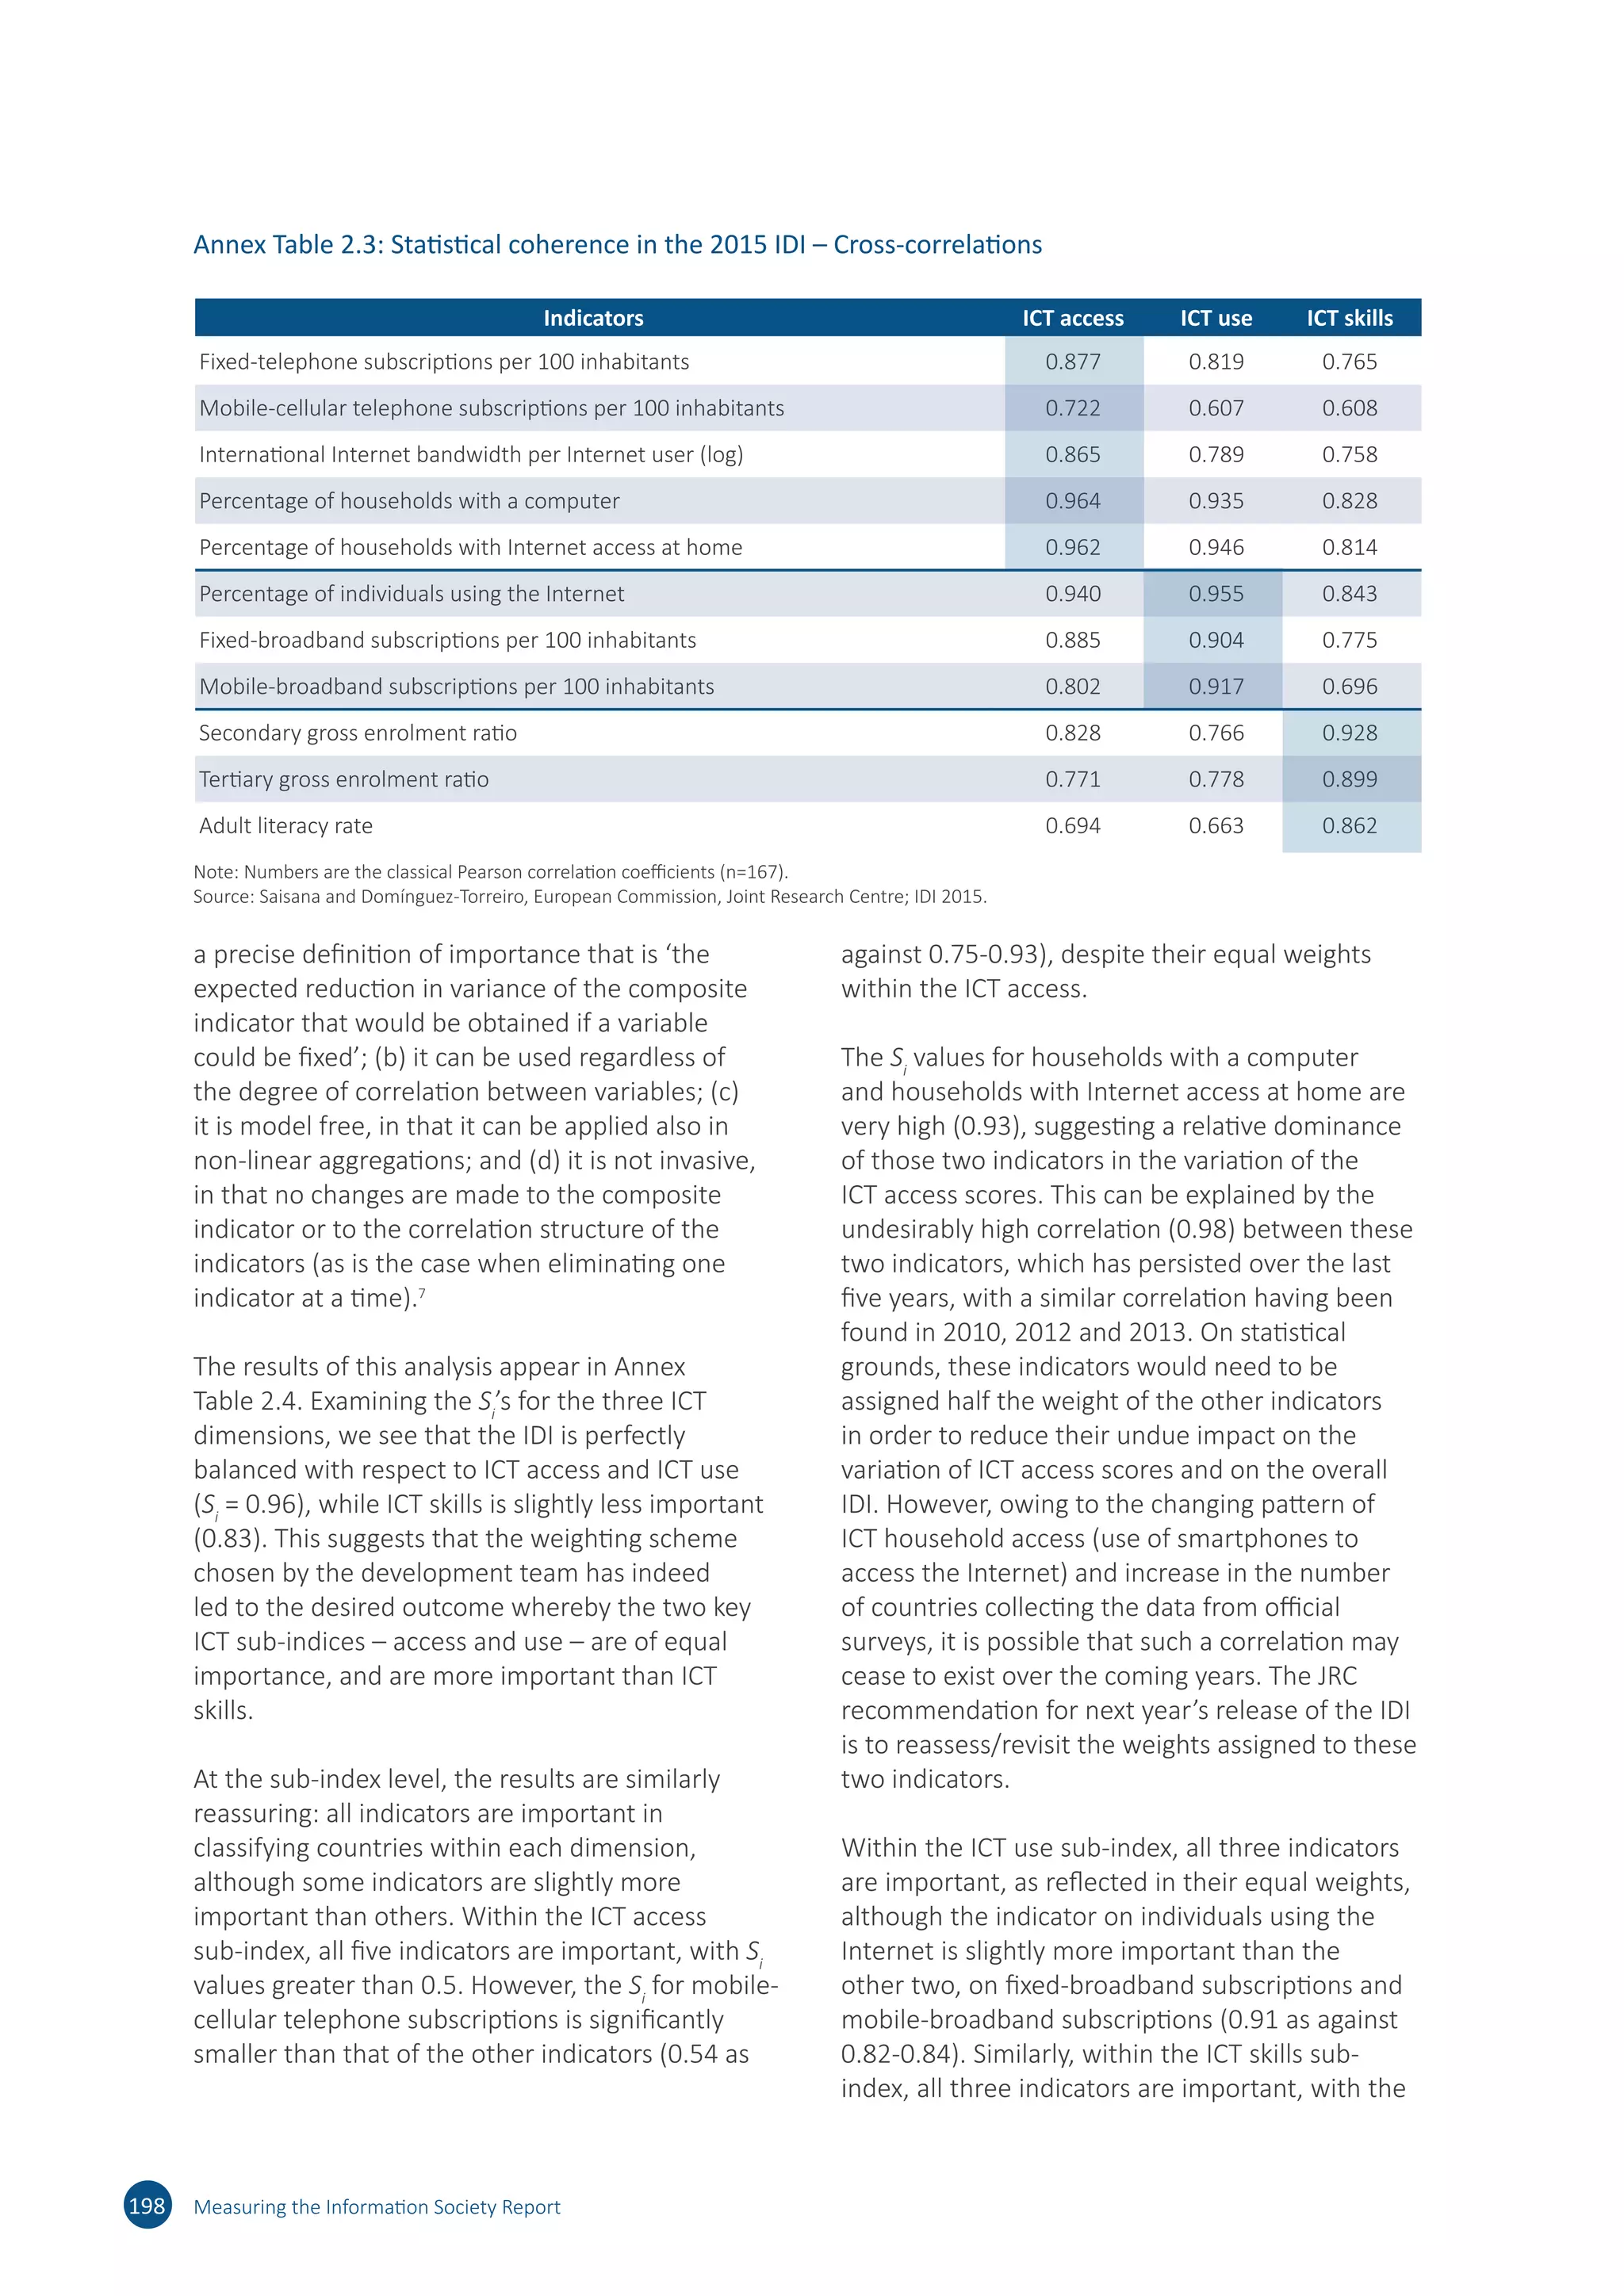
Combined with the 1 000 simulations per model to
account for the uncertainty in the weights across
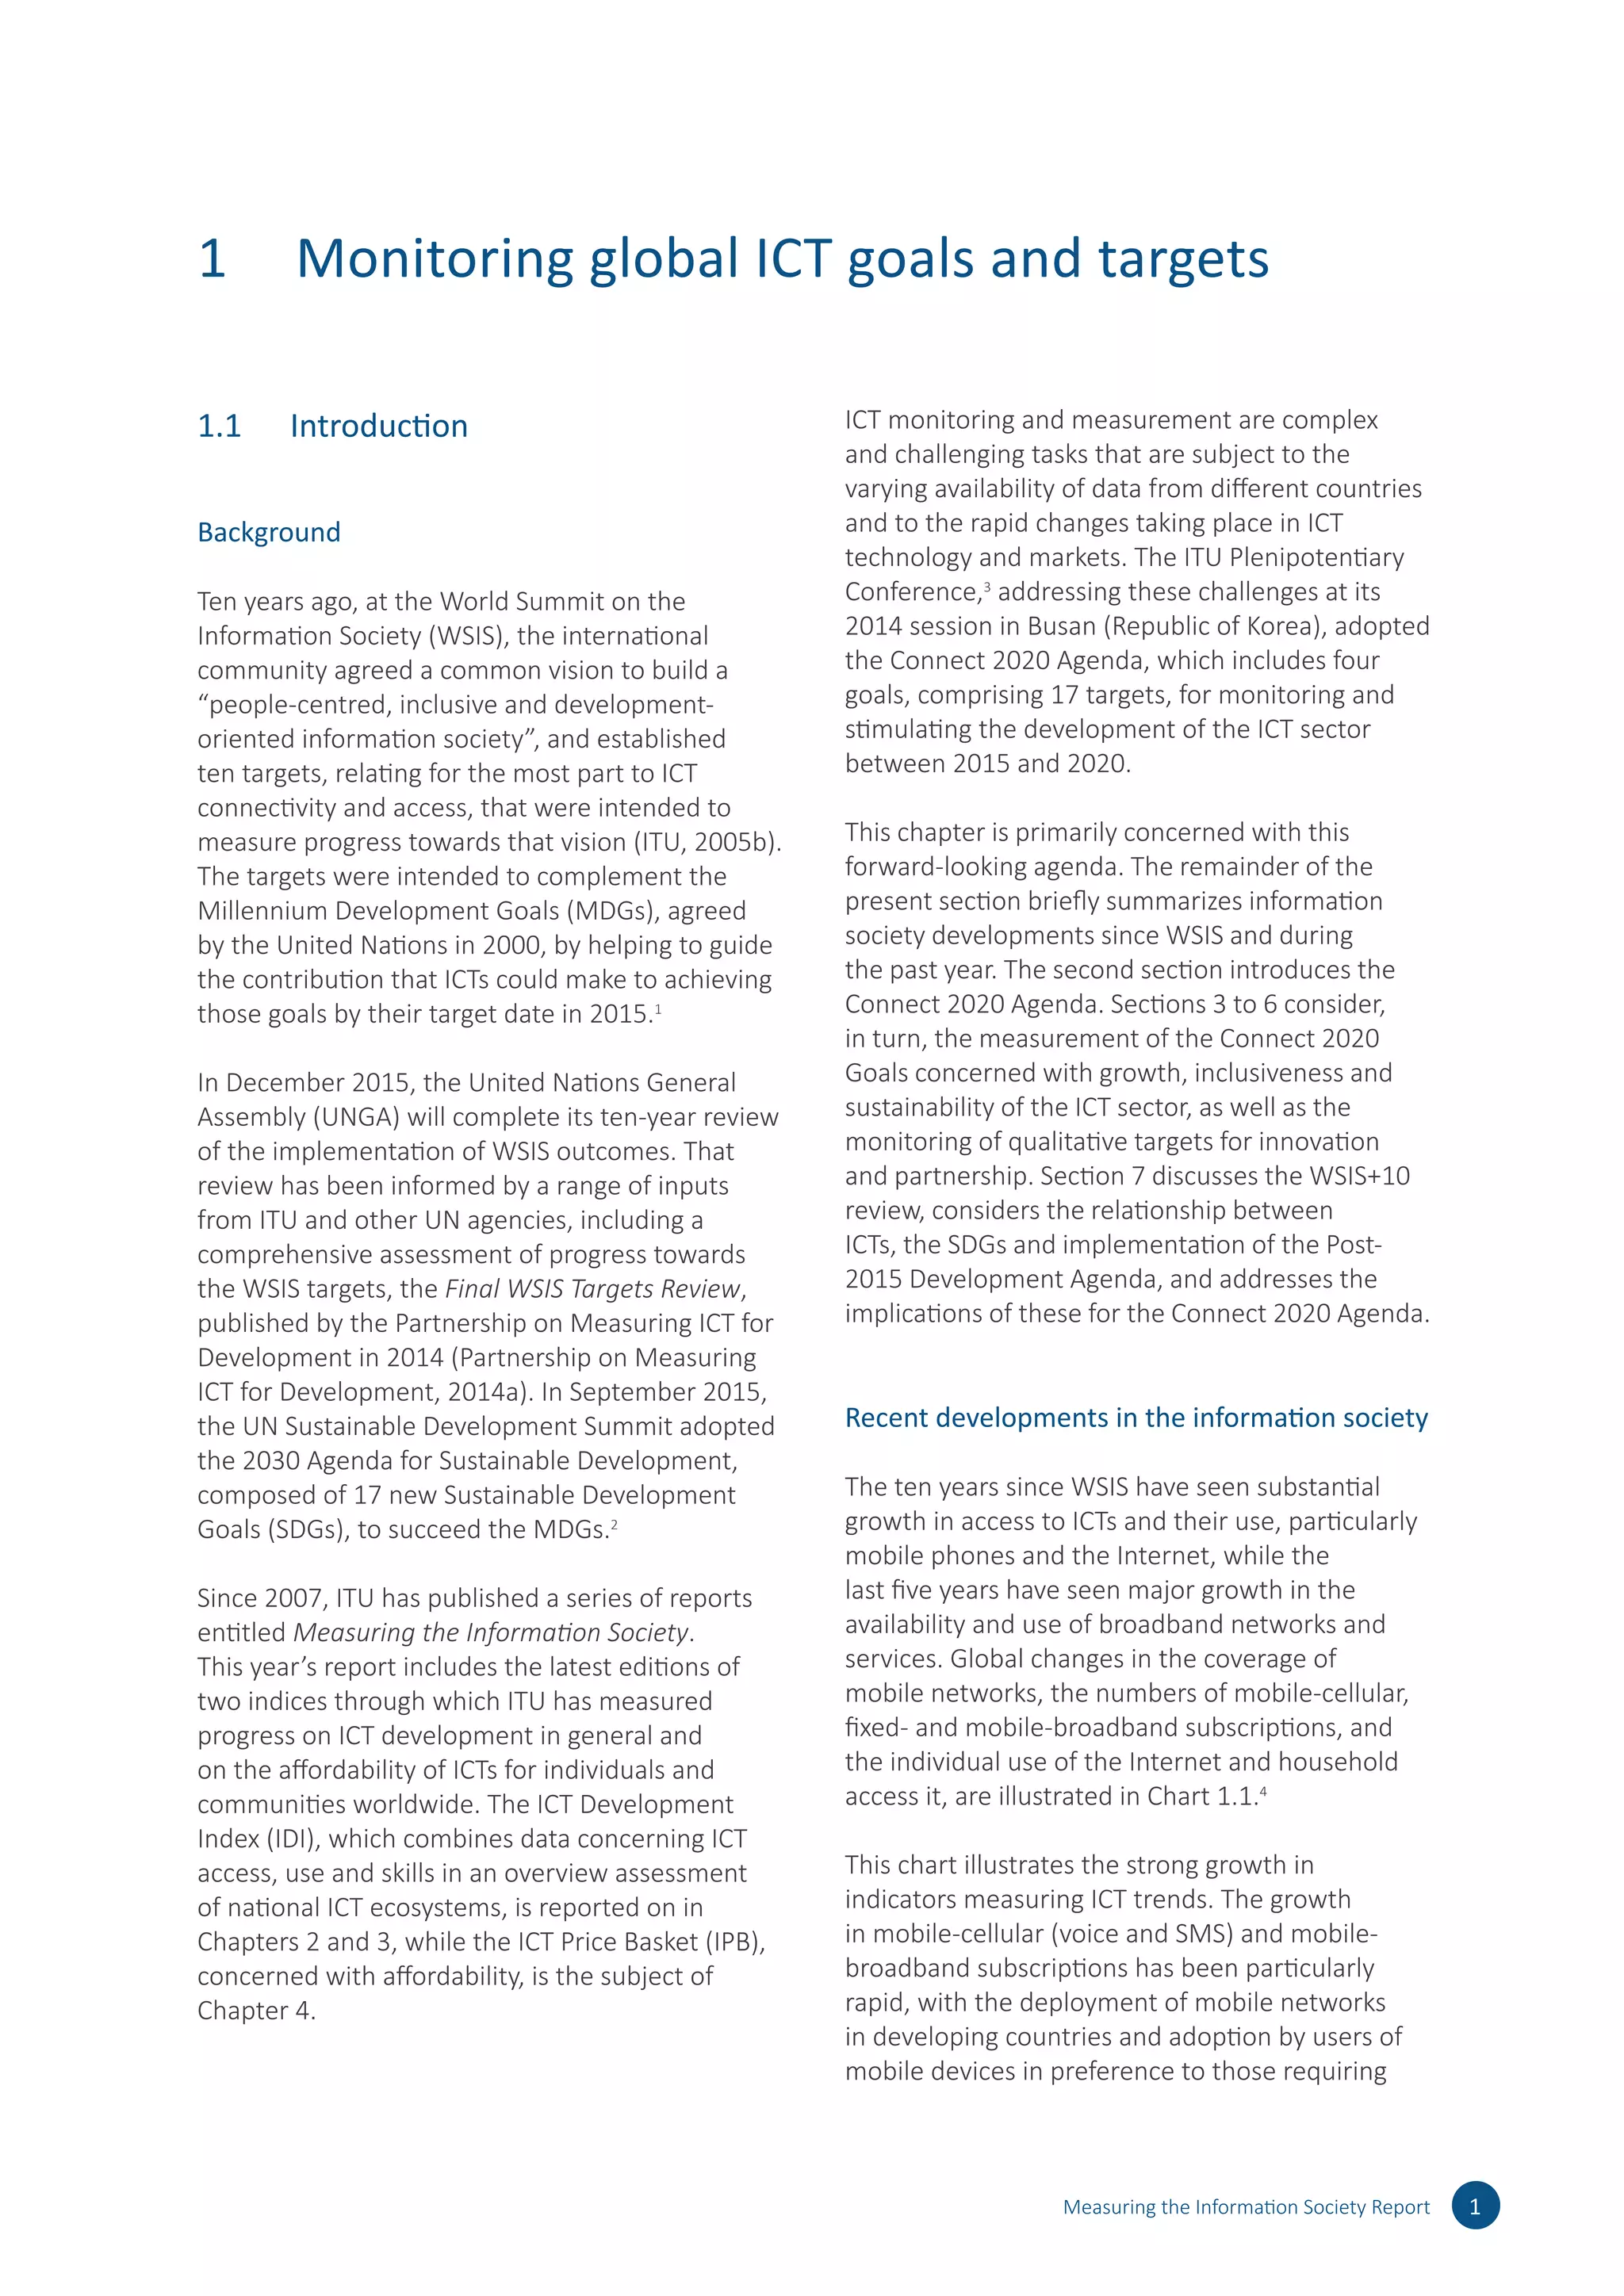
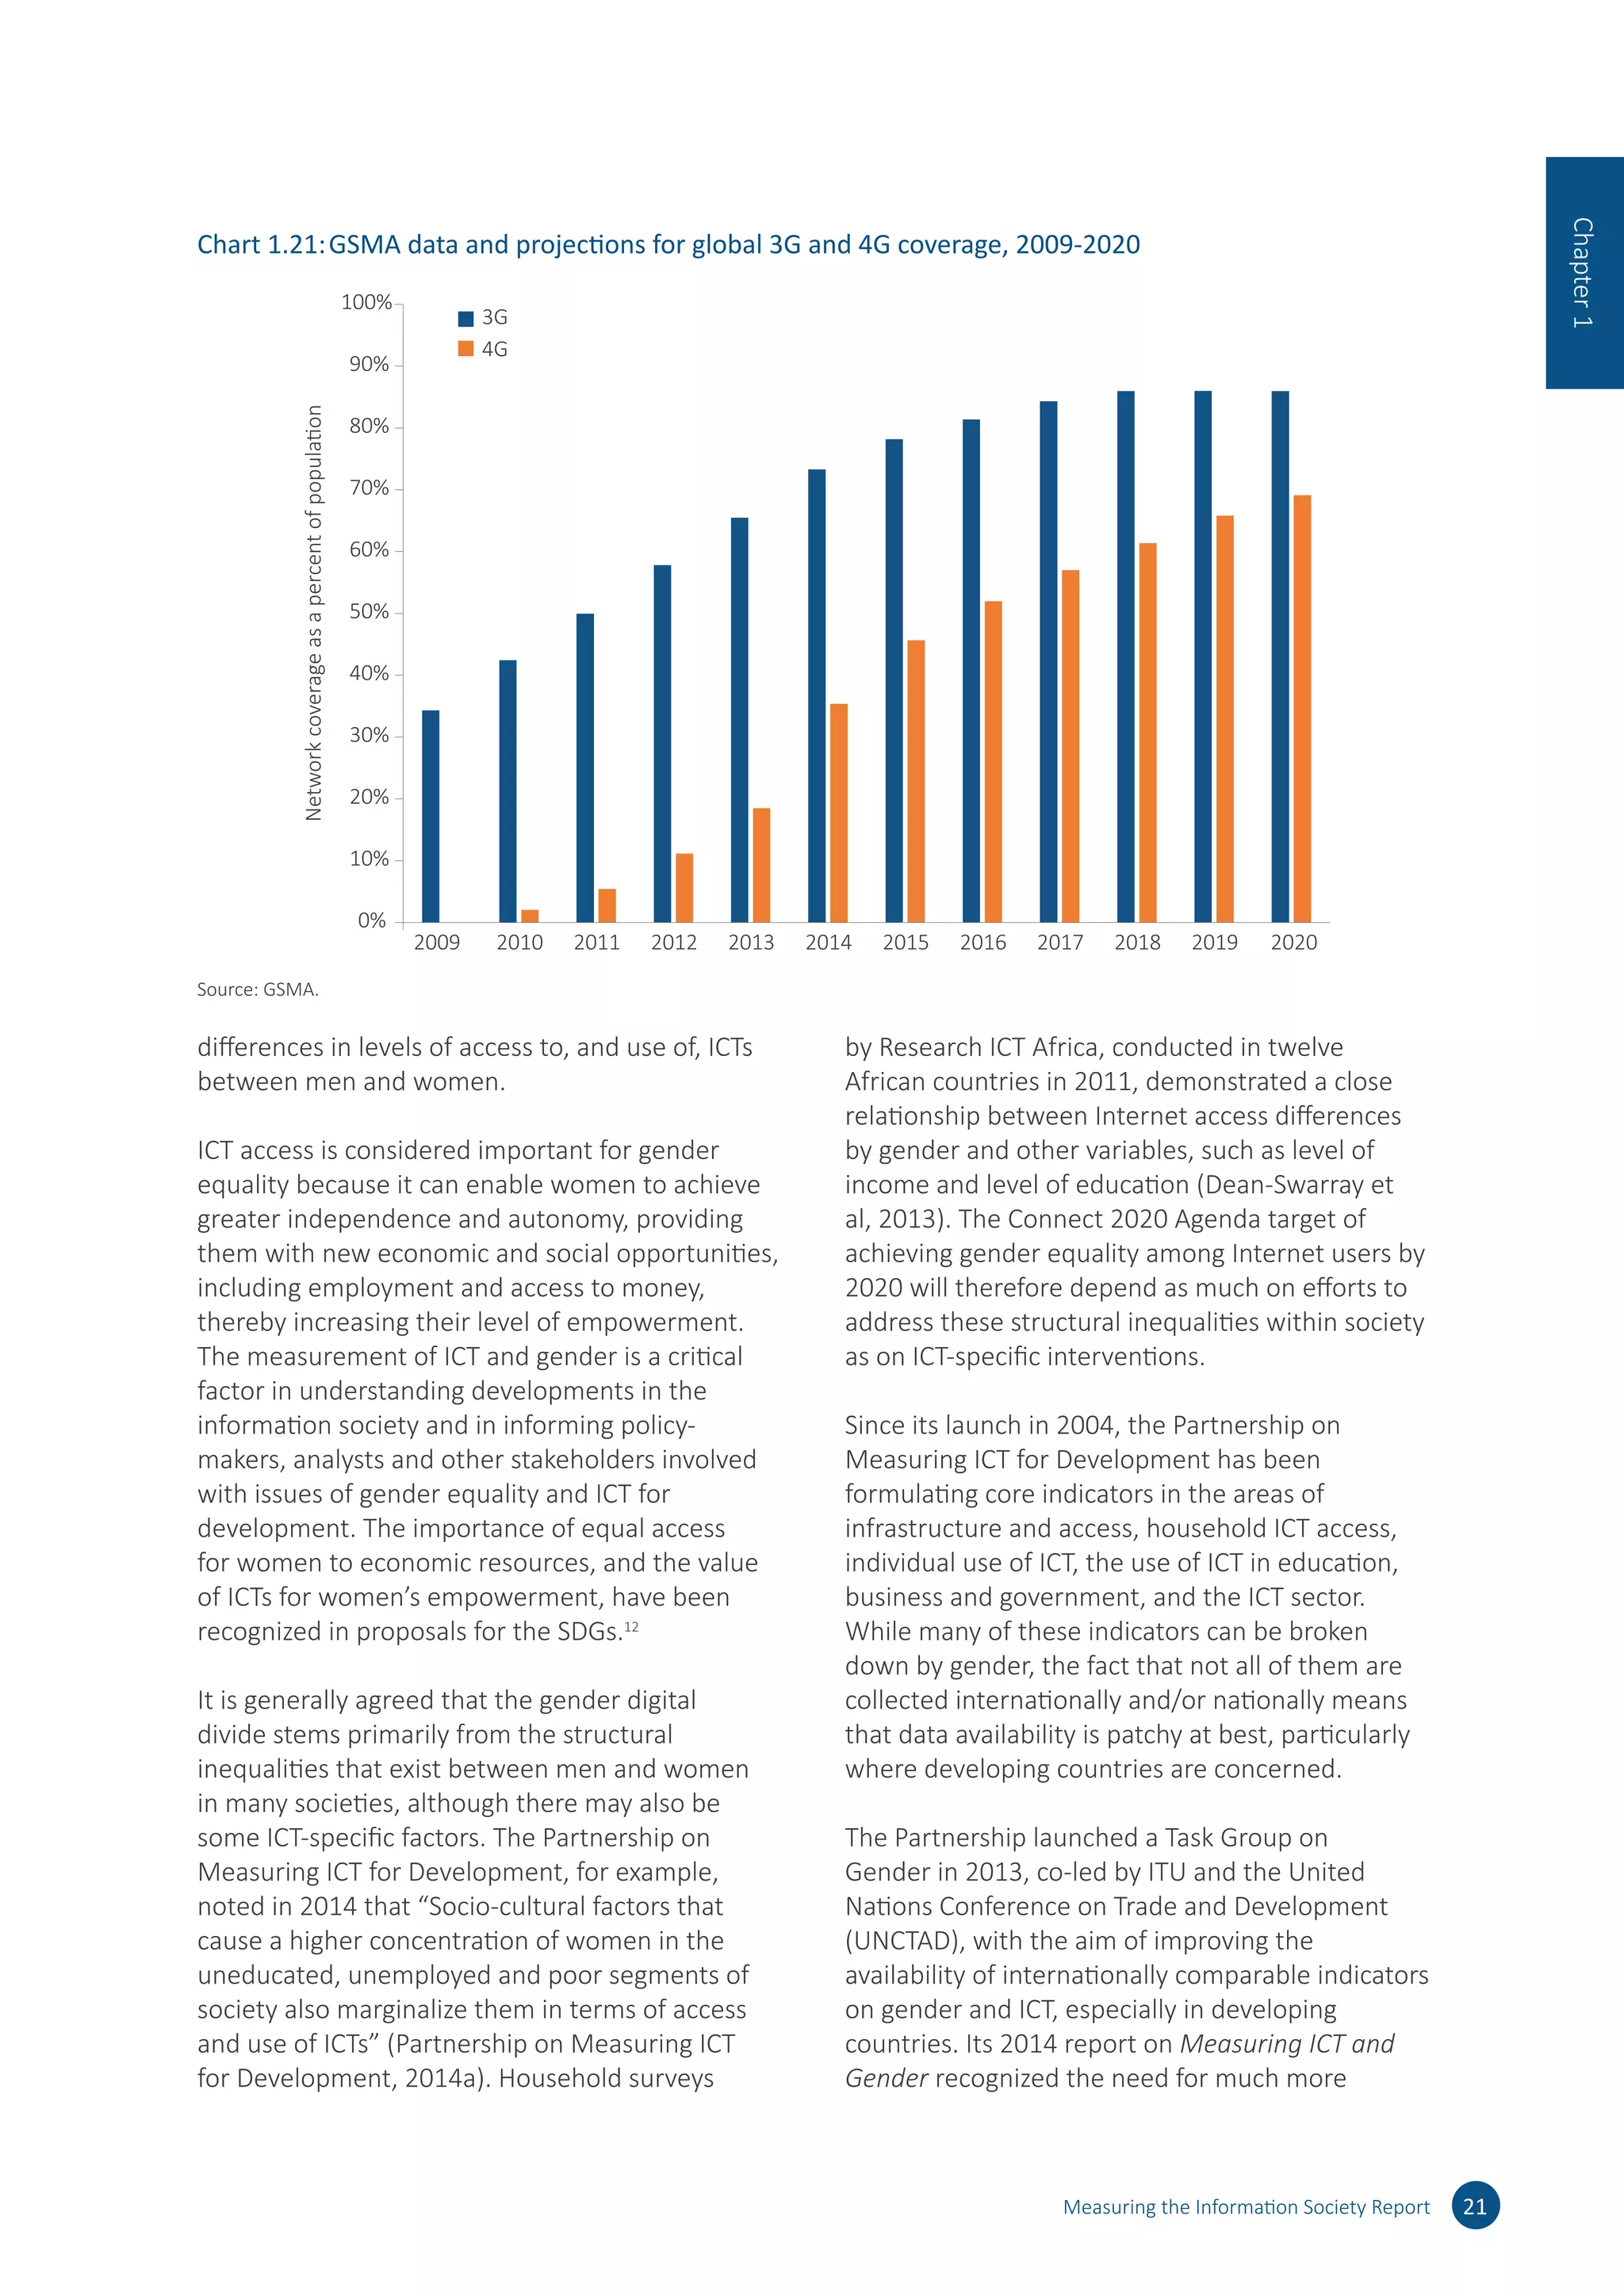
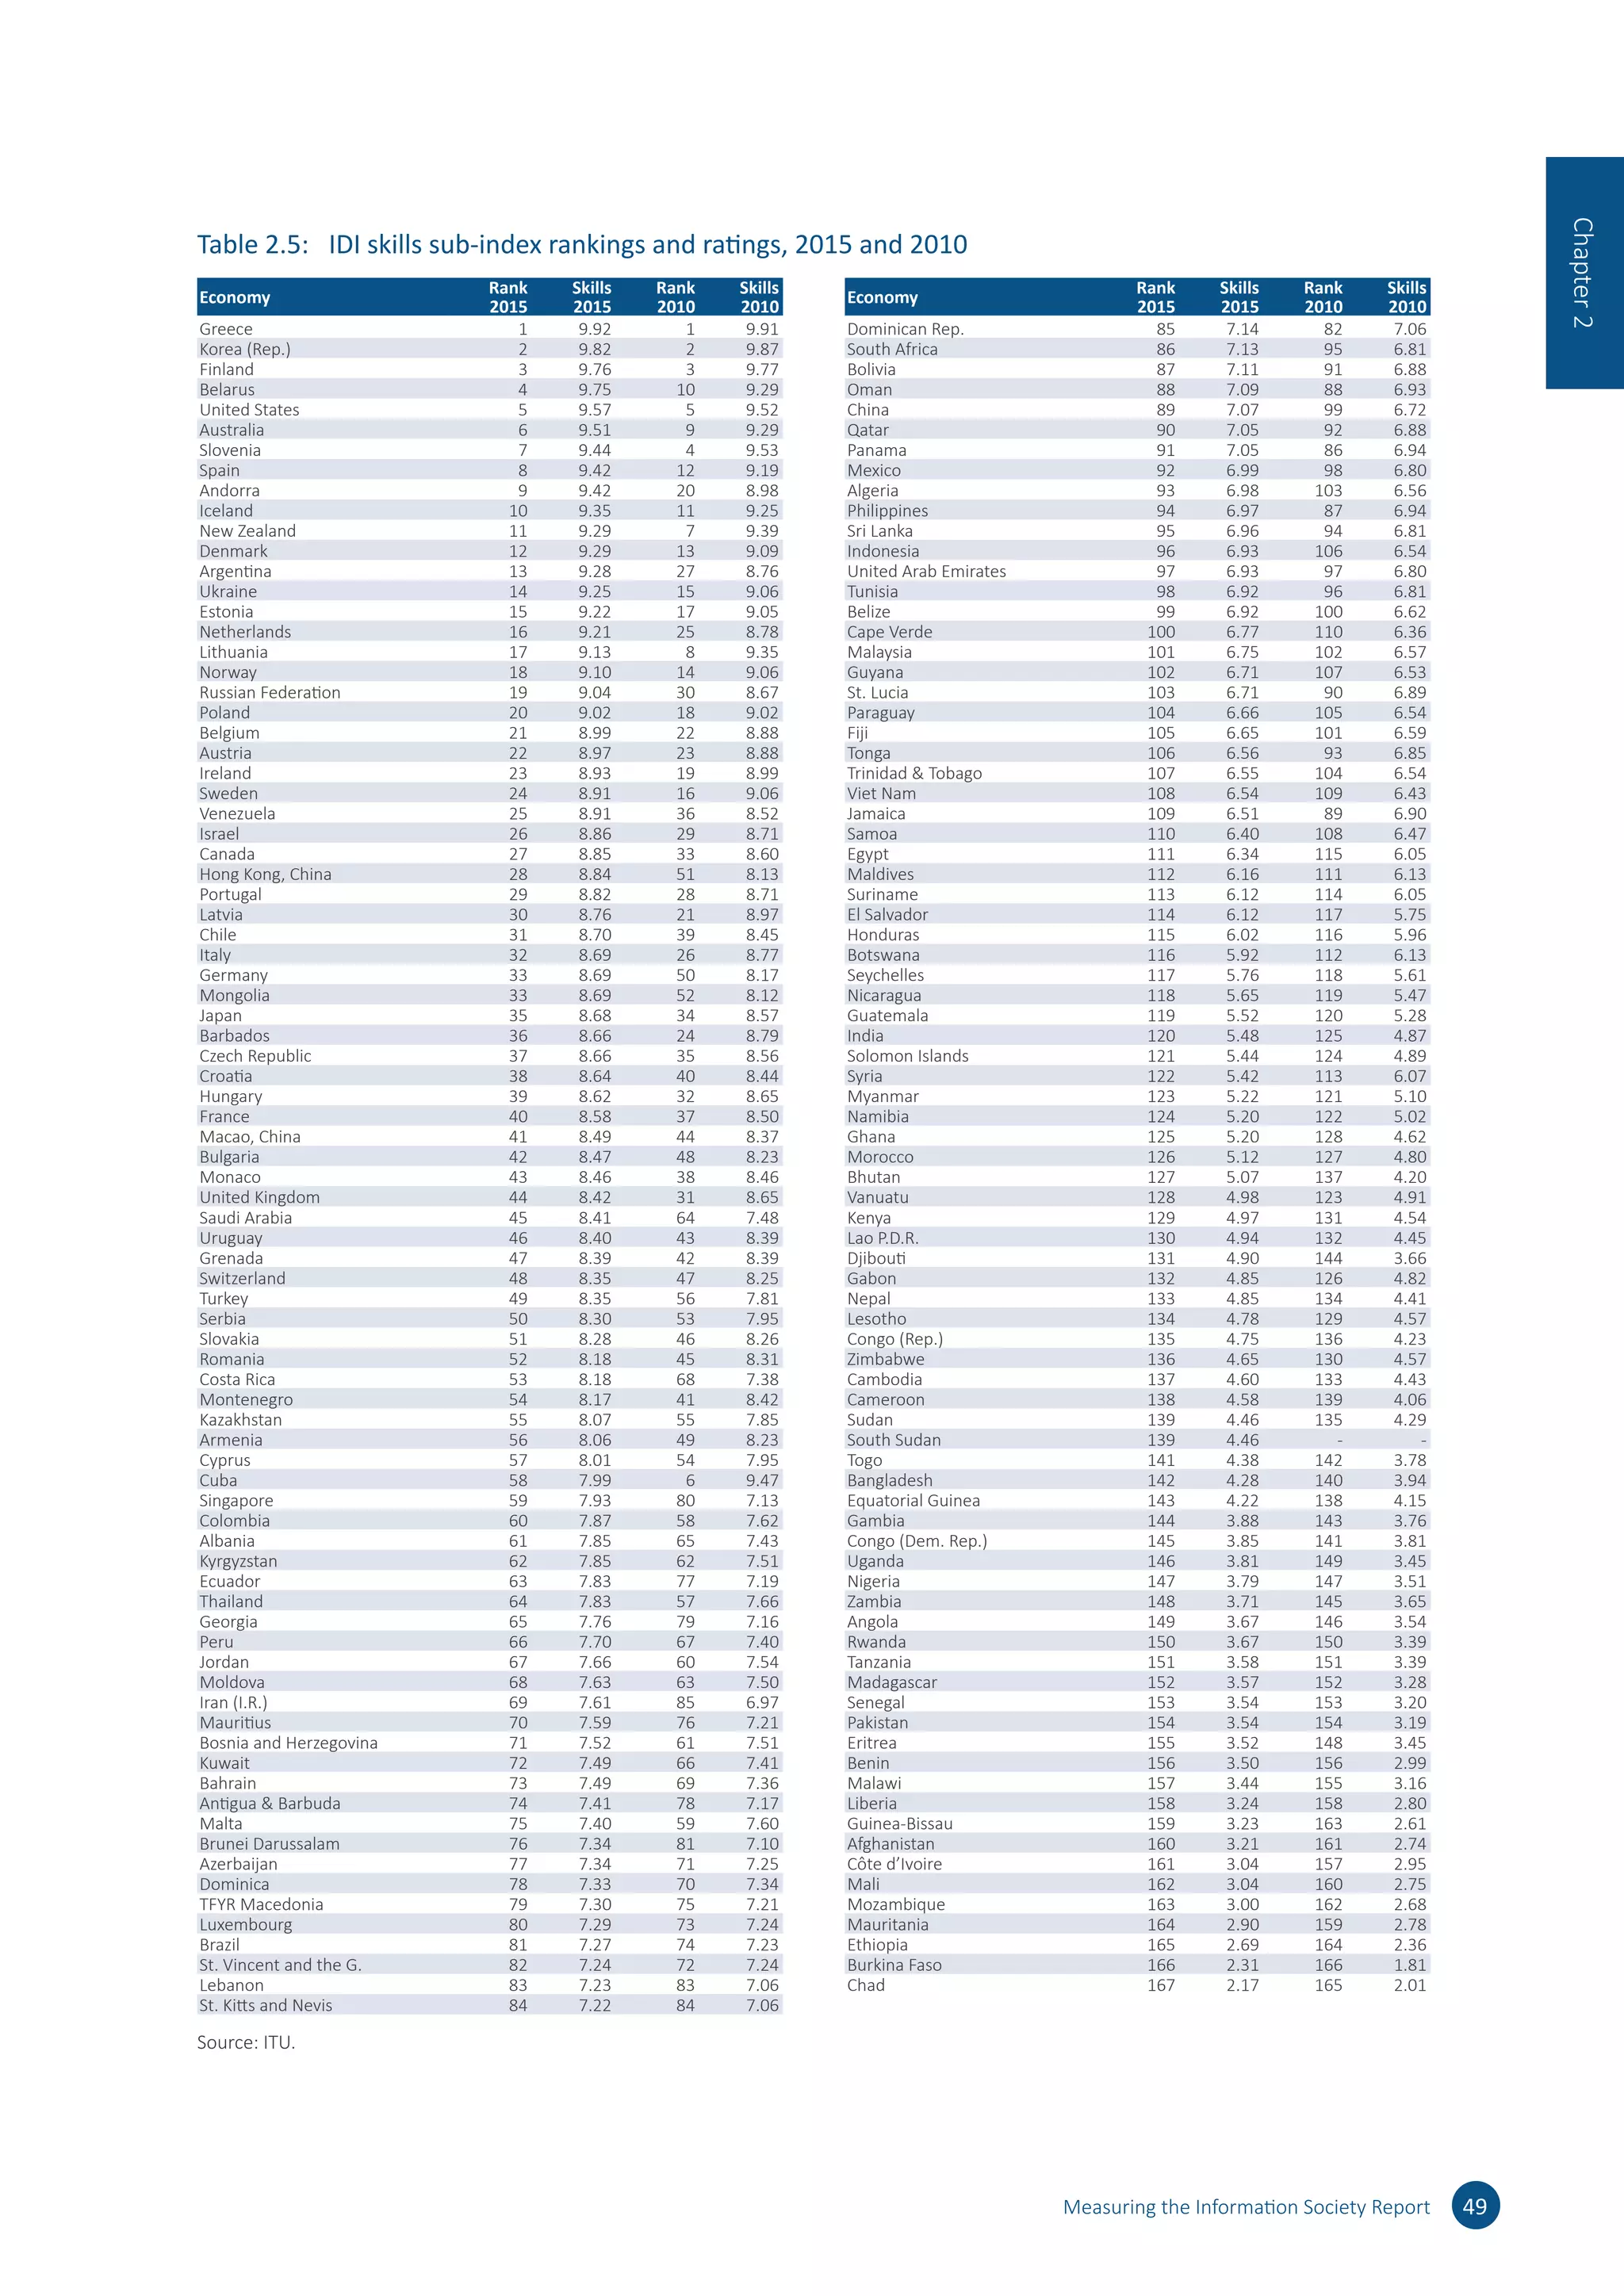
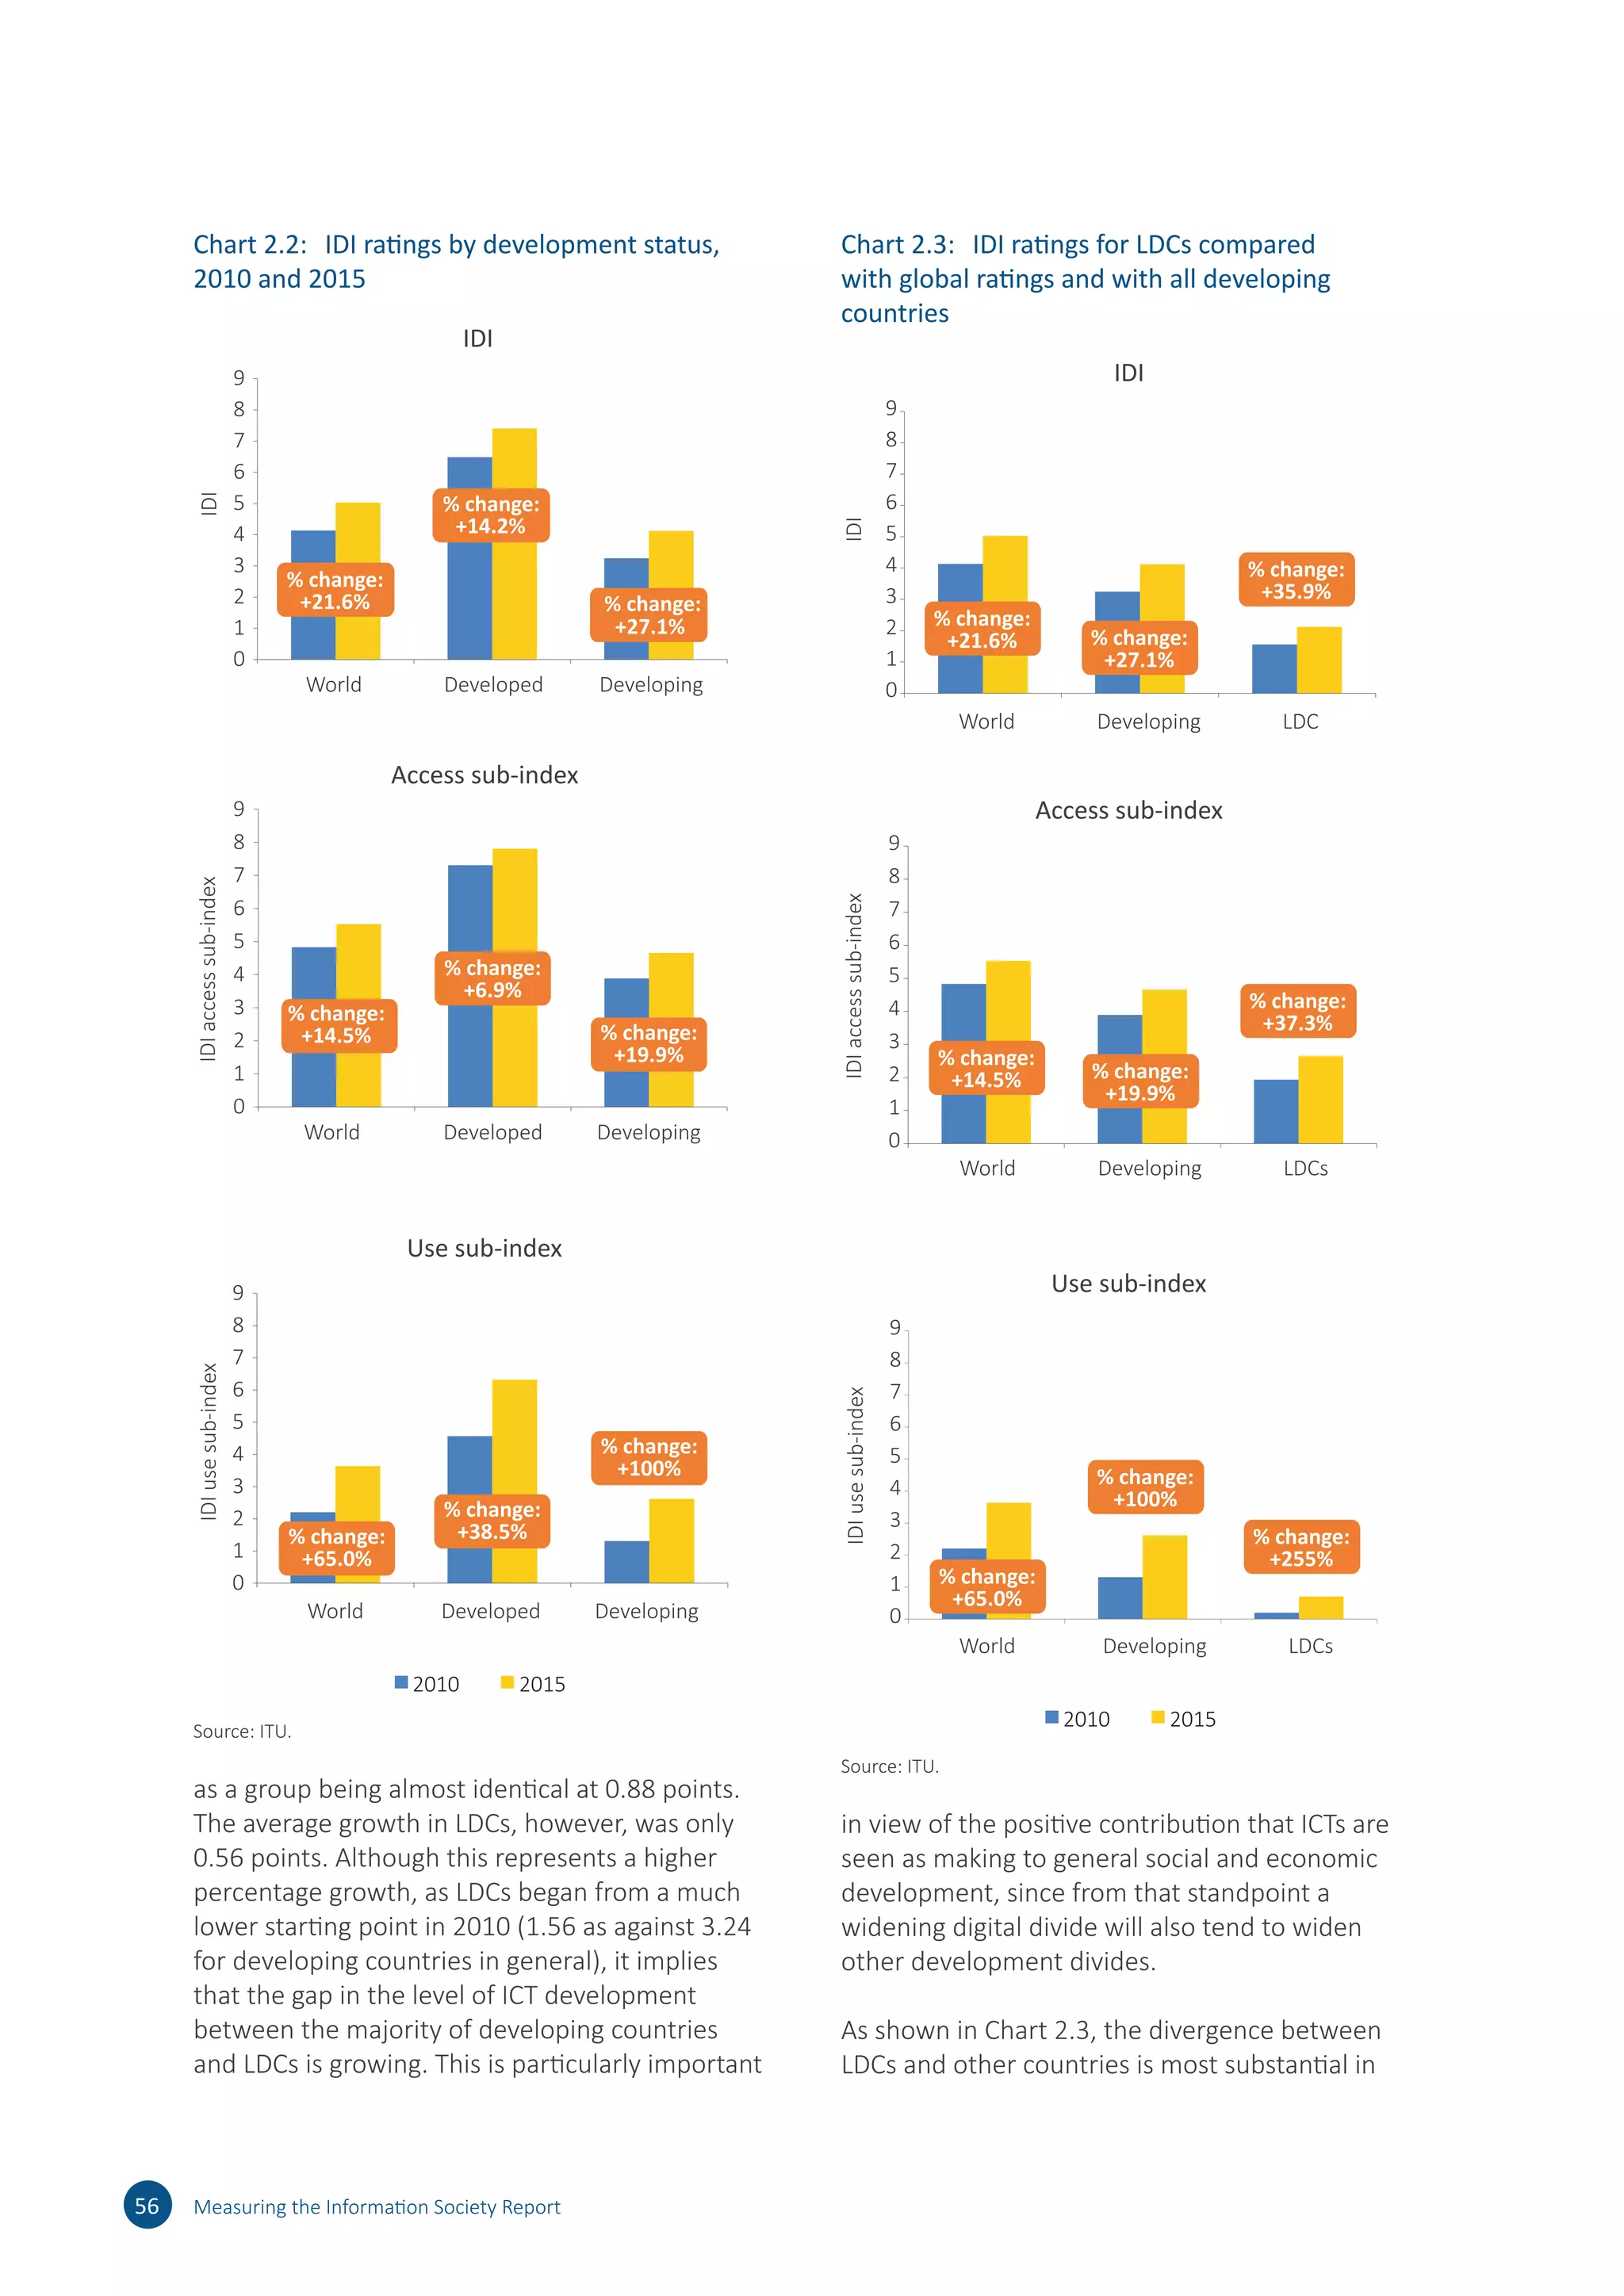
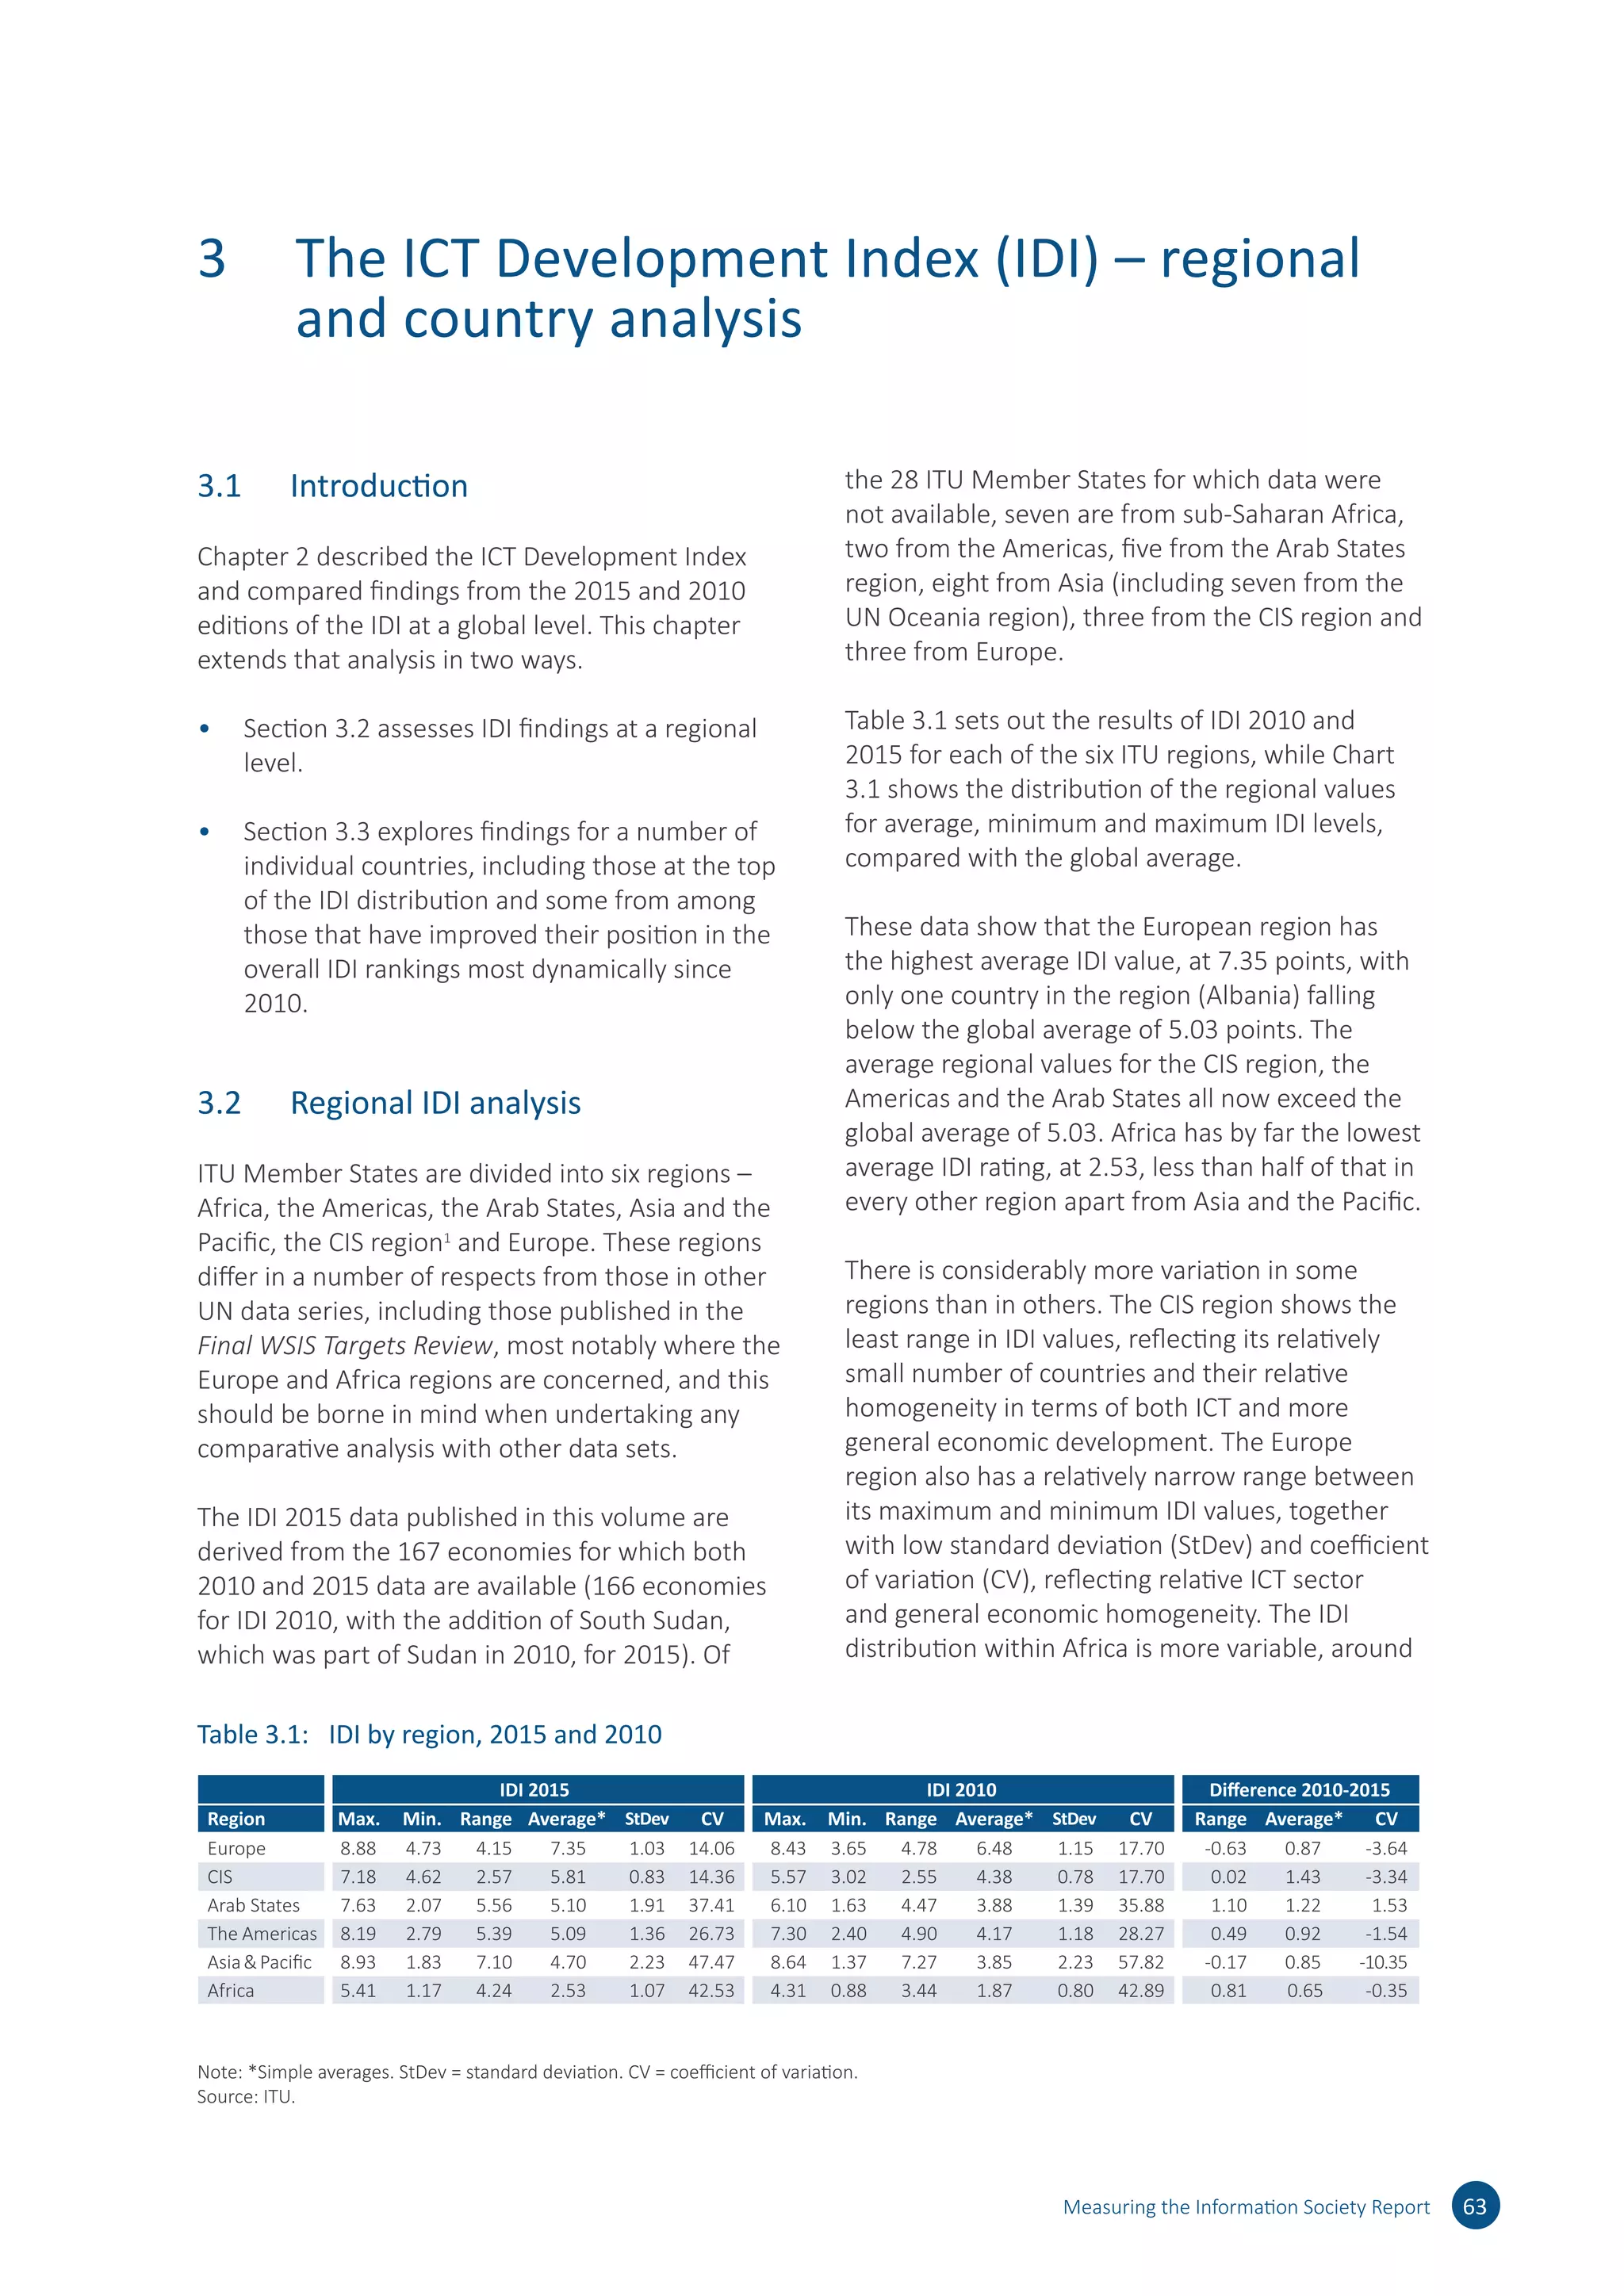
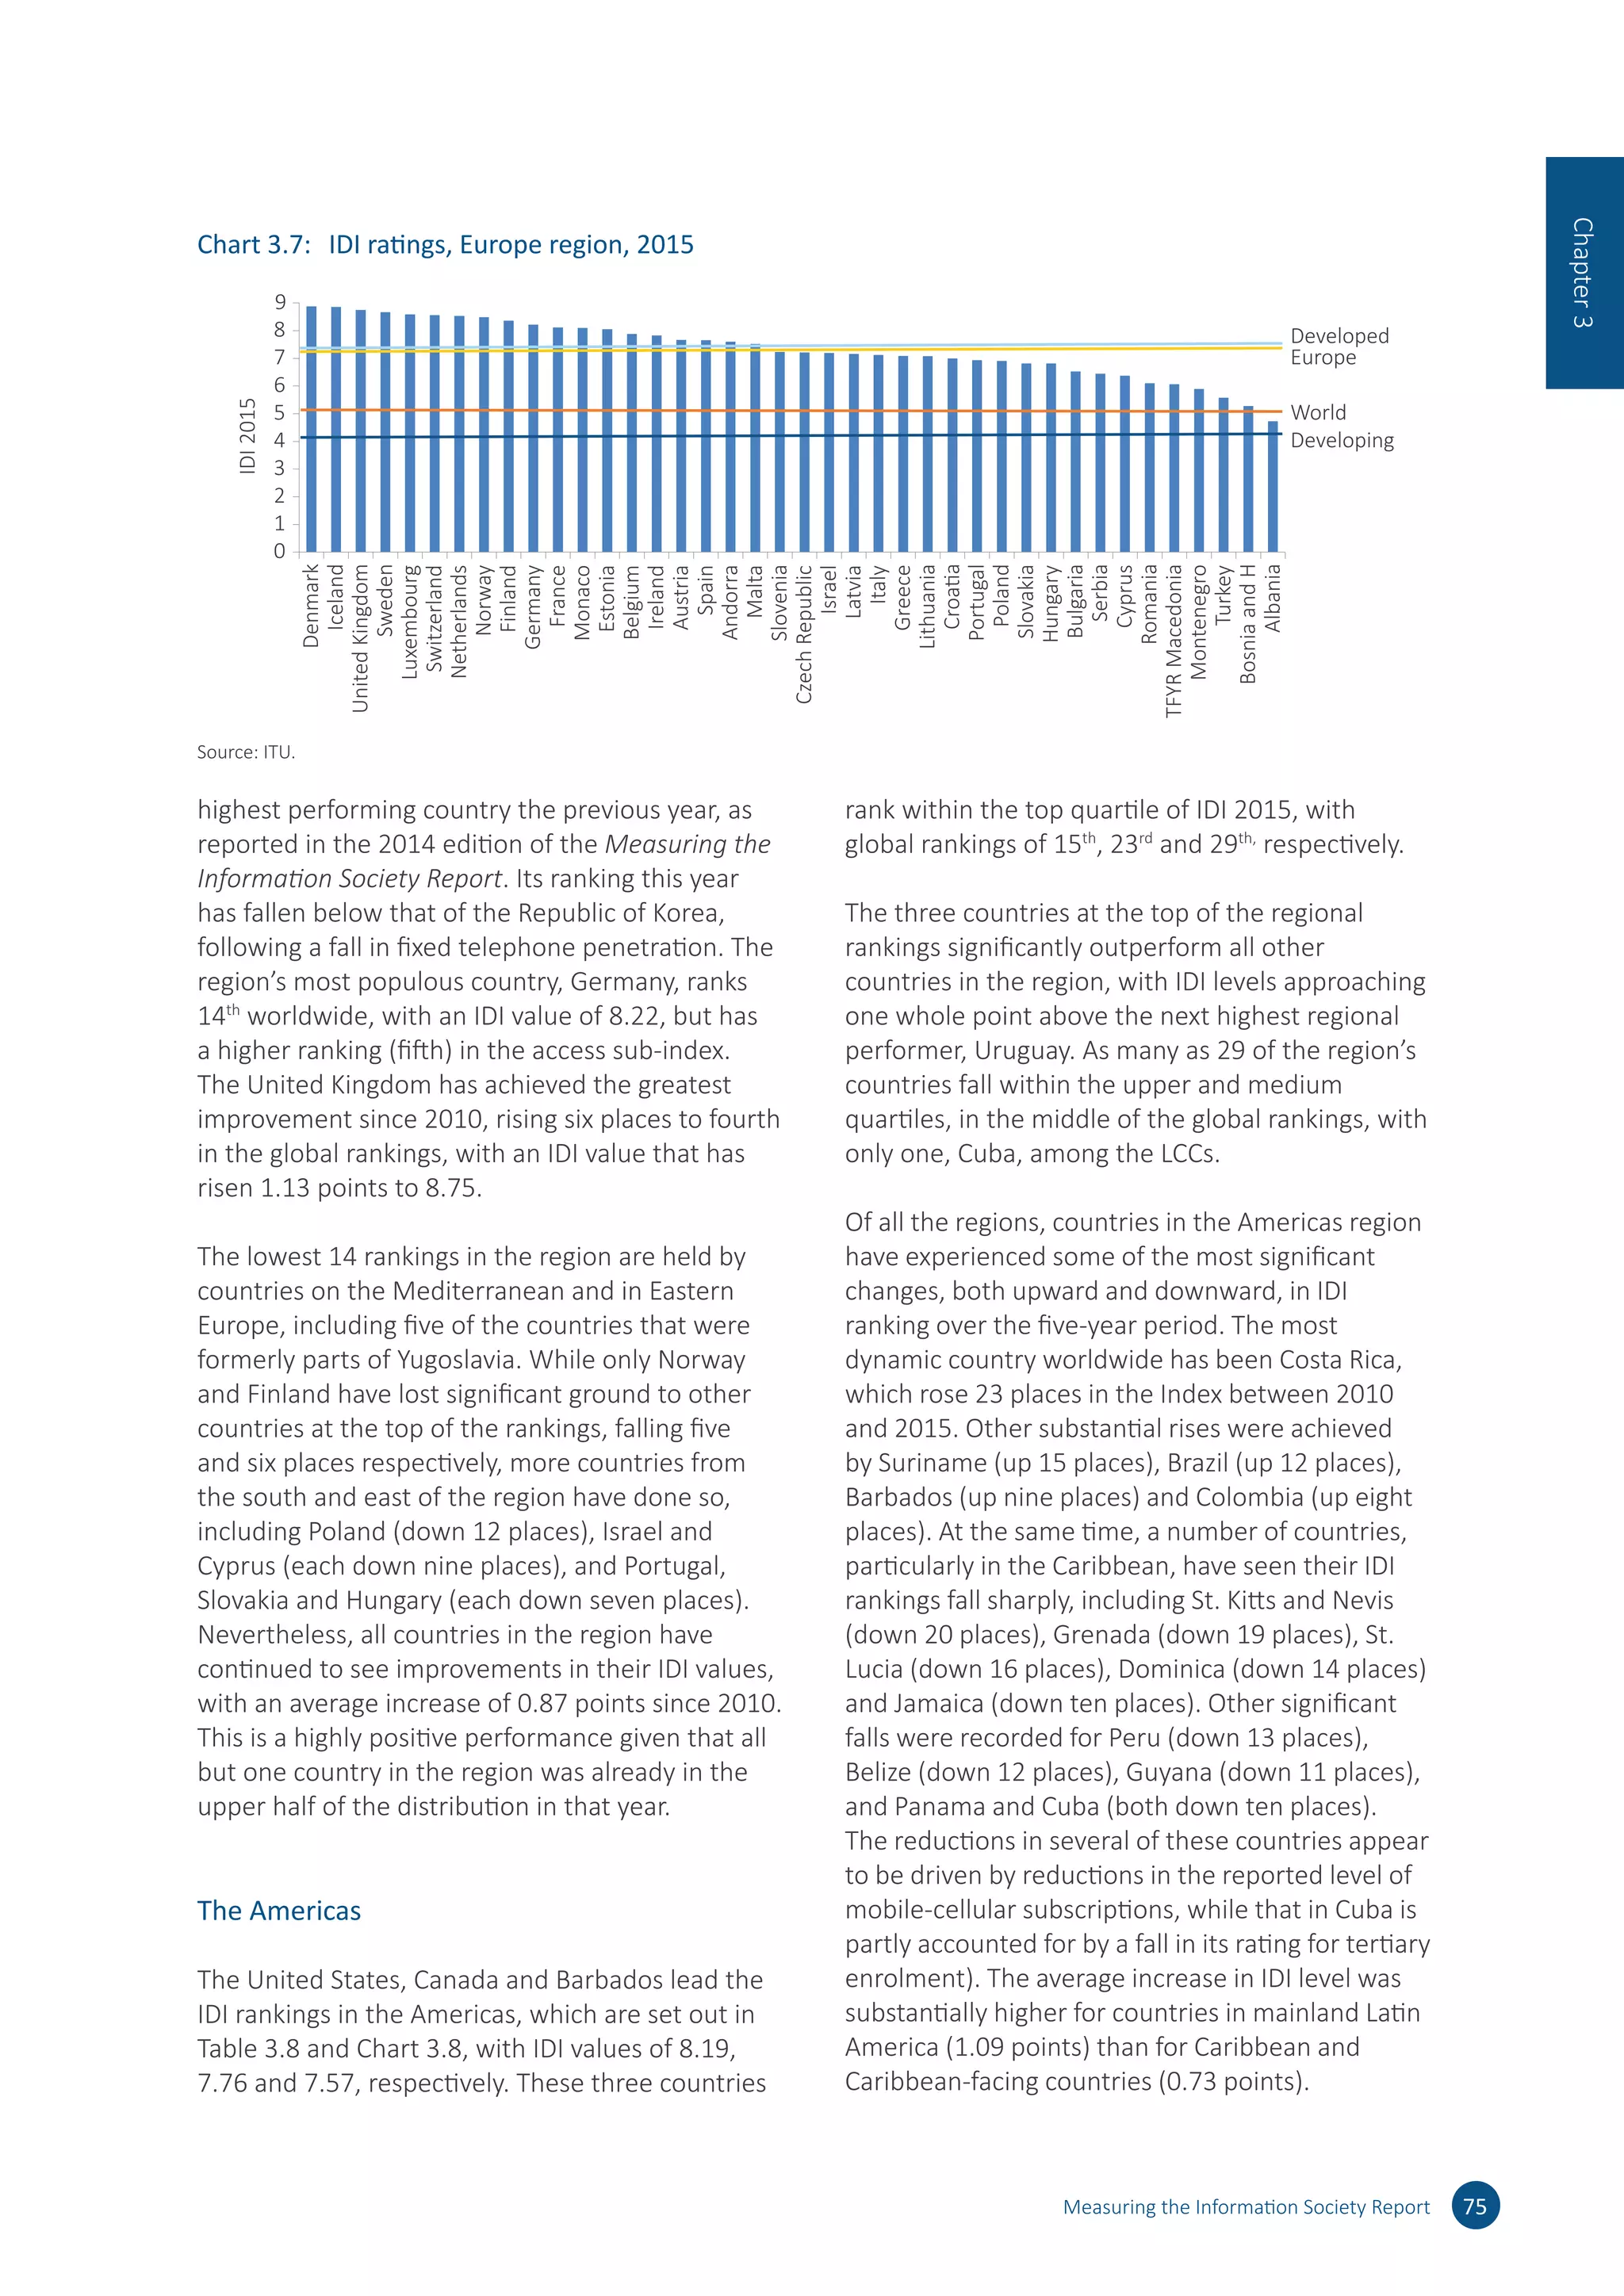
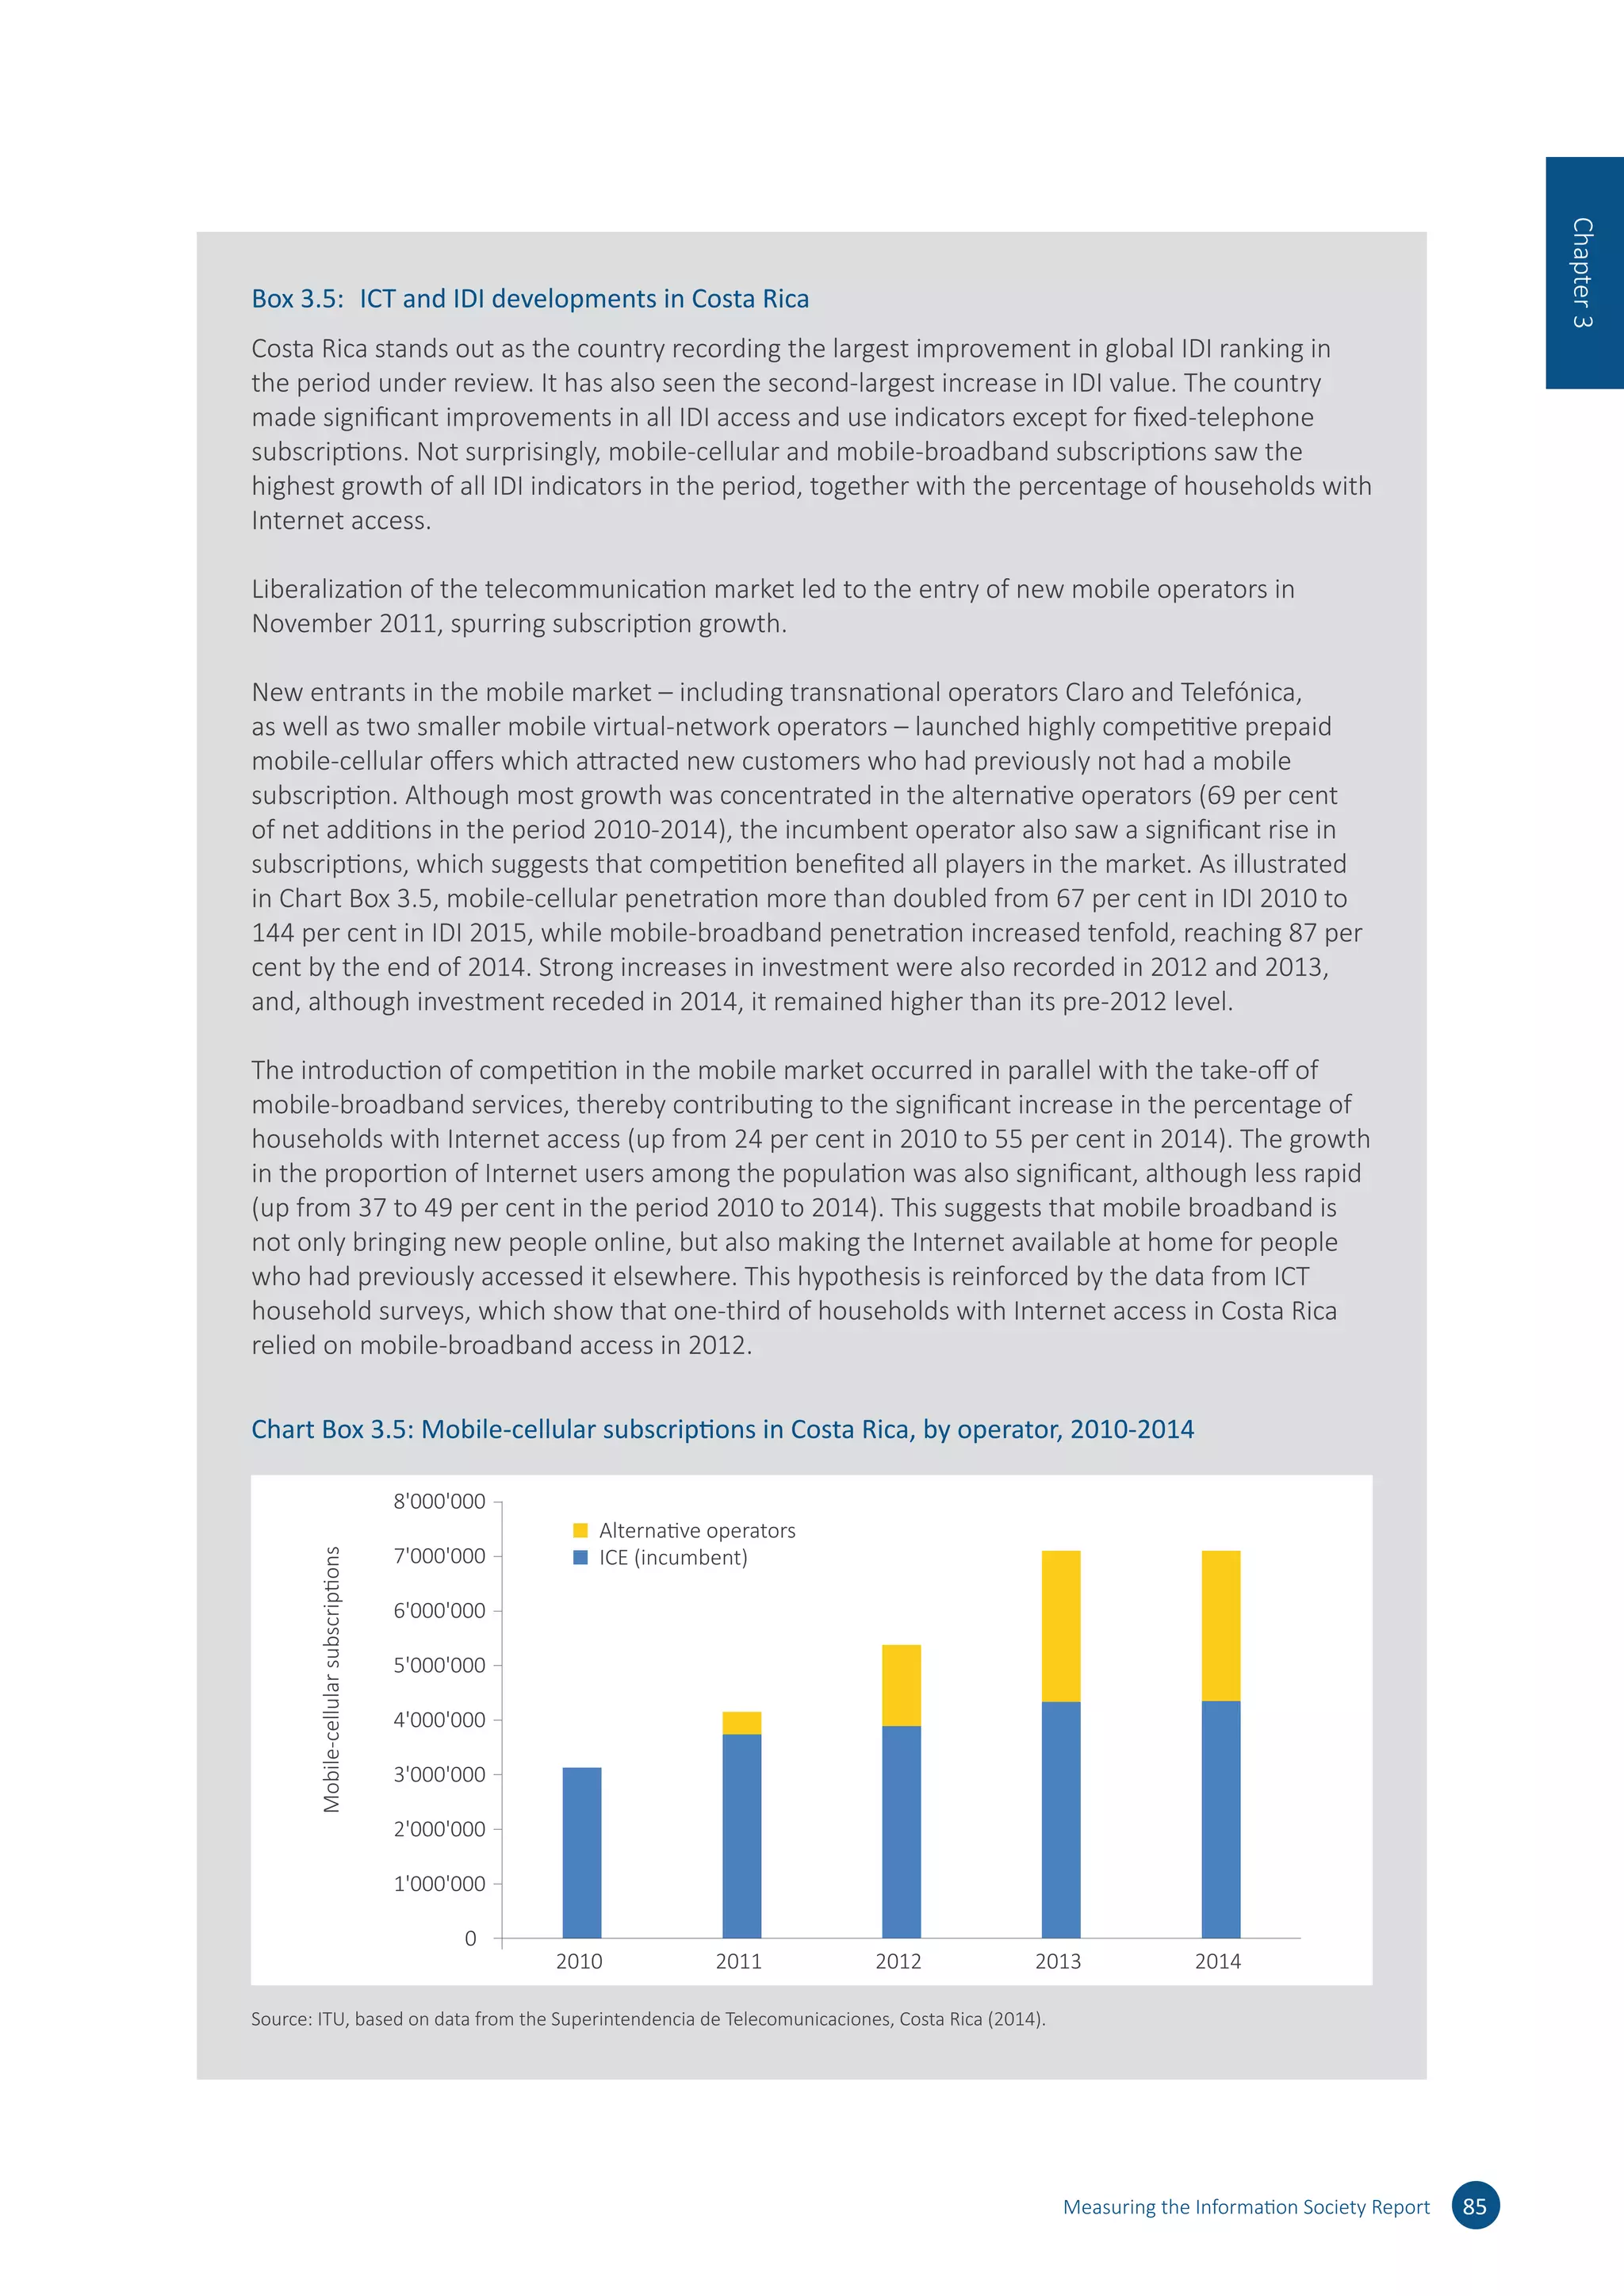
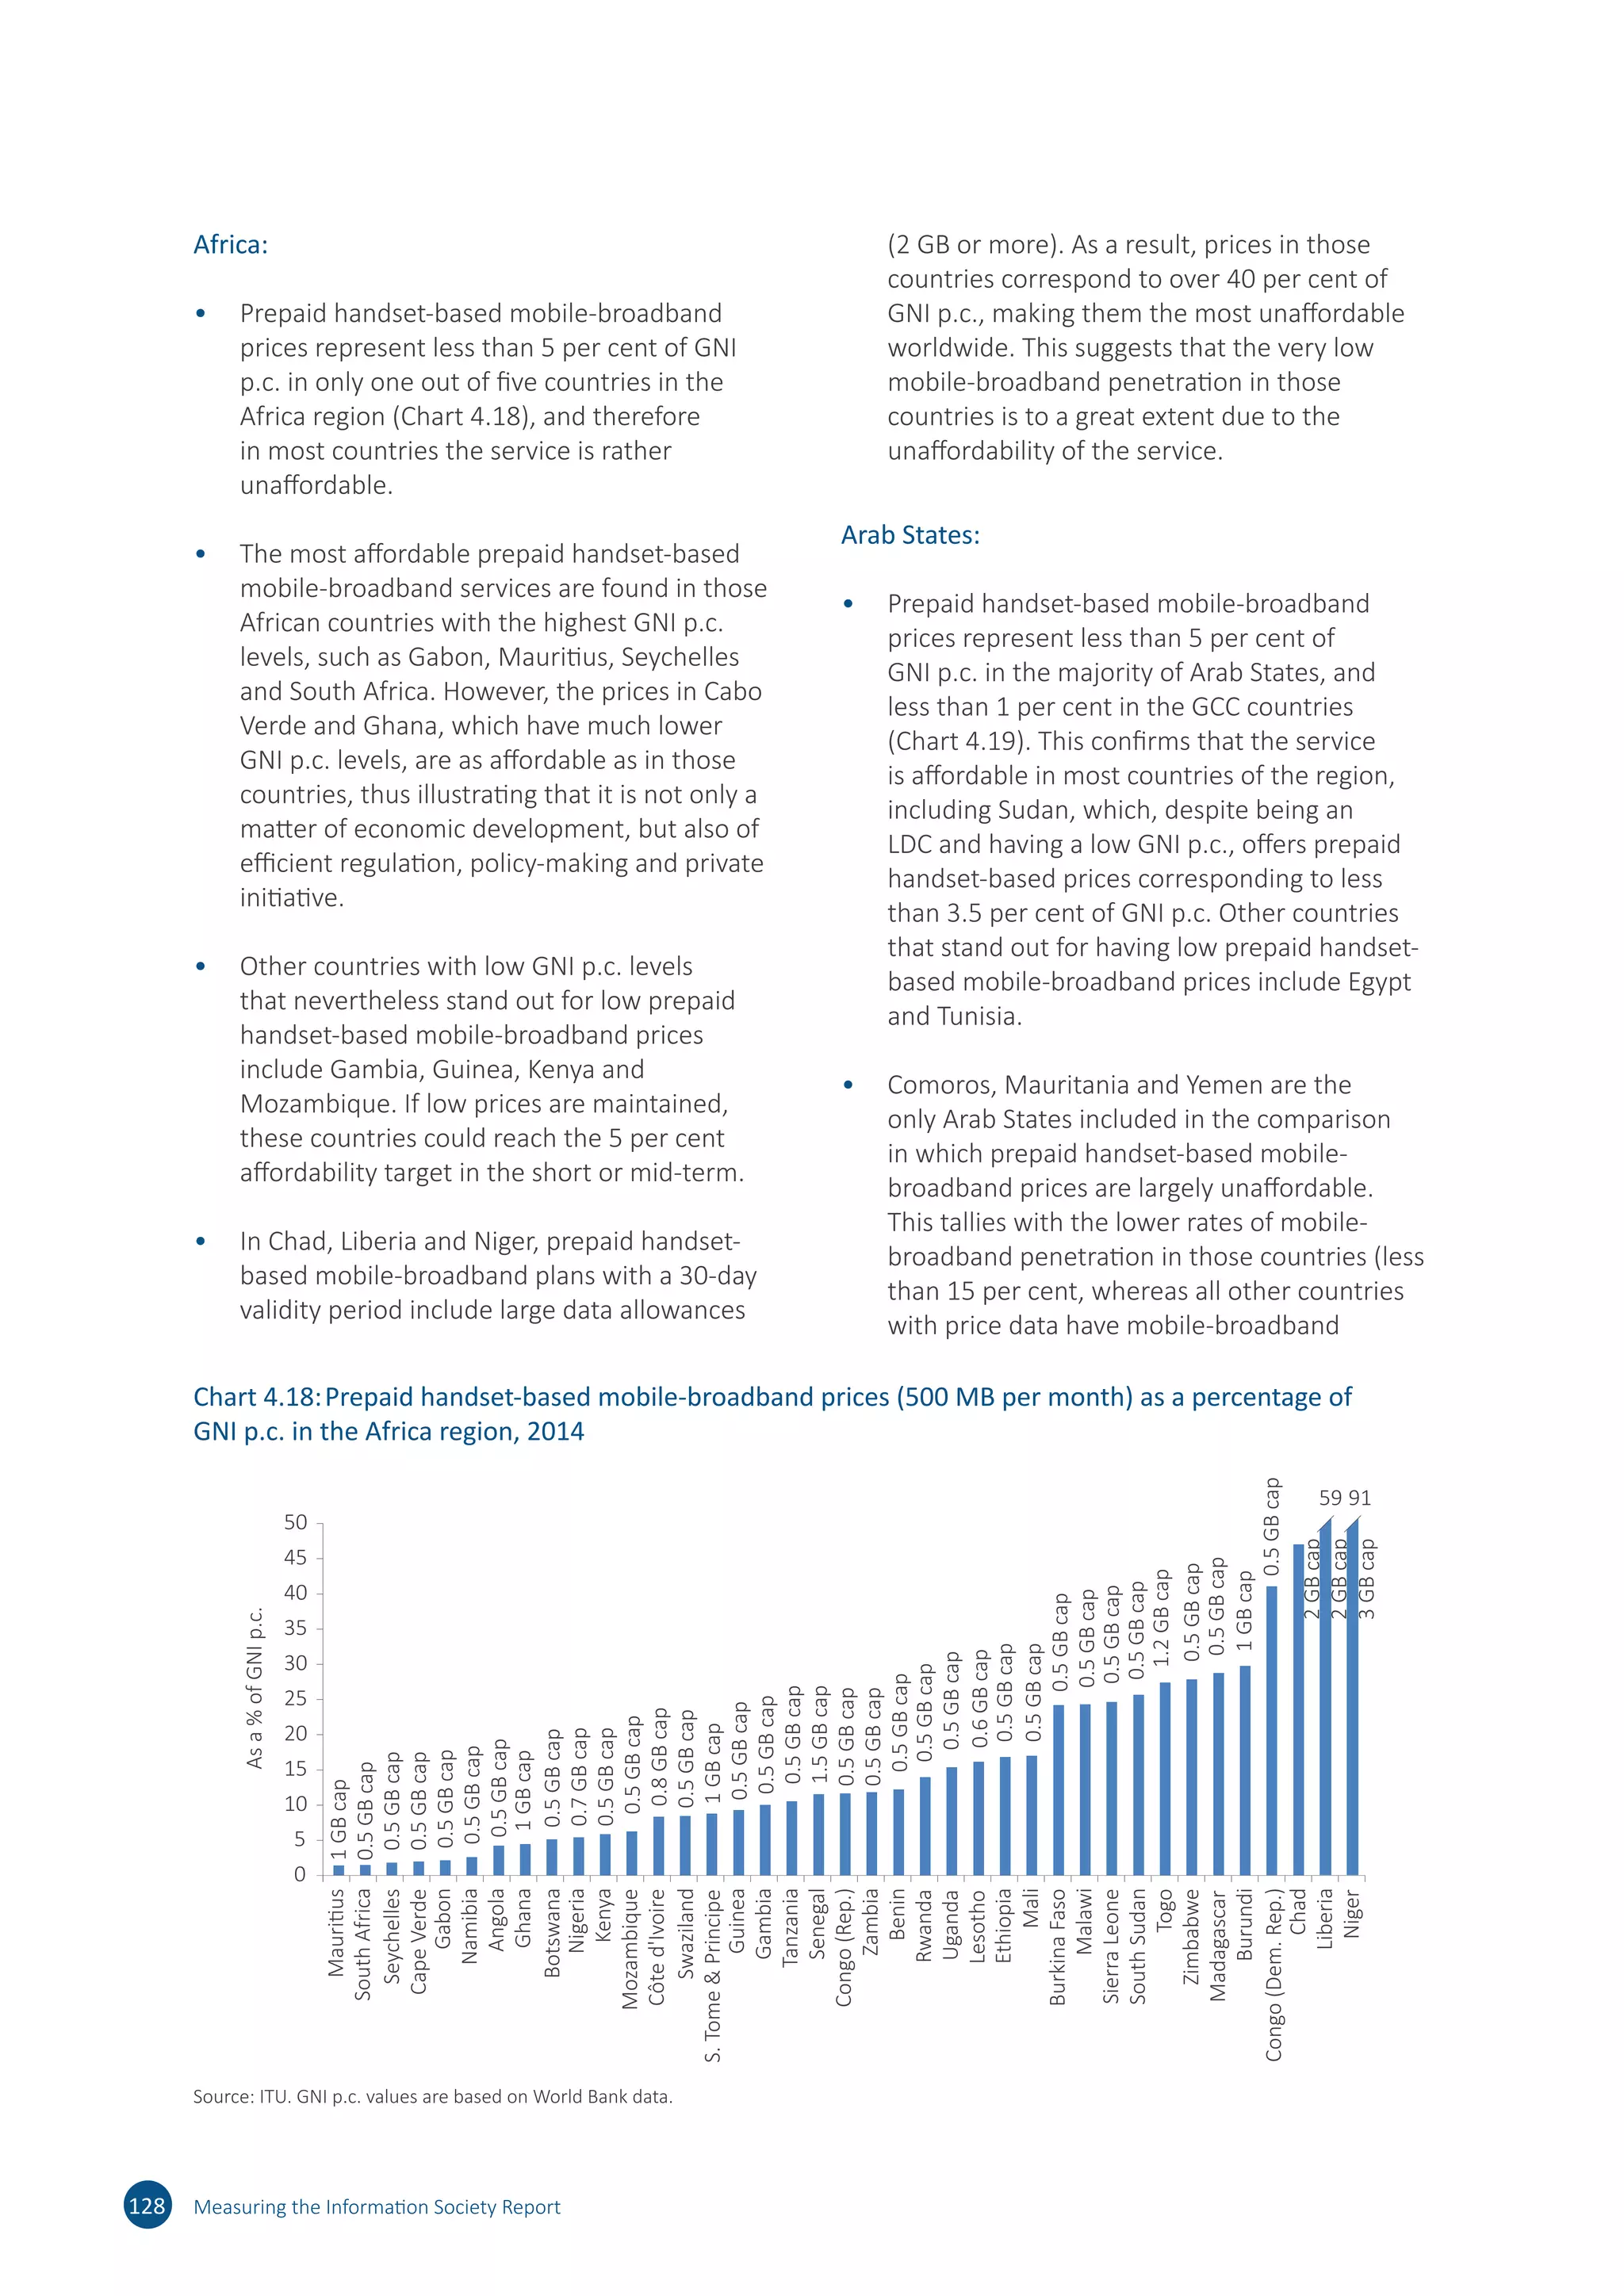
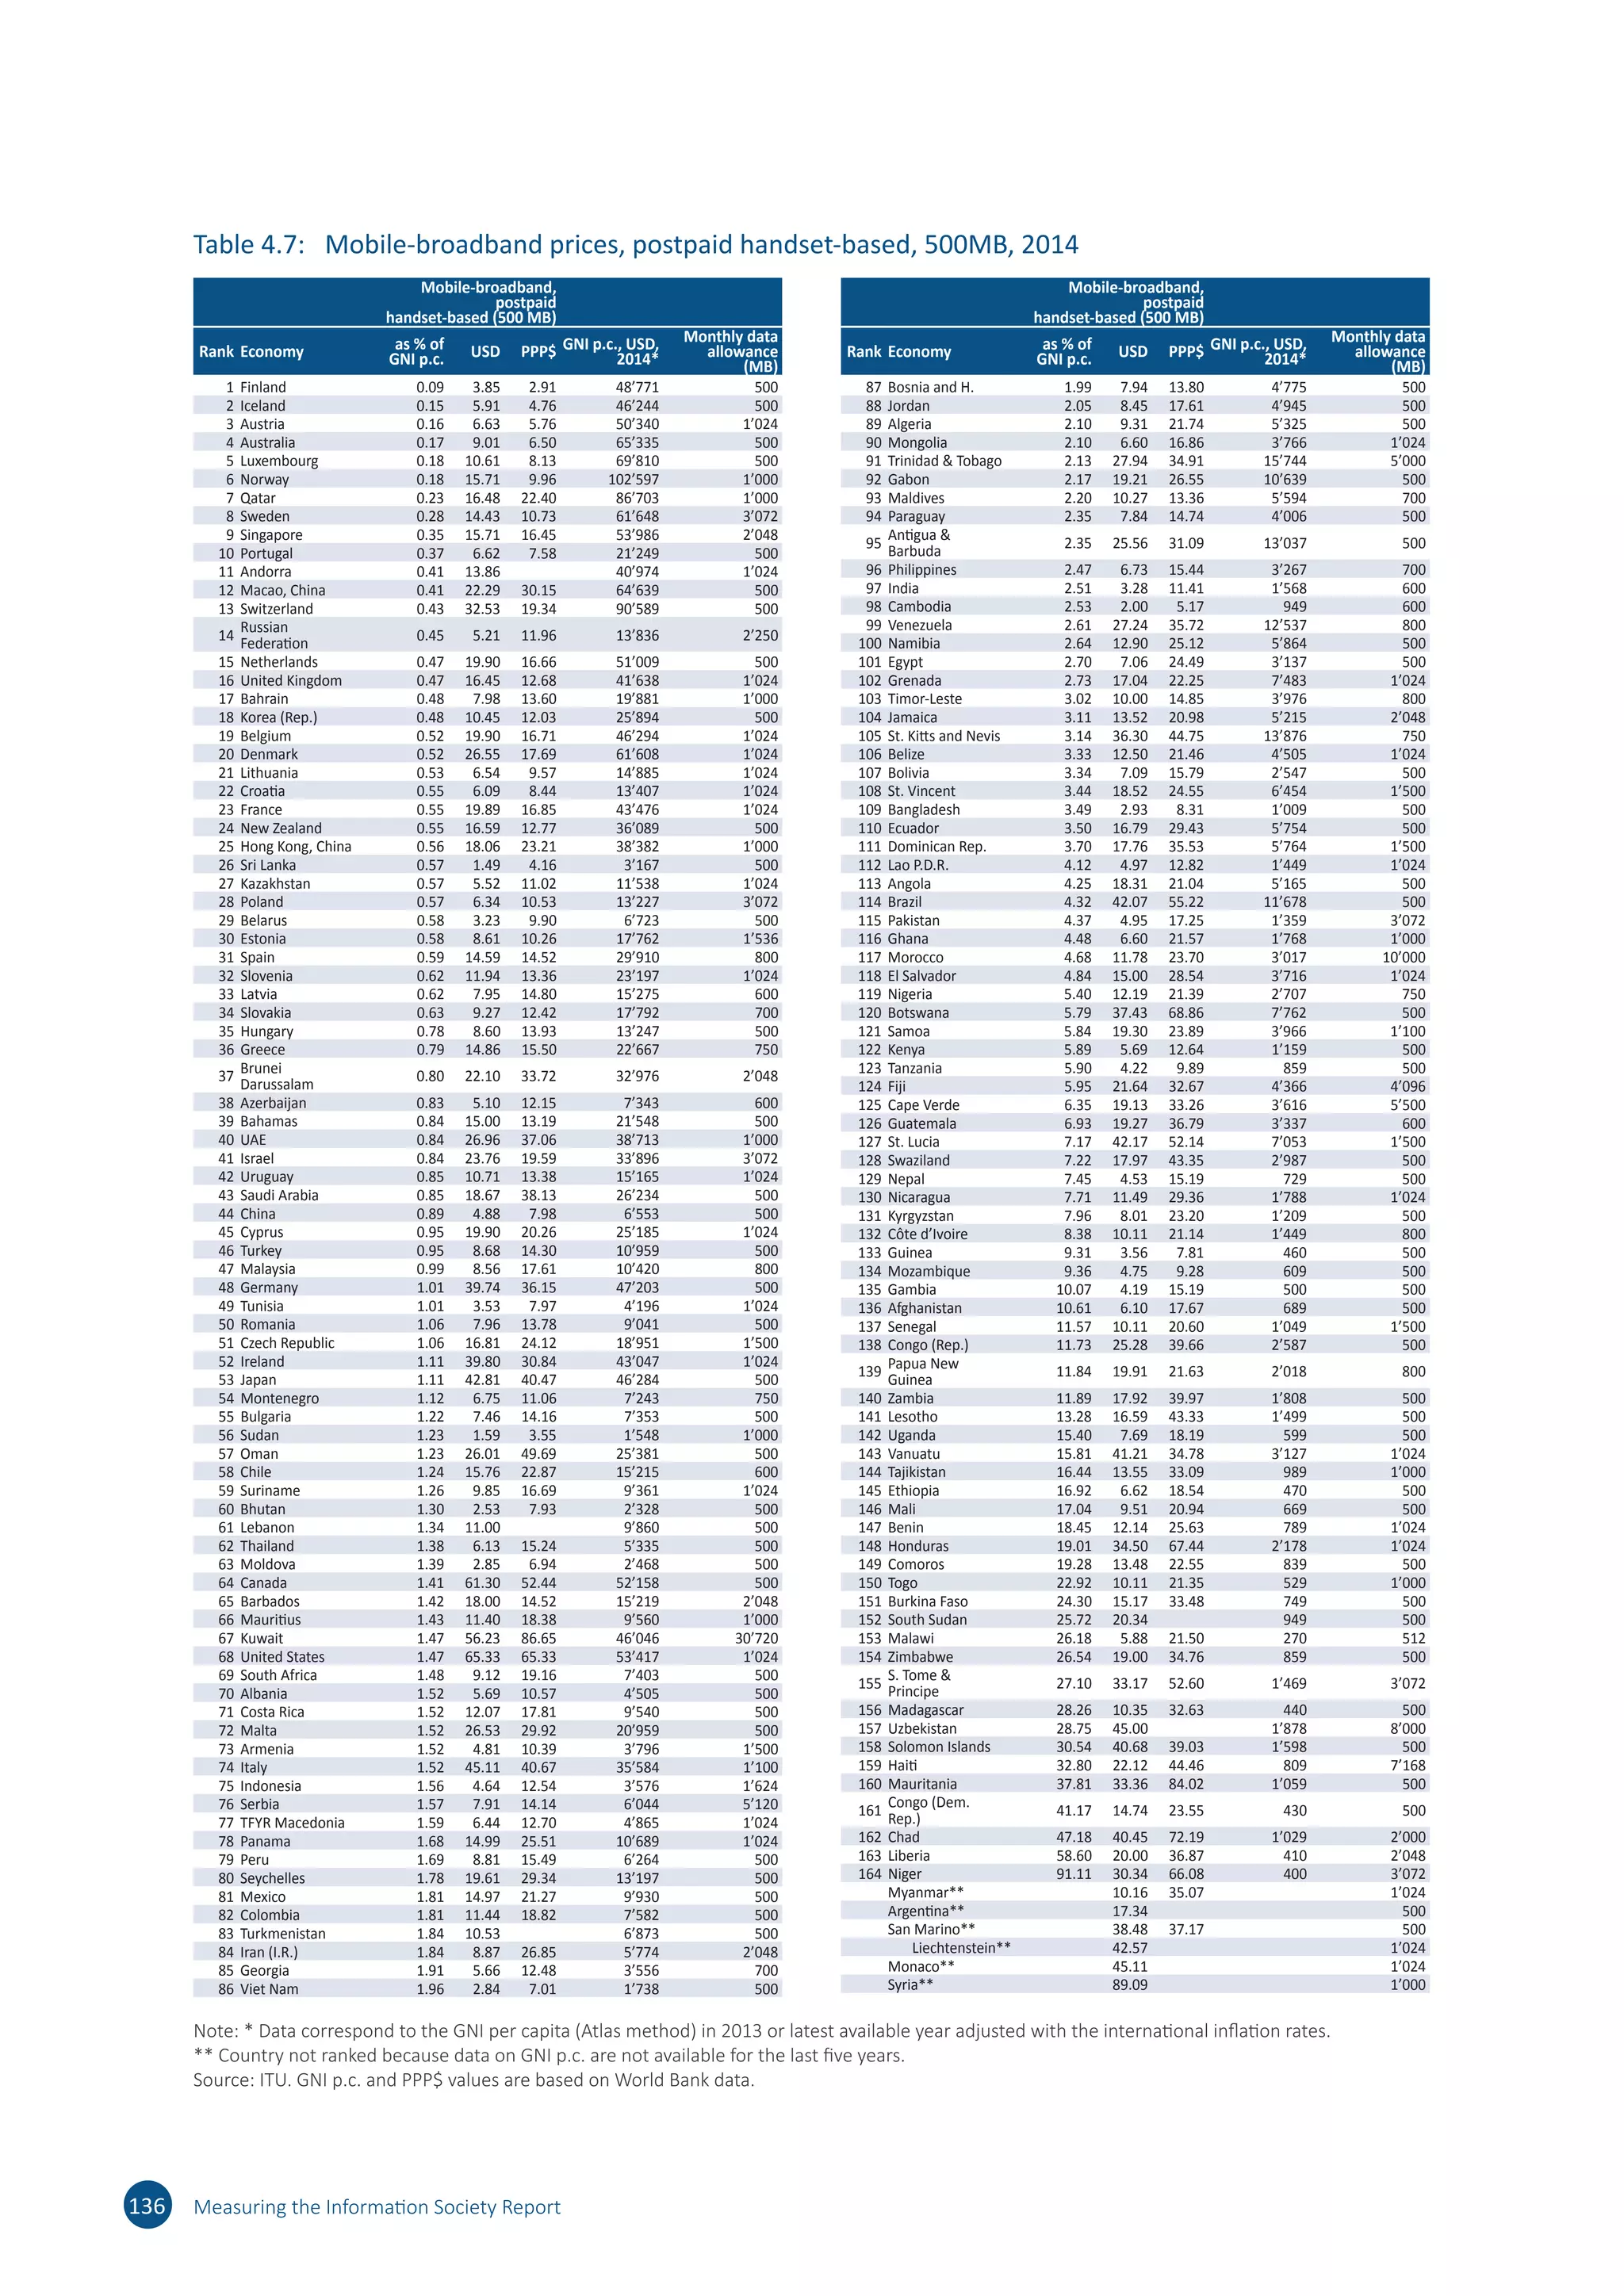
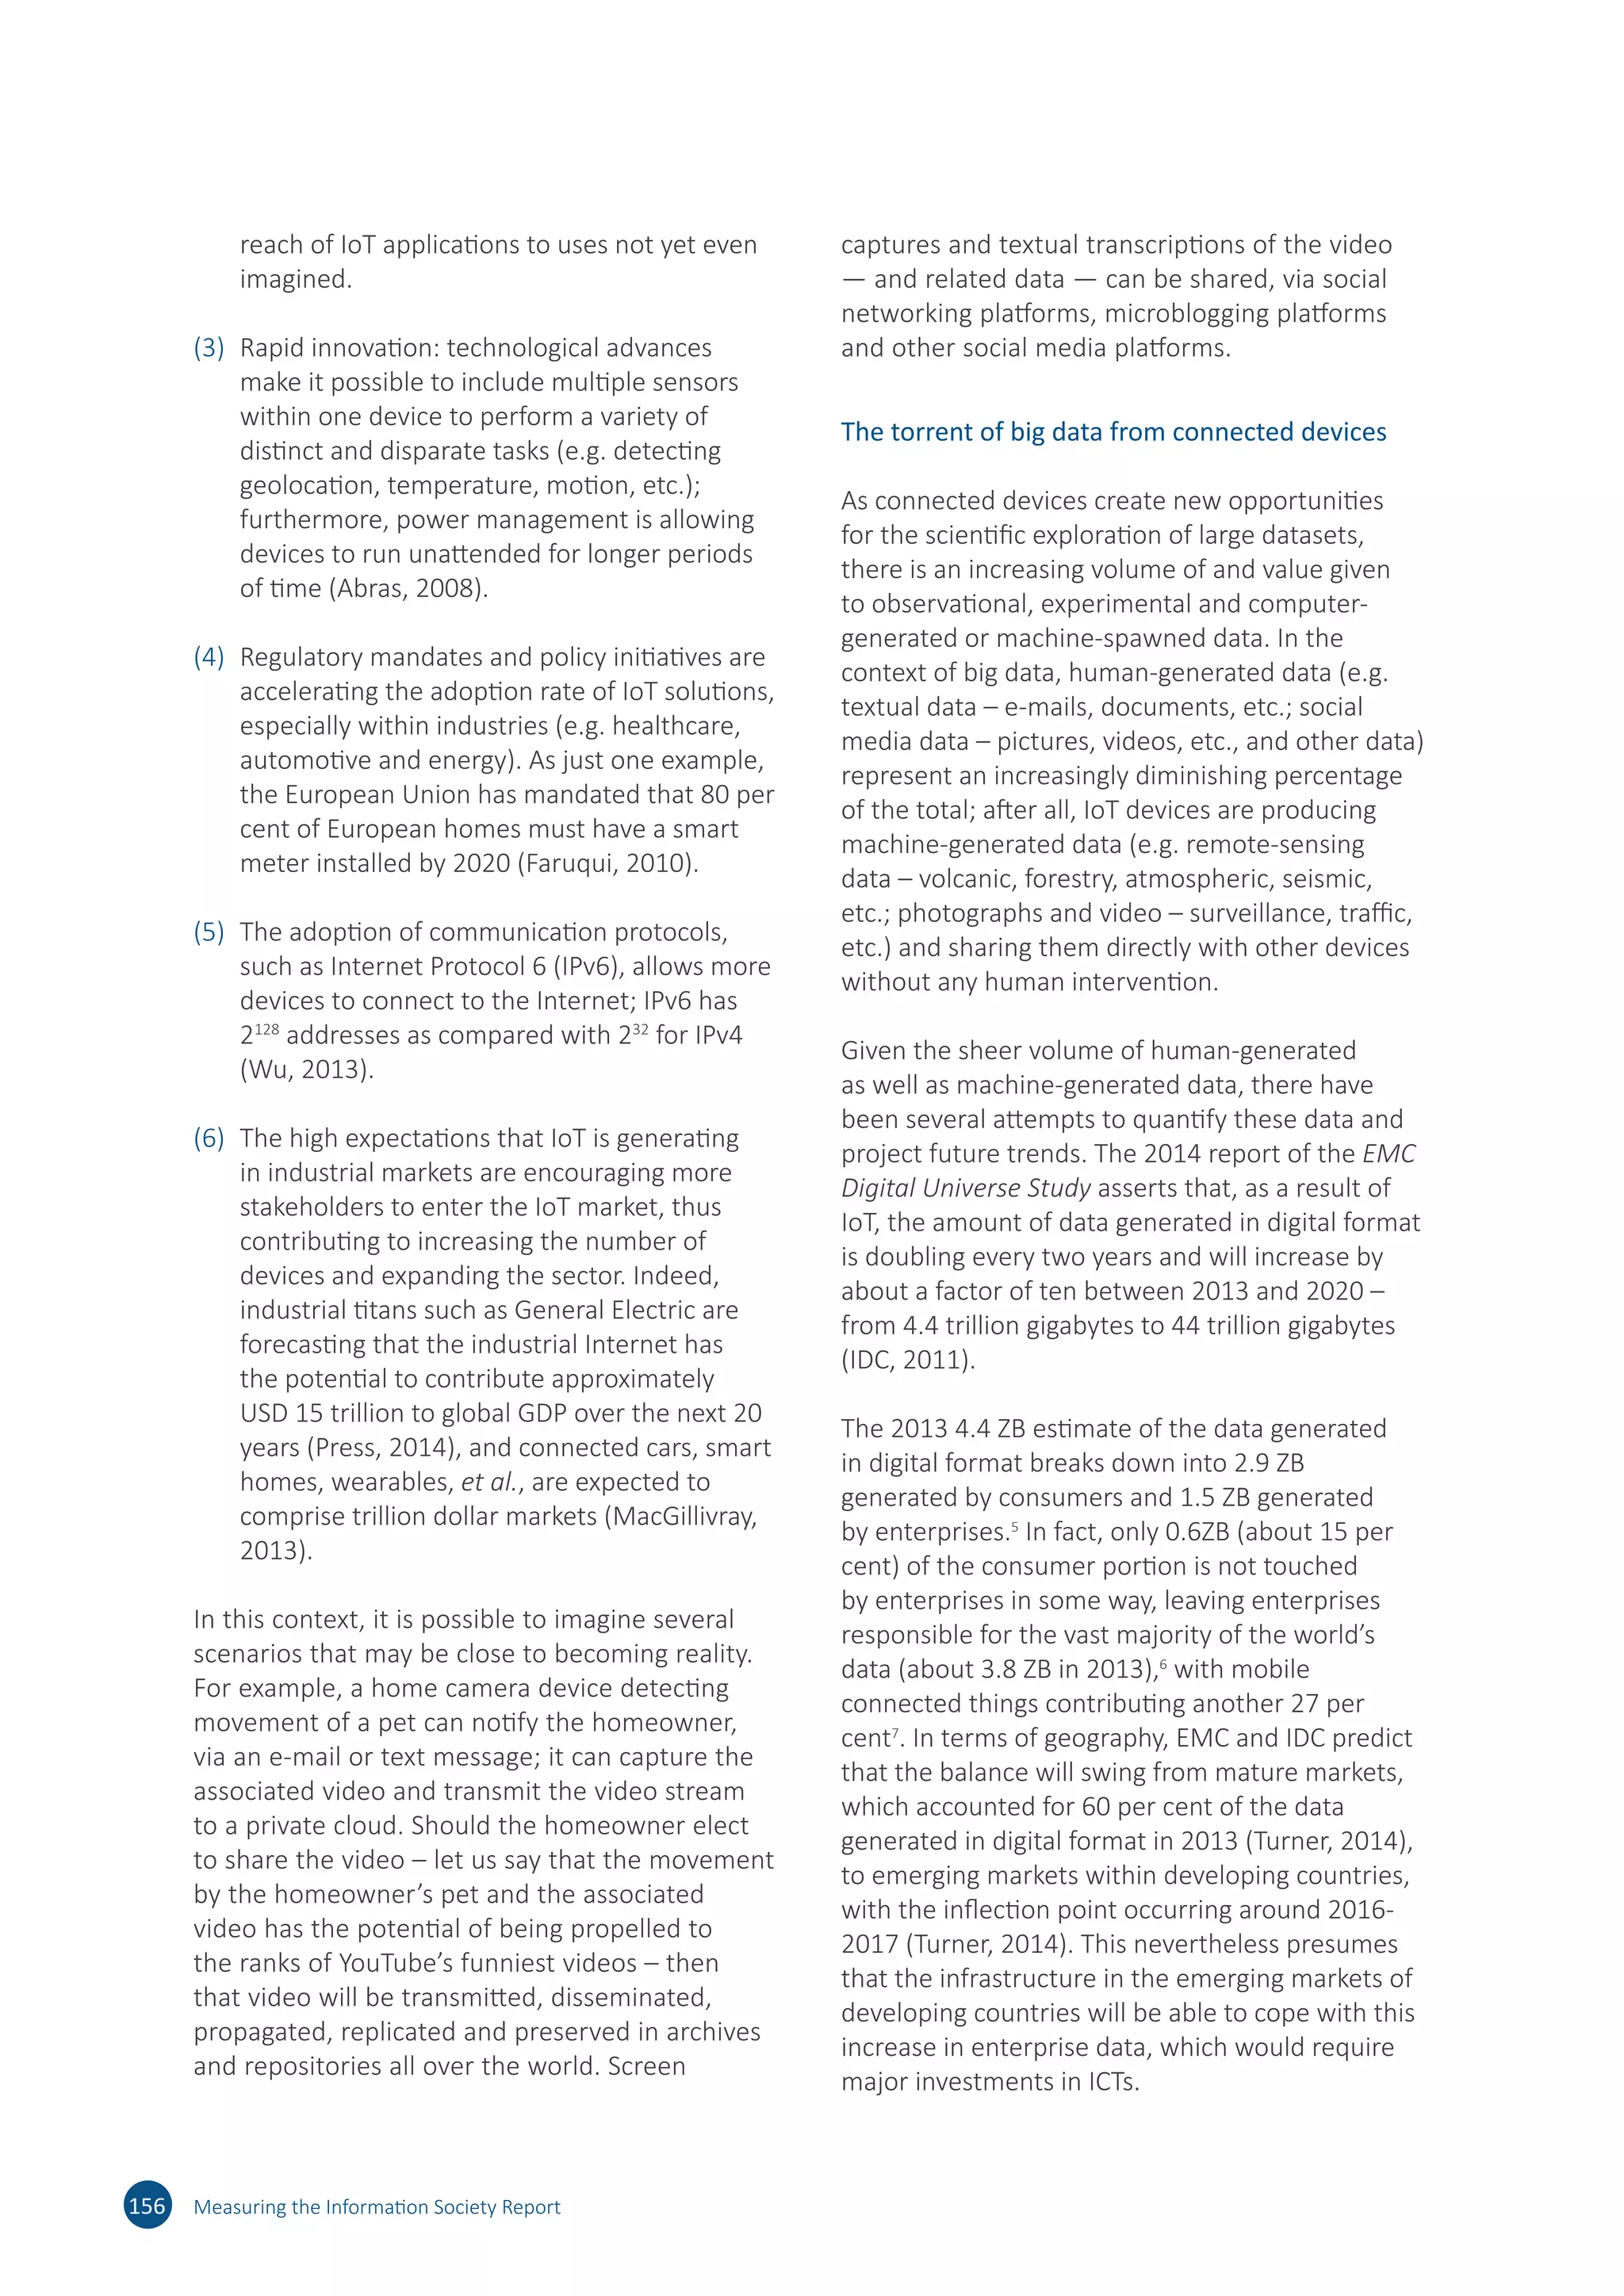
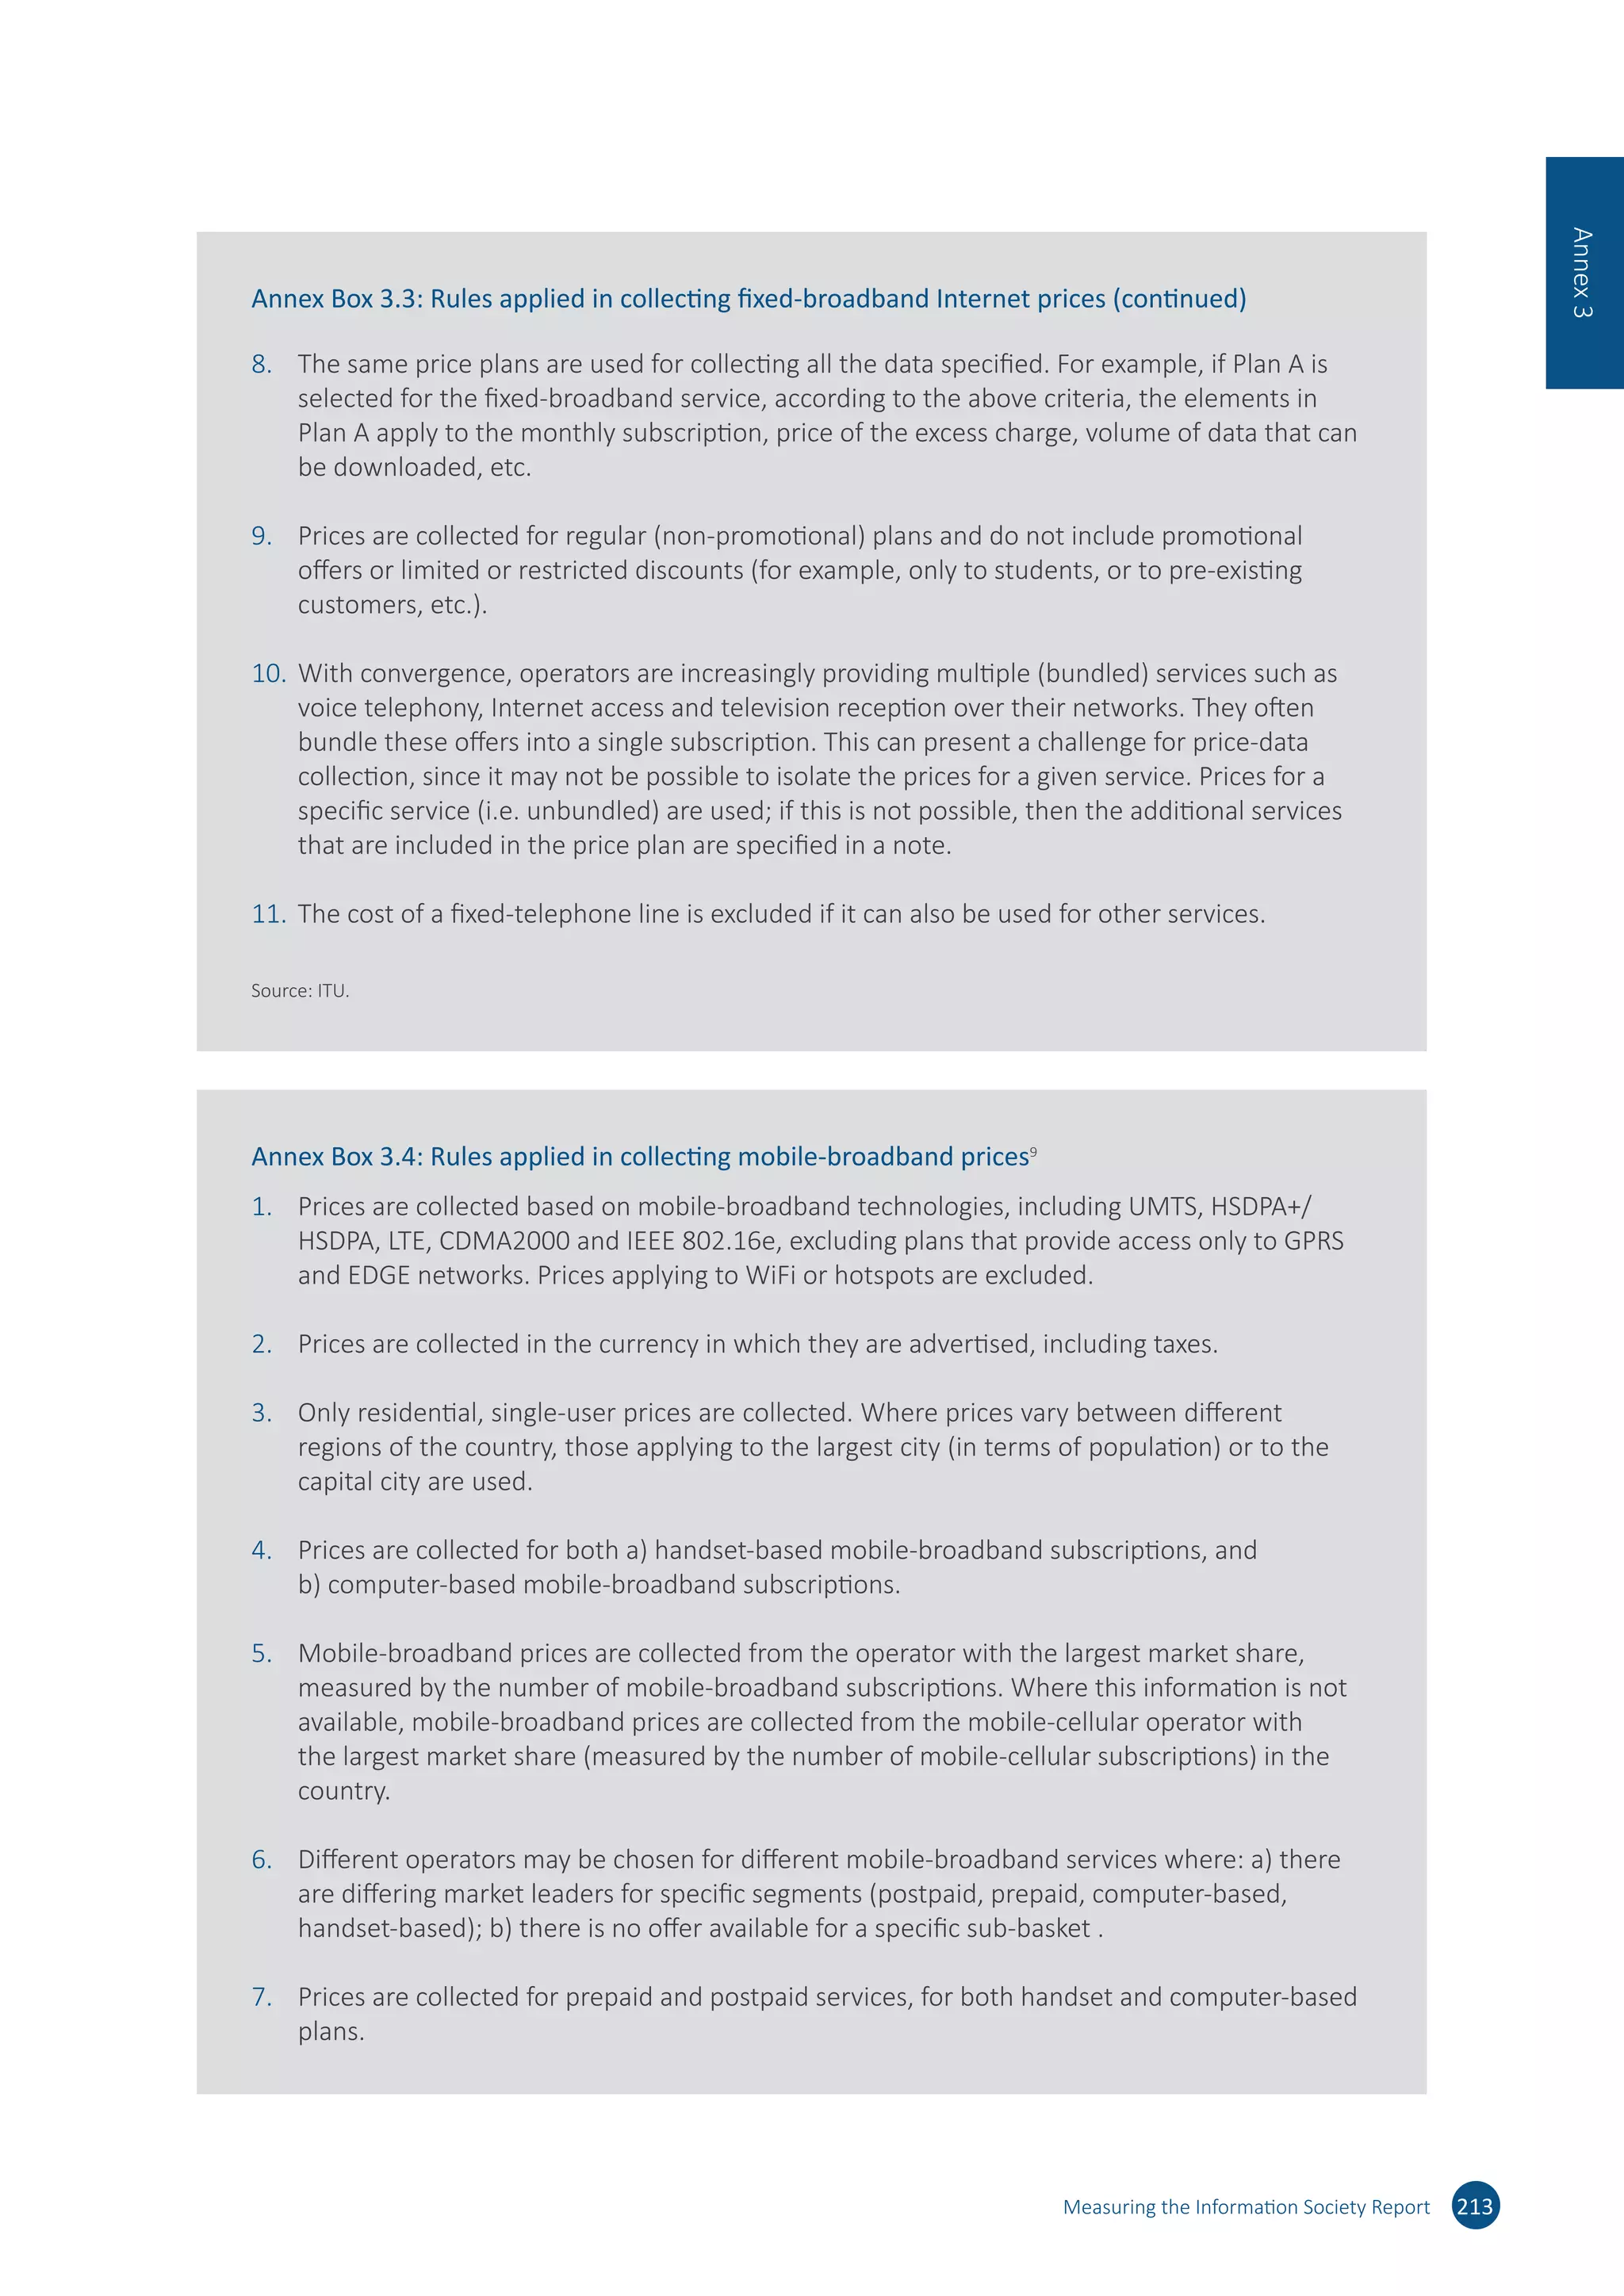
Annex Table 2.5: Added value of the IDI vis-à-vis its main components
IDI ICT access ICT use ICT skills
IDI - 0.984 0.984 0.903
ICT access 26% - 0.953 0.857
ICT use 26% 50% - 0.860
ICT skills 52% 62% 69% -
Note: Numbers above the diagonal: Spearman rank correlation coefficients; numbers below the diagonal: percentage of countries (out of 167) that
shift +10 positions or more between the rankings.
Source: Saisana and Domínguez-Torreiro, European Commission, Joint Research Centre; IDI 2015.
Annex Table 2.6: Uncertainty parameters (weights and aggregation function)
Reference Alternative
I. Uncertainty in the aggregation function at the
sub-index level
Arithmetic average Geometric average
II. Uncertainty intervals for the three sub-index
weights
Reference value for
the weight
Distribution for
uncertainty analysis
ICT access 0.4 U[0.30, 0.50]
ICT use 0.4 U[0.30, 0.50]
ICT skills 0.2 U[0.15, 0.25]
Source: Saisana and Domínguez-Torreiro, European Commission, Joint Research Centre; IDI 2015.](https://image.slidesharecdn.com/ituidireport-151130151434-lva1-app6892/75/Itu-idi-report-216-2048.jpg)

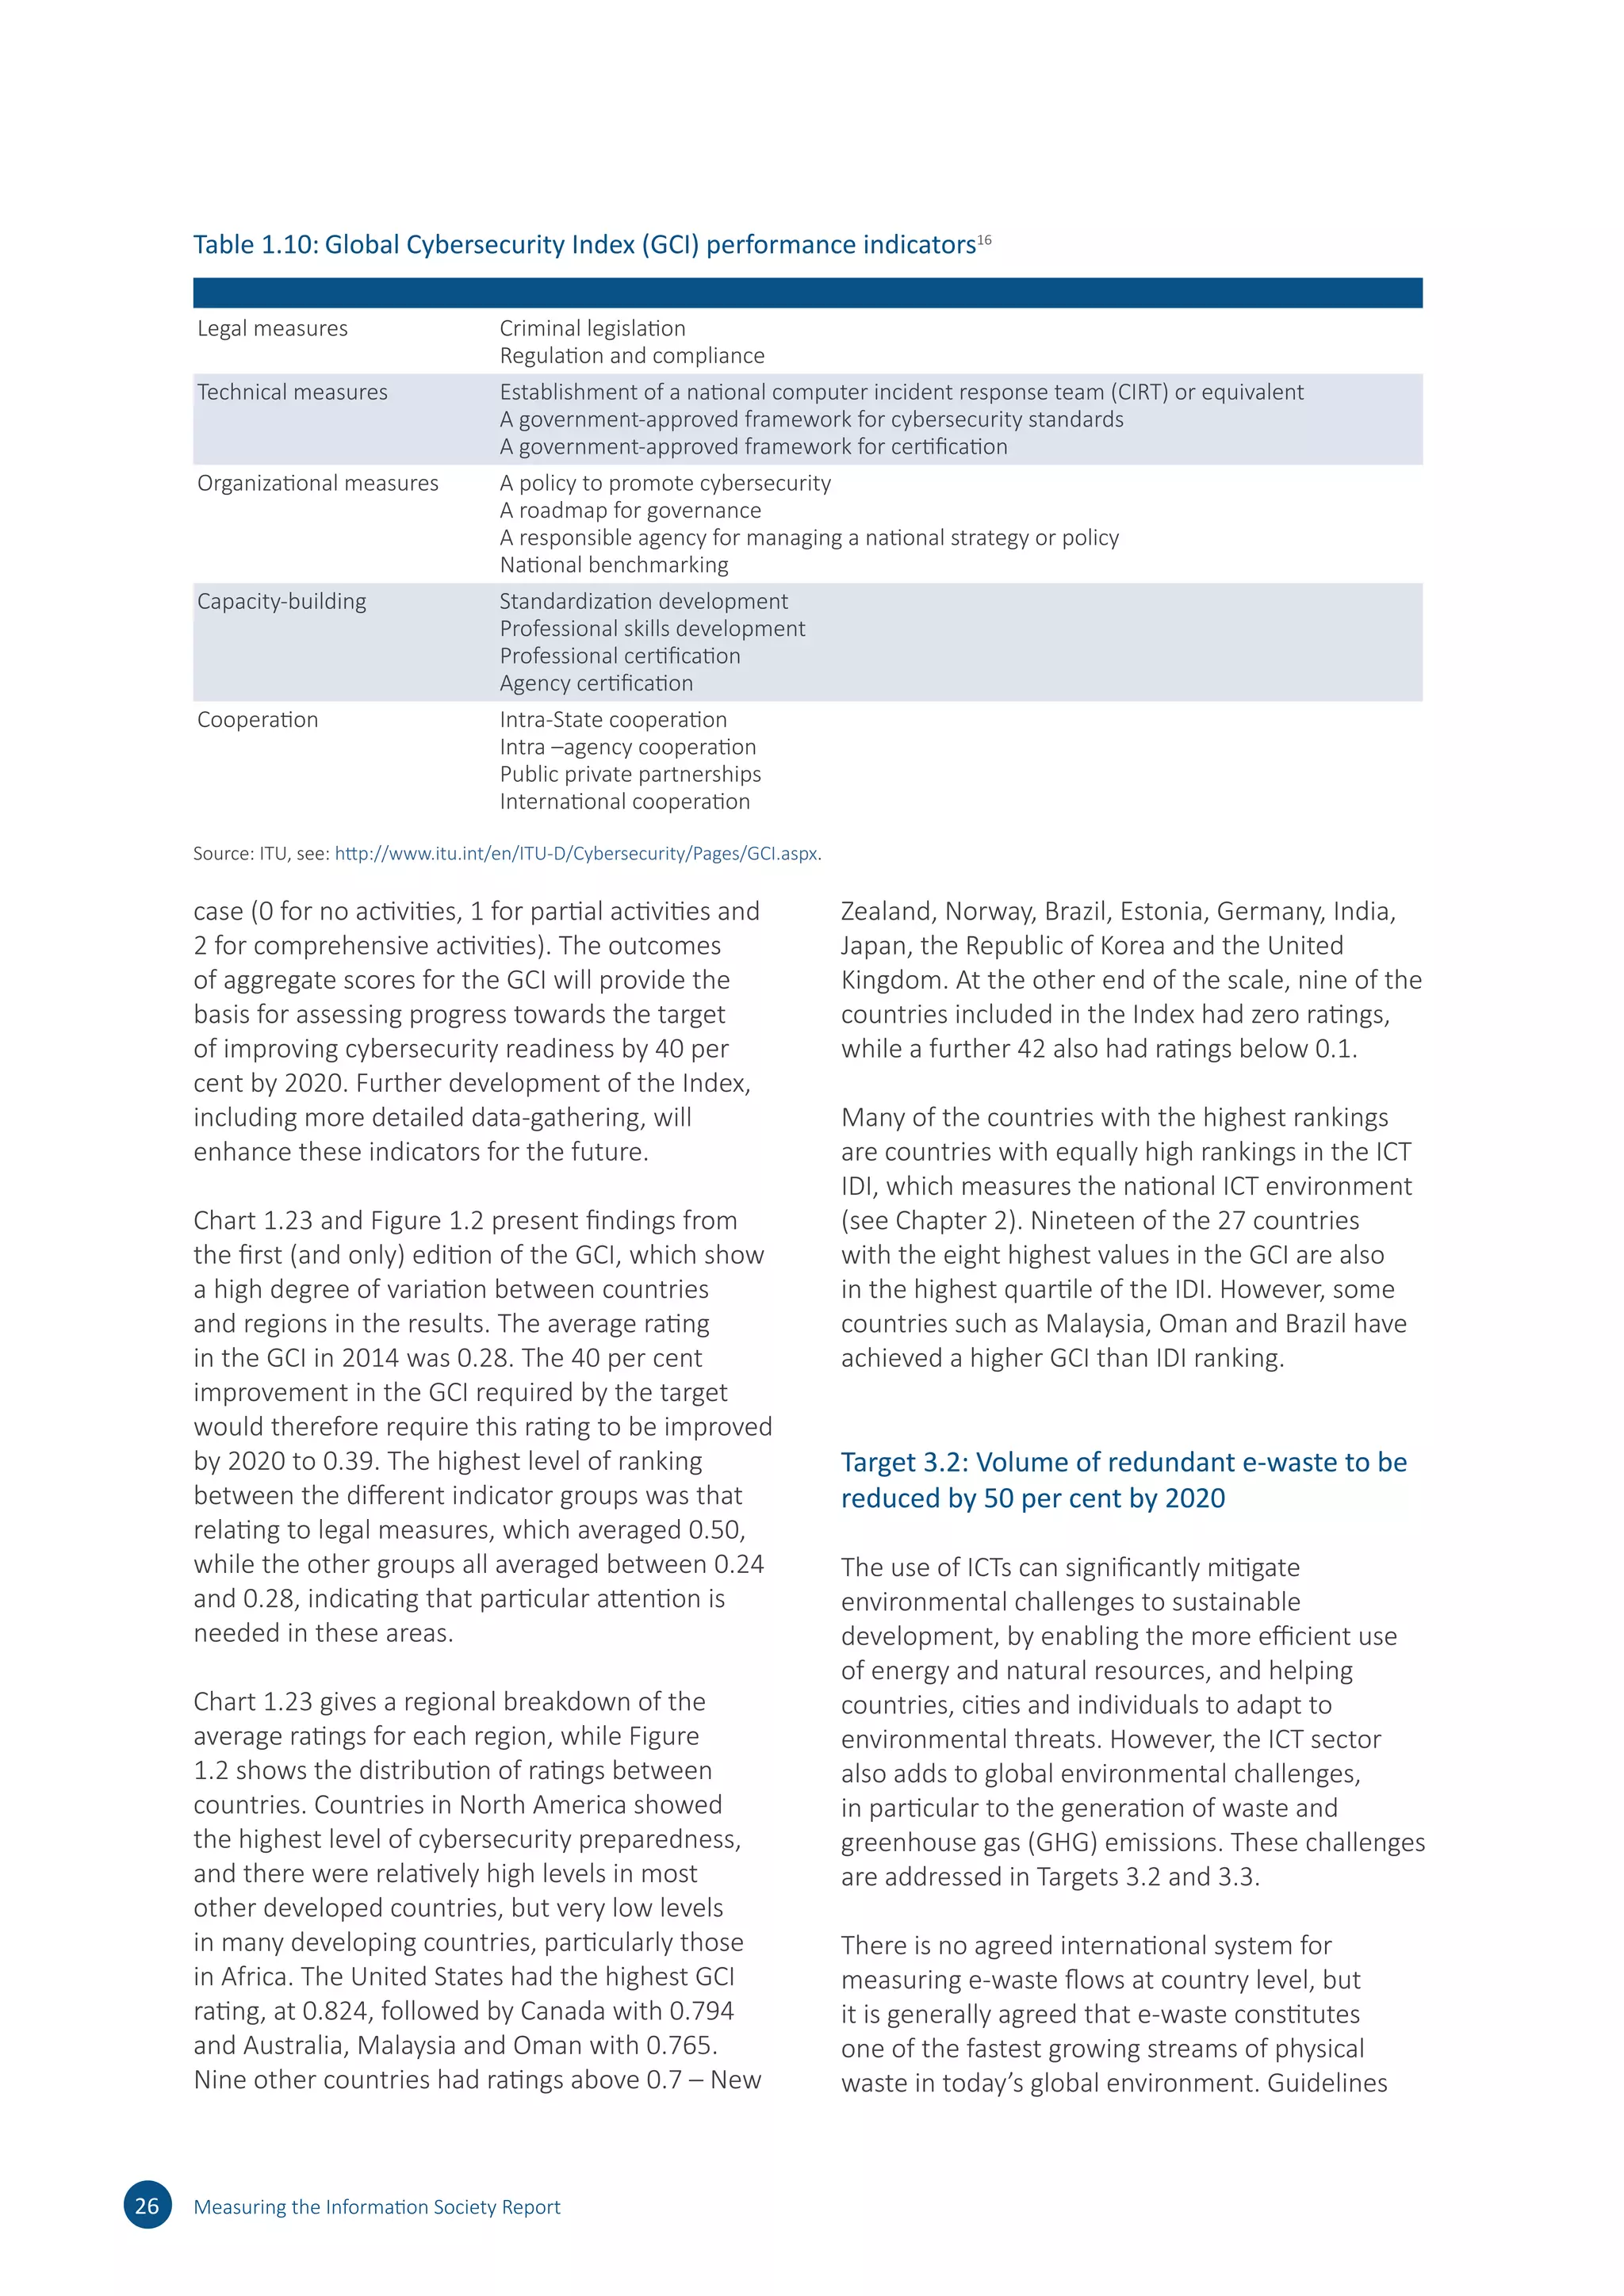
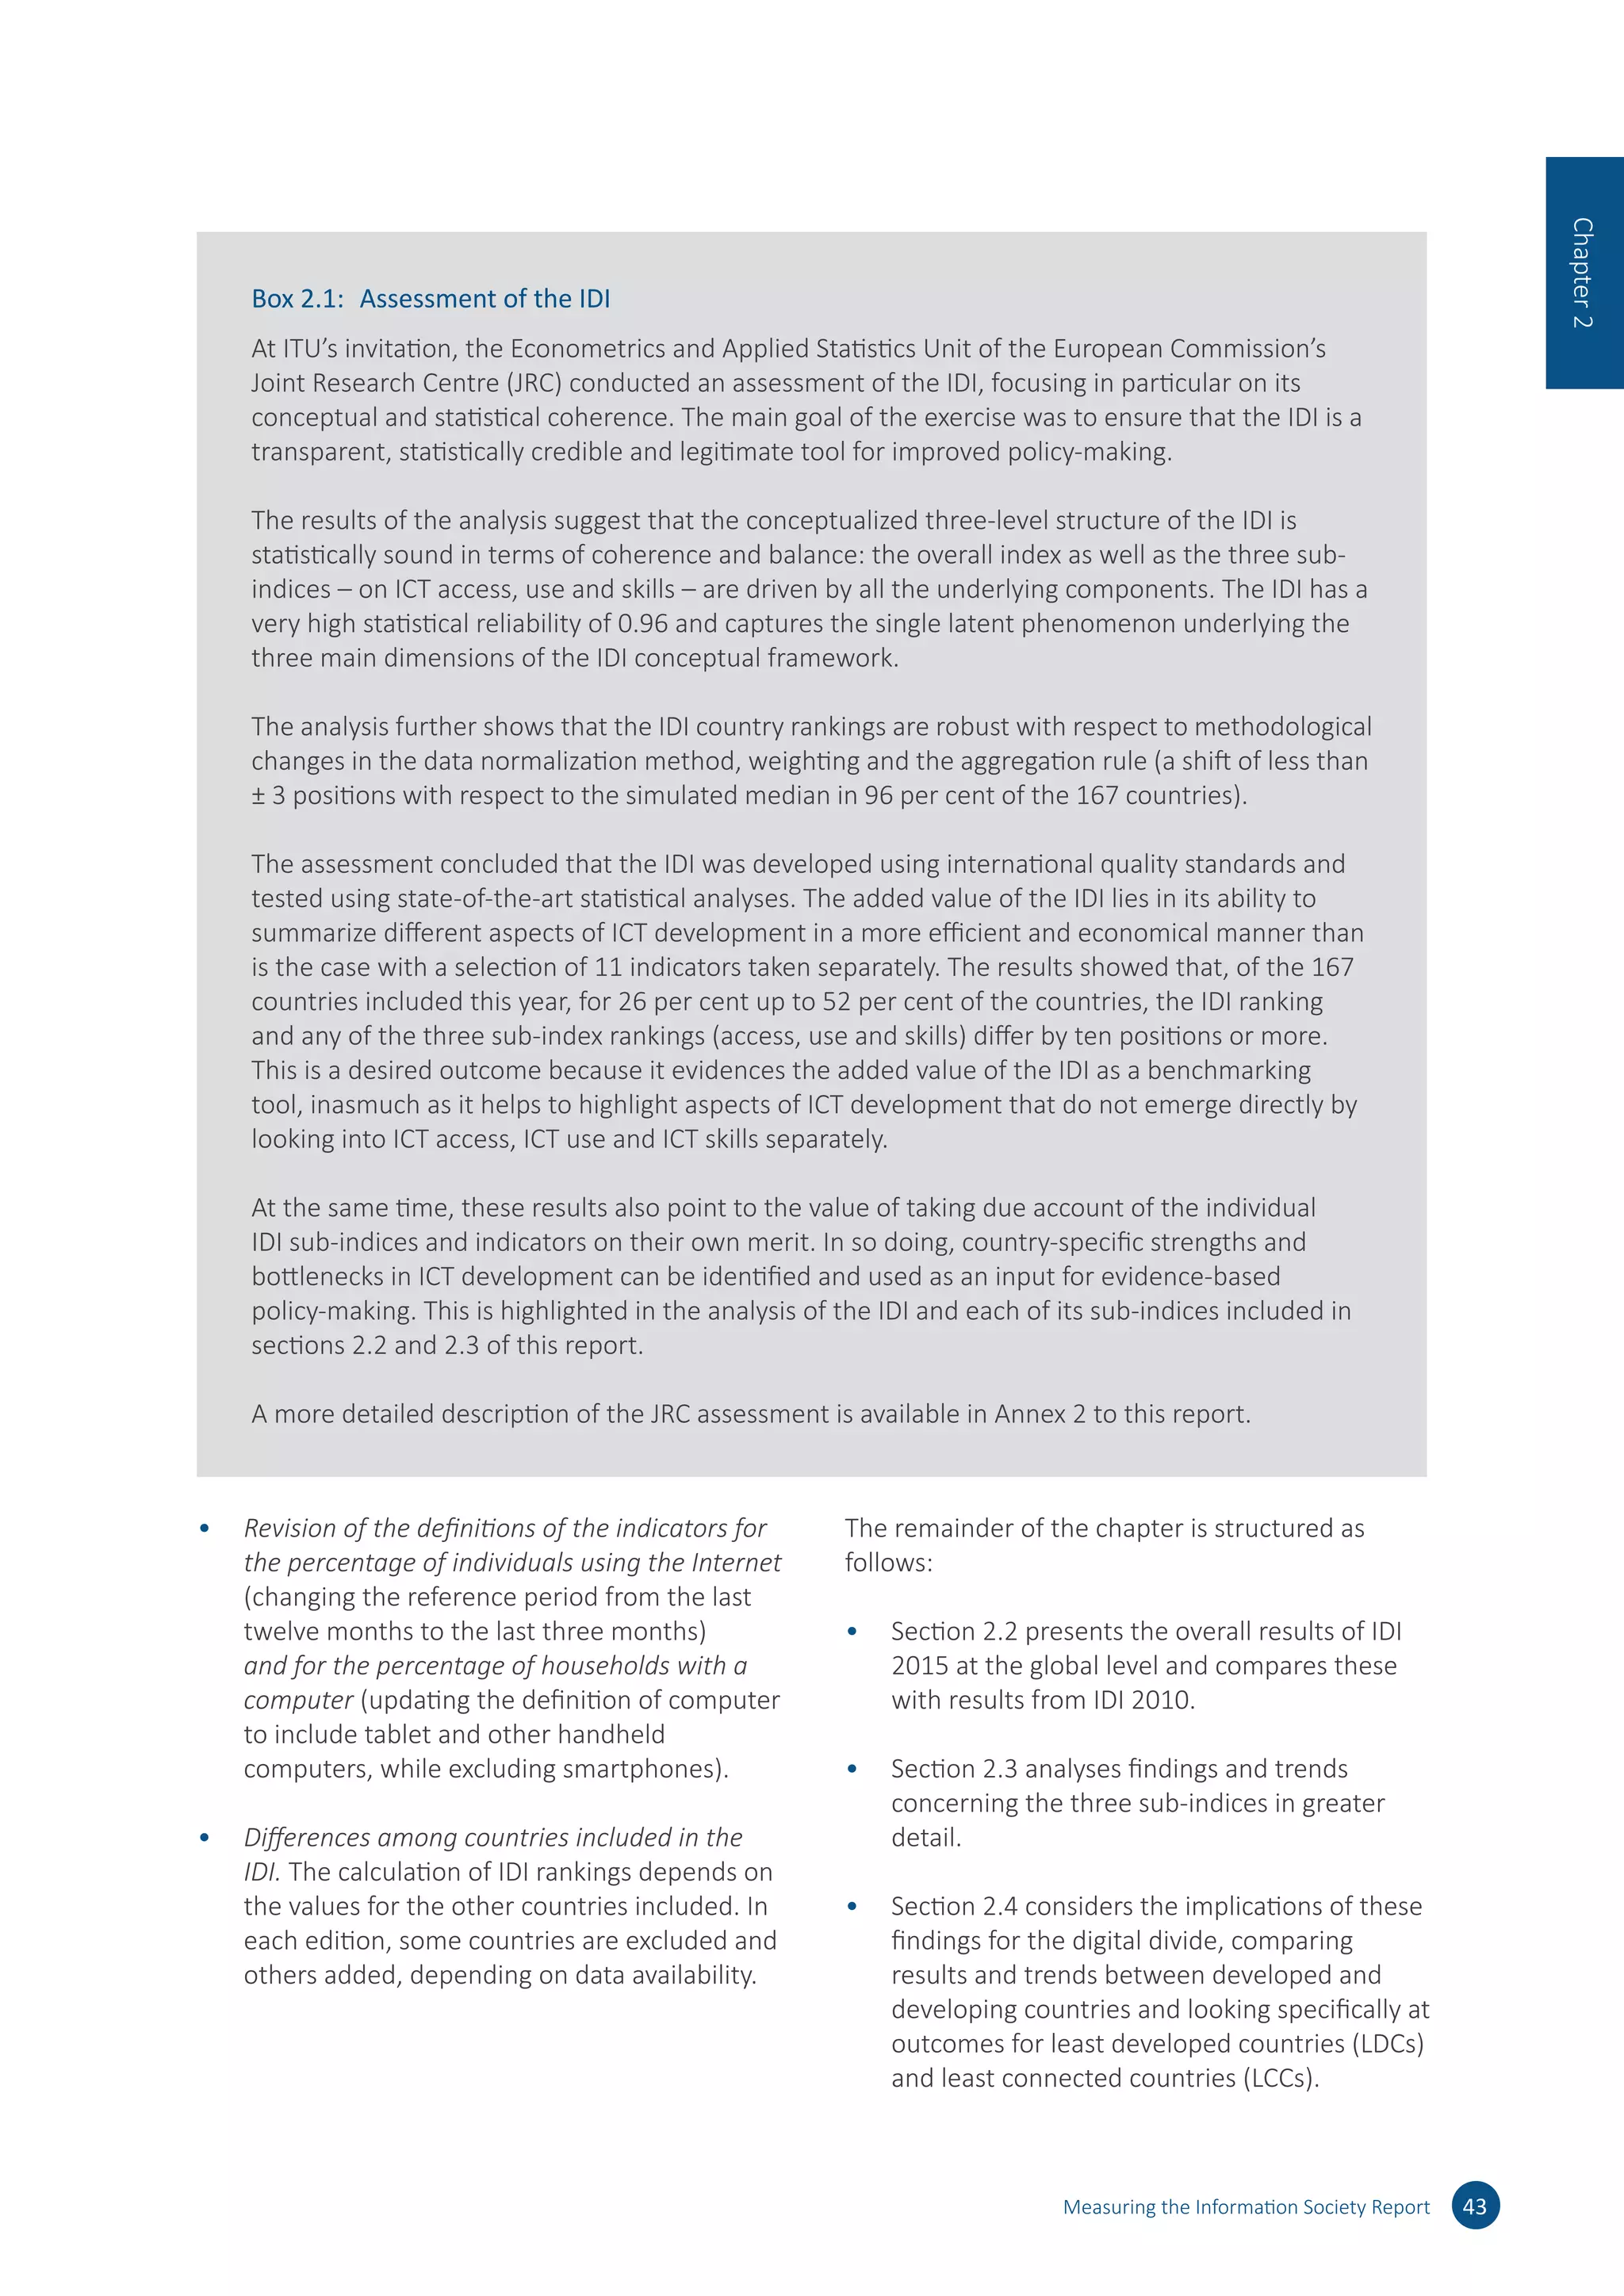
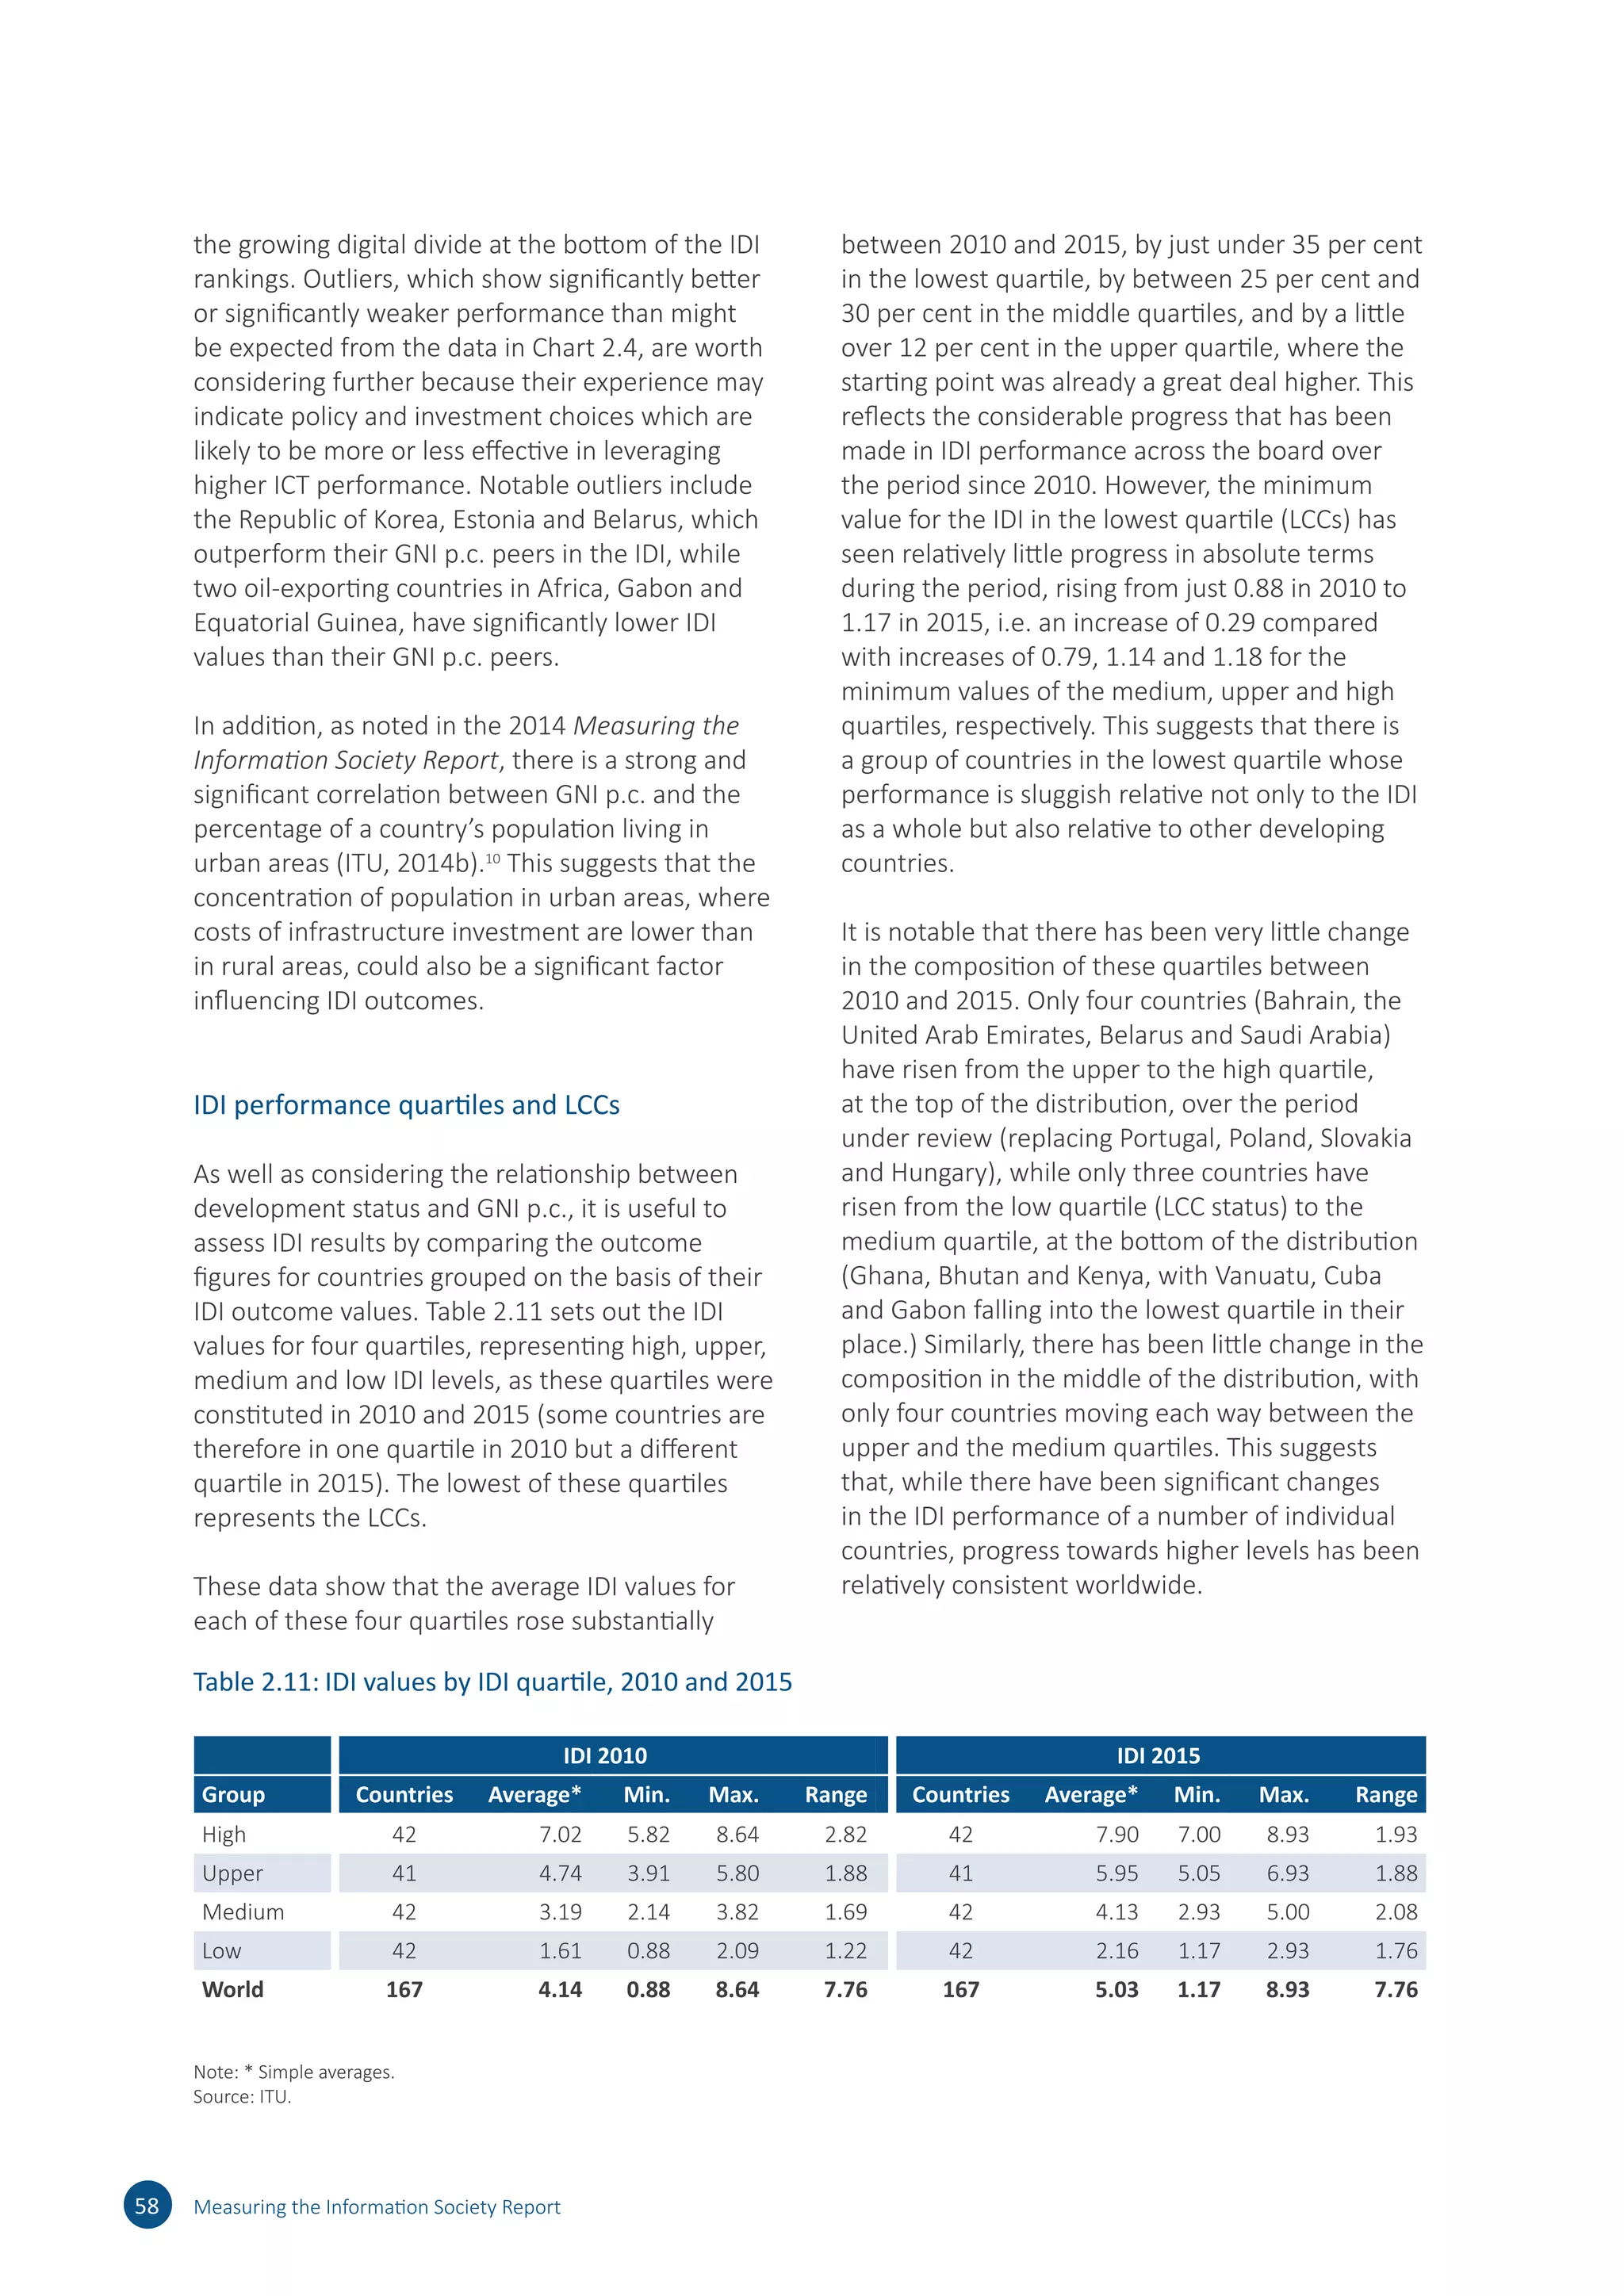
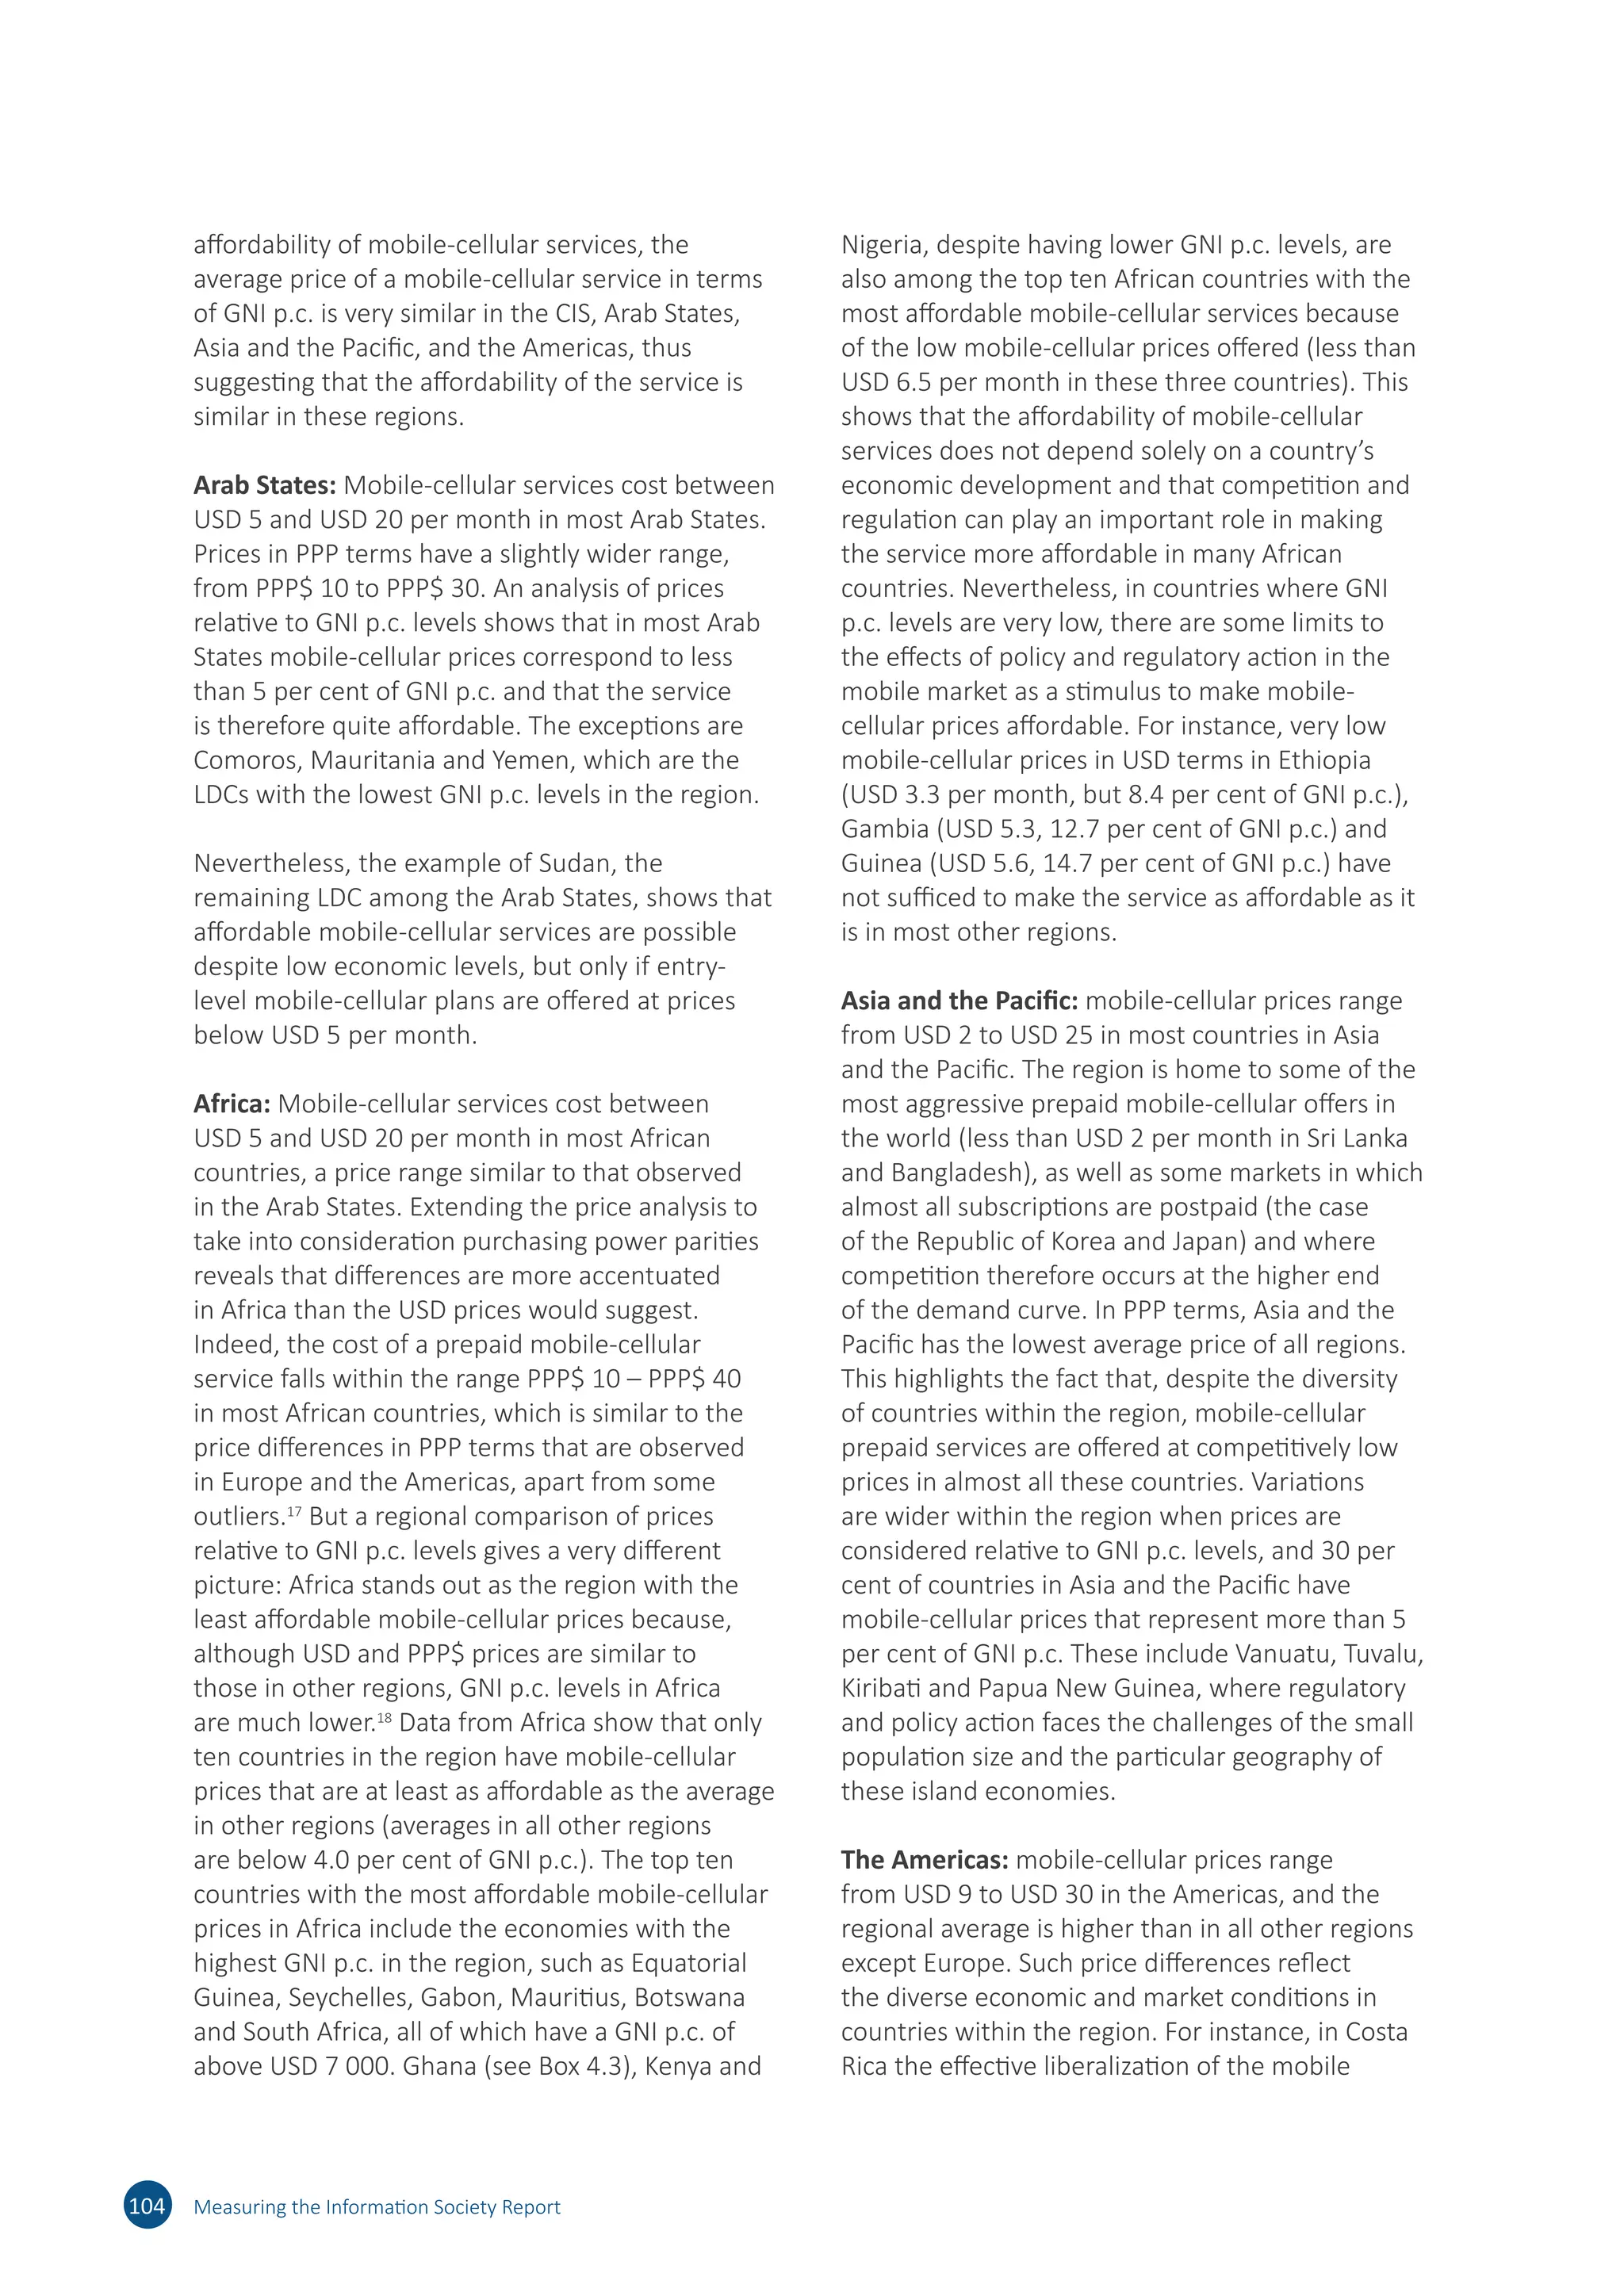
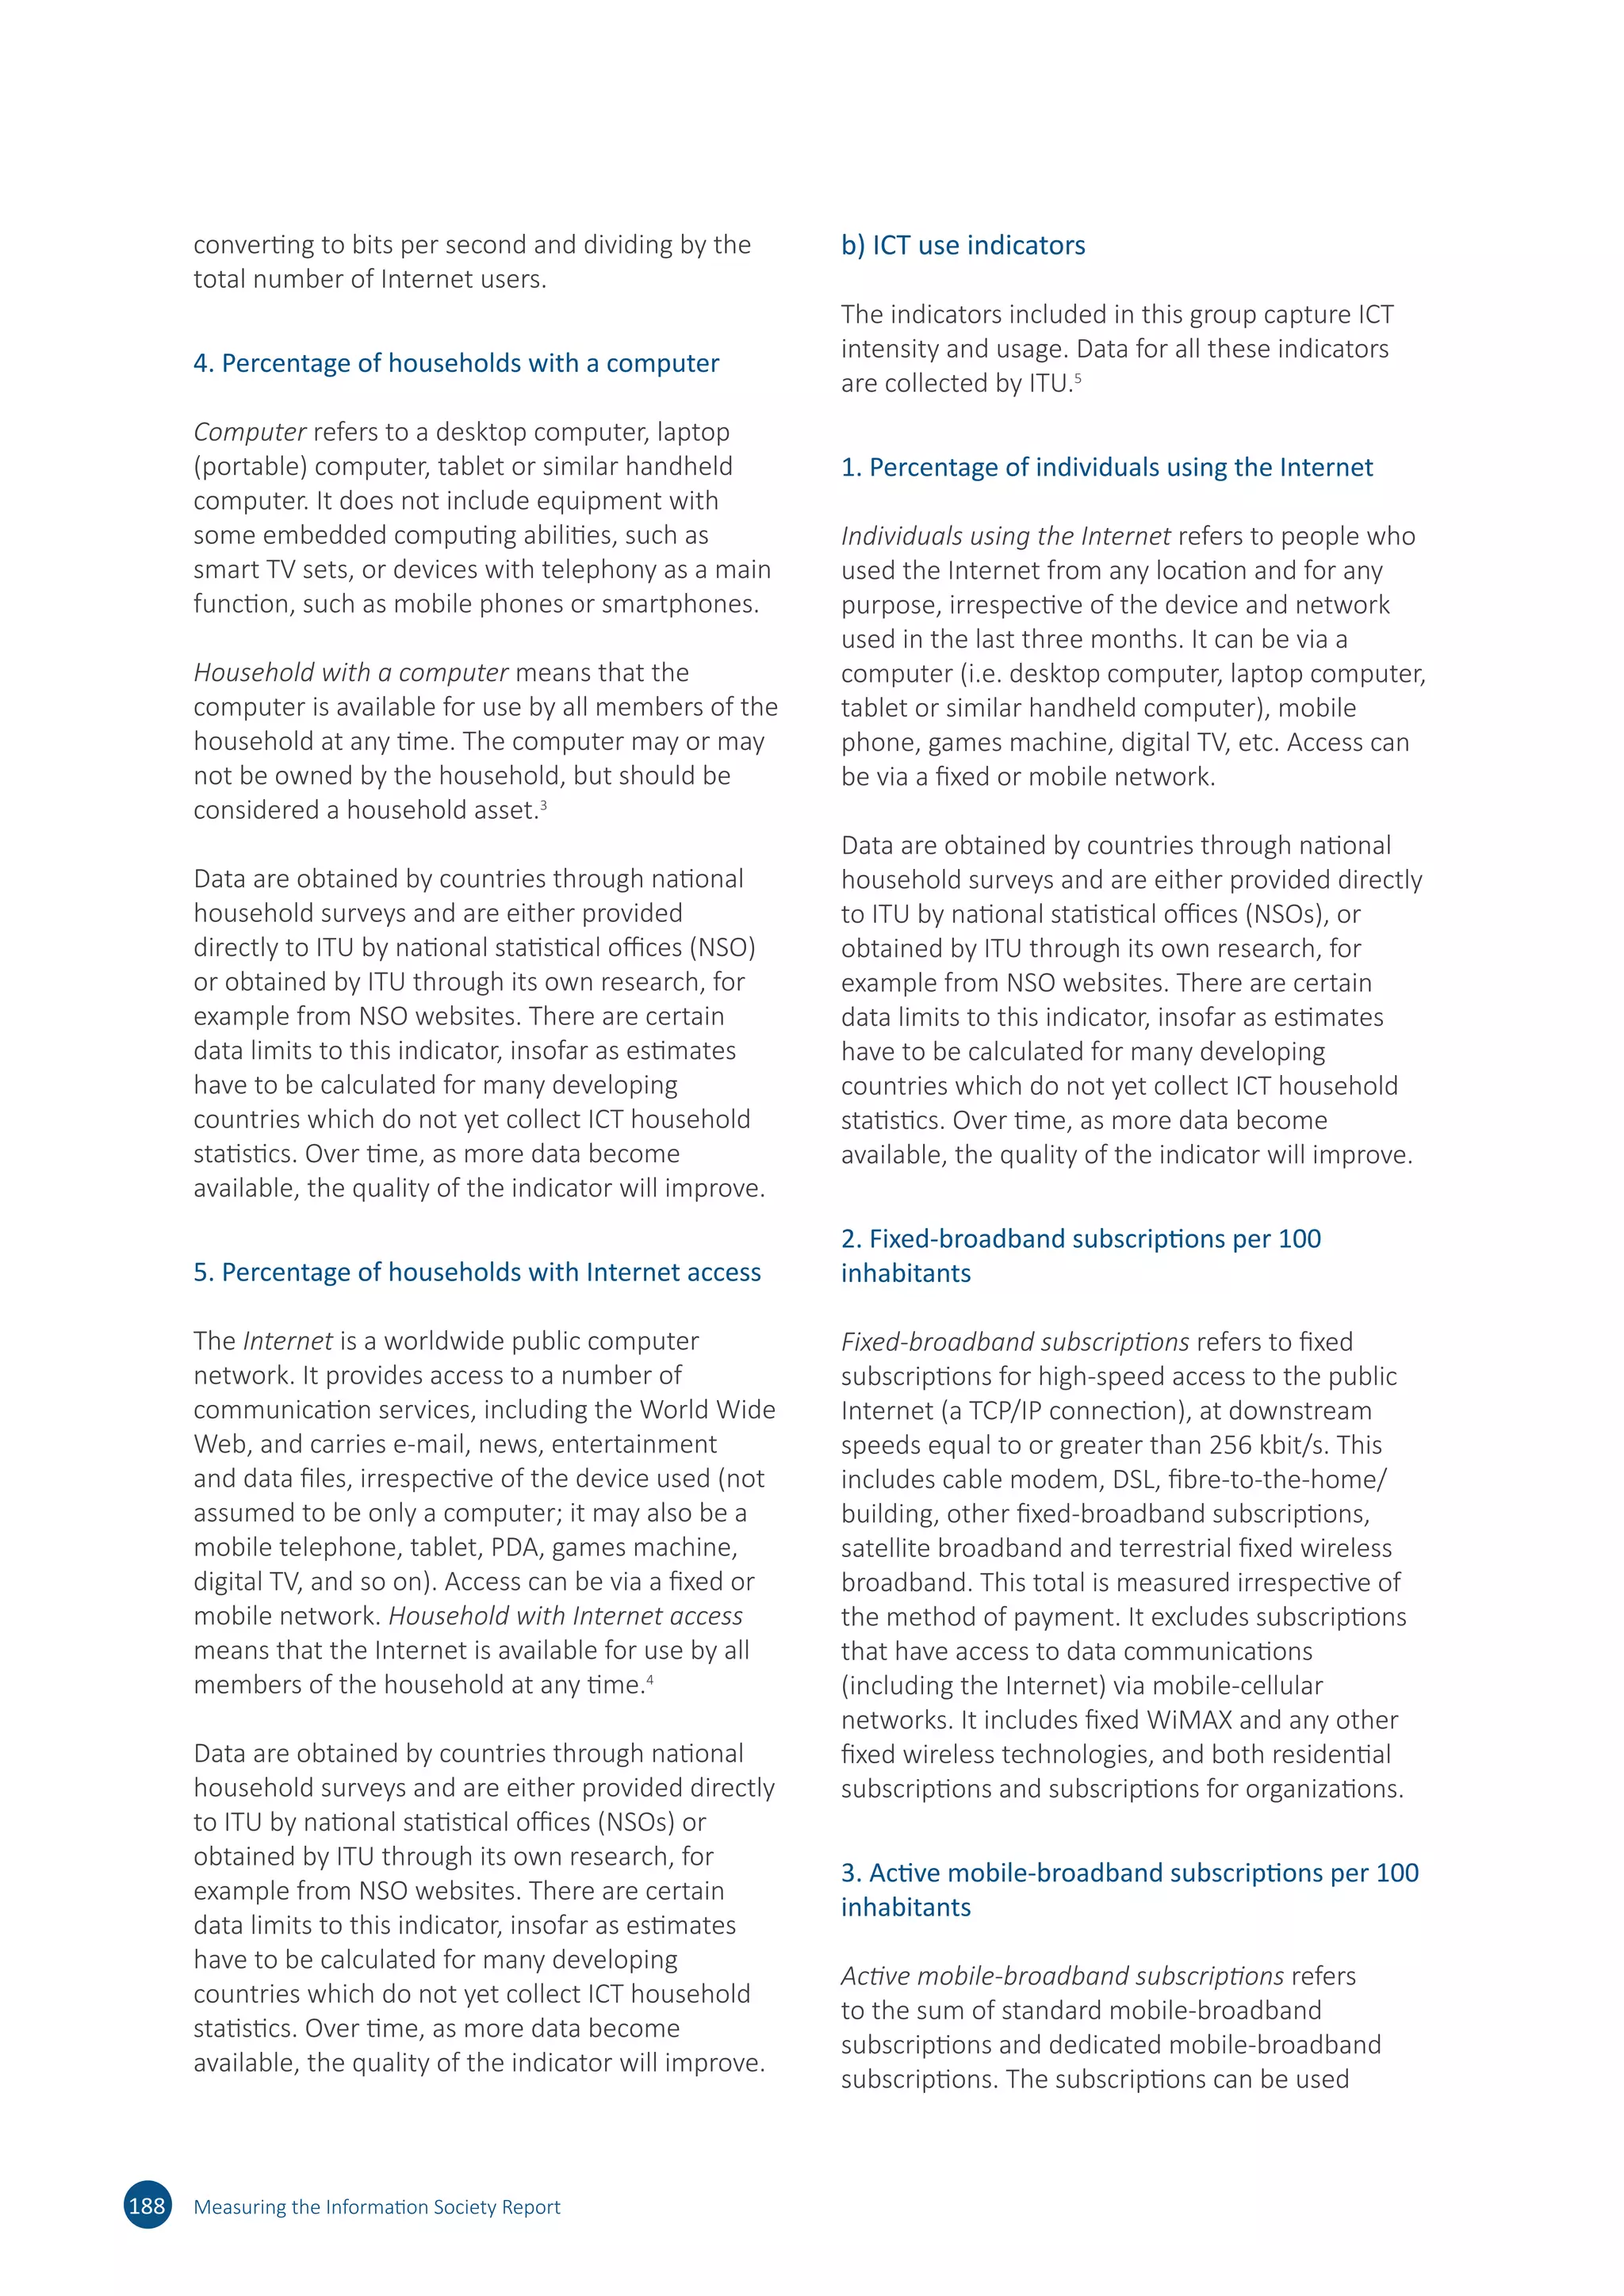
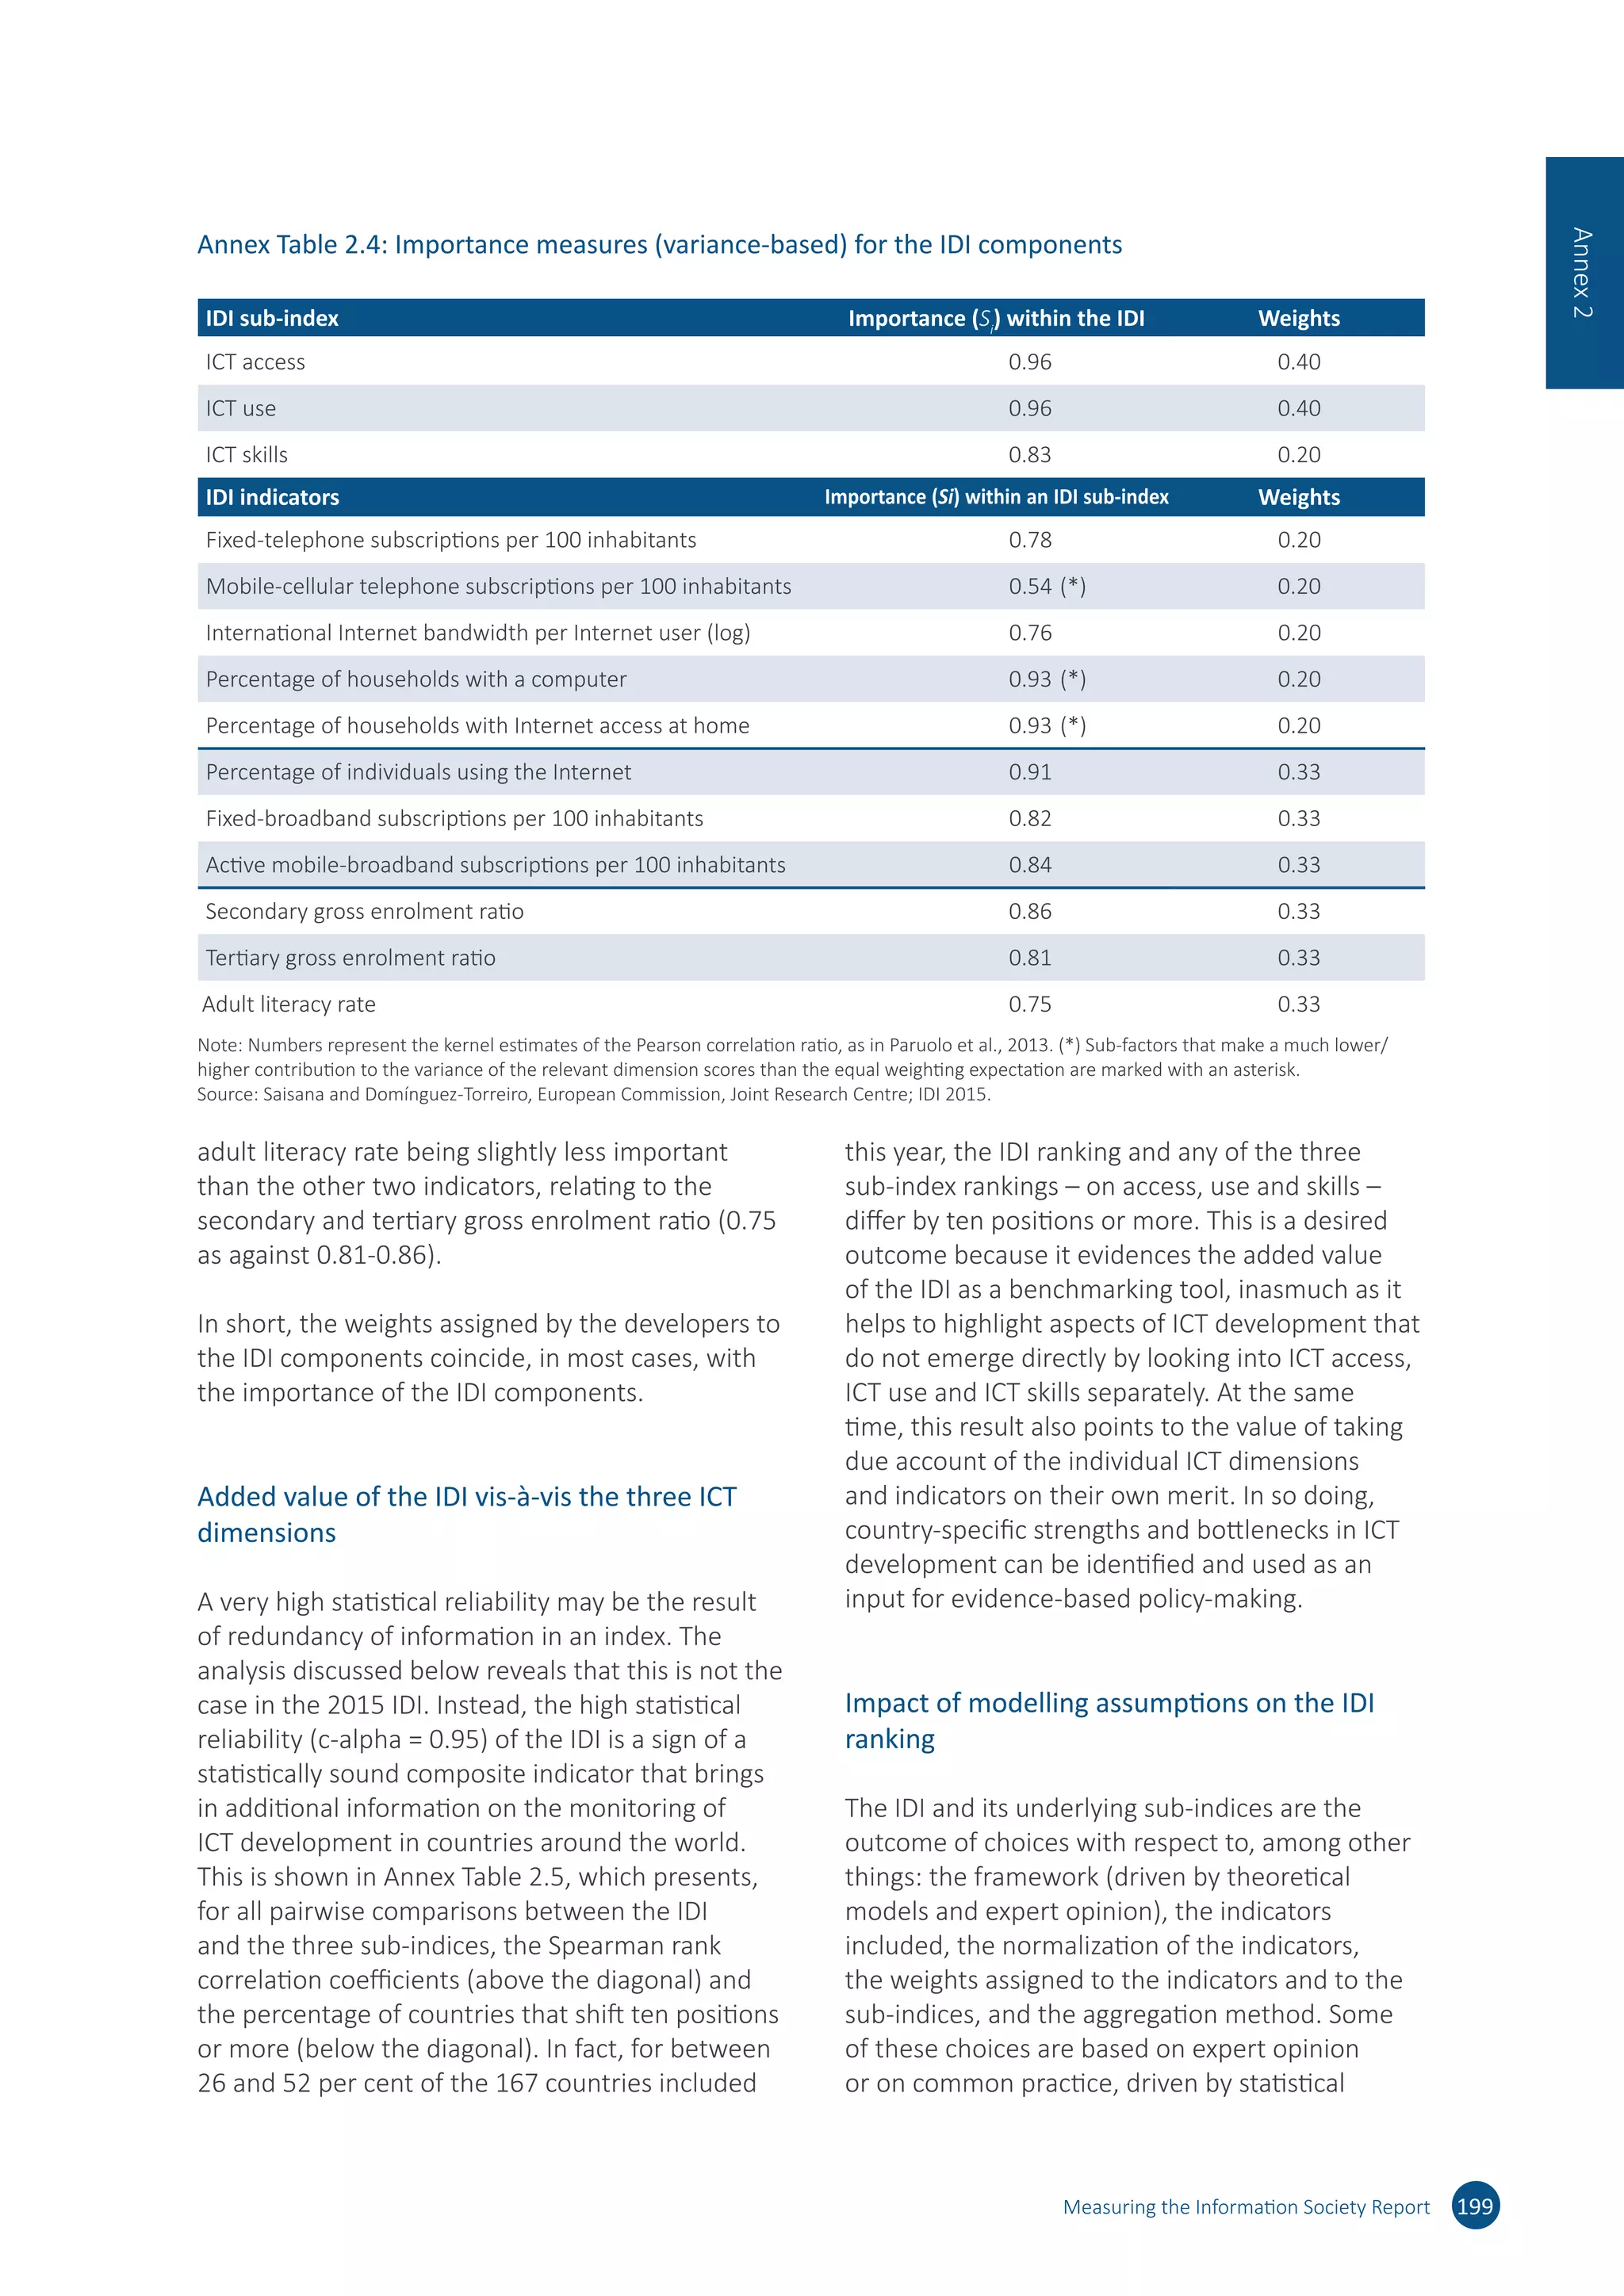
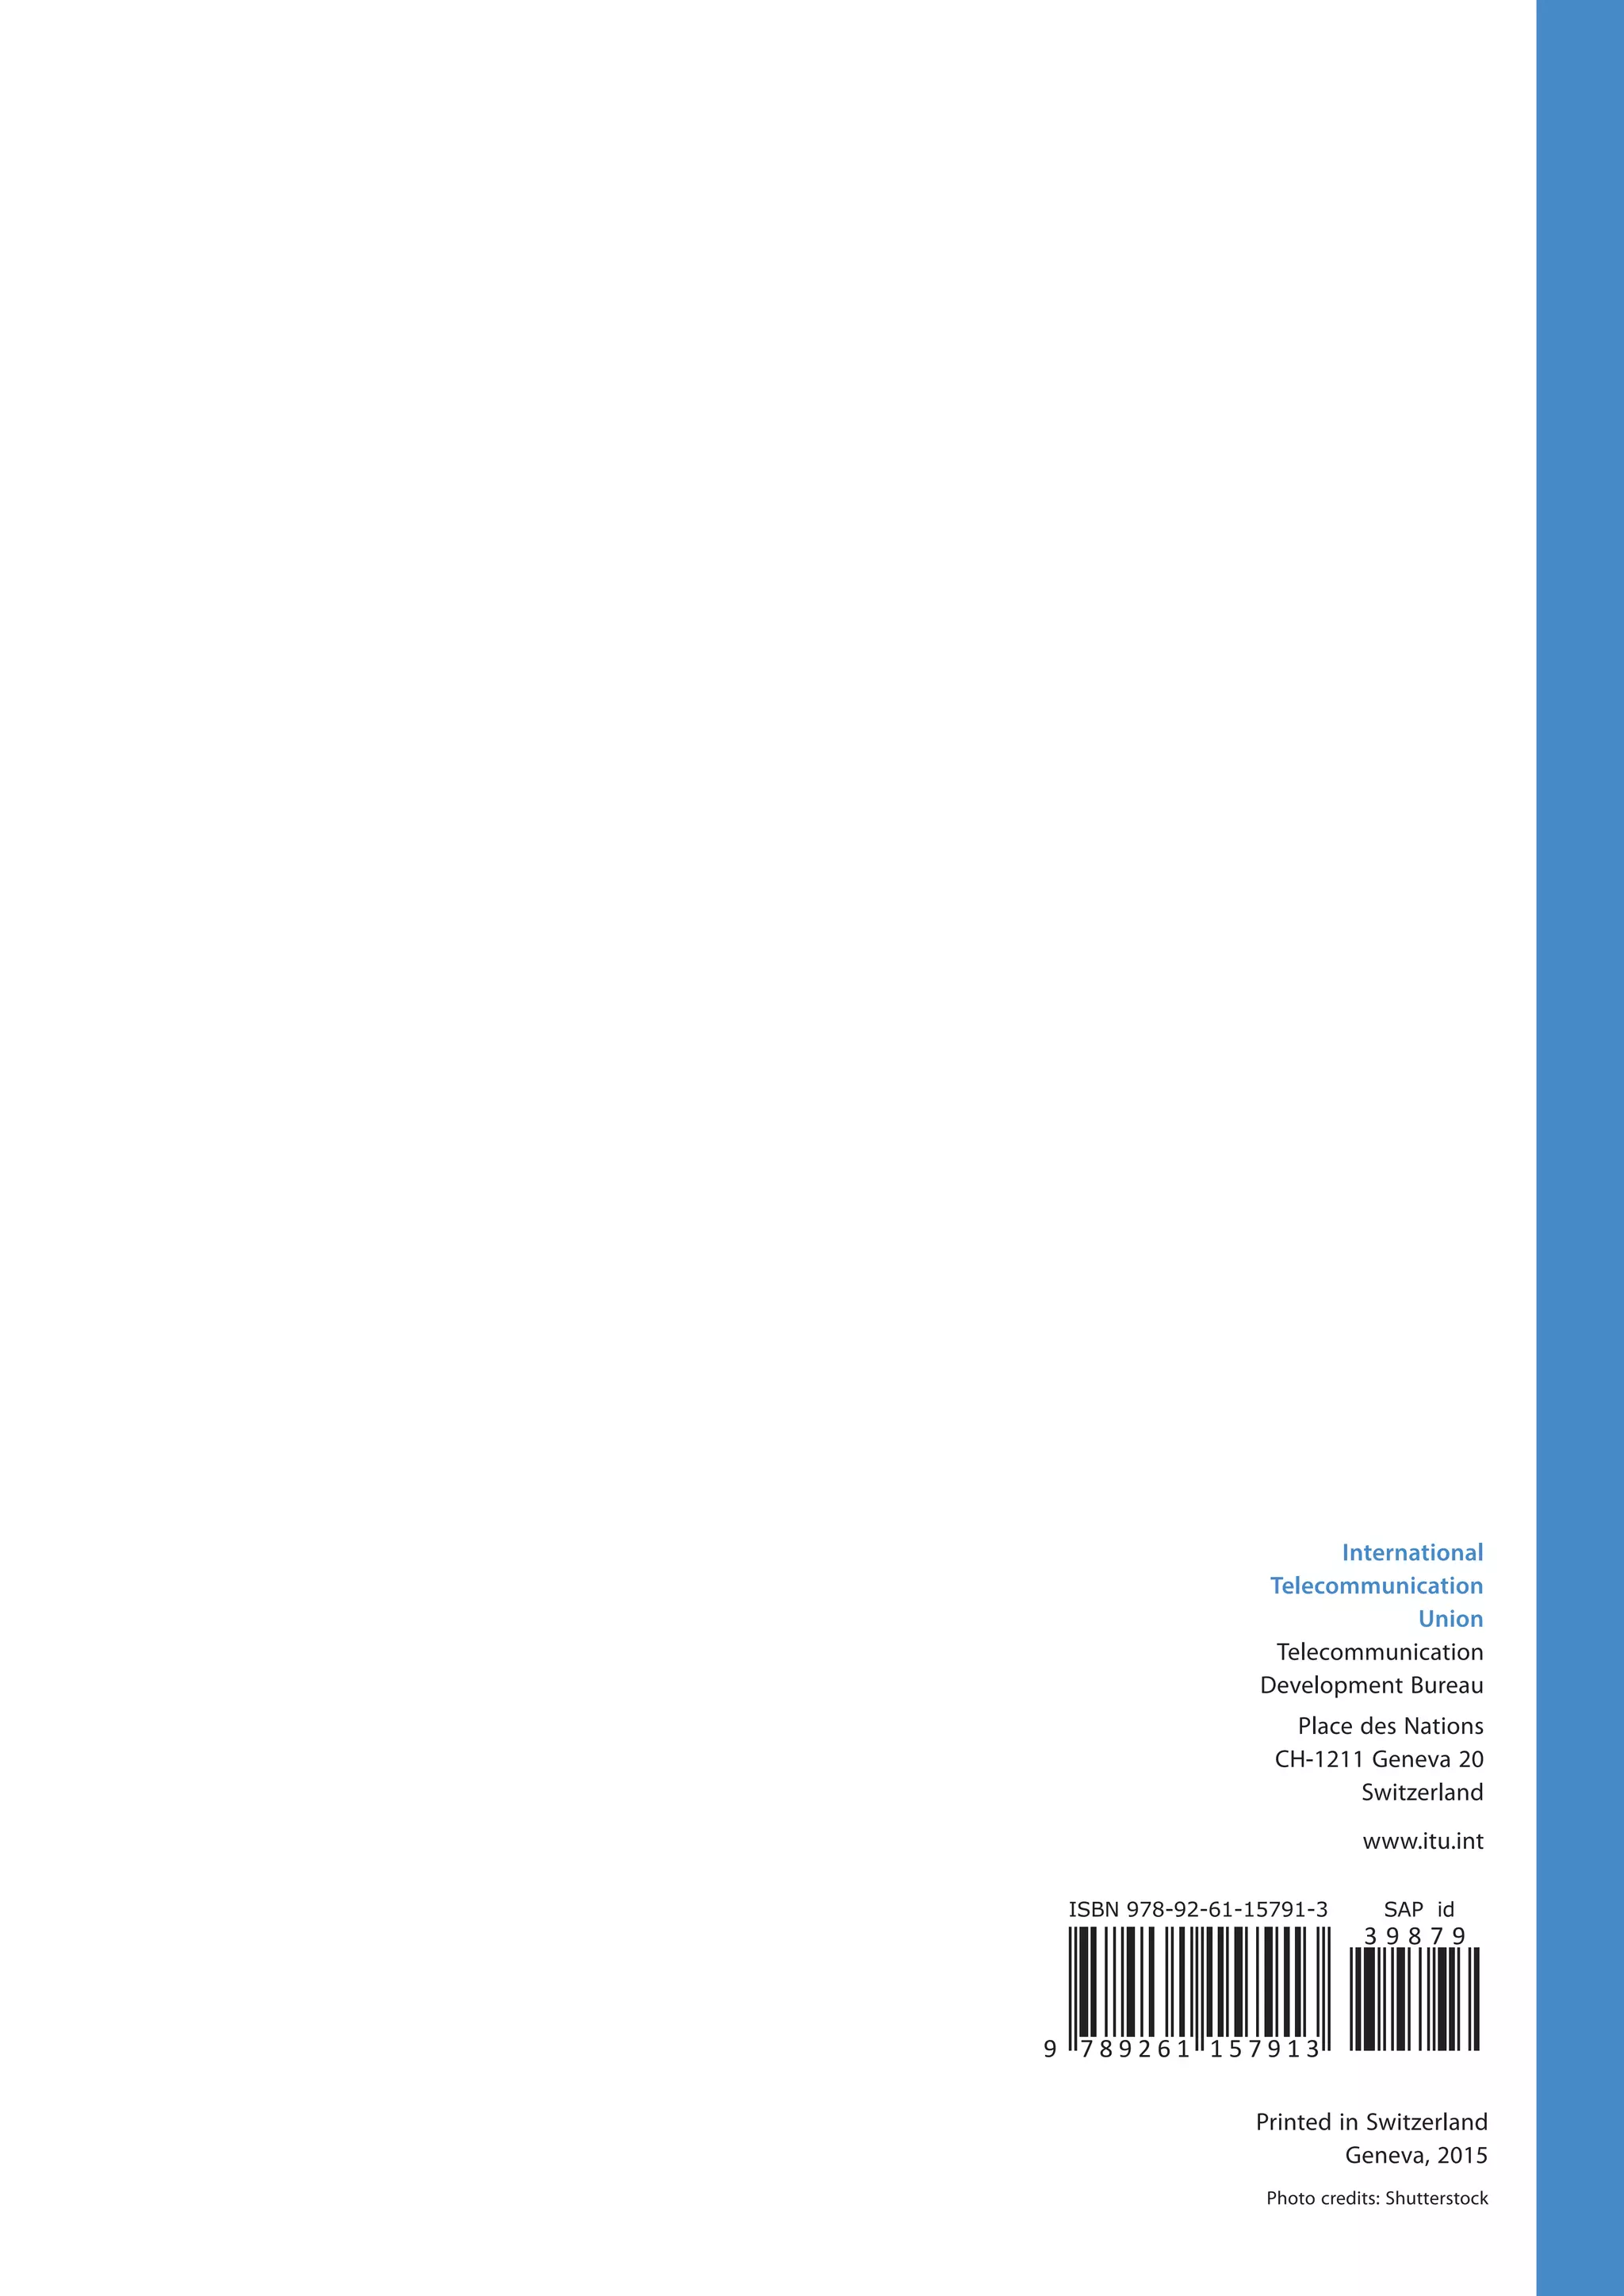
![202 Measuring the Information Society Report
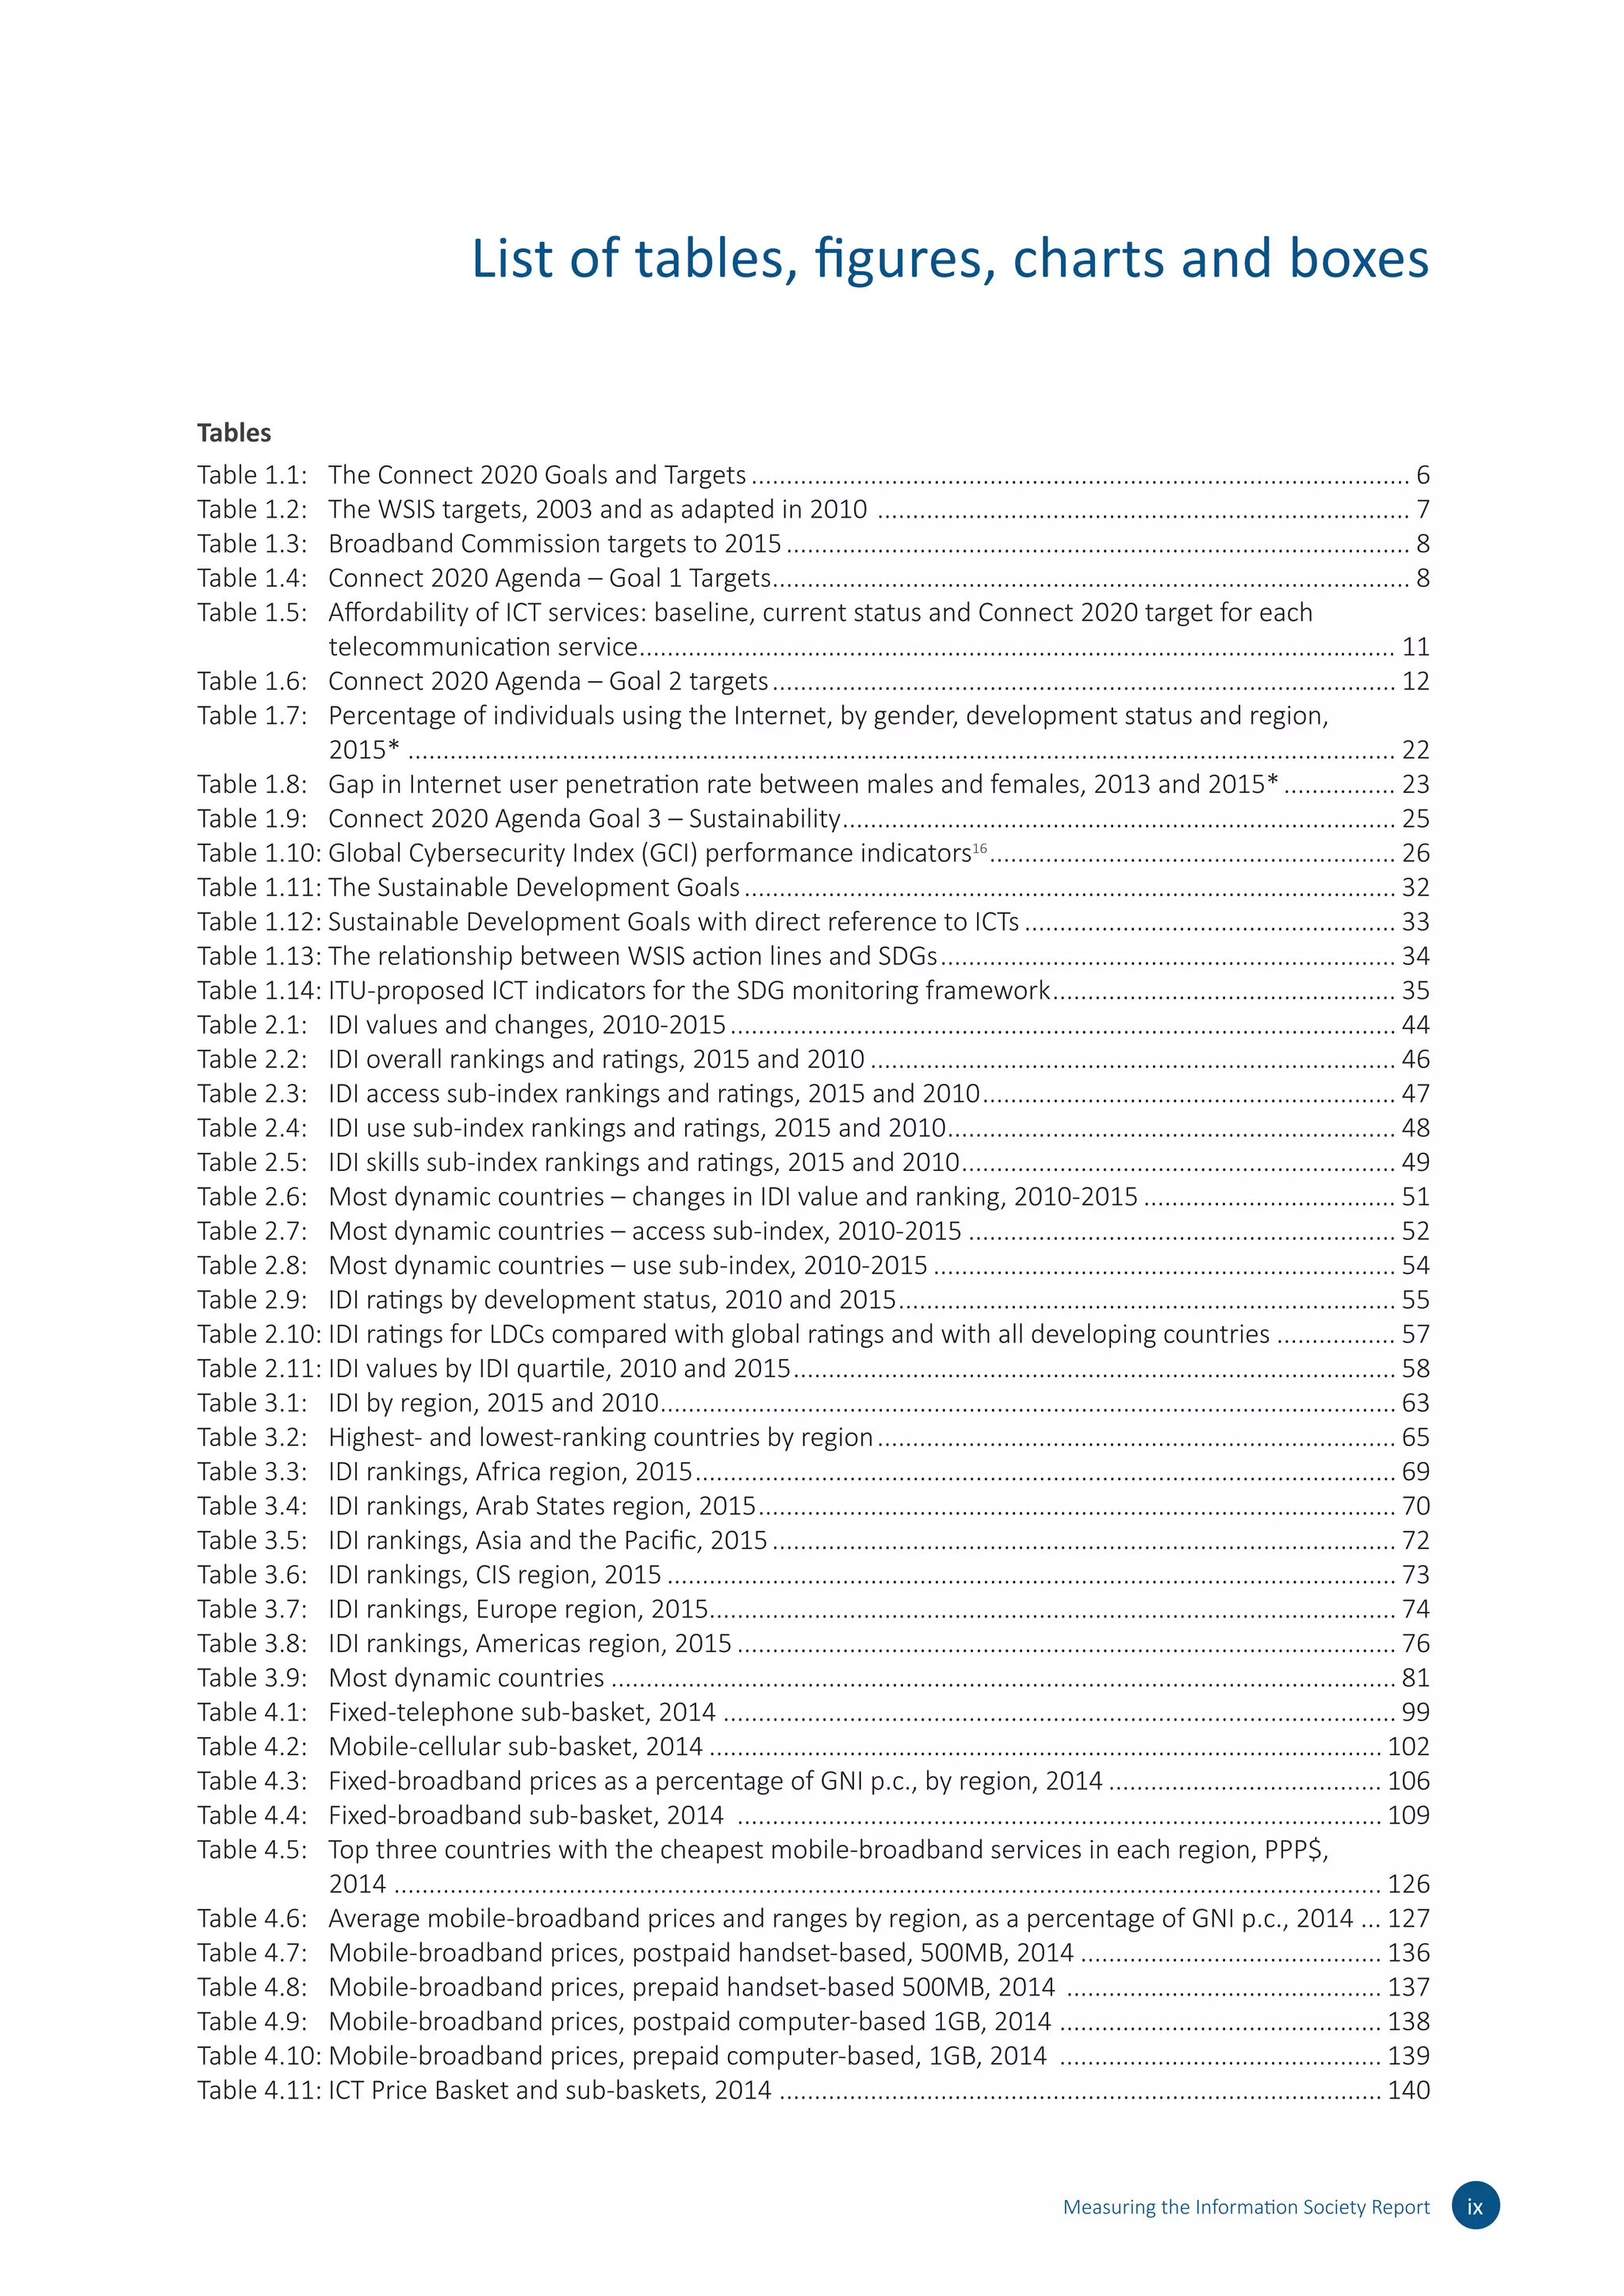
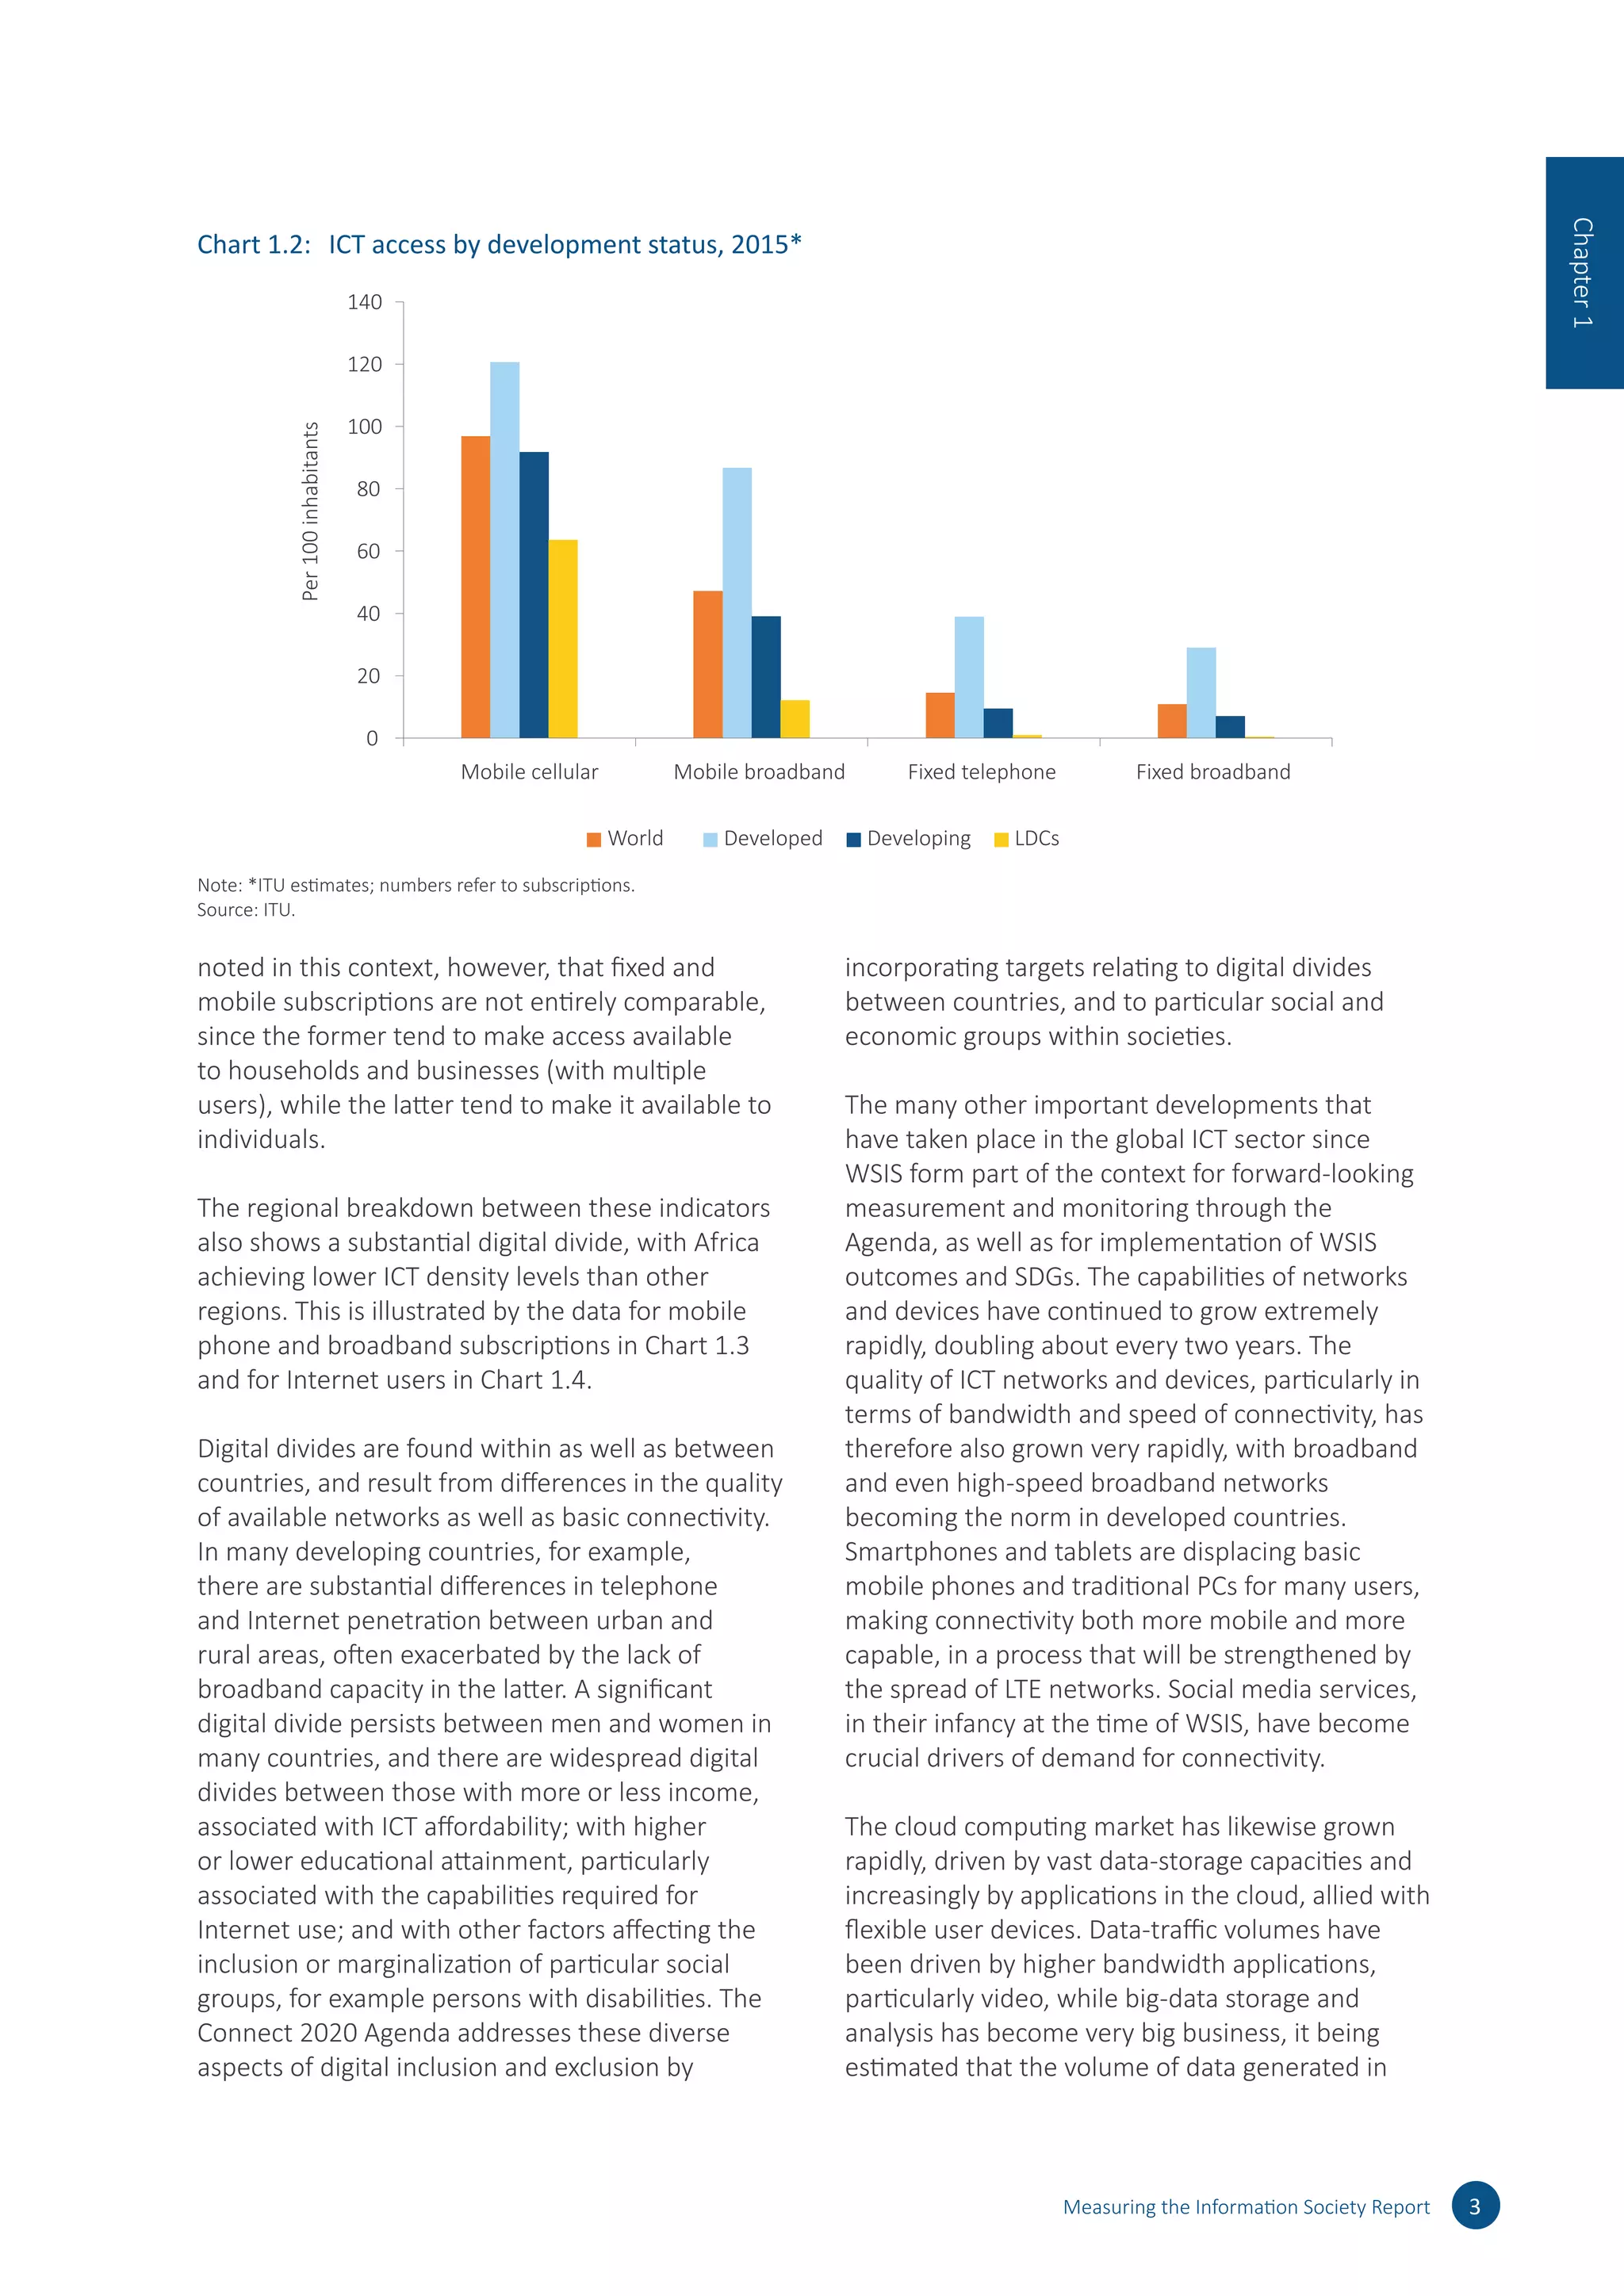
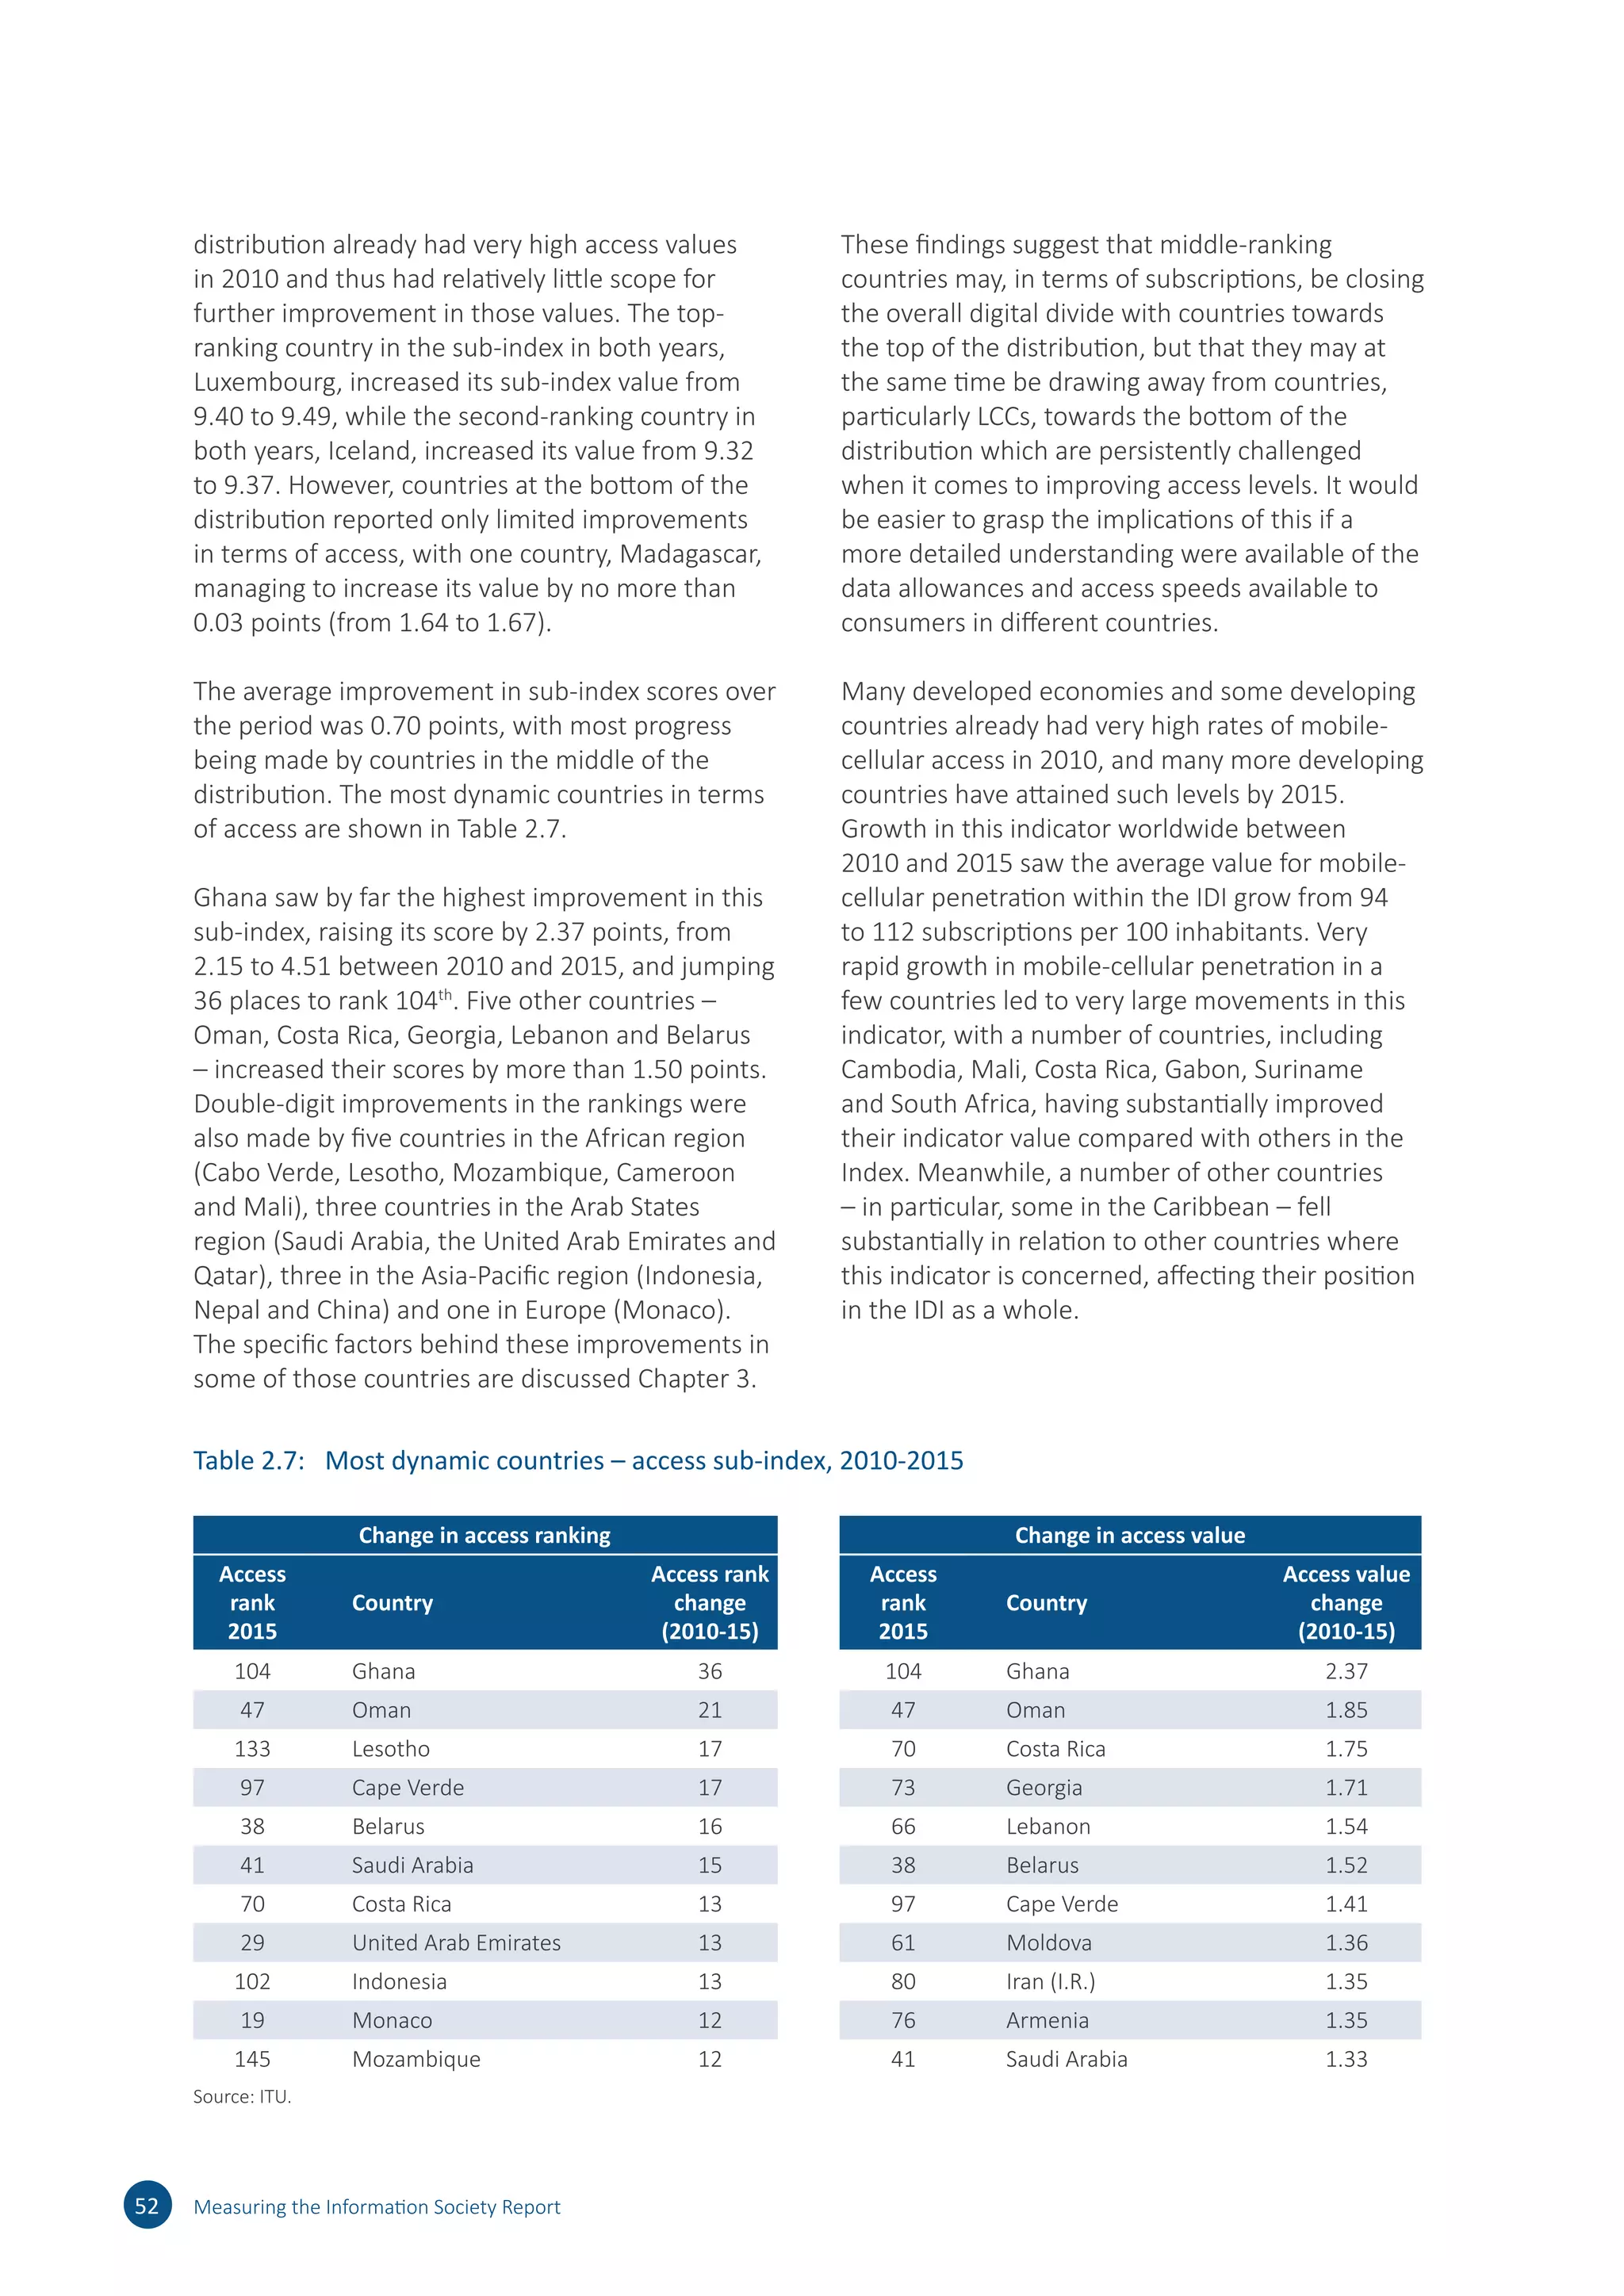
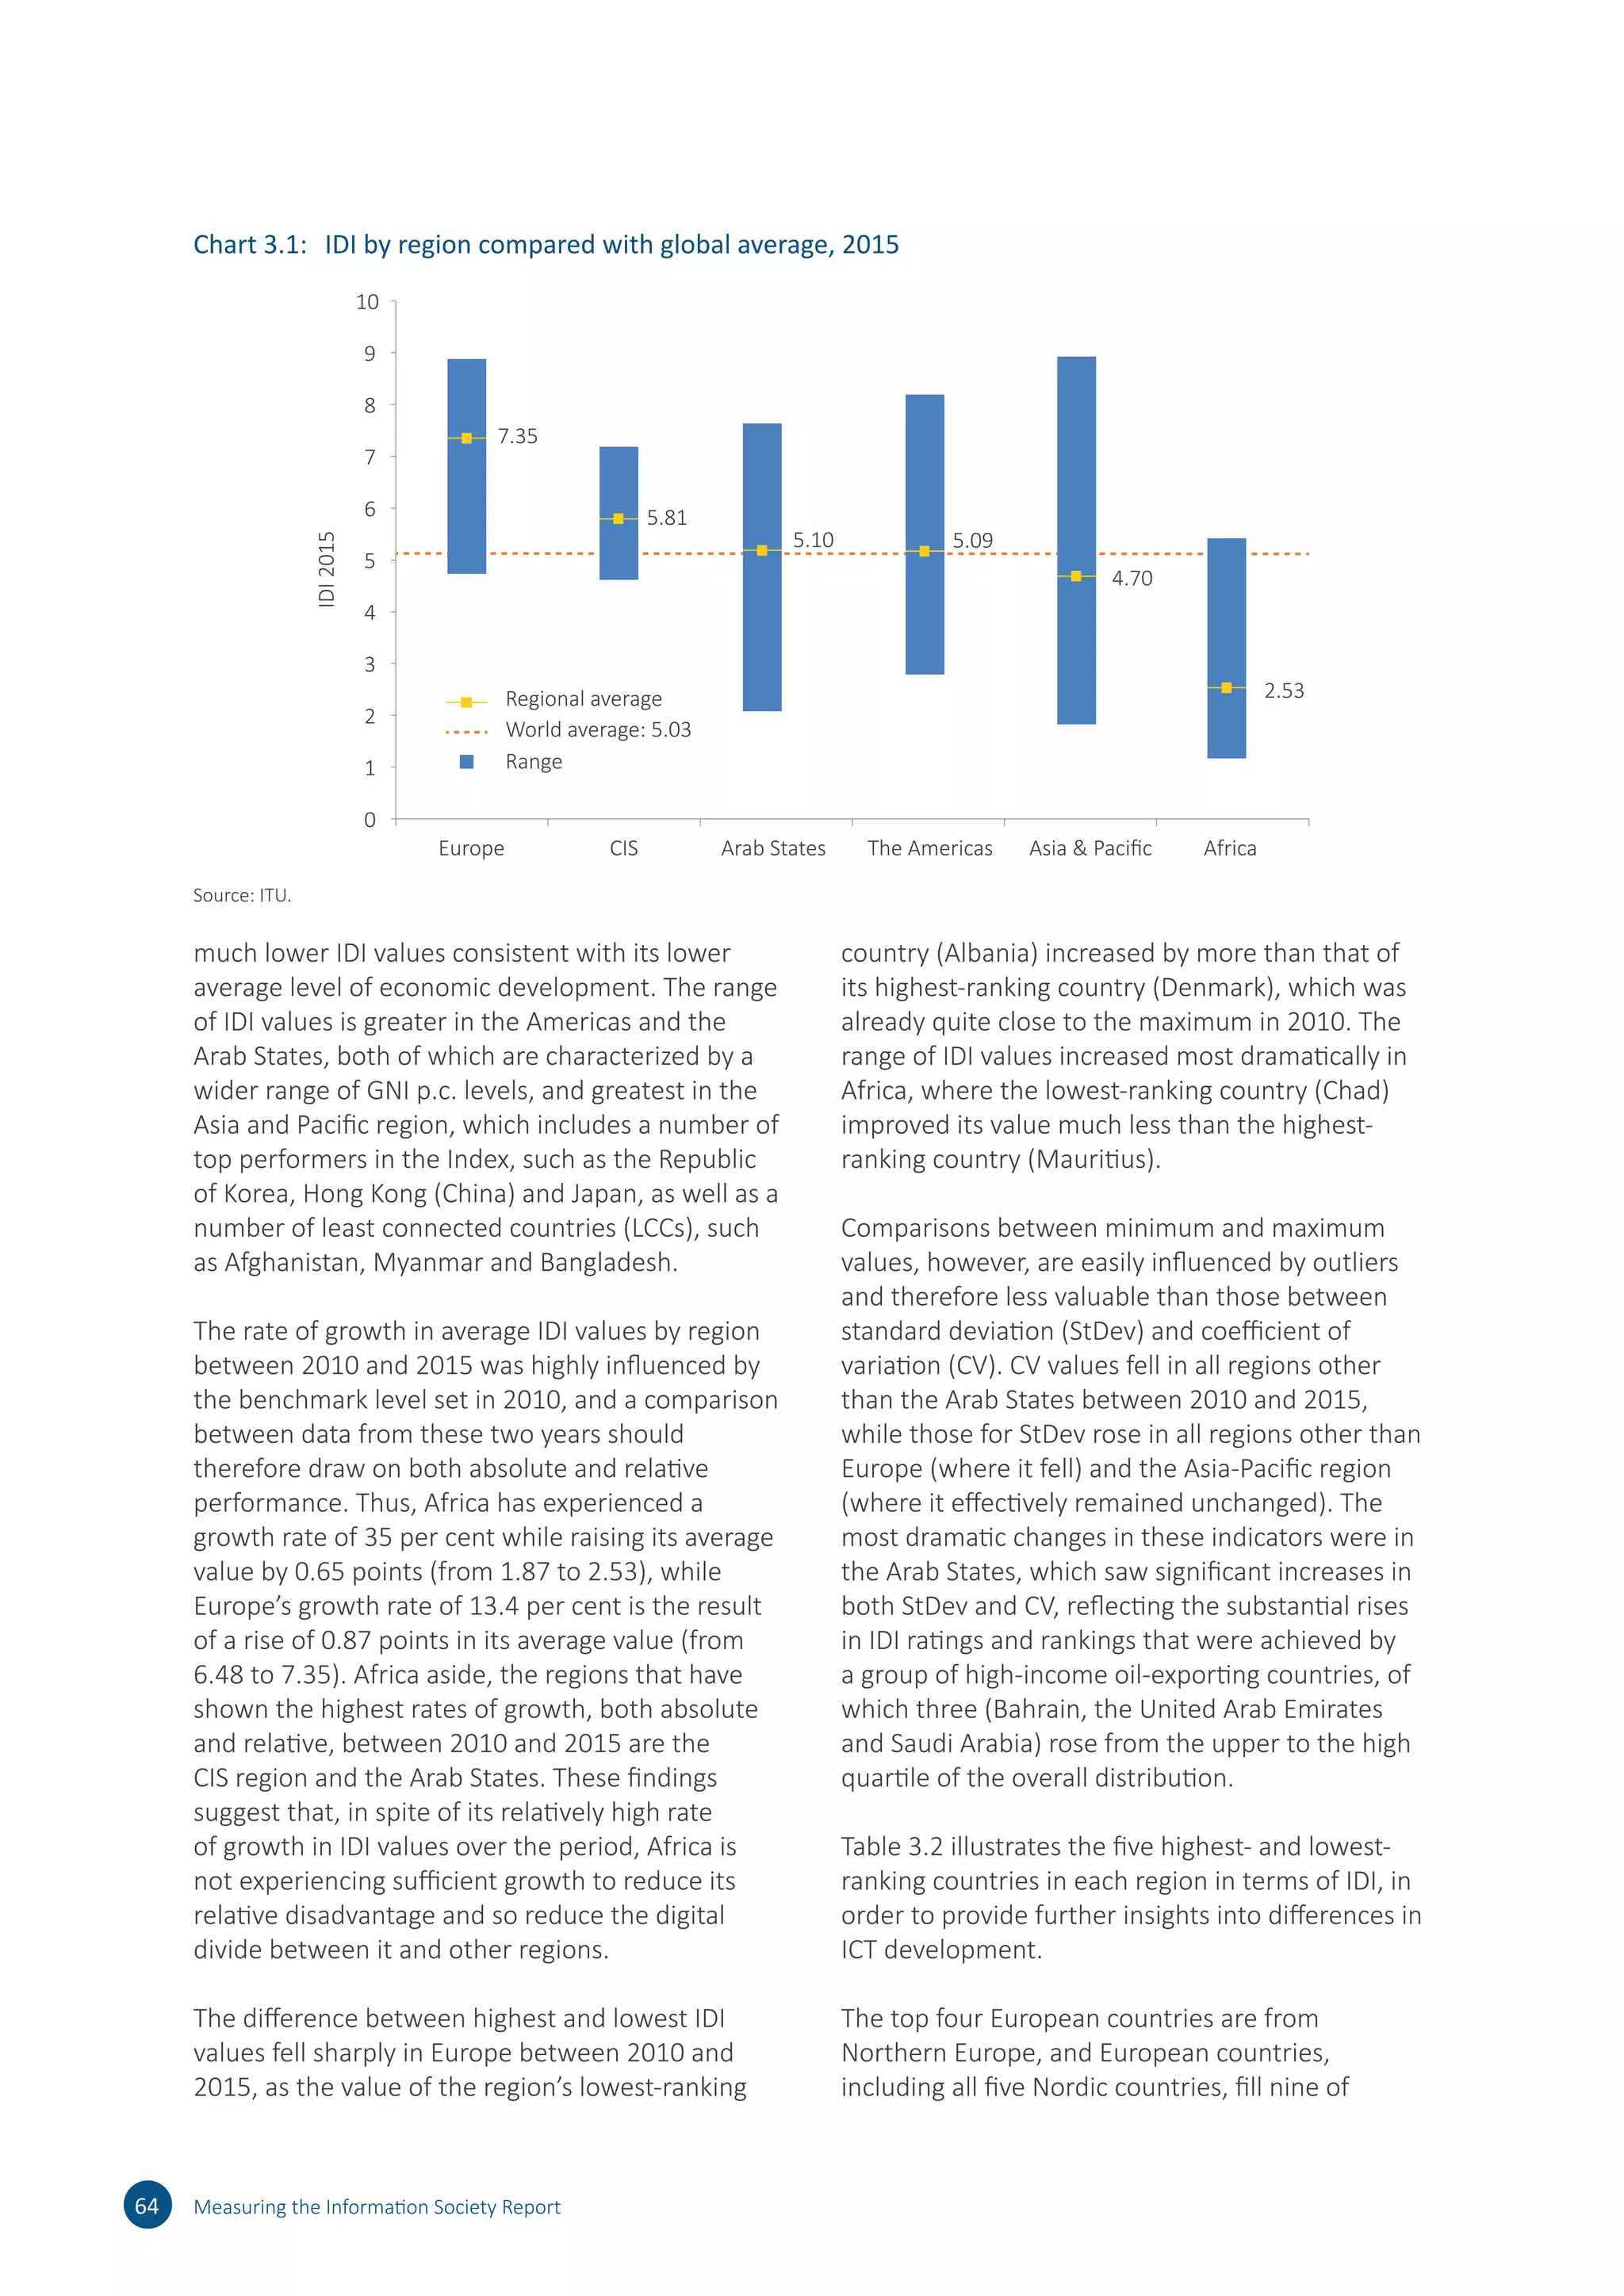
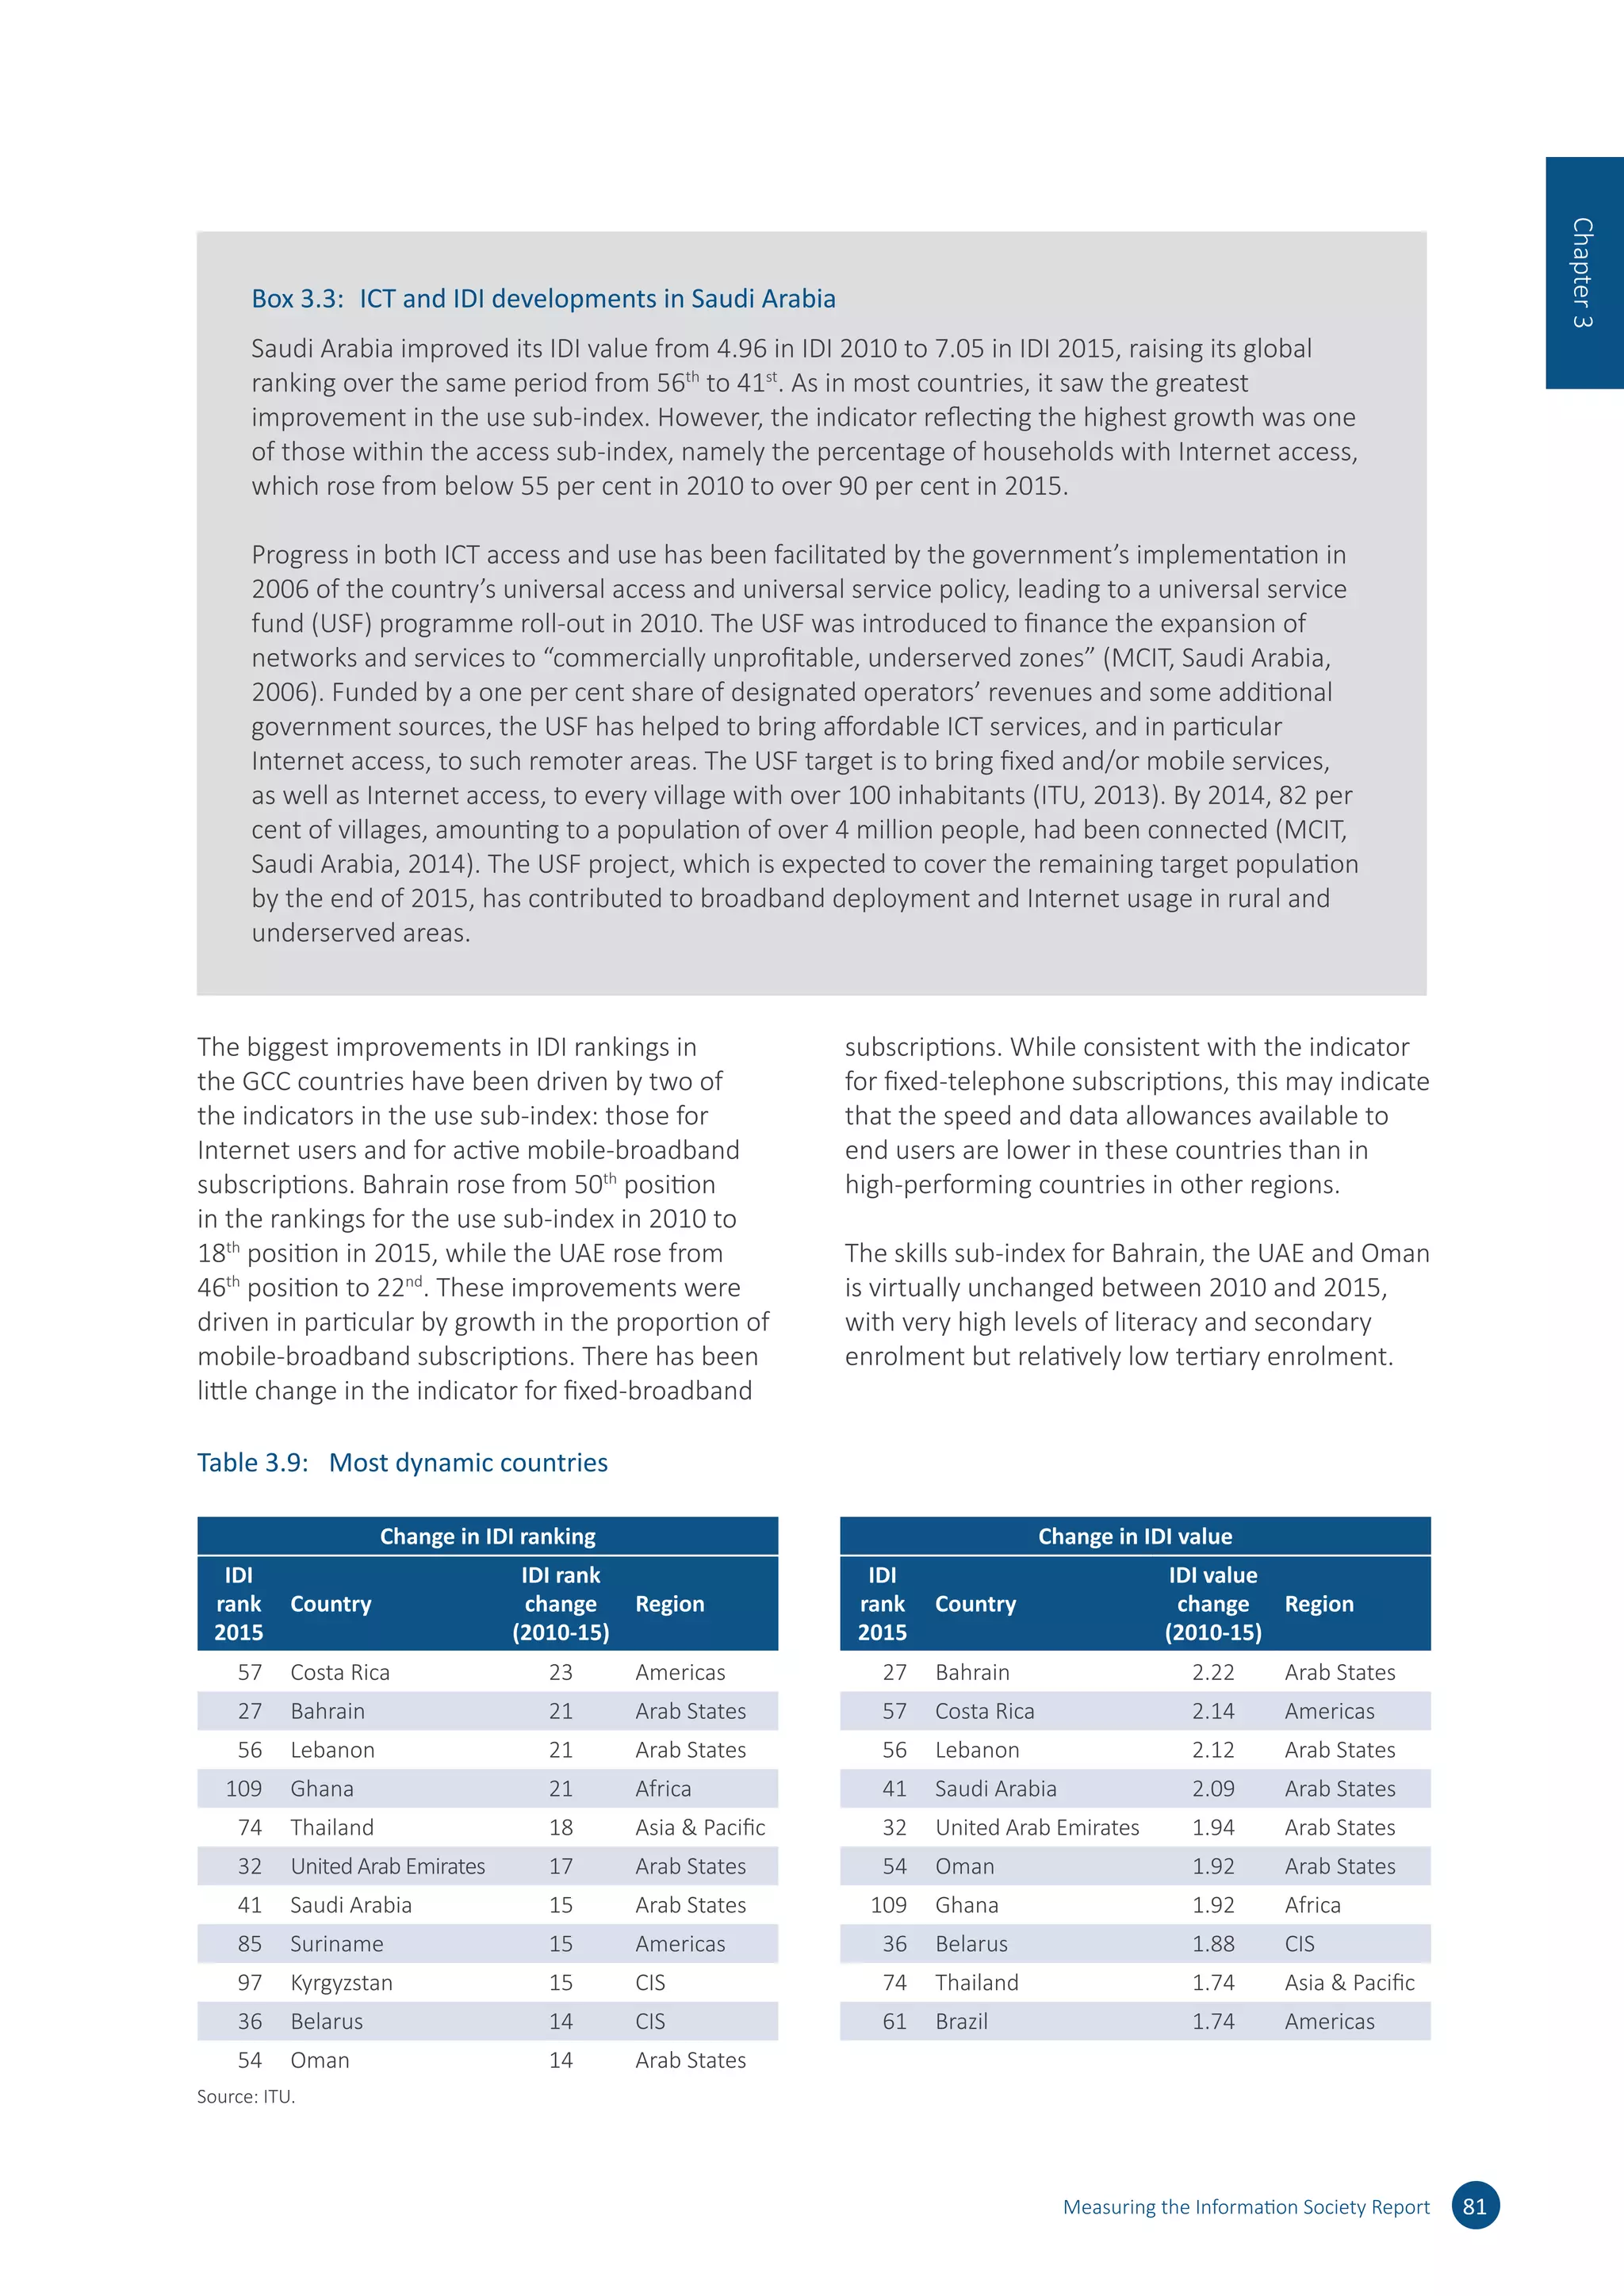
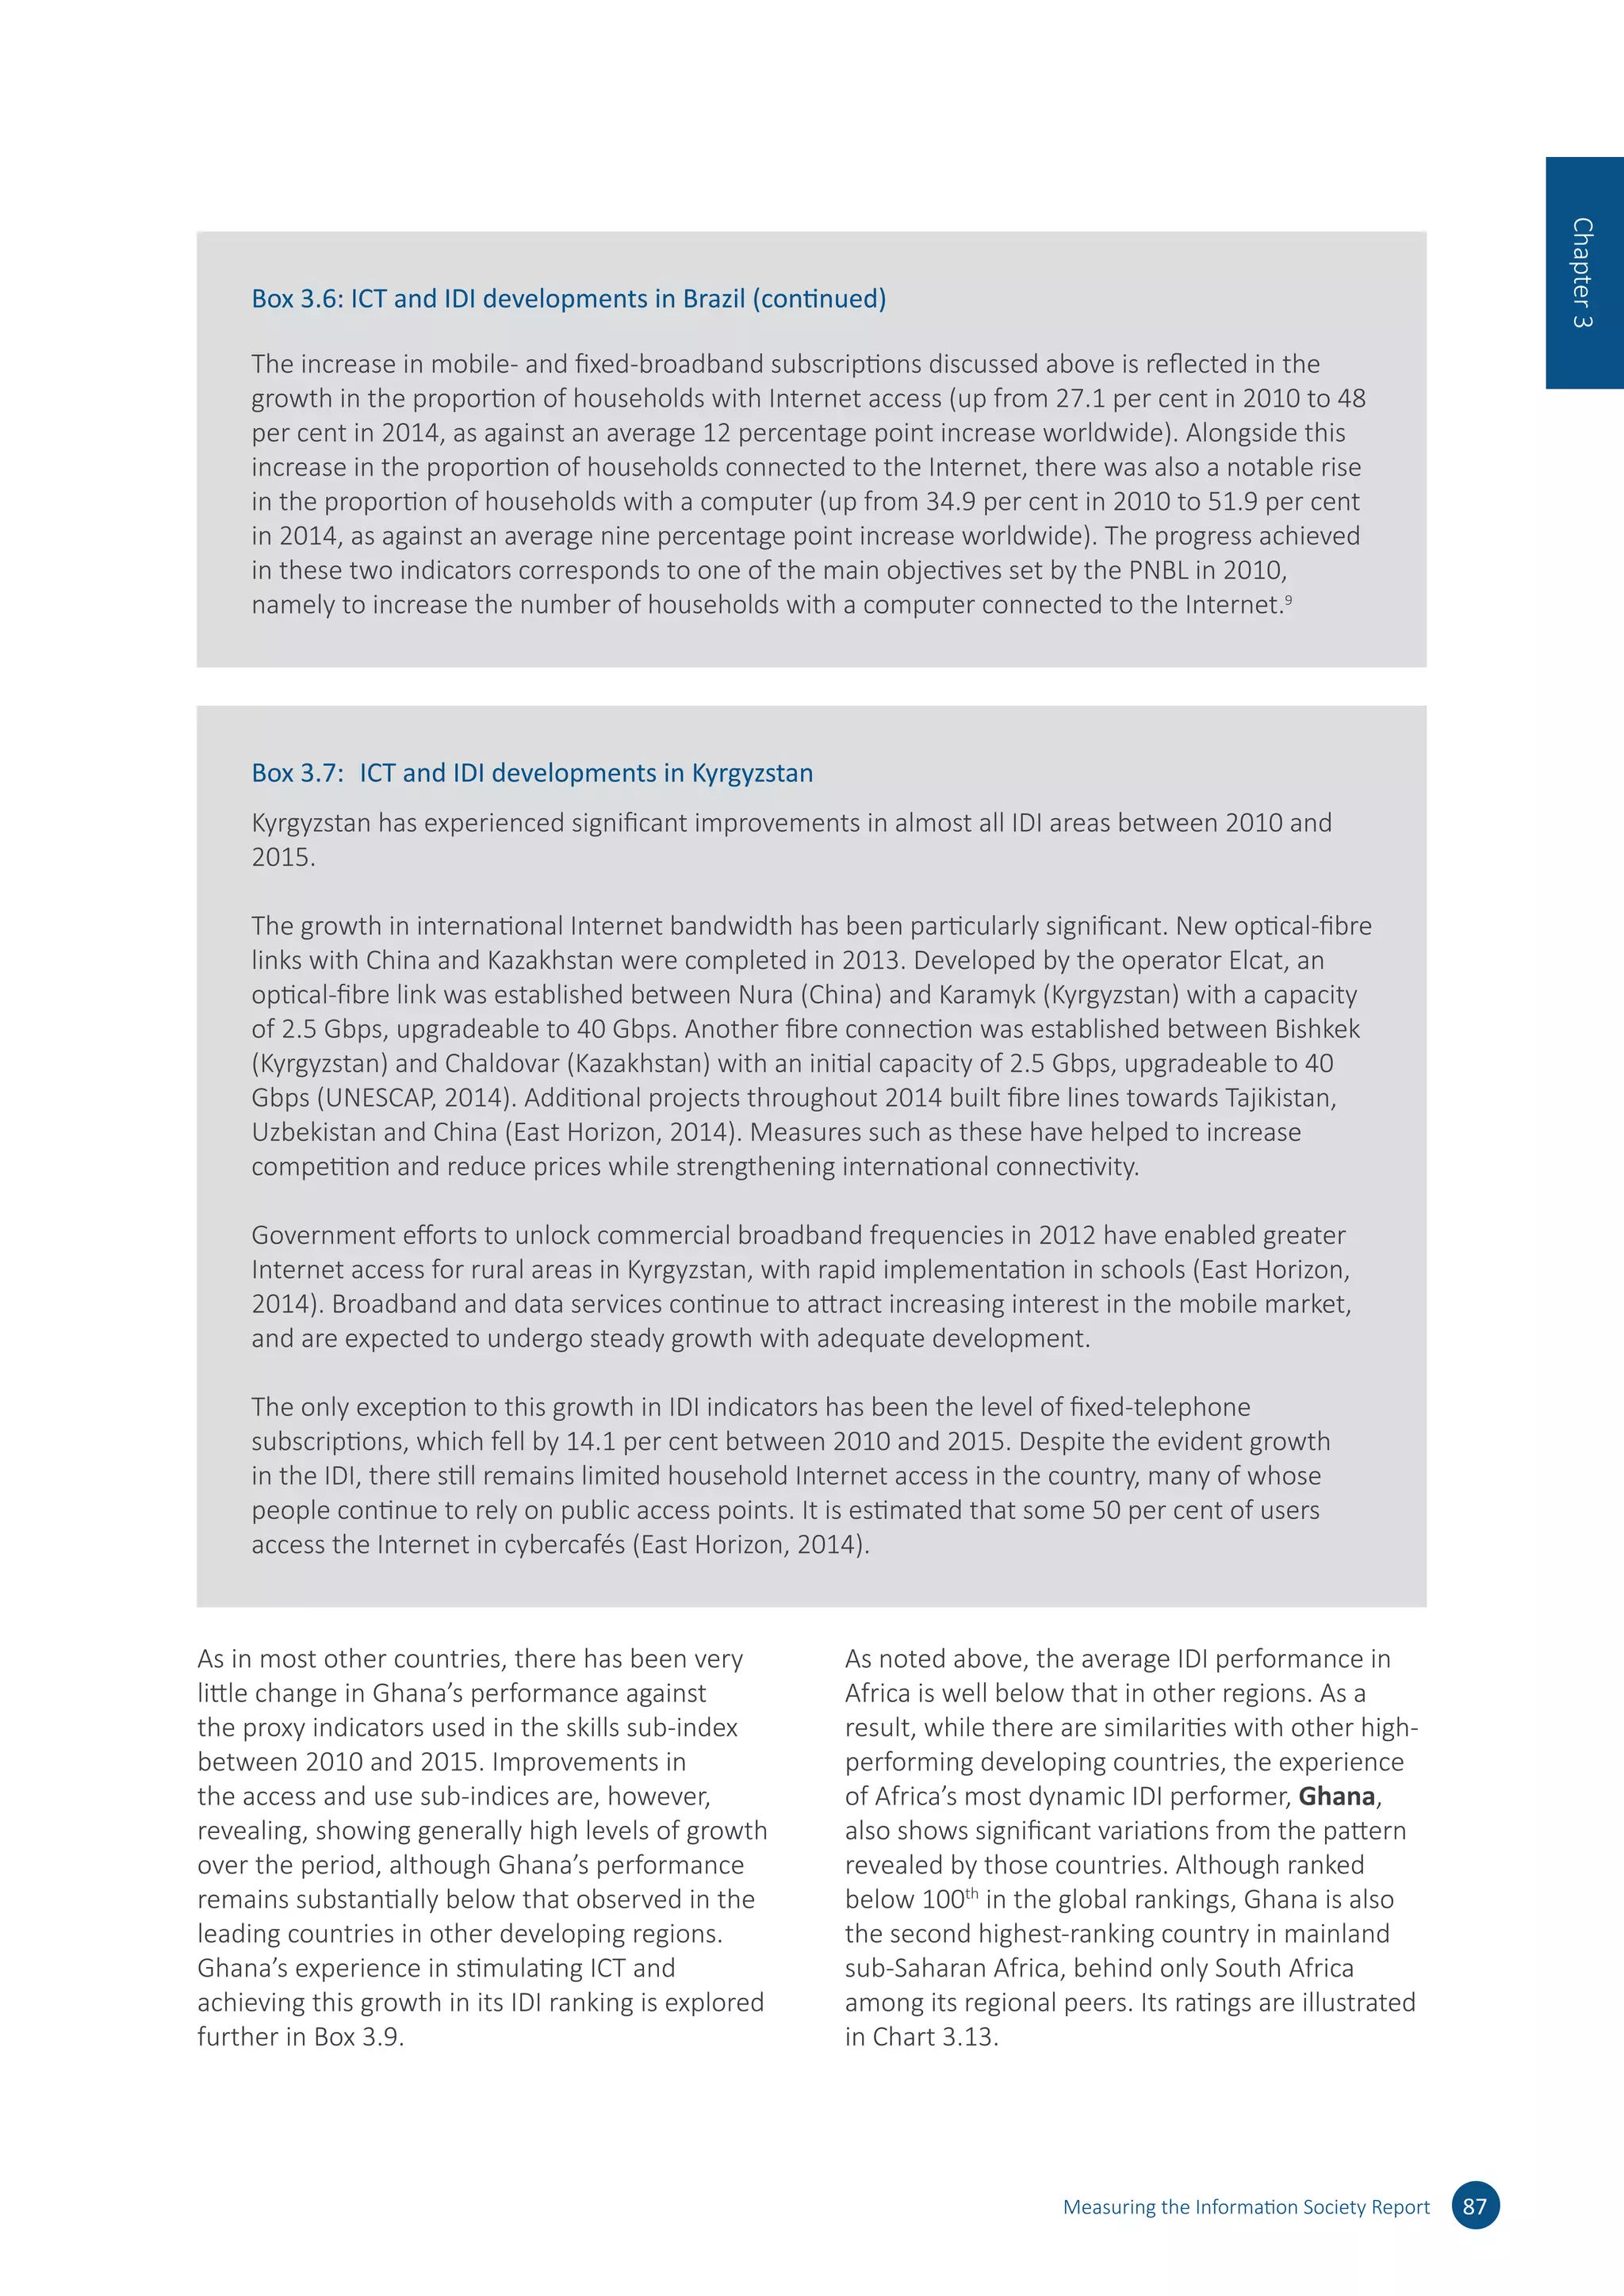
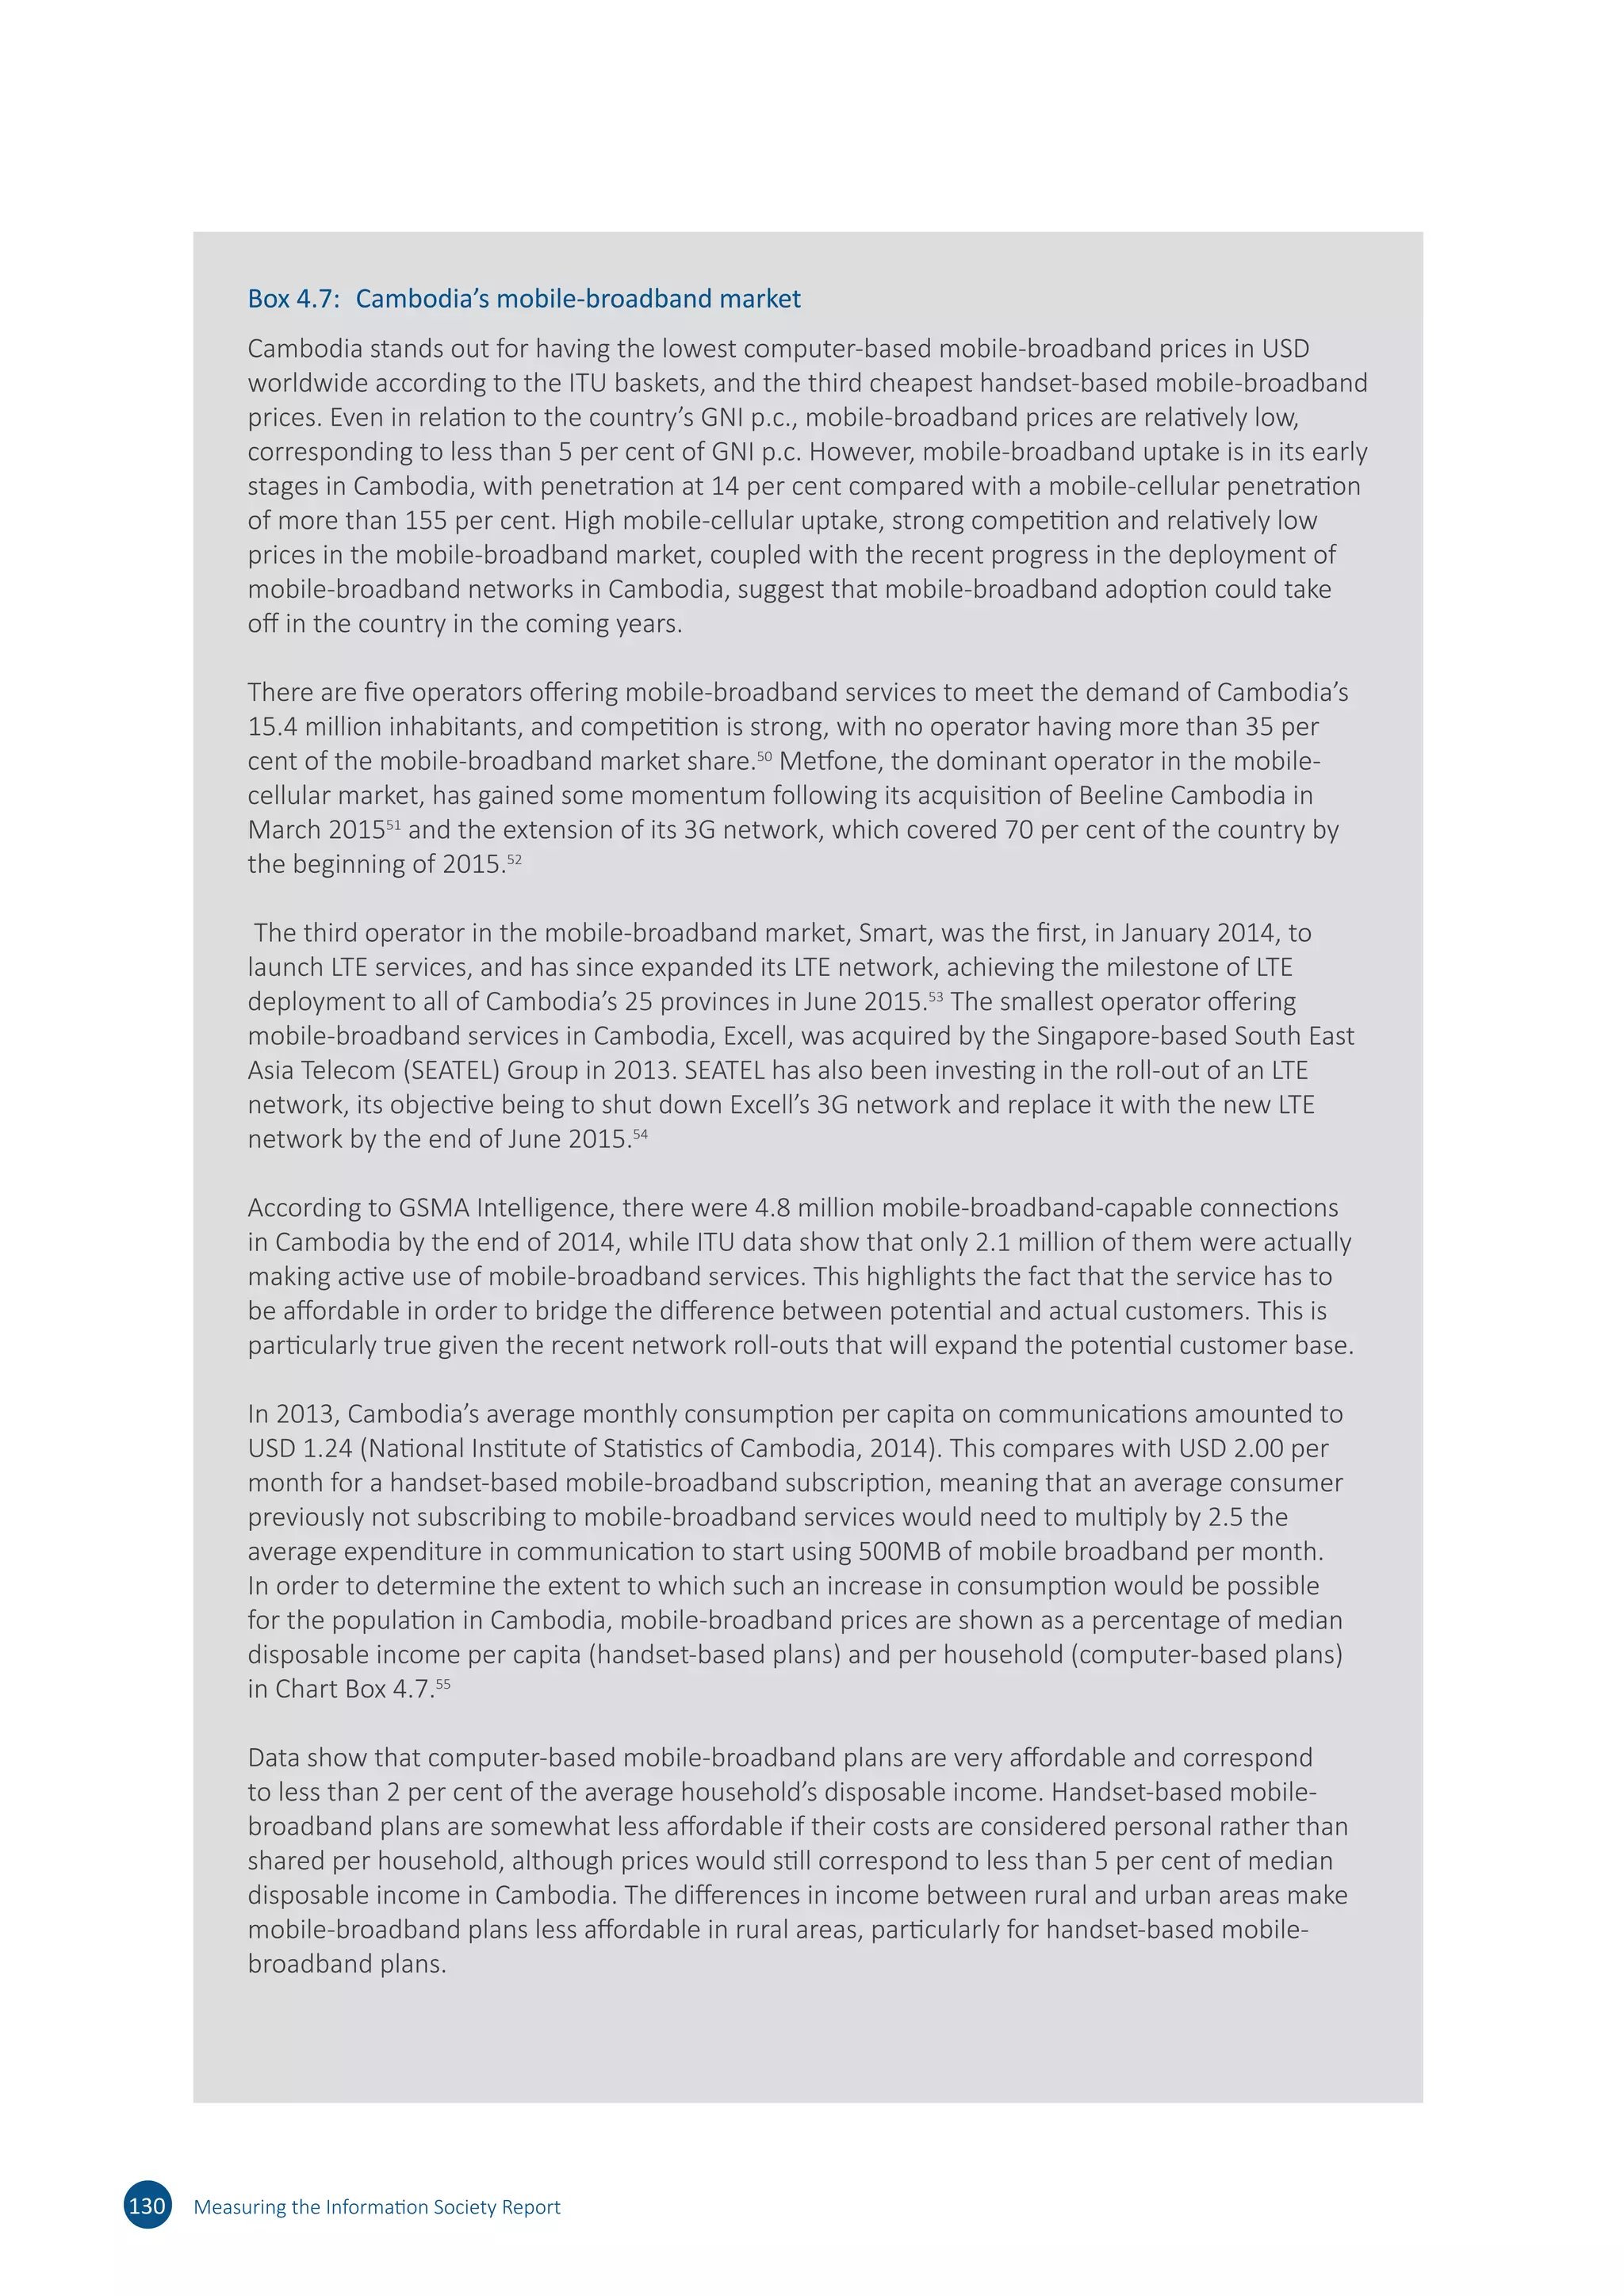
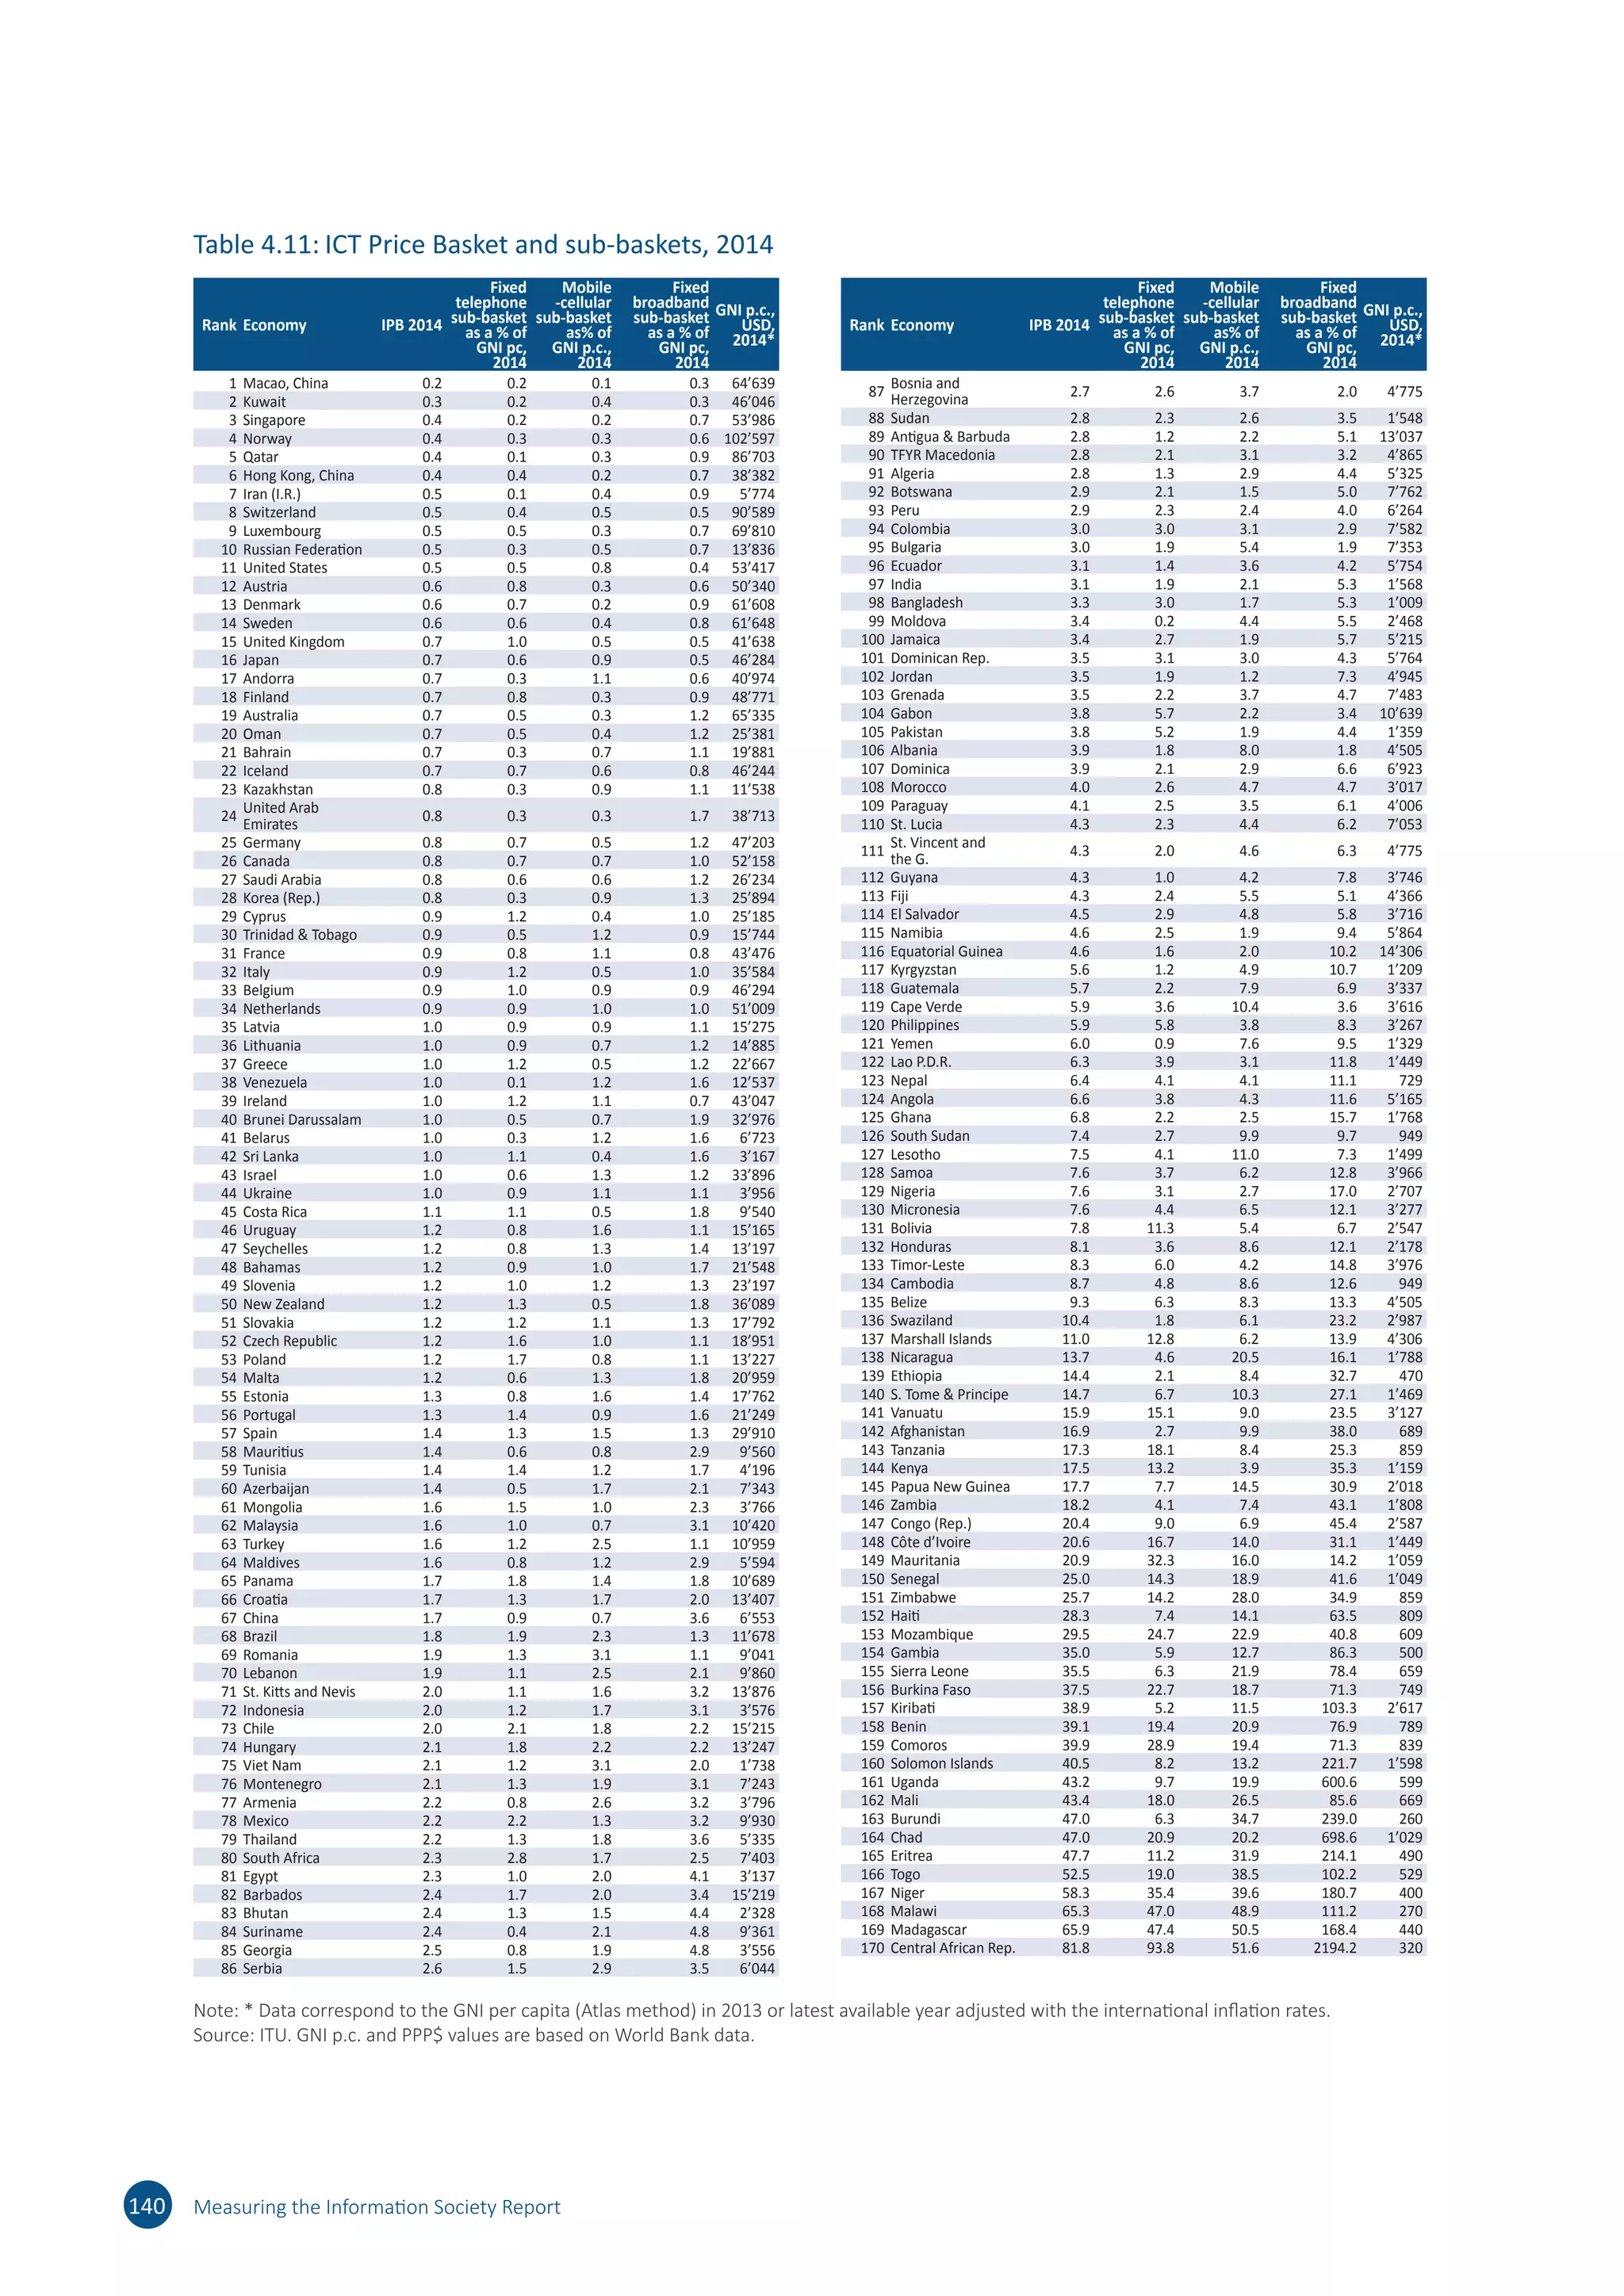
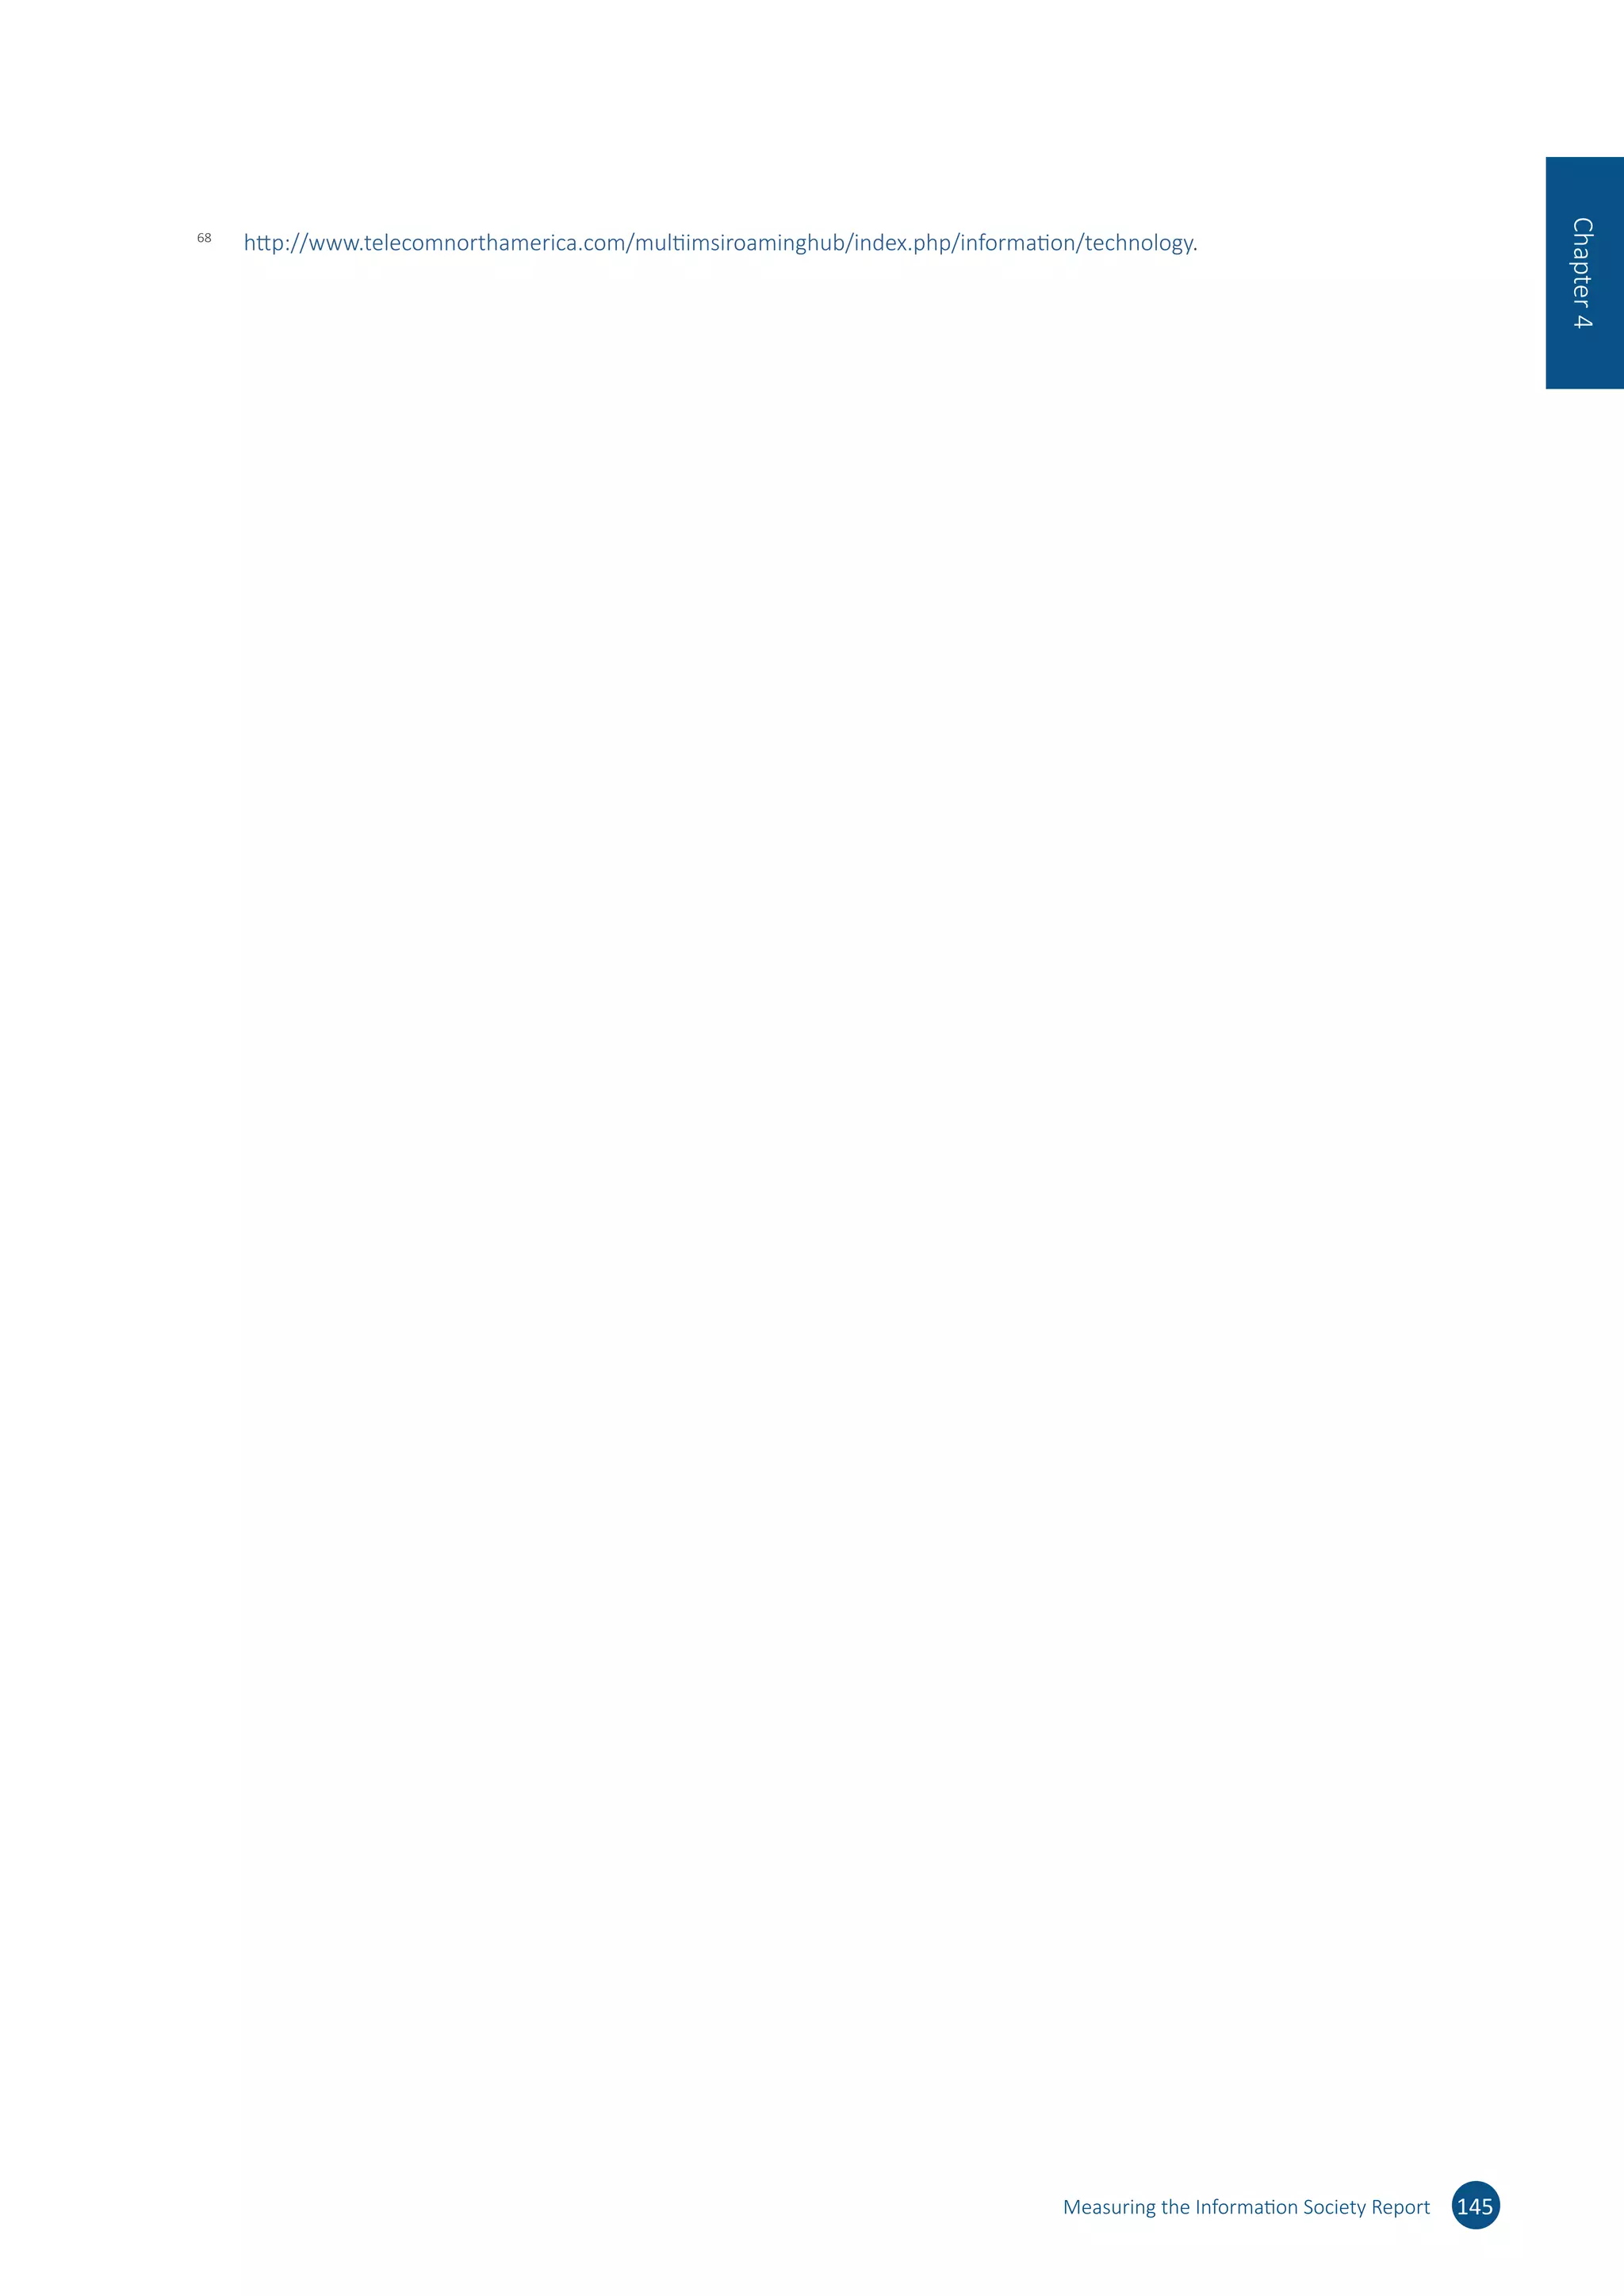
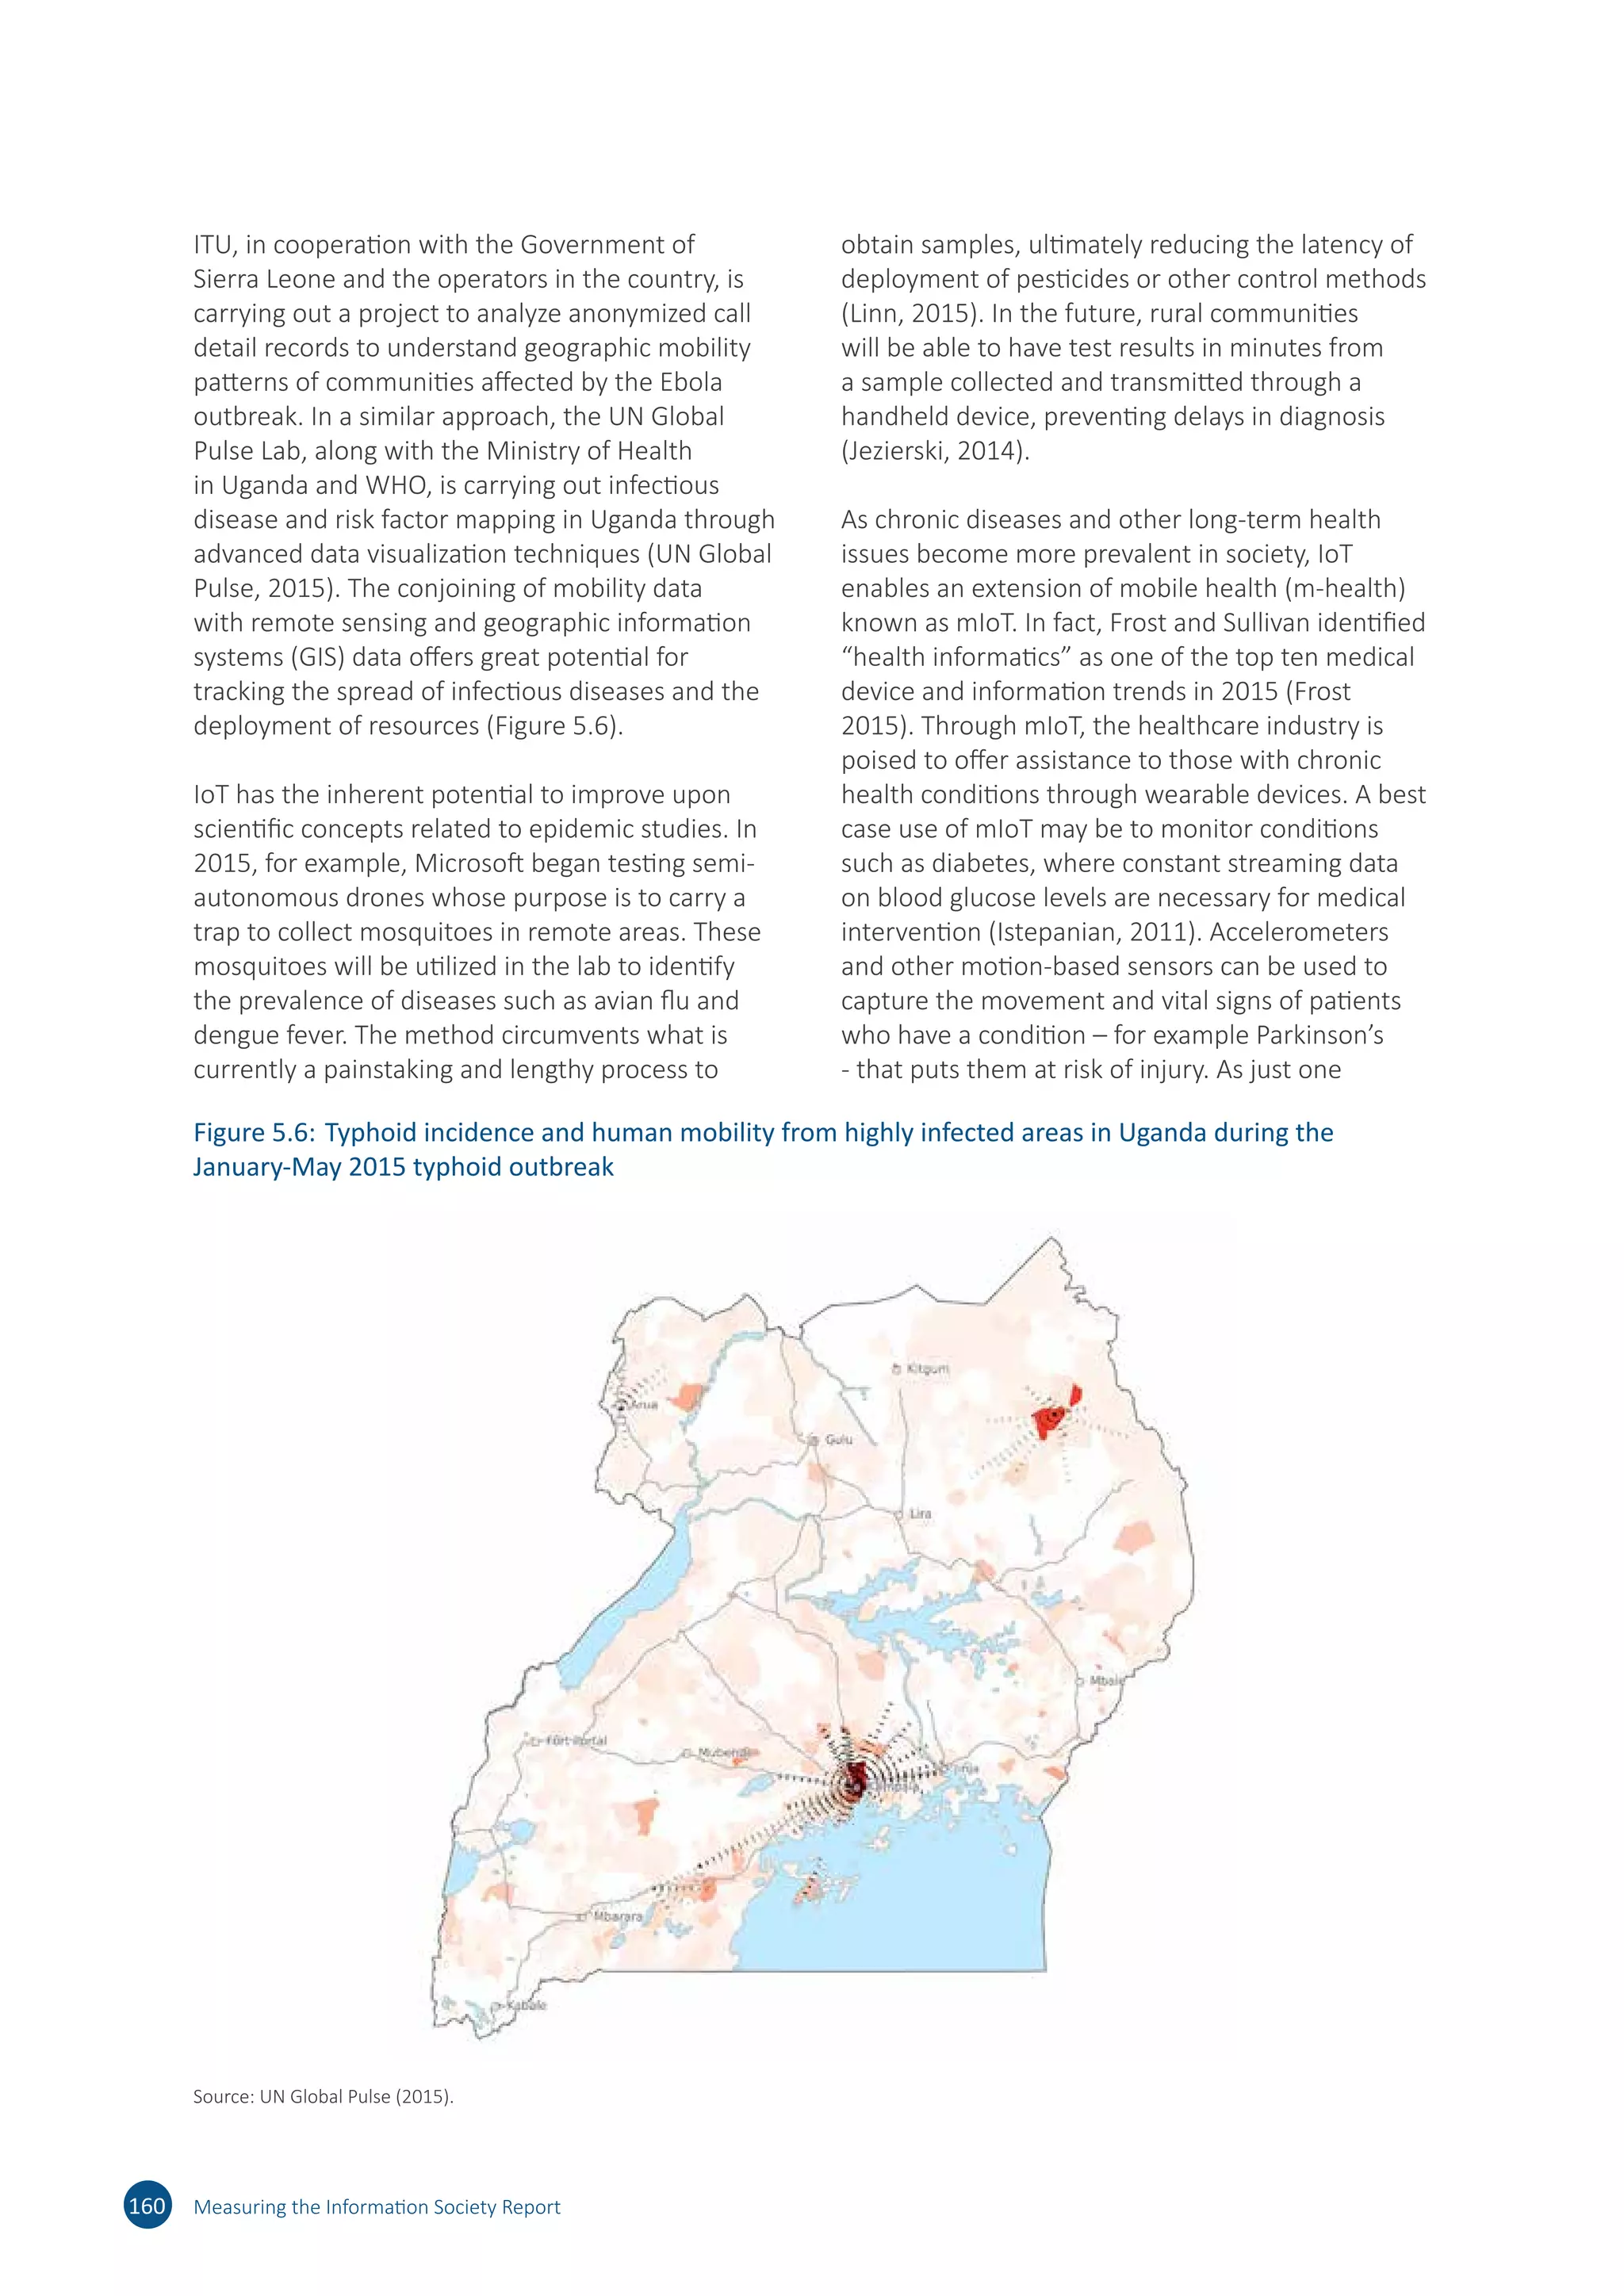
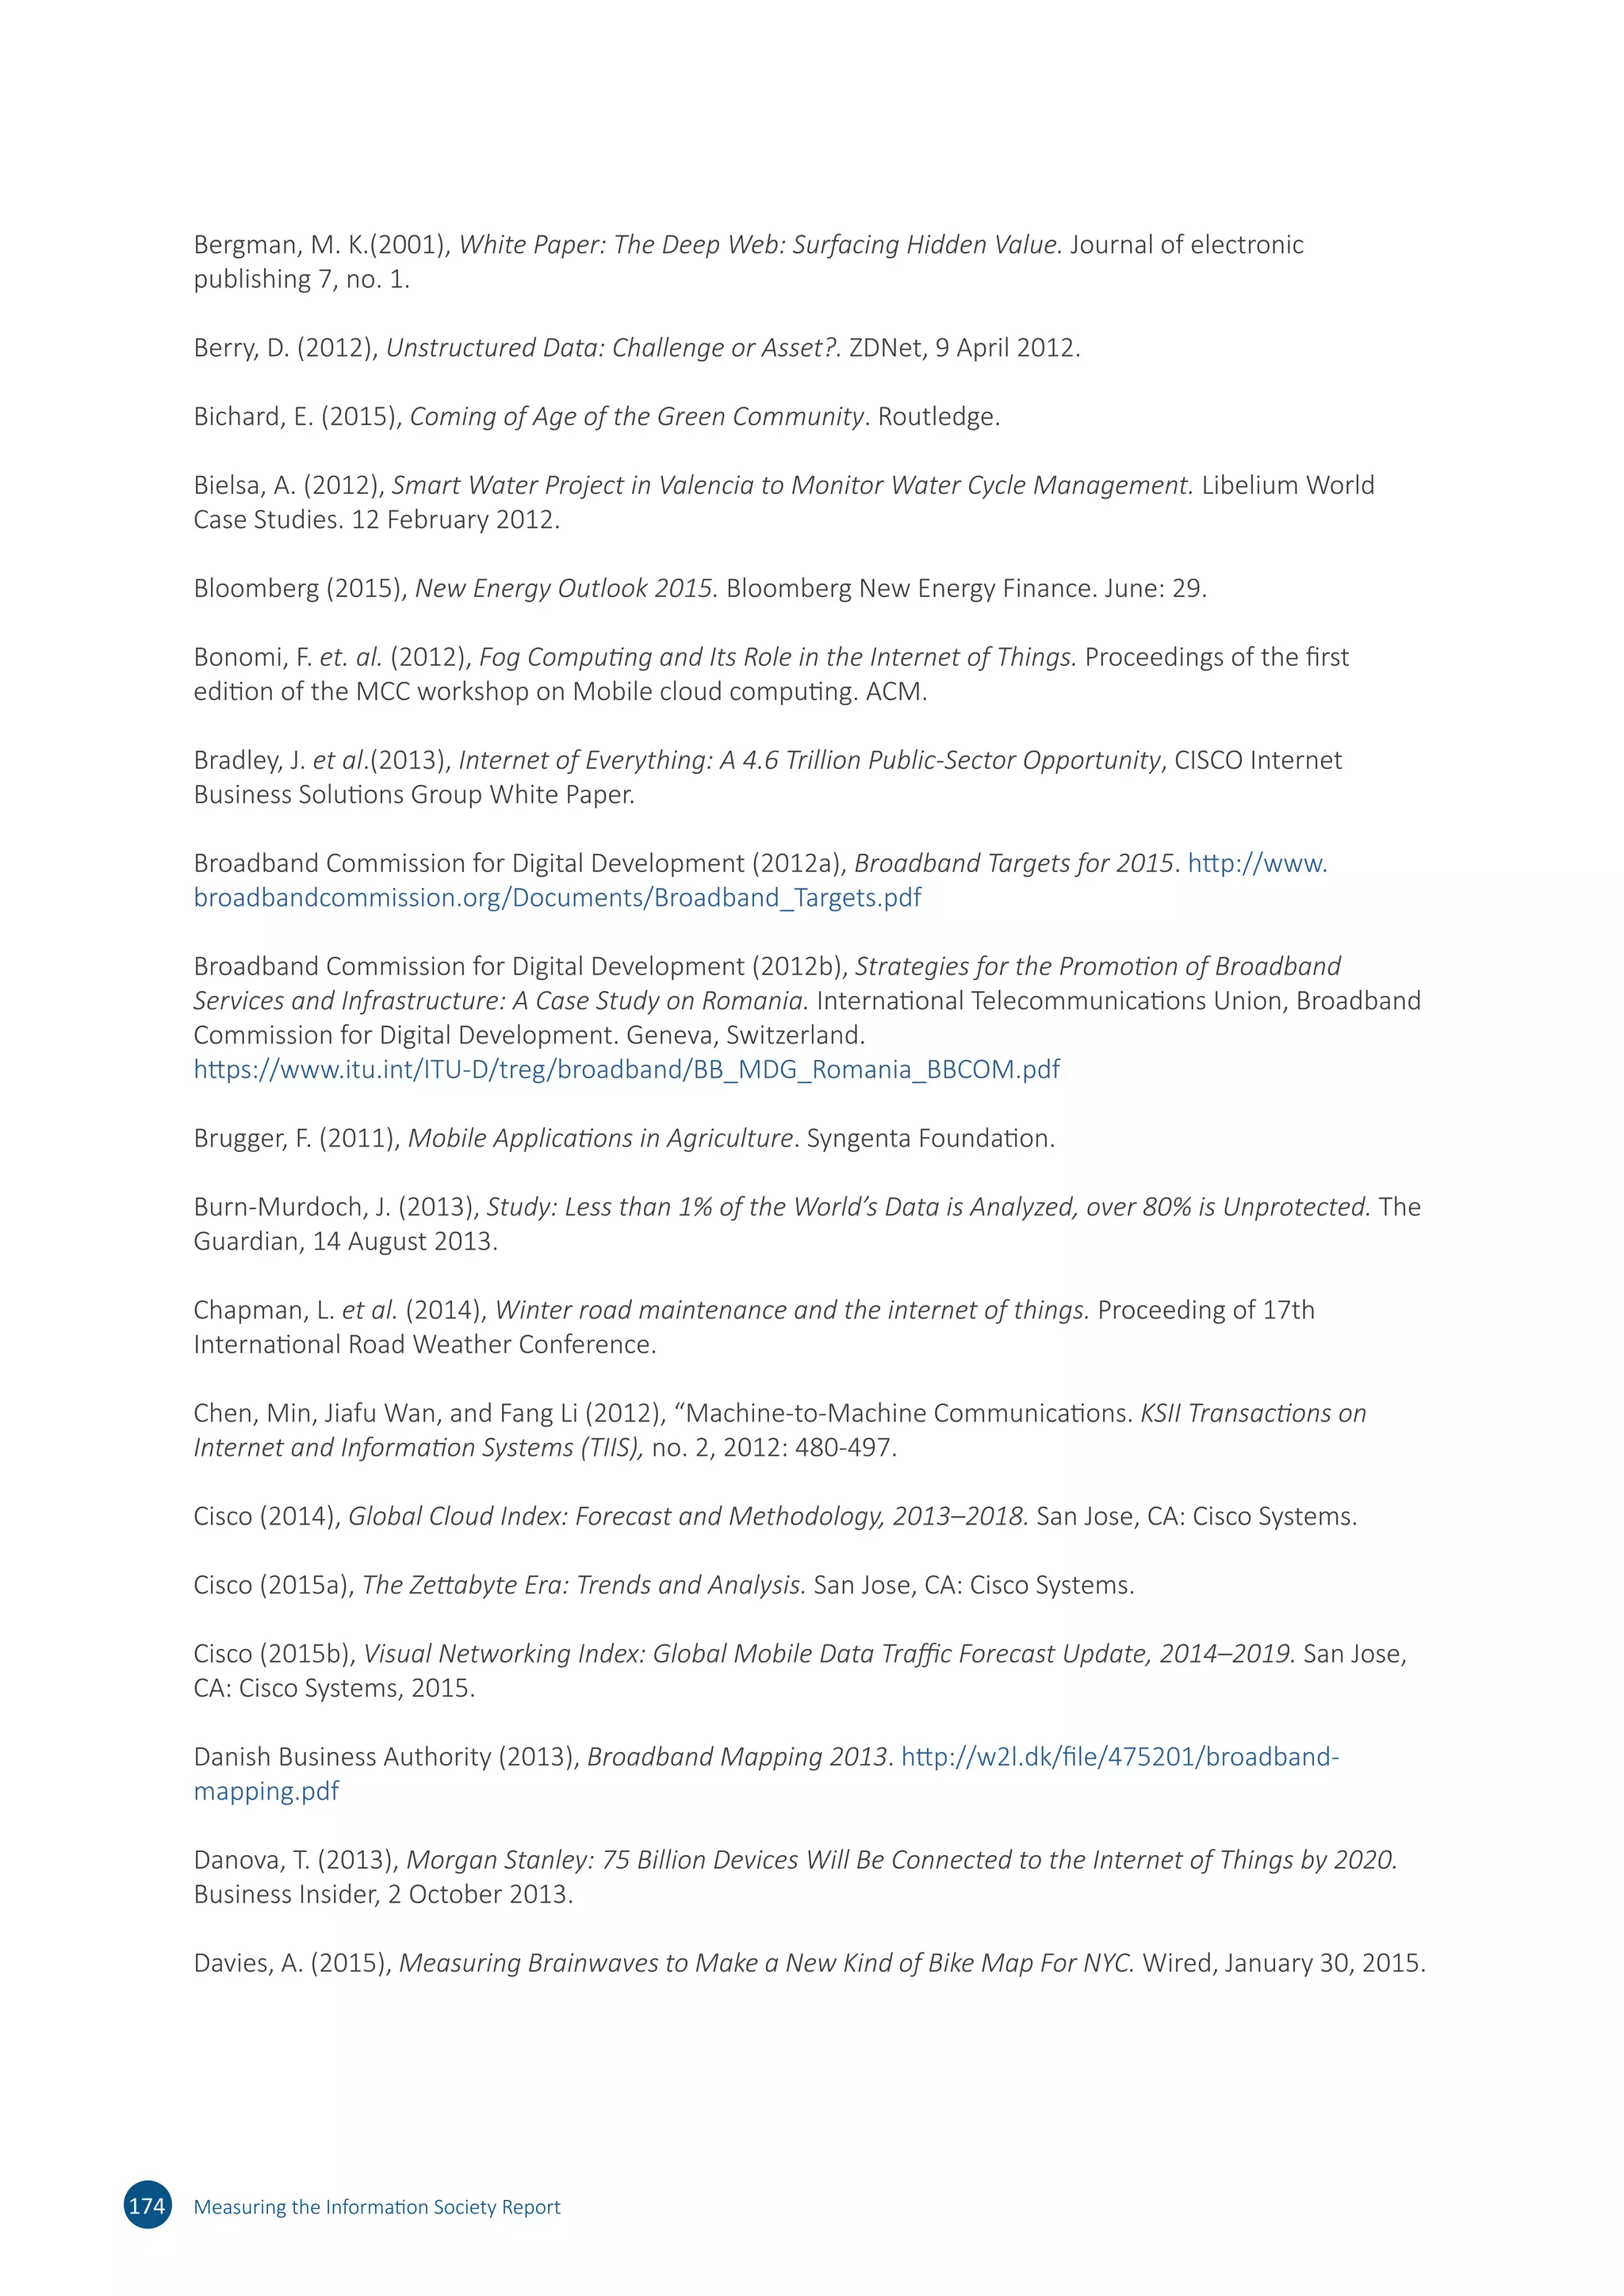
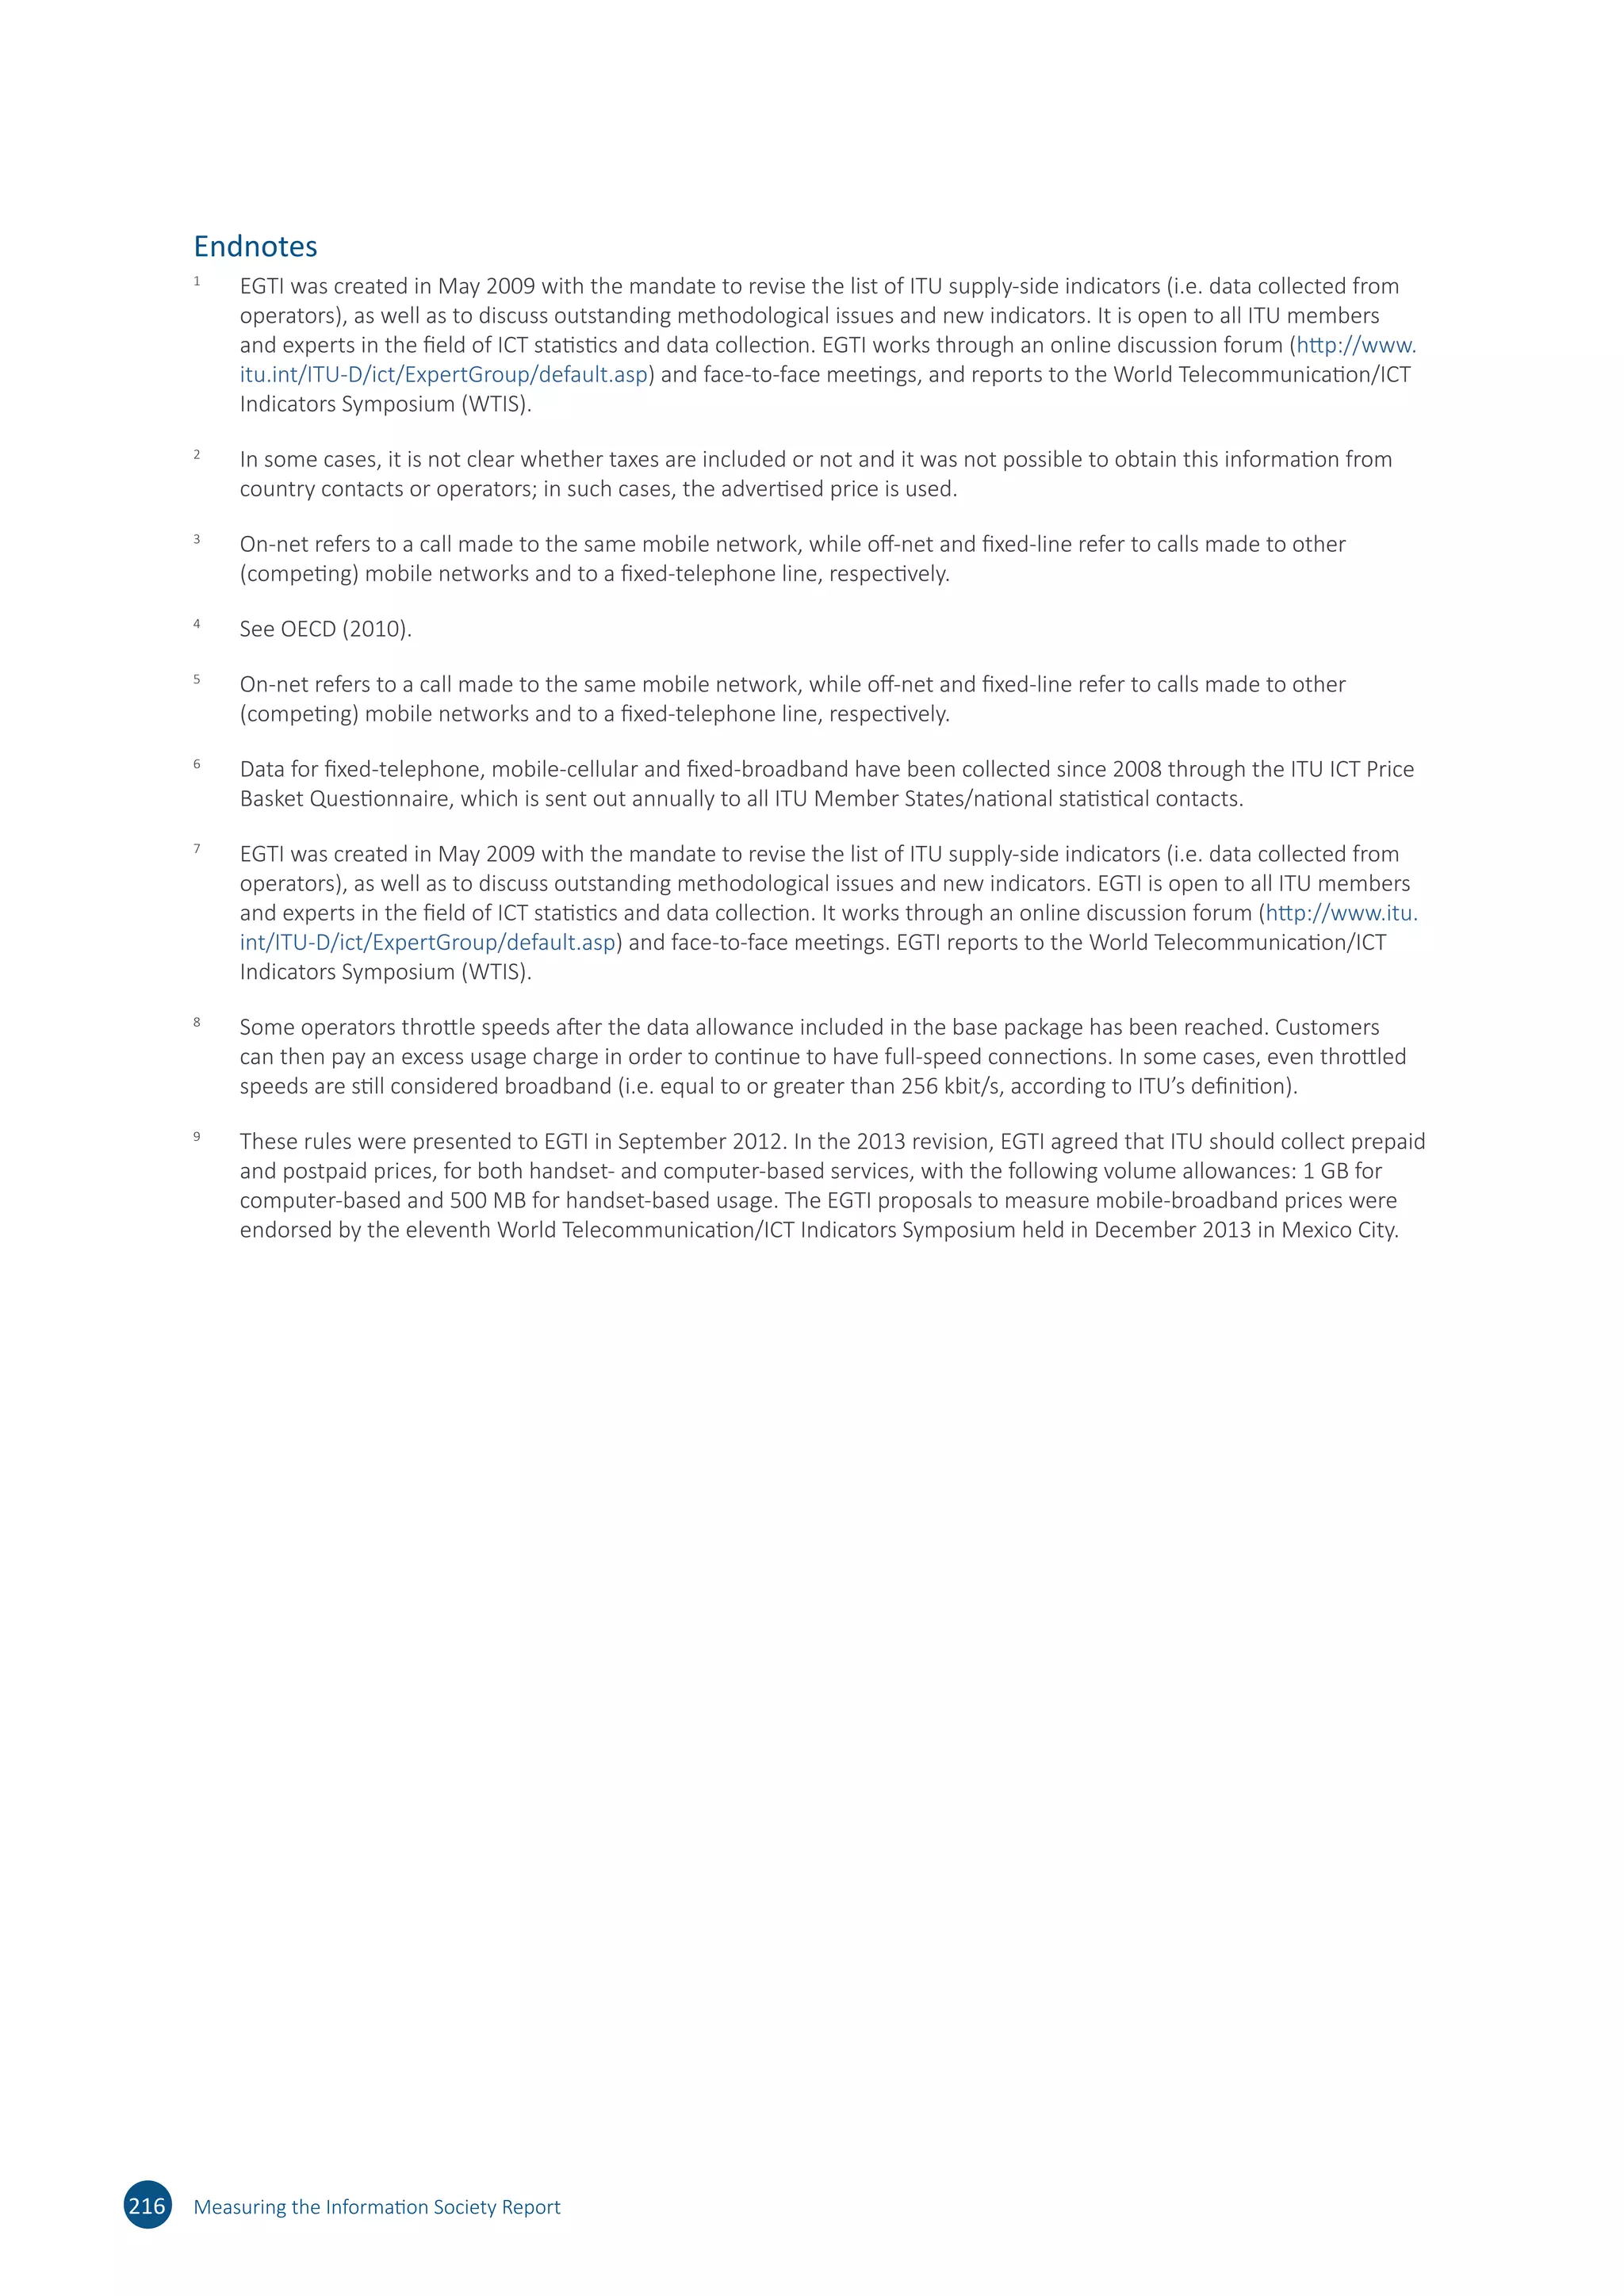
Annex Table 2.7: IDI country ranks and 90 per cent intervals
Countries IDI rank 90% interval
Afghanistan 156 [156, 158]
Albania 94 [87, 95]
Algeria 113 [113, 117]
Andorra 28 [27, 30]
Angola 140 [132, 142]
Antigua Barbuda 62 [62, 64]
Argentina 52 [51, 55]
Armenia 76 [74, 79]
Australia 13 [13, 13]
Austria 25 [24, 27]
Azerbaijan 67 [63, 67]
Bahrain 27 [24, 30]
Bangladesh 144 [143, 147]
Barbados 29 [28, 30]
Belarus 36 [33, 40]
Belgium 21 [21, 21]
Belize 116 [114, 117]
Benin 151 [150, 157]
Bhutan 119 [112, 121]
Bolivia 107 [107, 108]
Bosnia and Herzegovina 77 [74, 79]
Botswana 111 [109, 112]
Brazil 61 [58, 63]
Brunei Darussalam 71 [69, 79]
Bulgaria 50 [50, 50]
Burkina Faso 159 [152, 159]
Cambodia 130 [129, 136]
Cameroon 147 [145, 153]
Canada 23 [23, 25]
Cape Verde 96 [92, 97]
Chad 167 [166, 167]
Chile 55 [54, 56]
China 82 [77, 84]
Colombia 75 [73, 77]
Congo (Dem. Rep.) 160 [159, 161]
Congo (Rep.) 141 [141, 147]
Costa Rica 57 [57, 58]
Côte d’Ivoire 137 [130, 139]
Croatia 42 [41, 42]
Cuba 129 [125, 137]
Cyprus 53 [52, 54]
Czech Republic 34 [33, 36]
Denmark 2 [1, 3]
Djibouti 148 [143, 151]
Dominica 80 [80, 83]
Dominican Rep. 103 [102, 106]
Ecuador 90 [90, 94]
Egypt 100 [99, 101]
El Salvador 106 [103, 106]
Equatorial Guinea 146 [143, 147]
Eritrea 166 [166, 167]
Estonia 20 [17, 20]
Ethiopia 165 [162, 165]
Fiji 101 [100, 101]
Finland 12 [11, 14]
France 17 [15, 20]
Gabon 133 [130, 151]
Gambia 135 [133, 137]
Georgia 78 [76, 82]
Germany 14 [12, 18]
Ghana 109 [106, 109]
Greece 39 [37, 46]
Grenada 83 [80, 96]
Guatemala 121 [120, 125]
Guinea-Bissau 162 [160, 165]
Guyana 114 [114, 116]
Honduras 120 [119, 123]
Hong Kong, China 9 [7, 12]
Hungary 48 [46, 48]
Iceland 3 [2, 3]
India 131 [130, 135]
Indonesia 108 [108, 111]
Iran (I.R.) 91 [89, 102]
Ireland 22 [22, 22]
Israel 35 [34, 37]
Italy 38 [37, 39]
Jamaica 105 [103, 105]
Japan 11 [10, 11]
Jordan 92 [91, 98]
Kazakhstan 58 [57, 59]
Kenya 124 [120, 124]
Korea (Rep.) 1 [1, 2]
Kuwait 46 [42, 48]
Kyrgyzstan 97 [92, 99]
Countries IDI rank 90% interval
Lao P.D.R. 138 [137, 141]
Latvia 37 [34, 39]
Lebanon 56 [51, 56]
Lesotho 128 [127, 129]
Liberia 155 [154, 155]
Lithuania 40 [35, 41]
Luxembourg 6 [5, 10]
Macao, China 24 [23, 25]
Madagascar 164 [164, 164]
Malawi 163 [162, 163]
Malaysia 64 [62, 65]
Maldives 81 [78, 84]
Mali 145 [141, 149]
Malta 30 [27, 32]
Mauritania 150 [140, 153]
Mauritius 73 [72, 76]
Mexico 95 [88, 95]
Moldova 66 [66, 67]
Monaco 18 [16, 19]
Mongolia 84 [82, 87]
Montenegro 65 [63, 66]
Morocco 99 [95, 99]
Mozambique 158 [156, 160]
Myanmar 142 [140, 149]
Namibia 118 [114, 118]
Nepal 136 [131, 136]
Netherlands 8 [6, 9]
New Zealand 16 [15, 19]
Nicaragua 123 [122, 133]
Nigeria 134 [126, 136]
Norway 10 [6, 11]
Oman 54 [52, 56]
Pakistan 143 [141, 146]
Panama 89 [87, 90]
Paraguay 112 [110, 113]
Peru 104 [101, 107]
Philippines 98 [91, 99]
Poland 44 [43, 45]
Portugal 43 [43, 47]
Qatar 31 [30, 31]
Romania 59 [59, 61]
Russian Federation 45 [44, 46]
Rwanda 154 [144, 154]
Samoa 122 [122, 127]
Saudi Arabia 41 [37, 41]
Senegal 132 [128, 133]
Serbia 51 [51, 54]
Seychelles 87 [83, 89]
Singapore 19 [16, 20]
Slovakia 47 [44, 48]
Slovenia 33 [32, 39]
Solomon Islands 139 [138, 140]
South Africa 88 [84, 89]
South Sudan 161 [155, 163]
Spain 26 [25, 27]
Sri Lanka 115 [114, 118]
St. Kitts and Nevis 63 [61, 67]
St. Lucia 86 [81, 86]
St. Vincent and the Grenadines 68 [68, 68]
Sudan 126 [121, 127]
Suriname 85 [75, 87]
Sweden 5 [5, 6]
Switzerland 7 [6, 8]
Syria 117 [116, 122]
Tanzania 157 [156, 162]
TFYR Macedonia 60 [59, 61]
Thailand 74 [71, 78]
Togo 152 [150, 156]
Tonga 110 [110, 111]
Trinidad Tobago 70 [69, 71]
Tunisia 93 [86, 94]
Turkey 69 [69, 71]
Uganda 149 [138, 150]
Ukraine 79 [74, 95]
United Arab Emirates 32 [31, 35]
United Kingdom 4 [4, 4]
United States 15 [14, 17]
Uruguay 49 [49, 49]
Vanuatu 125 [124, 126]
Venezuela 72 [70, 73]
Viet Nam 102 [99, 104]
Zambia 153 [149, 153]
Zimbabwe 127 [119, 128]
Note: Countries are presented in alphabetical order. 90 per cent intervals are calculated over 2 000 simulated scenarios combining random weights for
the three ICT dimensions (25 per cent above/below the reference value), and geometric versus arithmetic average at the dimension level.
Source: Saisana and Domínguez-Torreiro, European Commission, Joint Research Centre; IDI 2015.](https://image.slidesharecdn.com/ituidireport-151130151434-lva1-app6892/75/Itu-idi-report-218-2048.jpg)


This report from the International Telecommunication Union provides a global overview of information and communication technology developments and monitors progress towards connectivity goals. Some key findings include: - The least developed countries are making progress in connectivity but Internet access in households remains low at 6.7% compared to over 80% in developed nations. - All 167 economies assessed improved their ICT Development Index values between 2010-2015, reflecting continued global progress in the information society. - The gap is widening between middle-ranked countries and those towards the bottom, and least developed countries are falling behind in the ability to use ICTs for development gains. - Mobile broadband prices fell significantly worldwide over the past year, making the service more affordable and


![Coded Agents – with UiPath SDK + LangGraph [Virtual Hands-on Workshop]](https://cdn.slidesharecdn.com/ss_thumbnails/codedagentsdeck-251215155422-5497c599-thumbnail.jpg?width=640&height=640&fit=bounds)


![Vibe Coding vs. Spec-Driven Development [Free Meetup]](https://cdn.slidesharecdn.com/ss_thumbnails/vibecodingvsspecdrivendevelopment-251209105622-43f455e7-thumbnail.jpg?width=640&height=640&fit=bounds)


