The document is the World Telecommunication/ICT Development Report 2010, which focuses on monitoring progress towards the 10 targets set at the World Summit on the Information Society in 2005. The report assesses achievements to date and what remains to be done to achieve the targets by 2015. It highlights major progress in connecting people through mobile technologies, with near global cellular coverage and over 5 billion subscriptions by 2010. However, it notes that substantial efforts are still needed, as only around 25% of the world's population uses the internet, and broadband penetration outside developed nations remains low at around 3.5%. The report provides a comprehensive, data-driven review of progress towards achieving the WSIS targets and proposes quantitative indicators to measure them.


![Introduction
Introduction
The World Summit on the Information Society (WSIS), held in Geneva (2003) and Tunis (2005), brought together gov-
ernments, civil society and the business sector to discuss a broad range of subjects related to information and com-
munication technology (ICT) for development. In the end, governments agreed on a set of commitments and actions
to foster the establishment of an inclusive information society. In particular, ten targets were identified in the Geneva
Plan of Action [ITU, 2005], along with numerous recommendations based on different action lines. The targets, to be
achieved by 2015, range from connecting villages, schools, health centres, libraries and government agencies to de-
veloping content, incorporating ICTs in school curricula and providing broadcasting services to all people in the world.
The action lines address issues related to — among others — ICT infrastructure, capacity building, cybersecurity, an
enabling policy environment and ICT applications in agriculture, education, business or the environment. The Tunis
Agenda for the Information Society [ITU, 2005] complemented the list by calling for increased financing of ICTs in the
developing world as well as continued discussion of Internet regulatory issues through the newly established Internet
Governance Forum (IGF).
In view of this broad range of topics and related programmes and policies to be implemented by national, regional
and international stakeholders, assessing progress made since WSIS is a challenging task. There are several mecha-
nisms and processes that endeavour to review implementation of the WSIS outcomes and commitments, which are
discussed further below. So far, none of them has produced a systematic overview of progress made in terms of
achieving the objectives, targets and goals of the Summit.
This World Telecommunication/ICT Development Report (WTDR) looks at the ten WSIS targets identified in the Ge-
neva Plan of Action (Box 1). The year 2010 marks the midpoint between the Tunis phase of WSIS (2005) and the
deadline for achieving the WSIS targets (2015), which is also the target date for the Millennium Development Goals
(MDGs). This report thus provides a mid-term review of the progress made towards achieving the ten WSIS targets.
No formal monitoring process was put in place by the Summit, and no global assessment of the targets has been
made to date. Similarly, there are no agreed indicators for all of the targets that countries could use for monitoring
purposes. While a core list of ICT indicators has been identified by the international community (Box 2), the WSIS
targets go far beyond these core indicators, covering subjects that are challenging to capture in quantitative terms,
let alone to compare at the international level.
This report fills this gap and sheds some light on the issue of monitoring and evaluating the WSIS outcomes. The
overall objective of this WTDR is to provide policy-makers with a comprehensive assessment of achievement of the
WSIS targets to date, identify the gaps to be filled by 2015 and, based on the findings, make suggestions on the type
of measures that could be taken in order to meet the targets within the time-frame.
Another goal of the report is to make policy-makers aware of the need to monitor information society targets, high-
lighting best international practices. The report also identifies specific quantitative indicators for tracking the targets,
along the lines of the internationally agreed indicators used for tracking the MDGs.
1](https://image.slidesharecdn.com/ictdevolpmentreport2010-100618112450-phpapp01/85/ICT-Devolpment-Report-2010-39-320.jpg)
![WTDR.2010:.Monitoring.the.WSIS.targets
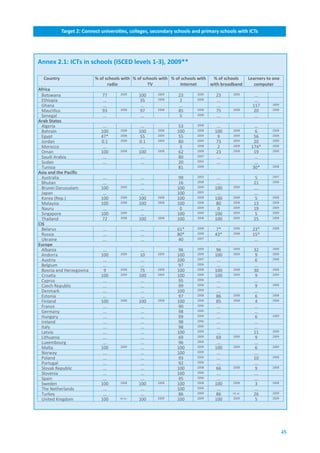
Box.2:.The.Partnership on Measuring ICT for Development.and.WSIS9.
Following the Geneva Summit in December 2003, the Partnership on Measuring ICT for Development (hereinafter the Partner-
ship) was launched at UNCTAD XI (held in Brazil) in June 2004. Its members, at that time, were the three founding members
(UNCTAD, ITU and OECD); the UNESCO Institute for Statistics (UIS); four UN Regional Commissions (UNECLAC; UNESCWA;
UNESCAP; and UNECA); the UN ICT Task Force (whose mandate expired at the end of 2005); and the World Bank. Eurostat of-
ficially joined the Partnership in February 2005 and the UN Department of Economic and Social Affairs (UNDESA) in May 2009.
During the initial phase of the Partnership, emphasis was placed on building awareness at the national and international levels
of the importance of ICT measurement for policy-making, and on developing agreed standards and methodologies to enhance
the production of internationally comparable ICT statistics. The Partnership was an active contributor to the WSIS Tunis pre-
paratory meetings and the Summit itself. This included the organization of a WSIS thematic meeting (February, 2005) resulting
in the first core list of agreed ICT indicators; a series of regional ICT measurement events; and written inputs to the discussion
and preparation of the WSIS outcome documents (Tunis Agenda). During the Tunis Summit, a parallel event was organized by
the Partnership, to present the agreed core list of indicators to policy-makers, together with an accompanying methodologi-
cal publication [Partnership, 2005a]; to debate the importance of measuring the information society for ICT policy-making
and development; and to launch a publication providing an overview of the status and availability of ICT indicators worldwide
[Partnership, 2005b].
As a result of this work, the Tunis Agenda recognized the need for ICT measurement (§§ 112-119), and made specific refer-
ence to the Partnership (§§ 114-115):
“114. The development of ICT indicators is important for measuring the digital divide. We note the launch, in June 2004, of the
Partnership on Measuring ICT for Development, and its efforts:
a) to develop a common set of core ICT indicators; to increase the availability of internationally comparable ICT statistics
as well as to establish a mutually agreed framework for their elaboration, for further consideration and decision by the
UN Statistical Commission;
b) to promote capacity building in developing countries for monitoring the information society;
c) to assess the current and potential impact of ICTs on development and poverty reduction;
d) to develop specific gender-disaggregated indicators to measure the digital divide in its various dimensions.
115. We also note the launch of the ICT Opportunity Index and the Digital Opportunity Index, which will build upon the com-
mon set of core ICT indicators as they were defined within the Partnership on Measuring ICT for Development.”
Following the Tunis Summit, the core list of ICT indicators was further refined and presented to the UN Statistical Commis-
sion (UNSC) in 2007 [Partnership, 2007], which endorsed the list and encouraged the Partnership to update it, especially with
regard to measuring the use of ICT in education and in government — two areas that figure prominently in the WSIS targets;
the contribution of ICT to economic growth and social development; and barriers to use of the technology. A revised core list
was presented by the Partnership to UNSC in 2009, and published in 2010 [Partnership, 2010].
Six years after its inception, the Partnership is recognized as a key international player in the area of ICT statistics. Members
of the Partnership regularly report on progress made at meetings of the WSIS Forum, CSTD, UNGIS and action line facilitators,
as well as at other events and conferences not directly related to WSIS.
ITU has been an active member of the Partnership from the very beginning, and is part of its Steering Committee (along
with UNCTAD and ECLAC). For more information about the Partnership and its activities, see http://www.itu.int/ict and
http://measuring-ict.unctad.org.
Important ICT developments have taken place in recent years (especially since the Geneva phase of the Summit)
which were not anticipated at the time of WSIS. The most striking example is the rise of mobile telephony and its
associated applications. The emergence of Web 2.0 and user-created content on the Internet are also shaping to-
day’s development of the information society. On the technology side, the launch of new standards in the mobile
sector, the convergence of technologies (such as broadcasting and telecommunication) and the steady expansion of
high-speed communication infrastructure have significantly changed the way ICTs are accessed and used, and their
economic and socio-economic impact is ever increasing. Indeed, today the Internet is largely recognized as a general-
purpose technology, and broadband is regarded as a basic infrastructure, in the same way as electricity, water or
4](https://image.slidesharecdn.com/ictdevolpmentreport2010-100618112450-phpapp01/85/ICT-Devolpment-Report-2010-42-320.jpg)

![Introduction
Notes
1
See Annex to the Tunis Agenda for the Information Society [ITU, 2005].
2
More information about the meetings of the action line facilitators is available at: http://www.itu.int/wsis/implementation/.
3
For further information, see http://www.ungis.org/Default.aspx?tabid=620.
4
For example, the ITU Council Working Group on WSIS (WG-WSIS) was created in 2002, and in November 2006 the ITU Plenipotentiary
Conference requested WG-WSIS to facilitate membership input and guidance on ITU’s implementation of relevant WSIS outcomes and to
elaborate proposals to the ITU Council that may be necessary for adapting ITU to its role in building the information society
(http://www.itu.int/council/groups/wsis/).
5
See ITU/BDT Doha Action Plan 2006 [ITU, 2006], § 3.2 (IV) on inclusion of the WSIS outcomes in the ITU-D activities (p. 5 and Annex 1), at:
http://www.itu.int/ITU-D/conferences/wtdc/2006/pdf/dohaactionplan.pdf.
6
http://www.itu.int/wsis/stocktaking/index.html.
7
See ECOSOC Resolution 2006/46, available at: http://www.un.org/docs/ecosoc/documents/2006/resolutions/Resolution%202006-46.pdf.
8
See http://www.unctad.org/Templates/Page.asp?intItemID=4239&lang=1 for further information on CSTD.
9
For further information, see [Partnership, 2008] and http://www.itu.int/ITU-D/ict/partnership/index.html.
10
Based on a survey of 27 000 adults in 26 countries carried out by BBC in 2010, around three-quarters of interviewees considered Internet
access as a human right (see http://newsvote.bbc.co.uk/2/hi/technology/8548190.stm). Countries that have ruled that access to Internet
is a human right for their citizens include Finland, France and Estonia.
7](https://image.slidesharecdn.com/ictdevolpmentreport2010-100618112450-phpapp01/85/ICT-Devolpment-Report-2010-45-320.jpg)


![Target.1:.Connect.villages.with.ICTs.and.establish.community.access.points
and two will serve specifically to track the prevalence and use of community access. All of these indicators are being
collected by ITU, directly from countries, under the Partnership on Measuring ICT for Development.8 They include
mobile cellular and Internet technologies, and cover both access to and use of these ICTs.
Measuring.rural.connectivity
As mentioned, “Connect villages with ICTs” is essentially aimed at rural areas. However, the use of the word villages
poses statistical challenges, since the term “village” is rarely used as a unit of measurement in national statistical
systems. When data are presented by administrative division, it is usually at the second administrative level (e.g.
region, province or state).
In order to measure this target based on villages, the number of villages would have to be determined. There is no
international standard defining what constitutes a village. Some countries report the number of localities broken
down by population size. However, such information is not widely available, and even if it were it does not solve the
problem of what size of locality should constitute a village. It would be logical to associate a village with a certain
population size considered as rural, but definitions vary widely. In many instances, other factors besides population
size are used to define “urban” and “rural,” such as administrative divisions or employment outside agriculture.9 In
the European Union, “rural” is not defined by the size of localities but by the population density (number of inhabit-
ants per km2).10
Apart from the methodological issue of what constitutes a village, not all countries publish the number of localities
they contain. In addition, factors such as migration, nomadic populations, civil war and resettlement also have an
impact on the ability to determine precisely where people live and how many localities there are in a country.11 Al-
though, in 2008, ITU did estimate the number of localities based on several proxy indicators (for example the number
of enumeration areas used by statistical offices for census and surveys), in order to track the availability of ICTs in
villages [ITU, 2008], it seems very difficult to track this information on a regular basis. Even for countries that publish
some information on the number of villages, there are large gaps in continuity and data are often only updated every
ten years, at the time of a census.
Another methodological challenge with Target 1 is that it refers to connectivity, which is a broad term. The target
does not specify which technology should be available in villages. Fixed-line telephony is the service for which data,
when available, have historically been gathered, and most universal service plans remain geared to the provision of
fixed telephone lines. Yet many countries do not produce data on the availability of fixed-line telephone service ac-
cording to size of community (of any magnitude, including cities) or population covered. Also, globally, the number
of fixed lines is stagnating and even decreasing in many countries, as fixed lines are increasingly replaced by mobile
telephony. It therefore does not seem appropriate to include an indicator for fixed lines to track Target 1.12
It would, however, be very useful to track Internet — and, specifically, broadband — access in villages, since these
are critical ICTs for full participation in the information society. Therefore the number of villages with Internet access
(broken down by urban/rural locality and narrowband/broadband access) is an important indicator. This is largely
covered by a very similar indicator, on public Internet access centres (PIACs), which will be discussed later in this
chapter, in the section on Measuring community connectivity.
If Target 1 cannot be tracked with “villages” as a denominator, it is analytically useful to present other indicators based
more broadly on rural areas, measuring for example rural access, coverage and use. Although these indicators may not
conform strictly to the letter of the target in terms of the exact wording (“villages”), they certainly convey information
that reflect its intent, which is to monitor ICT connectivity in rural areas. Furthermore, they are arguably more relevant,
since they cover popular technologies such as mobile cellular, and units of measurement directly related to universal
service (which refers to ICTs in households). Another major advantage is that indicators of rural access and coverage are
widely available, may be more comparable and feature historical data upon which to gauge trends. Finally, indicators
based on population coverage and households provide greater statistical reliability and are usually more up-to-date.
Today, mobile communications has become the most prevalent form of communications in almost every country in
the world. Mobile networks support voice communications as well as text messaging and Internet access (at increas-
ingly higher speeds, including broadband). Therefore, it is indispensable to factor in mobile networks in any analysis
of rural access to ICTs. Considering that a single mobile antenna may serve numerous localities depending on how
far they are apart, more localities enjoy mobile service than fixed telephone access. Although the availability of mo-
11](https://image.slidesharecdn.com/ictdevolpmentreport2010-100618112450-phpapp01/85/ICT-Devolpment-Report-2010-49-320.jpg)

![Target.1:.Connect.villages.with.ICTs.and.establish.community.access.points
the country, and then multiplying by 100. The indicator should be broken down by size of locality, or by urban/rural
localities. It reflects how many (urban/rural) localities in a country have a PIAC.
A related indicator would be the Partnership indicator HH8: Location of individual use of the Internet in the last
12 months, since two of the proposed range of locations are a “Community Internet access facility” or a “Commercial
Internet access facility.” This indicator is useful for measuring the demand side of public Internet facilities.
The community access target is also related to Target 4, particularly in regard to connectivity in public locations such
as libraries and post offices, which can serve as public access locations. The establishment of community access
points can also help to achieve Target 10, namely ensuring that half of the world’s inhabitants have access to ICTs
within their reach.
Status.of.Target.1
Given the problems with defining the term “village” and the lack of data on village connectivity, it is very difficult to
track the target in terms of the proportion of villages with ICTs. In 2008, ITU published some data on the percentage
of localities with different ICTs, by region. It found that in sub-Saharan Africa, for example, only 12 per cent of locali-
ties had telephone access and 1.4 per cent had access to the Internet [ITU, 2008].
One of the problems is that the data on which these estimates are established date back to between 2000 and 2006,
and only very few countries in the world collect data by locality. Two exceptions are China and India. China recently
announced that by the end of 2009, “voice telephony services were available to 99.86% of the country’s adminis-
trative villages (up from 98% a year earlier), while internet access covered 91.5% (up from 89%), according to data
from the regulator MIIT.”18 India has pursued a longstanding goal of providing its reported 593 485 villages with a
telephone. By December 2008, no fewer than 539 448 villages (91 per cent) had a telephone [TRAI, 2008]. While this
means that the world’s two largest developing nations — China and India — have largely attained Target 1 when
measured by telephone access in villages, most other countries do not track village connectivity, even though many
have initiated projects to connect rural areas. 19
Nor is the success of fixed lines likely to be replicated in many of the world’s least developed countries. Fixed tel-
ephone line growth has stagnated in most countries, overtaken by wireless communications. The cost of installing
wireless systems in rural areas is far less than that of fixed telephony, so it does not make economic sense to equip
villages with fixed telephone lines.
Given the rapid growth of wireless communications, a more appropriate indicator for measuring progress towards Tar-
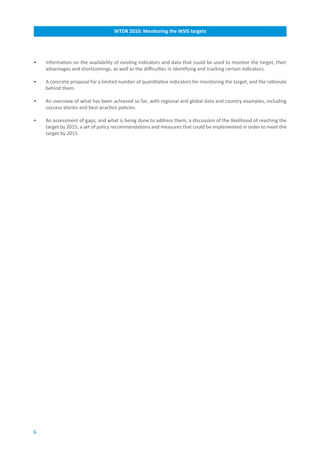
get 1 is the percentage of rural population within reach of a mobile cellular signal. Existing data on the percentage of the
rural population covered by a mobile cellular telephone network suggests that almost three quarters of the world’s rural
inhabitants were covered by a mobile cellular signal by the end of 2008 (Table 1.2). The highest coverage is in Europe,
where practically all inhabitants of rural areas enjoy a mobile signal. Although the lowest rural coverage is in Africa,
2008 was a watershed year, with over half of the continent’s rural citizens now covered by mobile telephony. Africa also
recorded the biggest increase in rural mobile population coverage between 2000 and 2008 (Chart 1.1).
Based on recent trends, it seems possible that almost all regions will achieve full mobile coverage of rural populations
before 2015. The one exception is Africa, but even there rural coverage could exceed 90 per cent by 2015. Complete
mobile coverage of all rural areas around the world by 2015, or even earlier, would appear achievable with the right
policy emphasis.
Given the increase in the number of wireless broadband networks and subscriptions, the indicator should be broken
down by technology (2G, 3G, and eventually 4G). Many operators and an increasing number of regulators, including
France’s ARCEP and the United Kingdom’s Ofcom (Table 1.3), are tracking 3G population coverage, particularly in order
to track network coverage commitments.20 ITU is planning to add a new indicator to track 3G/4G mobile population
coverage to its list of indicators.
While an increasing number of developing countries are starting to collect data on the proportion of households with
a fixed and/or mobile telephone through official household surveys, some developed countries do not (or no longer)
13](https://image.slidesharecdn.com/ictdevolpmentreport2010-100618112450-phpapp01/85/ICT-Devolpment-Report-2010-51-320.jpg)


![Target.1:.Connect.villages.with.ICTs.and.establish.community.access.points
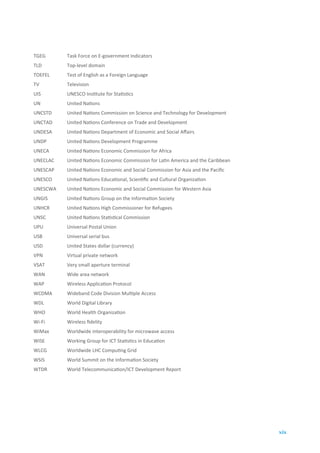
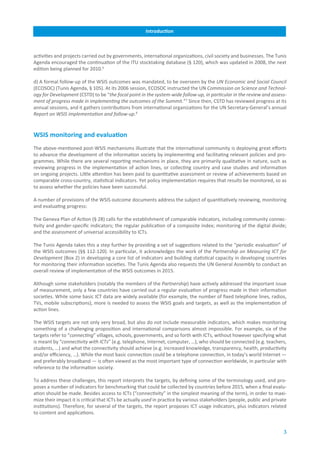
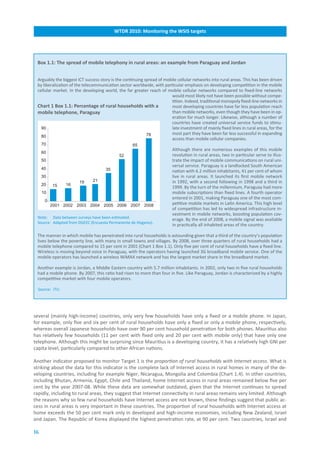
Chart.1.5:.Proportion.of.rural.and.urban.households.with.broadband**.Internet.access,.2007-08
Korea (Rep.) 82
71
Canada* 68
36
Japan 64
55
New Zealand 35
22
Turkey 27
10
Chile* 17
2
Egypt 12
2
Thailand* 9
1
Costa Rica 6
1
Ecuador 5
0
5 Urban
Mauritius
10
1 Rural
Azerbaijan
0
0 20 40 60 80 100
%
Note: * Data refer to 2006. ** Broadband refers to both wireless and fixed (wired) broadband access.
Source: ITU World Telecommunication/ICT Indicators database.
every part of the United States” [FCC, 2010]. Similar proposals exist in Europe, and the European Commission recently
announced plans to update the current telecom universal services law from 2002, which ensures access to fixed tel-
ephone and Internet services for all European Union citizens, regardless of their location. A revised law would expand
these services to include broadband access.24
The relatively low proportion of rural households in developing countries that have Internet access and the even
lower broadband penetration rates highlight, first, the importance of connecting more homes and, second, the need
to provide public Internet access — preferably high-speed — in rural areas. While the main reasons why people do
not have Internet access at home are not clearly known, it is likely that people cannot afford the home Internet con-
nection, or the computer, which continues to be the most popular access device. Since people in rural areas tend
to live on relatively lower incomes, the high price of Internet services, and particularly broadband, is obviously a
barrier to higher penetration levels.27 Depending on national circumstances, including geographic and demographic
conditions, many rural areas also lack the basic infrastructure. The recent growth of mobile broadband is expected
to have a major impact on broadband connectivity, particularly in rural and previously underserved areas. To track
the uptake of mobile broadband it is therefore suggested that countries collect data on households with broadband
access, both mobile and fixed.
There are insufficient data to provide a comprehensive picture of the current spread of community access centres
in localities or villages. According to data received by ITU from 60 respondents to a questionnaire in 2004, some 37
per cent of localities had a community access point. In rural localities, however, where public access is arguably most
needed, the figure dropped to under five per cent. ITU also carried out research on the number of localities with In-
ternet. The data were compiled in 2008 from a number of sources, such as government records, projects for installing
community Internet access and the number of points-of-presence of large ISPs, using data from between 2000 and
19](https://image.slidesharecdn.com/ictdevolpmentreport2010-100618112450-phpapp01/85/ICT-Devolpment-Report-2010-57-320.jpg)


![WTDR.2010:.Monitoring.the.WSIS.targets
Notes
1
Substantial inputs to this chapter have been provided by Michael Minges.
2
Villages have been defined as “a group of houses and other buildings, such as a church, a school and some shops, which is smaller than a
town, usually in the countryside.” See Cambridge Advanced Learner’s Dictionary at http://dictionary.cambridge.org/.
3
See WSIS Geneva Plan of Action, 2003, at: http://www.itu.int/wsis/docs/geneva/official/poa.html#c2.
4
See WSIS Geneva Plan of Action, 2003, at: http://www.itu.int/wsis/docs/geneva/official/poa.html#c3.
5
See WSIS Geneva Plan of Action, 2003, at: http://www.itu.int/wsis/docs/geneva/official/poa.html#c4.
6
See WSIS Geneva Plan of Action, 2003, at: http://www.itu.int/wsis/docs/geneva/official/poa.html#c9.
7
This section draws substantially on [ITU, 2009].
8
The Partnership on Measuring ICT for Development is a multistakeholder partnership launched in 2004. To achieve its main objective —
namely, to increase the availability and quality of internationally comparable ICT data — it has developed a core list of ICT indicators. For
more information on the Partnership and its core list of indicators, see: http://www.itu.int/ITU-D/ict/partnership/index.html.
9
Markandey Rai. “Operational Definitions of Urban, Rural and Urban Agglomeration for Monitoring Human Settlements.”
http://www.scorus2006.ue.wroc.pl/modules/Downloads/presentations/Markandey_Rai.pdf.
10
The European Union follows the OECD definition, while noting that: “The OECD definition is based on the share of population living in
rural communes (i.e. with less than 150 inhabitants per km2). This is the only internationally recognised definition of rural areas. However,
in some cases, it does not fully take into account the population living in more densely populated rural areas, particularly in peri-urban
zones...” See: 2006/144/EC: Council Decision of 20 February 2006 on Community strategic guidelines for rural development (program-
ming period 2007 to 2013) available at:
http://eur-lex.europa.eu/LexUriServ/LexUriServ.do?uri=CELEX:32006D0144:EN:NOT.
11
Villages can also be uninhabited or “non-revenue generating.” This is the case in India, where there are ongoing revisions to the figure
reported in the 2001 census. See: [TRAI, 2008].
12
In 2008, ITU published a report on the availability of ICTs in villages and rural areas [ITU, 2008). This report included estimates on the
number and proportion of villages with a fixed telephone line. In view of the data constraints for this indicator, various proxies were used
to make estimates about the number of localities with a fixed telephone line, such as the number of post offices (on the assumption that
they would have telephone service) or the number of telephone exchanges (on the assumption there is one per locality).
13
Partnership on Measuring ICT for Development, 2010.
14
There are several Global Mobile Personal Communications by Satellite (GMPCS) service operators providing worldwide coverage. One
application they are used for is providing service in rural and remote areas, often where there is no terrestrial mobile cellular signal. In
Mauritania, GMPCS licences were awarded at no cost but the service providers are obligated to provide payphone service in all localities
with more than 1 000 inhabitants. See: M. Mohamed Salem OULD LEKHAL. “Comment favoriser l’accès aux services de communications
électroniques pour le plus grand nombre?,” 5th annual meeting of FRATEL, Montreux, Switzerland,
7 - 9 November, 2007. http://www.fratel.org/espace_public/IMG/presentation_ARM_.pdf.
15
Many regulators or operators provide national mobile population coverage. Assuming that urban areas are covered first, rural coverage
can be estimated by subtracting the urban population from the total population covered by a mobile signal. The formula is:
Proportion of rural population covered by a mobile cellular signal =
(Proportion of total population covered by a mobile cellular signal x Total population) - Urban population
Rural population
16
The Partnership encourages countries to include “...geographic ... classificatory variables if they are able to, as the output can provide
very useful policy information.” See: ITU, Manual for measuring ICT access and use by households and individuals. [Geneva: ITU, 2009] at
http://www.itu.int/ITU-D/ict/publications/hhmanual/2009/index.html.
17
Partnership on Measuring ICT for Development, 2010.
18
Telegeography, China improves rural coverage, January 2010, see:
http://www.telegeography.com/cu/article.php?article_id=31529&email=html.
19
The e-Cambodia Development Plan foresees connecting all districts, communes and eventually villages with ICTs, including telephony,
Internet, videoconferencing, radio and video. See, for example, slide 4 of the presentation Regional Workshop on Community e-Centre for
Rural development by Mr Noy Shoung, Deputy Secretary General, National ICT Development Authority , Cambodia, at the the UN ESCAP
Regional Workshop on Community e-Centres for Rural Development , 29-30 October 2009, New Delhi , India, at:
http://www.unescap.org/idd/events/2009_Delhi_WS/index.asp, as well as:
http://ifap-is-observatory.ittk.hu/node/7.
20
See, for example Telecompaper: Orange France, SFR warned over 3G network coverage, December 2009, at:
http://www.telecompaper.com/news/article.aspx?cid=710603 and also the Austrian operator Optus’ online information on its 3G popu-
lation coverage, including a coverage map, at: http://www.optus.com.au/portal/site/aboutoptus/menuitem.26a56e3a0149a03327b8681
08c8ac7a0/?vgnextoid=0aa730ece1197010VgnVCM10000029867c0aRCRD.
21
For a definition of ‘rural areas’ in Mauritius, see the Mauritius Central Statistical Office, at: http://www.gov.mu/portal/site/cso.
22
See: http://www.oecdobserver.org/news/fullstory.php/aid/2663/Widening_broadband_s_reach.html.
26](https://image.slidesharecdn.com/ictdevolpmentreport2010-100618112450-phpapp01/85/ICT-Devolpment-Report-2010-64-320.jpg)
![Target.1:.Connect.villages.with.ICTs.and.establish.community.access.points
23
See: http://wireless.fcc.gov/outreach/index.htm?job=recovery.
24
Total Telecom, EU to revise broadband law to guarantee access to all, 02 March, 2010, at:
http://www.totaltele.com/view.aspx?C=0&ID=453595.
25
See: http://www.skmm.gov.my/link_file/what_we_do/usp/USP%20Notification2003.pdf.
26
See: http://www.skmm.gov.my/link_file/what_we_do/usp/pdf/keynote2.pdf.
27
The ITU’s Measuring the Information Society Report 2010 highlighted the relatively high price for basic broadband access in many devel-
oping countries [ITU, 2010].
28
See: [ITU, 2008], and
http://www.itu.int/ITU-D/ict/newslog/Report+Measuring+ICT+Availability+In+Villages+And+Rural+Areas+Available+Now.aspx.
29
See: http://www.compartel.gov.co/.
30
Colombia, Ministry for Information and Communications Technologies, “The Colombian ICT sector and its perspectives: Bridging the
digital divide while fostering private investment.” Presented on 5 October, 2009. Geneva, Switzerland.
31
Colombia, Ministry of Communications: “Programa Compartel,” July 2008.
32
Respondents had the possibility to choose several access points. See page 28 of [Gillwald, Alison and Stork, Christoph, 2008].
33
Elkin, Noah, “eMarketer: RCP bridges the digital divide in Latin America.” EIU ebusiness forum, 8 March, 2001.
http://globaltechforum.eiu.com/index.asp?layout=rich_story&doc_id=2669&categoryid=&channelid=&search=bridges.
34
[Curioso, et al., 2007].
35
See: http://www.inei.gob.pe/web/BoletinFlotante.asp?file=8175.pdf.
36
The World Bank is supporting a number of these initiatives through the Africa Regional Communications Infrastructure Programme, see:
http://go.worldbank.org/1UNCU3TTM0.
37
See: https://communicationsdirectnews.com/do.php/120/37175.
38
See: http://www.gsmworld.com/newsroom/press-releases/2010/4641.htm.
39
See: http://newsroom.cisco.com/dlls/2009/prod_080409.html.
40
See: http://www.itu.int/ITU-D/ict/material/Telecom09_flyer.pdf.
41
See: http://www.telenor.com/en/resources/images/016-024_GrameenphoneCIC_tcm28-36855.pdf.
42
GSMA Development Association, Case study: Grameenphone community information centres, Bangladesh. (2008).
http://www.gsmworld.com/documents/GrameenPhone_bangladesh_hires.pdf.
43
Although an ITU 3G mobile standard, actual speeds with initial EDGE implementation were less than broadband (<200 kbps). Improve-
ments have seen speeds increase to around 200 kbps. A newer version of EDGE (Evolution) can achieve broadband speeds of up to 1
Mbps with average throughput of around 400 kbps.
44
Grameenphone, Grameenphone launches new vision for the Internet. Press Release, 11 February , 2009, at:
http://www.grameenphone.com/index.php?id=474.
45
For example Opera, an Internet browser for mobile phones, reported that the number of its users grew 154% between November 2008
and November 2009, with triple digit mobile Internet usage growth in Africa. See: http://www.opera.com/smw/2009/11/.
46
Nokia Siemens Networks, DTAC wins the rural market with Nokia Connect eRefill solution. (2007).
http://www.nokiasiemensnetworks.com/NR/rdonlyres/D13517E1-B3B2-4E4C-93A1-3648EBAC4A5B/0/DTAC_eRefill.pdf.
47
“If the unspent USD 4.4 billion universal service fund levies and the further USD 3.8 billion that will be collected between now and the
end of the decade were spent on extending mobile networks, mobile coverage would be near 100% within 3.5 years.” See: [GSM Associa-
tion, 2006].
48
See: http://www.itu.int/ITU-D/connect/flagship_initiatives/connecting_children/index.html.
27](https://image.slidesharecdn.com/ictdevolpmentreport2010-100618112450-phpapp01/85/ICT-Devolpment-Report-2010-65-320.jpg)


![WTDR.2010:.Monitoring.the.WSIS.targets
Box.2.1:.The.benefits.of.connecting.educational.institutions.for.learners.and.teachers
In order to prepare students for the changing needs of labour markets and knowledge-based societies, education systems must
adapt their curricula to include ICT-assisted instruction. An ICT skill that is essential for participating in knowledge-based societies
is information literacy, which can be used in conjunction with other problem-solving and communication skills.5 In using the wealth
of electronic resources available for pedagogical purposes via the latest Internet-based tools and digital technologies, learners can
quickly expand their information literacy skills set. In essence, achieving full connectivity as sought by WSIS Target 2 is a precondition
for attaining Target 7: “To adapt all primary and secondary school curricula to meet the challenges of the information society, taking
into account national circumstances” .
At the same time, ICTs can act as a catalyst for alleviating bottlenecks in education systems, particularly teacher shortages. Accord-
ing to forecasts, a global total of 10.3 million teachers have to be recruited between 2007 and 2015 to meet the goal of universal
primary education [UNESCO-UIS, 2009a], but the lack of trained teachers is a key challenge in achieving this goal. Sub-Saharan Africa
has by far the greatest need for
additional teachers, as shown by
Chart.1.Box.2.1:.Increases.in.teacher.stocks.needed.by.2015
Chart 1 Box 2.1. Three quarters of
countries (27 out of 45) in the re-
gion face a significant teacher gap,
Sub-Saharan Africa 1 159
estimated at 1.2 million teachers.
Arab States 282 Since for many countries the
conventional method of course
South and West Asia 240
delivery is not a viable option, ICT-
North America and Western 125 enabled distance-education pro-
Europe grammes can be used to reach a
East Asia and the Pacific 90 greater number of primary-school
Latin America and the 14 age pupil populations, by com-
Caribbean plementing and enhancing exist-
Central Asia 13 ing teaching practices as well as
4 providing additional content and
Central and Eastern Europe
delivery options, particularly in re-
0 200 400 600 800 1 000 1 200 1 400 mote or rural areas where teach-
ers are scarce. They may also be
Additional primary teachers needed (in thousands)
used for teacher training. Setting
up relevant curricula at a distance
Source: UIS. based on an ICT-enabled environ-
ment has the advantage of flexibil-
ity, while achieving economies of
scale in the dissemination of teacher-training content. Pedagogical content can thus be disseminated to potential populations at a
declining unit cost, while also achieving a potential multiplier effect across the target populations.
Teacher training can take place through ICT-enabled distance-education programmes, which exploit ICTs to deliver all or a sig-
nificant proportion of the teaching to learners who are removed in space and time. Distance education can take various forms,
such as Internet-based distance learning, whereby content can be transmitted either synchronously or asynchronously. National
circumstances will dictate the most effective technological solutions for the purpose of pedagogical training and course delivery.
Self-learning using CD or DVD-ROM, in which the learner interacts with content on a computer or other integrated device, is another
practical tool for delivering training. Broadcast-based education, in which content is delivered via radio or television, is very effective
in delivering content to a mass of potential teachers.
To reap the full benefits and potential that Internet-based distance-education programmes have to offer, greater investment is
required in infrastructure that can support broadband Internet services. As more web-based curriculum materials are developed
using high-bandwidth applications, consumers of distance-education programmes in these new formats require access to the sup-
porting infrastructure. Since many of the web-based applications make use of interactive media and streaming content in the de-
livery of distance-education programmes, users with broadband Internet access can take full advantage of these applications. One
of the dilemmas that persist is that investment in such technologies can only occur when there is a minimum customer base that
will consume the broadband Internet services. Given the high fixed costs associated with supporting such services, a sustainable
customer base is essential for guaranteeing the viability of a market in the long run. The systematic deployment of any web-based
distance education programmes or government policy to support such initiatives must therefore take this into consideration in
delivering the curriculum.
Source: UIS.
30](https://image.slidesharecdn.com/ictdevolpmentreport2010-100618112450-phpapp01/85/ICT-Devolpment-Report-2010-68-320.jpg)
![Target.2:.Connect.universities,.colleges,.secondary.schools.and.primary.schools.with.ICTs
“Everyone should have the necessary skills to benefit fully from the information society. Therefore capacity building
and ICT literacy are essential. ICTs can contribute to achieving universal education worldwide, through delivery of
education and training of teachers, and offering improved conditions for lifelong learning, encompassing people that
are outside the formal education process, and improving professional skills.”4
Measuring.Target.2.—.Proposed.indicators
In order to monitor ICT in education from an international perspective, it is necessary to establish a consensus on
the conceptual framework. Moreover, the approach must emphasize that educational institutions (or schools) are
the main units of data collection, with aggregation at the country level. This method of data collection guarantees
international comparability for the effective monitoring of ICT infrastructure in education systems.
The UNESCO Institute for Statistics (UIS) is leading a process for the development and pilot testing of cross-nationally
comparable core indicators of ICT for education (ICT4E), under the auspices of the Partnership on Measuring ICT for
Development. The Partnership is mandated to establish international standards, indicators and benchmarks for sta-
tistical monitoring of the WSIS global policy goals.
A set of core ICT in education indicators that measure aspects of e-readiness and access to ICT in education systems
were submitted by the Partnership to the United Nations Statistical Commission (UNSC) at its 40th session in Febru-
ary 2009 [Partnership, 2010]. As a response to the need to expand the initial core list, UIS has established the inter-
national Working Group for ICT Statistics in Education (WISE). The purpose of the working group is to bring together
statisticians (national focal points) from ministries of education (or national statistical offices) from 25 countries
around the world to pilot the international Questionnaire on Statistics of ICT in Education. The four indicators sug-
gested to monitor Target 2 in the following sections are the result of this initiative [UNESCO-UIS, 2009b].
Apart from the efforts of UIS and the Partnership to monitor ICT in education at an international level, there have been
no other global initiatives to identify indicators or to provide data on school connectivity.6 Periodic surveys on school con-
nectivity have been carried out in Europe, usually under a project of the European Commission,7 and a number of studies
exist for other regions, including Latin America and the Caribbean. Mostly, however, data on ICT in education are not com-
parable across countries and are based on different sets of indicators and definitions. Some countries have collected ICT
in education data through statistical reports or one-time studies, especially to address policy needs. Often these data are
available only for one country, for one year, and/or are limited to a specific school level. While the results of the UIS survey
presented in this chapter provide important insights into the status of school connectivity, the survey is limited to 25 coun-
tries, including several developed countries. Not all data sets are available for all 25 countries. The UIS survey results were
complemented through data received from ITU’s Survey on the WSIS Targets, as well as some official data from regional or
national sources. Despite the fact that a number of countries and regions, including Africa, have set specific targets on ICT
in education (Box 2.2), relatively few countries seem to be actually able to track them.
Although Target 2 does not specifically say how many educational institutions should be connected, it could be inter-
preted as meaning “all” universities, colleges, secondary schools and primary schools. Nor does it specifically state
precisely which ICTs it refers to. Clearly, however, ICT-assisted instruction must encompass technologies that are
consistent with national circumstances and realities. In this sense, technologies and supporting infrastructure may
include older or more conventional ICT tools such as radio and television broadcasts (live and off-air) as well as the
latest digital technologies such as broadband Internet and computer software.
The type of indicators selected to measure Target 2 will depend to some extent on a country’s development status
and ICT-readiness. Countries that are in the early stages of introducing ICTs have different information needs from
countries that have longer experience with the technology. For instance, when introducing computers or Internet-
assisted instruction in education, it is important that teachers and learners have access to hardware and software to
acquire basic computer skills. Countries whose education systems have reached this level of ICT integration can be
characterized as being at the e-readiness stage (see Figure 2.1). As Target 2 aims to measure the overall presence of
ICT infrastructure and connectivity, key e-readiness indicators must be identified for this purpose.
Countries in the more advanced stages of ICT use in education have other priorities — such as the management of
pedagogical innovation, adaptive and inclusive curricula, organizational change, sustainable technical support, and
31](https://image.slidesharecdn.com/ictdevolpmentreport2010-100618112450-phpapp01/85/ICT-Devolpment-Report-2010-69-320.jpg)
![WTDR.2010:.Monitoring.the.WSIS.targets
Box.2.2:.Setting.targets:.Examples.from.the.Americas,.Africa.and.Australia
While Target 2 does not specify the percentage of schools that should be connected to ICTs, some regions and countries have
set their own targets, usually in terms of Internet connectivity:
• In Latin America and the Caribbean, eLAC 2010 established a target to connect 70 per cent of public educational insti-
tutions by 2010, preferably via broadband, otherwise tripling the current number of public schools connected to the
Internet.8
• The New Partnership for Africa’s Development (NEPAD) e-Schools Initiative was announced in 2003 at the Africa Sum-
mit of the World Economic Forum, for implementation until 2013. One of its goals was to equip “all African primary and
secondary schools with ICT apparatus such as computers, radios and television sets, phones and fax machines, commu-
nication equipment, scanners, digital cameras, copiers, etc., and to connect them to the Internet.”9
• In 2009, Australia committed funding to provide 90 per cent of all schools with optical fibre progressively over the next
eight years and to achieve a 1:1 learner-to-computer ratio for secondary schools by 2011.10 Schools connected will
have access to broadband speeds of up to 100 Mbit/s. These initiatives are among the many that recognize the positive
impact that ICTs have on education.
Source: ECLAC; E-Africa Commission; Australian DBCDE.
Figure.2.1:.Information.needs.at.different.levels.of.ICT.penetration.in.educational.systems
ICT4E and economic productivity
Tracer studies on ICT-skilled students in labour market
Information requirements for policy-making
ICT and student achievements
e-impact
ICT for lifelong learning
Webcasting, podcasting,
Expansion of ICT-related fields of study Video/visio-Conferencing, etc.
New ICT vocational skills development Internet-enabled learning
ICT-enhanced content development and e-intensity
innovative pedagogy management
Distance education, virtual/open universities, virtual
high schools, virtual laboratories and online
simulations, digital libraries, etc.
Access to and use of basic ICT
infrastructure
ICT trained teachers and ICT support staff
e-readiness
Radio and TV instruction, educational software, e -mail, etc.
Time - Level of ICT integration in the education system
Source: UIS, adapted from [UNCTAD, 2007].
32](https://image.slidesharecdn.com/ictdevolpmentreport2010-100618112450-phpapp01/85/ICT-Devolpment-Report-2010-70-320.jpg)

![WTDR.2010:.Monitoring.the.WSIS.targets
essarily qualified in the subject matter, can use the radio programme as a primary instructional source. Broadcast
programmes follow the traditional model of education and can cover every subject in many different languages,
depending on the target audience.
Interactive radio instruction turns a typically one-way technology into a tool for active learning inside and outside the
classroom. It requires that learners react to questions and exercises through verbal responses to radio-programme
contributors, group work and physical and intellectual activities while the programme is on air. For both teacher and
learner, the lesson becomes an immediate hands-on practical guide [UNESCO, 2009c].
For the purpose of measuring television-assisted instruction, a television is defined as a stand-alone device (in work-
ing condition) capable of receiving broadcast television signals using popular access means (such as over-the-air,
cable and satellite).
Television-assisted instruction is similar to radio broadcast education, with the additional benefit of video. It helps
to bring abstract concepts to life through clips, animations, simulations, visual effects and dramatization. It can also
connect a classroom to the world, but shares the same rigid scheduling and lack of interactivity as radio broadcast
education.
Chart 2.1 shows that, in many countries (including Bahrain, Finland, Malaysia, Republic of Korea, Sweden and Oman),
television- and radio-assisted instruction is present throughout the entire education system, with 100 per cent of
primary and secondary schools having this type of instruction. In other countries, such as Jordan, there has been a
deliberate policy shift away from radio- and television-assisted instruction to focus on other types of ICT-assisted
Chart.2.1:.Proportion.of.schools.with.a.television.or.radio.used.for.educational.purposes.(for.ISCED.levels.1-3),.
2008-09**
%
100
80
60
40
20
0
Jordan
Dominican Rep.
Costa Rica
Guatemala
Andorra
Brazil
Mexico
Ethiopia
Egypt*
St. Lucia
Bosnia and Herz.
Palestine
Mauritius
Botswana
Bahrain
Finland
Malaysia
Korea (Rep.)
Sweden
Oman
Croatia
United Kingdom
Brunei
Singapore
Malta
Proportion of total schools with a television Proportion of total schools with a radio
Note: * Refers to public schools only. **Or latest available year.
Source: UIS Pilot Questionnaire on Statistics of ICT in Education; ITU Survey on the WSIS Targets; national sources.
34](https://image.slidesharecdn.com/ictdevolpmentreport2010-100618112450-phpapp01/85/ICT-Devolpment-Report-2010-72-320.jpg)
![Target.2:.Connect.universities,.colleges,.secondary.schools.and.primary.schools.with.ICTs
instruction [UNESCO, 2009b]. This suggests that in some countries connecting schools to older ICTs is an alternative
when newer ICTs are not available.
Computers
Depending on the measurement objective, indicator (3) — the learners-to-computer ratio — may be calculated in
several ways. The most basic method involves the ratio of total learners to total available computers in particular
schools, irrespective of the intended use of the computers. A high value for this ratio depicts a situation where, on
average, there are many learners for each available computer in the schools. In a country which, in theory, enjoys
full-scale deployment of computer-assisted instruction (CAI), this may signal either a low overall level of computer
availability in the schools in question, or the existence of digital gaps, which can be identified when calculating and
analysing this indicator by geographical region and individual school. Alternatively, the learner-to-computer ratio can
be calculated for schools where CAI is deployed. A high value in this case signals that a greater number of learners
must share a fixed number of computers. Pedagogically speaking, this may imply that the available computers are
inadequate to serve the learning and practice needs of the learners.
In both circumstances a computer refers to a programmable electronic device that can store, retrieve and process
data, as well as share information in a highly structured manner. It performs high-speed mathematical or logical op-
erations according to a set of instructions. In collecting international data on the number of computers, a computer
will include personal computers (PCs), laptops, notebooks, terminals connected to mainframes and minicomputers
that are intended for shared use and are in working condition. Other additional criteria may be applied, such as the
age of the computer, its configuration and capacity, the kinds of software available, etc. From a statistical perspec-
tive, the criteria for “working condition” of computers are left to the countries’ discretion, taking into considera-
tion their own pedagogical requirements for schools, their technological environment and their financial capacities
[UNESCO, 2009c].
In the absence of national norms defined by pedagogues, a ratio of one learner to one computer suggests a perfect
adequacy in the provision of a computer to all learners officially entitled to benefit from a computer in schools that
offer CAI. However, except in cases where everyone has a privately owned computer, a perfect 1:1 match does not
necessarily constitute an ideal target, since sharing a school-owned computer might equally reflect cost-efficient
management of the resource. Not all subjects in curricula require the support of computers during the totality of
class time scheduled in a week, a month or a year. This indicator also needs to be analysed in the context of parallel
use of other, non-computer ICTs in schools.
Where national standards exist, a learner-to-computer ratio higher than the official norms implies that more efforts
are required from policy-makers to equip schools with computers in order to ensure equitable opportunity for all en-
titled learners across the country. By frequently updating this indicator, one can monitor and ensure that all schools
meet the required standard. Further methodological work will be required to test more robust measures than simple
averages (e.g. median, percentiles) in order to improve cross-country comparisons. The ratios are a measure neither
of actual use of computers in schools nor of the time learners actually spend using computers [UNESCO, 2009c].
The basic learner-to-computer ratio is an aggregate measure of the digital divide, irrespective of the type of school
or intended use of computers. Chart 2.2 shows that the variation in the learner-to-computer ratio is very high across
countries. Countries such as Sweden have a computer for every three learners in public primary and secondary
schools, while some developing countries have very high ratios, namely Morocco (174:1), Dominican Republic (179:1)
and Ghana (586:1). Belarus is an example of a developing country which has decreased its learner-to-computer ratio
from 41:1 in 2000 to 24:1 in 2008 (Box 2.3). Based on the available data for 20 countries, the median leaner-to-
computer ratio for public schools is 27:1.
Whereas Chart 2.2 shows aggregate access to computers, there is a caveat in the sense that not all learners and
teachers may have access to all of the available computers. Chart 2.3, on the other hand, shows the intended use of
the computers in all primary and secondary schools. A high proportion of Sweden’s computers are used for admin-
istrative purposes (25 per cent), whereas a relatively high proportion of the Republic of Korea’s computers are put
to both administrative and pedagogical use (33 per cent). Bahrain has the highest proportion of computers assigned
for pedagogical use (94 per cent) while the proportion of computers for administrative use is relatively low, at six per
cent.
35](https://image.slidesharecdn.com/ictdevolpmentreport2010-100618112450-phpapp01/85/ICT-Devolpment-Report-2010-73-320.jpg)


![WTDR.2010:.Monitoring.the.WSIS.targets
Internet
Indicator (4), the proportion of schools with Internet access, is central to understanding connectivity at the primary
and secondary level and hence to assessing Target 2. It measures the overall level of access to the Internet in schools,
and the opportunities or limitations in terms of the use of computers in primary and secondary schools. Access may
be through multiple wired or wireless devices (PCs, laptops, PDAs, smartphones, etc.). Given the paramount impor-
tance of broadband access, connectivity is also tracked by the type of Internet access. The proportion of schools with
fixed broadband Internet access provides a good indicator of the quality of Internet connections and the potential to
use ICTs for pedagogical purposes.14 Broadband (as opposed to narrowband) Internet access is particularly important
to exploit the Internet’s full potential, for example in providing students access to Internet resources or in supporting
online teacher training.
A high value or percentage for the proportion of schools with Internet access implies a high degree of access to the
Internet among the schools in a given country, while a low value indicates the contrary. The percentages by type
of Internet access can inform policies and decisions to expand and/or upgrade Internet connections in schools. The
indicator measures only the availability of Internet access in schools, and not intensity of use or the actual amount
of time that learners spend on the Internet for educational purposes. The type of Internet connection and access in
schools may also depend on existing national and subnational telecommunication infrastructures, which can be con-
strained by electric power (Box 2.4) and other technological limitations in a developing context.
Data to monitor Internet and broadband access in schools exist for many developed countries and a number of devel-
oping countries (see Charts 2.4 and 2.5). They suggest that, by 2010, practically all schools in developed countries will
be connected to the Internet. Many developed countries have in fact stopped tracking ICT infrastructure in schools,
since connectivity was approaching 100 per cent, and in most developed countries broadband penetration in schools
is either approaching or has already reached 100 per cent. For example, according to a report released by the Euro-
pean Union in 2006, the majority of schools in Europe had Internet access and in many countries, including Croatia,
Sweden and the United Kingdom, 100 per cent of schools were already connected with broadband.15 In the United
States, all public schools were connected to the Internet as of 2006, and 97 per cent had a broadband connection. In
Canada, 97 per cent of schools were connected to the Internet as early as 2004.
By comparison, the level of school connectivity is lower for middle-income and developing countries in the Ameri-
cas. Between 2007 and 2009, Argentina, Costa Rica, Mexico and St Vincent and the Grenadines have come close to
equipping half of their schools with Internet access, whereas Brazil and Chile have surpassed the 50 per cent mark. By
2009, Chile had connected three quarters of its schools to the Internet, of which 67 per cent had broadband (Box 2.5).
Uruguay has successfully provided all of its schools with broadband Internet access in a relatively short time, mainly
through a government-driven project (Box 2.6).
The developed economies in Asia and the Pacific display high levels of school connectivity, with all schools having
Internet access in Brunei, Japan, the Republic of Korea, Malaysia, Singapore and Thailand. Of these, Brunei, the
Republic of Korea, Singapore and Thailand offer 100 per cent broadband connectivity across schools. Australia had
almost achieved full Internet connectivity in all schools as far back as 2003, and one objective of its new super fast
National Broadband Network project is to connect 90 per cent of schools to a fibre-optic connection with speeds up
to 100 Mbit/s.23 Unfortunately, data on ICTs in education are lacking for both India and China, the two most popu-
lated nations in the region.24
Available data from between 2007 to 2009 for the Arab States show that several Arab countries, including Jordan,
Saudi Arabia and Tunisia, have connected over three quarters of their schools to the Internet. Bahrain has connected
all of its schools with broadband Internet access as well as a radio and a television set for educational purposes.
This can be attributed in part to policies pursued by the Ministry of Education aimed at enhancing and elevating the
level of education in Bahrain by integrating ICTs. The King Hamad’s School of the Future project, launched in 2004
to connect and link all schools in the kingdom to the Internet, is an example of such an initiative [UNESCWA, 2009].
Broadband penetration in schools is also relatively high in Jordan (73 per cent).
Data on ICTs in education are particularly scarce in Africa and what data do exist suggest that there is much room
for improvement. In Ethiopia and Senegal, less than ten per cent of schools are connected to the Internet, and only
38](https://image.slidesharecdn.com/ictdevolpmentreport2010-100618112450-phpapp01/85/ICT-Devolpment-Report-2010-76-320.jpg)


![Target.2:.Connect.universities,.colleges,.secondary.schools.and.primary.schools.with.ICTs
Box.2.5:.The.Chilean.model.—.Partnering.to.connect.schools
In Chile, close collaboration between the Ministry of Education and Enlaces16 has long been considered a model of good
practice by many policy-makers. What initially started as a pilot project to connect schools has evolved over time into a na-
tional initiative to systematically integrate ICTs in subsidized state schools.17 With the help of Enlaces, the Chilean Centre for
Education and Technology has provided Internet access to approximately 75 per cent of schools. No fewer than 67 per cent of
schools have a broadband connection.18
From the point of view of many middle-income and developing countries, implementing a national connectivity initiative of
this magnitude can be quite cost-intensive. Enlaces has used a variety of financing sources and mechanisms to fulfil its man-
date. In 1998, the Ministry of Education reached an agreement with the Compania de Telecomunicaciones de Chile through
which the operator agreed to provide free unlimited Internet service to all schools in the country for a period of ten years. As
part of its efforts to promote broadband access, Enlaces has been negotiating agreements with telecommunication operators
since 2004 in order to obtain preferential rates for educational facilities, and subsequently established a fund through which
schools could apply for subsidies totaling 50 to 100 per cent of their broadband connection fee.19
Chile’s innovative thinking made it look beyond just connectivity towards teacher development and digital content long before
other middle-income countries recognized the value added from educational technologies. At present, Enlaces is working with
the Fondo de Desarrollo de Telecomunicaciones, the country’s universal service fund, to develop a project that will roll out
fibre-optic cable to Chile’s largest schools.20
Box.2.6:.Uruguay.closes.the.digital.gap
Uruguay’s government, through its El Ceibal project, has made a strong commitment to making ICTs available in its schools,
and to teachers and students, including the youngest ones.21 By 2008, Uruguay had connected all of its primary and secondary
schools to the Internet, via a broadband connection. It further fulfilled its commitment to provide all primary school children
and all teachers with a free laptop computer by the end of 2009.
Closely linked to the One Laptop Per Child22 project, which manufactures the low-cost XO computer specifically designed for
children in developing countries, El Ceibal seeks to link education with social networking. Beyond introducing ICTs for teach-
ing and learning, the programme also aims at providing free broadband Internet access for schools and communities at large
through servers located in schools and other access points, using students’ XO computers. Since the XOs are laptop computers
capable of interconnecting with each other, they act as servers and form a wireless network.
The project is founded on three pillars: to provide equal access, to enhance teaching and learning, and to integrate ICTs in
schools in tandem with the environment outside school. For policy-makers, the priority is to provide equal opportunities for
all primary school children and for various segments of society, a strategy designed to accelerate Uruguay’s integration in the
information society.
The findings of a preliminary study on monitoring and evaluation of El Ceibal [Salamano et al, 2009] detected some positive
outcomes associated with the use of computers and Internet connectivity for teaching and learning. In particular, it showed an
increase in computer literacy among children (grades 1 to 6) and among their parents, and a closing of the intergenerational
ICT gap.
countries at advanced stages of ICT integration in education. Furthermore, the selected indicators aim to do justice to
an array of technologies with applications in an educational context. By monitoring both “old” and “new” technolo-
gies, there is a recognition that technological infrastructures and circumstances at the national level vary at any given
time across countries, as well as over time.
To make the target as concrete and measurable as possible, it is suggested that the word “all” be added in order
to seek to connect 100 per cent of educational institutions to either “old” or to “new” ICTs (or both) depending on
national circumstances, at least in the short term. At the same time, governments need to recognize the potential
41](https://image.slidesharecdn.com/ictdevolpmentreport2010-100618112450-phpapp01/85/ICT-Devolpment-Report-2010-79-320.jpg)

![Target.2:.Connect.universities,.colleges,.secondary.schools.and.primary.schools.with.ICTs
Notes
1
Substantial inputs to this chapter have been provided by Mr Patrick Lucas from the UNESCO Institue for Statistics (UIS), Mr Claude
Akpabie (UIS), M. Beatriz Valdez-Melgar (UIS) and Dr Katsiaryna Miniukovich (Ministry of Education of Belarus). These inputs are greatly
acknowledged.
2
There are a number of examples of schools, which provide access to the Internet for the community at large after school hours. ITU’s Con-
nect a School, Connect a Community initiative (http://www.itu.int/ITU-D/connect/flagship_initiatives/connecting_children/index.html) is an
example of an effort to benefit both students and the communities in which they live by promoting broadband access in schools.
3
See WSIS Geneva Plan of Action, 2003, at: http://www.itu.int/wsis/docs/geneva/official/poa.html#c2.
4
See WSIS Geneva Plan of Action, 2003, at: http://www.itu.int/wsis/docs/geneva/official/poa.html#c4.
5
Information literacy is defined as the capacity of people to recognize their information needs, locate and evaluate the quality of informa-
tion, store and retrieve information, make effective and ethical use of information and apply information to create and communicate
knowledge. See [UNESCO, 2008].
6
The World Bank measured the percentage of schools connected to the Internet in its 2006 Information and Communications for Develop-
ment Report, but the data presented were only available for selected countries, and for the year 2004.
7
The latest is: European Commission, Information Society and Media Directorate. August 2006. General Benchmarking Access and Use of
ICT in European Schools 2006: Final Report from Head Teacher and Classroom Teacher Surveys in 27 European Countries. Available at:
http://ec.europa.eu/information_society/eeurope/i2010/benchmarking/index_en.htm.
8
“San Salvador Commitment,” in Second Ministerial Conference on the Information society in Latin America and the Caribbean, LC/R.2144,
(San Salvador, 2008).
http://www.eclac.org/socinfo/elac/default.asp?idioma=IN.
9
http://www.eafricacommission.org/projects/127/nepad-e-schools-initiative.
10
See “Australia’s Digital Economy: Future Directions,” Department of Broadband, Communications and the Digital Economy (2009).
http://www.dbcde.gov.au/__data/assets/pdf_file/0006/117681/DIGITAL_ECONOMY_FUTURE_DIRECTIONS_FINAL_REPORT.pdf.
11
ISCED refers to the International Standard Classification of Education and is used to define the levels and fields of education. ISCED levels
1, 2, and 3 refer to primary, lower secondary and (upper) secondary education. For more information, see [UNESCO 1997].
12
The content of this box was contributed by by Dr Katsiaryna Miniukovich, Leading mathematician, Central Information and Analytical
Centre at the Ministry of Education of Belarus. See [Ministry of Education of Belarus, 2009].
13
Modern computer is considered as IBM-compatible with 32-bit operating system supporting graphic interface.
14
Fixed broadband Internet refers to high-speed connectivity for public use of at least 256 kbit/s or more in one or both directions (down-
load and upload). It includes cable modem Internet connections, DSL Internet connections of at least 256 kbit/s or higher, fibre and other
fixed broadband technology connections (such as satellite broadband Internet, ethernet LANs, fixed-wireless access, wireless local area
network, WiMAX, etc.). See [Partnership, 2010].
15
By 2006 already, 71% of schools in the EU 27 countries were connected to broadband Internet access.
16
Centro de Educacion y Tecnologia (Enlaces), Ministerio de Educacion, available at:
http://www.enlaces.cl/index.php?t=44&i=2&cc=1273&tm=2.
17
The education system in Chile is decentralized with municipal governments and private schools responsible for most administrative and
financing aspects. Private institutions account for 43% of primary and secondary students. Some municipal schools are subsidized by the
federal government. The Enlaces programme only applies to subsidized municipal schools. See http://www.chile-usa.org/education.html.
18
Enlaces en Cifras, available at: http://www.enlaces.cl/index.php?t=44&i=2&cc=230&tm=2.
19
Enlaces: 15 Años Integrando Tecnologia a la Educacion Chilena, page 64, available at:
http://www.enlaces.cl/tp_enlaces/portales/tpee371c23bs52/uploadImg/File/libro_enlaces.pdf.
20
En Marzo Habra Banda Ancha Real para Escuelas, La Nacion, October 2008, available at:
http://www.lanacion.cl/prontus_noticias_v2/site/artic/20081021/pags/20081021215239.html.
21
See: http://www.ceibal.edu.uy/.
22
For more information on this project, see: http://www.laptop.org.
23
See Joint Media Release by the Prime Minister, the Treasurer, and the Ministers for Finance and for Broadband, 7 April 2009, Canberra,
at: http://www.minister.dbcde.gov.au/media/media_releases/2009/022.
24
InfoDev is coordinating a survey of the use of information and communication technology for education in India and South Asia, including
data on the connectedness of schools, see:
http://www.infodev.org/en/Project.103.html.
43](https://image.slidesharecdn.com/ictdevolpmentreport2010-100618112450-phpapp01/85/ICT-Devolpment-Report-2010-81-320.jpg)


![Target.3:.Connect.scientific.and.research.centres.with.ICTs
Box.3.2:.Data.collected.by.the.Trans-European.Research.and.Education.Networking.Association.(TERENA)
The TERENA Compendium — TERENA’s main reference document — defines a point of presence (PoP) as a point on the NREN
backbone which can connect client networks or aggregations of client networks or external networks [TERENA, 2009]. Institu-
tions can be connected through a direct PoP on the NREN backbone, or through a metropolitan access network (MAN) or radio
access network (RAN), or, alternatively, served through a connected site.
The TERENA Compendium asks for:
• the total number of PoPs on the NREN;
• the number of places for core networking routing;
• the number of managed sites (where routing or switching equipment is managed); and
• the number of circuits carrying production traffic.
In addition, TERENA also poses questions relating to the availability of optical PoPs and total length of dark fibre in kilometers,
replacing a previous question asking for an estimate of bandwidth multiplied by distance, which NRENs found increasingly
difficult to answer. TERENA asks for the typical core usable backbone capacity of the NREN, although questions on capacity
distinguish between usable capacity, maximum capacity (excluding back-up routes) and total capacity (for different point-to-
point IP links). The total capacity of the network does not apply to each institution that connects to it, and this distinction is
made clear by these definitions. The TERENA Compendium distinguishes between lower, upper and typical access speeds to
different types of institutions, in implicit recognition of their different needs.
These indicators reveal the potential capacity of an NREN, the traffic volumes and transmission speeds of any research net-
work, and its actual connectivity. They also enable growth in the extent, speed and capacity of networks to be monitored over
time.
Status.of.the.target
ITU conducted an ad-hoc survey in 2009 in the context of monitoring the WSIS targets. This survey included questions
on Internet access in research centres (Table 3.1) and on NRENs (Table 3.2).
Every country for which data are available reported that scientific and research centres have Internet access, al-
most always with a broadband connection (Table 3.1). The number of reported scientific and research centres varies
greatly across countries, but this might reflect differences in definitions, not to mention differences in country size,
population, development and education levels.
Several countries also reported information on the presence of an NREN. An NREN exists in the majority of reporting
countries, but the bandwidth of the network varies greatly, from 1.55 Mbit/s and 2 Mbit/s in Mexico and Albania,
respectively, to 40 000 Mbit/s in the United Kingdom (Table 3.2). The survey did not include questions on whether
the NREN was linked to other countries or other regional networks, but this information would be useful to collect
in the future.
The number of nodes and countries covered are common indicators reported by any international collaborative re-
search network — for example, APAN covers 16 countries, TEIN2 covers 10 Asian countries, GÉANT2 and LHCG cover
34 countries, CLARA covers 15 countries, EUMEDCONNECT2 covers seven and NORDUNet five. According to DANTE,
the speed of the fastest links in pan-European networks has increased by a factor of 5 000 over the last decade, while
the number of European countries connected has more than doubled over the same period.11
51](https://image.slidesharecdn.com/ictdevolpmentreport2010-100618112450-phpapp01/85/ICT-Devolpment-Report-2010-89-320.jpg)
![WTDR.2010:.Monitoring.the.WSIS.targets
Table.3.1:.Public.scientific.and.research.centres.with.access.to.the.Internet,.2009*
Country Number.of.public. Number.of.public. %.of.public.scien- Number.of.public. %.of.public.scien-
scientific.and. scientific.and. tific.and.research. scientific.and. tific.and.research.
research.centres research.centres. centres.with. research.centres. centres.with.
with.Internet.ac- Internet.access. with.Internet.ac- Internet.access.
cess.(any.type.of. (any.type.of.con- cess.(broadband. (broadband.con-
connection) nection) connection.only) nection.only)
Albania 50 50 100 48 96
Andorra 2 2 100 2 100
Bhutan 5 5 100 ... 100
Bolivia 148 ... ... ... ...
Bosnia and Herzegovina 16 16 100 16 100
Botswana 3 3 100 3 100
Brunei 0 0 ... 0 ...
Bulgaria 139 139 100 139 100
Croatia 51 51 100 51 100
Denmark 73 73 100 73 100
Djibouti 1 1 100 1 100
Egypt 455 455 100 455 100
Hungary 57 57 100 57 100
Korea (Rep.) 27 27 100 27 100
Latvia 126 126 100 126 100
Lithuania 111 ... ... ... ...
Morocco 22 22 100 22 100
Myanmar ... 40 ... ... ...
Nauru 0 0 ... 0 ...
Netherlands 100 100 100 100 100
New Zealand 16 ... ... ... ...
Paraguay 4 ... ... ... ...
Singapore 21 21 100 21 100
United Kingdom 153 ... ... ... ...
Note: *Or latest year available. “...”: data not available.
Source: ITU Survey on the WSIS Targets.
TERENA also collects data on connection policy, e.g. which institutions are formally permitted to connect to the
NREN, and the extent to which connection is achieved (Table 3.3). All NRENs allow universities, research institutes
and, with four exceptions, higher-education institutes to connect to the network. For other institutions, there are sig-
nificant differences in policy between NRENs. For example, some NRENs may only connect government departments
that are directly related to research and education [TERENA, 2008].
In many countries, all universities are connected to the NREN, although in some countries the proportion of universi-
ties connected to the NREN may be much lower, even 50 per cent or less, e.g. Georgia (50 per cent), Belarus (35 per
cent), Israel (25 per cent), Ukraine (22 per cent), Macedonia (20 per cent) and the Czech Republic (7 per cent). The
proportion of research institutes connected to the NREN tends to be lower than the proportion of universities con-
nected to the NREN, except in Georgia, Macedonia, Moldova and Ukraine.
The bandwidth of NRENs12 in EU and EFTA countries grew significantly between 2001 and 2008, and further increases
are expected in the near future (Table 3.4). For the EU/EFTA countries, the average bandwidth doubled over the
period.
52](https://image.slidesharecdn.com/ictdevolpmentreport2010-100618112450-phpapp01/85/ICT-Devolpment-Report-2010-90-320.jpg)

![WTDR.2010:.Monitoring.the.WSIS.targets
The growth in average bandwidth masks significant differences, however. For some NRENs, bandwidth remained
roughly the same, whereas for others (e.g. CyNet and ARNES), it increased a hundredfold or more. The highest
average NREN bandwidth capacities in Europe in 2008 were 20 Gbit/s, as against 10 Gbit/s in 2006. In comparison,
CANARIE of Canada had a bandwidth capacity of 50 Gbit/s in 2007. The evolution of bandwidth capacity in the
“Other” countries in Table 3.4 reflects the effect of the introduction of affordable Gigabit ethernet technology, which
is now used by many countries. In most countries, bandwidth capacity will evolve to multiples of 10 Gbit/s. Further-
more, even though many EU/EFTA countries already have high capacities, they foresee further upgrades in the next
two years. Many other countries also expect to upgrade to Gigabit capacities.
TERENA also notes a clear trend in the bandwidth of universities [TERENA, 2008]. In 2003, the “average” university
was connected to the NREN at Megabit capacity; by 2008, that had increased to Gigabit capacity. TERENA’s data show
a clear growth in total core capacity for NRENs in 44 countries over the period 2001-2008 (Chart 3.2, left). Over the
same period, the number of countries with NRENs with capacity of 10 Gbit/s or more also grew considerably (Chart
3.2, right). The trend is less pronounced in the countries outside the EU/EFTA area. Furthermore, the increases tend
to occur in steps, as new technologies are introduced. However, the organizational set-up of universities and other
institutes may vary significantly across countries, which can have an effect on university bandwidth requirements.
For example, research institutes may be part of universities, but not in all countries. There may also be substantial
differences among countries in terms of the number and/or size of universities. A university may have a single link to
the NREN, or multiple links, for example, to faculties or schools that form part of it, but are geographically at different
locations. In terms of total access capacity, in the EU/EFTA countries for which data are available, more than 80 per
cent of the access bandwidth capacity on average (weighted) is used for the tertiary education sector.
In addition to connecting universities and research centres to NRENs, it is also important to connect NRENs to each
other, for example through regional networks. The Observatory for the Information Society in Latin America (OSILAC)
collected data on the characteristics of NRENs in Latin-American countries, including whether they were connected
to the regional network RedCLARA (see Annex 3.3.) [OSILAC, 2007]. Almost all regions now enjoy positive spillovers
from access to advanced research and education networks — for example, CERN’s Global Lambda Interchange Facil-
ity includes connectivity to all global regions except Africa.
In some regions, NRENs are being aggregated into pan-regional networks — for example, the CARINE network being
set up across the CIS countries. The extension of high-capacity connectivity to a region often prompts countries that
did not previously have a research and education network to establish one — this happened, for example, in the case
of the ALICE project to connect Central and Latin American research institutions to European research institutions.
The growth of these networks is usually project-driven and funded on an individual project basis.
Chart.3.2:.Selected.characteristics.of.NRENs.in.Europe,.2001-2008
Total bandwidth of NRENs, 44 countries, Number of countries with NRENs
2001-2008 14 of >10 Gbps, 2001-2008
200 000
12
180 000
Number of countries
160 000 10
140 000
8
Mbps
120 000
100 000 6
80 000
60 000 4
40 000 2
20 000
0 0
2002 2004 2006 2008 2002 2004 2006 2008
Source: ITU (see also Annex 3.1).
54](https://image.slidesharecdn.com/ictdevolpmentreport2010-100618112450-phpapp01/85/ICT-Devolpment-Report-2010-92-320.jpg)


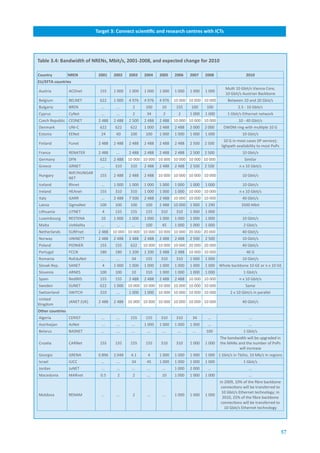
![WTDR.2010:.Monitoring.the.WSIS.targets
Table.3.4:.Bandwidth.of.NRENs,.Mbit/s,.2001-2008,.and.expected.change.for.2010.(continued)
Country NREN 2001 2002 2003 2004 2005 2006 2007 2008 2010
Other.countries.(continued)
Montenegro MREN ... ... ... ... ... ... 1 000 1 000 ...
Morocco MARWAN ... ... 2 34 45 155 155 155 ...
Palestinian
PADl2 ... ... ... ... ... ... 100 ... ...
Authority
RBNet/RUN
Russia ... ... 100 ... 2 488 2 488 2 488 10 000 40 000
Net
Same bandwidth with more optical
Serbia AMRES ... 2 155 500 100 1 000 1 000 1 000 PoPs and backbone distance to
2 700 km
Turkey ULAKBIM 34 34 155 155 45 310 500 500 10 Gbit/s
Ukraine UARNet ... ... ... ... ... ... ... 10 GE n x 10 Gbit/s
Note: Highlighted cells refer to speeds equal to or greater than 10 Gbit/s. In a number of cases, the information from earlier years refers to
the capacity of external connections, not to the capacity of the backbone. “...”: data not available.
Source: TERENA (2008), Table 3A.4.3, p. 38, and Table 3A.5.1, p. 40.
In Europe, GÉANT was launched in December 2001 to promote global research connectivity and cooperation be-
tween Europe, North America and Japan. The European GÉANT network established connections from the European
backbone to North America (NASA and the research networks Abilene, ESnet and CA*net4, in service since January
2002). It has been succeeded by GÉANT2 (Box 3.3) and will soon be upgraded to GÉANT3 offering truly global re-
search networking connectivity.
Other regional networking projects are now being implemented around the world — in Latin America (ALICE), the
Mediterranean (EUMEDCONNECT) and the Asia-Pacific region (TEIN2), some with funding assistance from the Euro-
pean Commission. DANTE-Internet2-CANARIE-ESnet (DICE) is an initiative for trans-Atlantic cooperation within the
framework of the GÉANT2 technical programme that enables engineers to work on advancing their research.
In the Mediterranean basin, EUMEDCONNECT2 is a high-capacity IP network serving the research and education com-
munities in seven countries (Algeria, Egypt, Jordan, Morocco, the Palestinian Authority, Syria and Tunisia). With direct
links to GÉANT2, EUMEDCONNECT2 connects some 2 million users in 700 institutions across North Africa and the Mid-
dle East, enabling them to collaborate with their peers at over 300 research and education establishments in Europe.
In Central Asia, the objective of the CAREN project is to establish a high-capacity research and education network
as a gateway to global research collaboration by the end of 2009. It aims to replace the Silk project’s satellite-based
connectivity with a broadband Internet network using terrestrial fibre with a direct link to GÉANT, so as to connect
researchers, educators and students in Kazakhstan, Kyrgyzstan, Tajikistan, Turkmenistan and Uzbekistan.
The Trans-Eurasia Information Network (TEIN2 network) was established to improve collaborative research network-
ing between Europe and the Asia-Pacific region. TEIN2 currently connects over 30 million users in 4 000 research
and education institutes, with direct connectivity to GÉANT2, across ten countries in Asia and the Pacific, including
China, Hong Kong (China), Indonesia, Japan, Republic of Korea, Malaysia, the Philippines, Singapore, Thailand and
Viet Nam, with the active participation of Australia.13 TEIN3 was awarded EUR 18 million of funding in October 2008
(EUR 12 million from the EU and EUR 6 million from Asian partners) and will run until 2011, offering higher-speed con-
nections to more Asian countries, such as Laos PDR. The ORIENT project was launched in March 2006 to provide dedi-
cated links to the Chinese research networks CERNET and CSTNET,14 connect the Shanghai Astronomical Observatory
to its European counterparts and promote the EUChinaGrid, a grid computing project uniting computing resources
in China and Europe [Ruggieri, 2005]. India’s research network ERNET was connected to GÉANT2 in October 2006.
In Latin America, the ALICE project was established in 2003 to develop an IP research network infrastructure towards
Europe. It sought to address what was then a lack of connectivity in Latin America, as well as the infrastructure ob-
58](https://image.slidesharecdn.com/ictdevolpmentreport2010-100618112450-phpapp01/85/ICT-Devolpment-Report-2010-96-320.jpg)

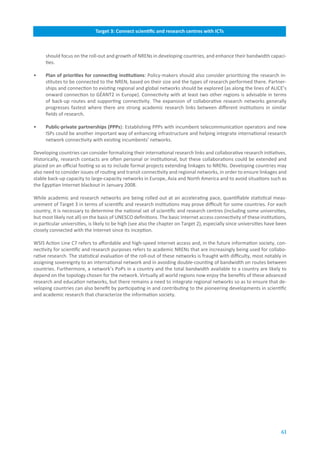


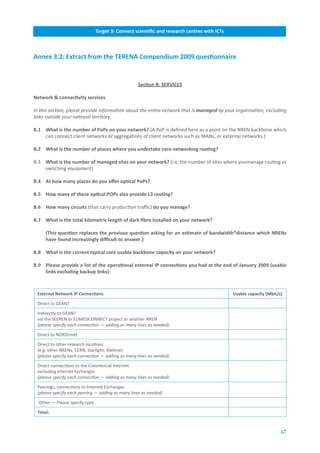


![WTDR.2010:.Monitoring.the.WSIS.targets
Box.4.2:.Examples.of.initiatives.to.connect.libraries
A number of countries have made progress in connecting their public libraries with ICTs. Some examples are discussed be-
low, including the United States, which has used universal service funds to extend connectivity to public libraries; Venezuela,
where public libraries are an important element of the country’s public Internet access programme; Singapore, which has
implemented information technology in libraries through a series of plans; and Trinidad and Tobago, where public libraries
are an important location for extending Internet access to the community. Philanthropy organizations may also play a role in
providing Internet access for public libraries.
The 2006 Telecommunications Act in the United States created a provision for schools and libraries to benefit from reduced
service charges for Internet access, financed with subsidies from the country’s universal service fund (all licensed telecom-
munication operators contribute a portion of their revenue to the fund). The discount, referred to as the “e-rate,” has made
Internet access more affordable for public libraries, and the proportion of libraries with Internet access has risen from 28 per
cent in 1996 to over 95 per cent today.22
Venezuela is the only country in Latin America with all of its public libraries providing Internet access to library users. This was
achieved as part of the country’s “Infocentro” project launched in 2000 for creating public Internet access centres.23 Libraries
are a logical place in which to provide access, since they are already public places and in Venezuela they are spread throughout
the country, with at least one in each state. The National Library of Venezuela has a website and a digital collection of Ven-
ezuela’s historical documents, as well as an online card catalogue.24 It also participates in regional digital library initiatives.25
Information technology has played a key role in transforming Singapore’s public libraries from “mediocre at best to world
class.”26 The transformation began with the establishment of the National Library Board (NLB) in 1995 to implement the na-
tion’s Library 2000 plan.27 From 1998, broadband was rolled out to the two dozen public libraries, and all of the libraries have
Wi-Fi Internet access for users with their own laptops. In 2007, there were 38 million physical library visits, 7 million logins to
the NLB website and 72 million electronic retrievals.28
The public-library system in Trinidad and Tobago is recognized as one of the best in the Caribbean. The libraries are adminis-
tered by the National Library and Information System Authority (NALIS).29 As of 2007, all 24 public libraries provided Internet
access through 250 computers [Watson and Ramlal, 2007]. Some 17 000 people a month use the Internet facilities, where
they can log on for one hour a day free of charge. A number of libraries also have Wi-Fi Internet access. The libraries’ websites
provide an array of digital content, including exhibitions that have been held at NALIS; card catalogues showing, among other
things, how many copies of a book exist, in which branch they are located and whether they are checked out or not; and digital
versions of important historical collections and newspaper clippings.
The Bill and Melinda Gates Foundation has been active in supporting Internet access in U.S. public libraries. It has expanded
this activity overseas through the Global Library Initiative.30 The Foundation has granted over USD 200 million to libraries
in ten countries (Chile, Mexico, Latvia, Lithuania, Romania, Viet Nam, Poland, Botswana, Bulgaria and Ukraine) to provide
computers and Internet access.31 In 2006, the Public Library Development Project in Latvia received a grant of USD 16 million
from the Foundation, along with USD 21 million from the Latvian government and USD 8 million from Microsoft to equip all
874 Latvian public libraries with broadband Internet connections, provide Wi-Fi access and furnish around three computers
per library.32
Cultural.centres
The concept of a “cultural centre” is not well defined, and even the Geneva Plan of Action does not specify what is
meant by the term. It is used only in the wording of the target itself.33 The Plan of Action does refer to “cultural insti-
tutions,” which can be assumed to include cultural centres, under Action Line C8.34
Depending on the definition adopted, there could be a public Internet access consideration, as cultural centres are
typically places where the public gathers,35 as well as a cultural heritage and local content aspect. Cultural centres
76](https://image.slidesharecdn.com/ictdevolpmentreport2010-100618112450-phpapp01/85/ICT-Devolpment-Report-2010-114-320.jpg)
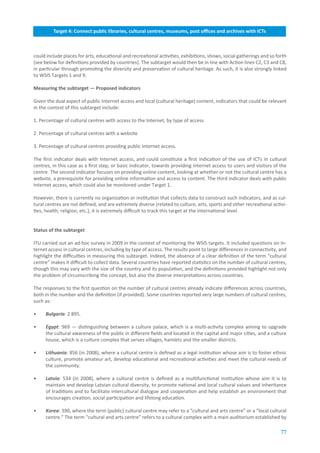


![WTDR.2010:.Monitoring.the.WSIS.targets
Another reason for connecting museums is to improve the linkages between content and context. Many museums
and museum pieces are already on the Internet, whether voluntarily or not, through tourist blogs, travel agencies or
photos of the collection posted on social networking sites.43 In most cases there is only a superficial, if any, explana-
tion of the work, and the unofficial depiction of museum pieces is often unprofessional. Only museums posses the
curatorial skills required for documenting and providing professional insights into the significance of the pieces in
their collection.
Action Line C2 recommends that providing connectivity to museums be included in countries’ national e-strategies.44
Action Line C4, relating to capacity building, is also important in this context, especially the following provision:
“Design specific training programmes in the use of ICTs in order to meet the educational needs of information profes-
sionals, such as archivists, librarians, museum professionals, scientists, teachers, journalists, postal workers and other
relevant professional groups. Training of information professionals should focus not only on new methods and tech-
niques for the development and provision of information and communication services, but also on relevant manage-
ment skills to ensure the best use of technologies. Training of teachers should focus on the technical aspects of ICTs,
on development of content, and on the potential possibilities and challenges of ICTs.”45 Action Line C8 is also again
relevant, advocating that countries “Develop national policies and laws to ensure that libraries, archives, museums
and other cultural institutions can play their full role of content — including traditional knowledge — providers in
the information society, more particularly by providing continued access to recorded information,”46 thus linking this
target also to Target 9.
Measuring.the.subtarget.—.Proposed.indicators
The International Council of Museums (ICOM) defines a museum as: “... a non-profit, permanent institution in the
service of society and its development, open to the public, which acquires, conserves, researches, communicates and
exhibits the tangible and intangible heritage of humanity and its environment for the purposes of education, study
and enjoyment.”47 The interpretation of including “connect” in the target is that museums should have Internet
access. The benefits of online access to a museum’s resources are highlighted by statistics from the Smithsonian
Museums in the United States, which were visited by some 25.2 million people in 2008, eight times less than the
172.8 million who visited its websites.48
In addition to the percentage of museums with access to the Internet, by type of access, the proportion of museums
with a website could be a useful indicator towards measuring the online content availability of museums. Having
said that, the information featured on museum websites varies greatly, from just the address and opening hours to
interactive features showing museum collections.
Thus, the two indicators proposed to measure this subtarget are:
1. Percentage of museums with access to the Internet, by type of access
2. Percentage of museums with a website
It could also be useful to expand on the basic indicator on the percentage of museums with a website to include
demand-side indicators that reflect how often and in what way the websites are being used. A number of museums
publish statistics on the number of hits their websites receive each year. The Prado in Spain surveys visitors to find
out their impressions of the museum’s website. Some 18 per cent of visitors consulted the museum’s website prior
to their visit. The Musée d’Orsay tracks the percentage of website visitors by language. Mexico asks visitors how they
found about the museum, with the Internet being one of the choices. Australia publishes data on the percentage of
pieces in museum’s collections that are accessible online.
Status.of.the.subtarget.
A major weakness of museum statistics is that there is no official source for recent data on the number of museums broken
down by country.49 One problem is the lack of a satisfactory framework for cultural data within national statistical systems,
as pointed out by the European Commission: “The field of culture defined in this way does not equate to any particular eco-
nomic sector and therefore is not covered by sectoral surveys. It includes activities in numerous areas of social and economic
life, which are not always identifiable in economic classifications. As a result, statistics are missing for a number of activities
which cannot be singled out and examined from national and European surveys or data collections” [Eurostat, 2007].
80](https://image.slidesharecdn.com/ictdevolpmentreport2010-100618112450-phpapp01/85/ICT-Devolpment-Report-2010-118-320.jpg)
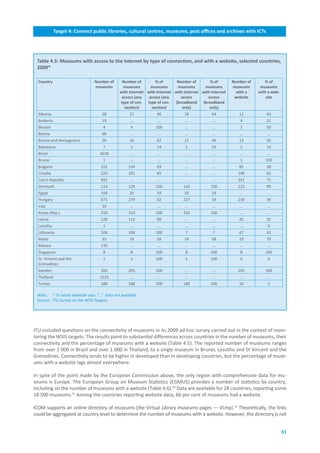

![Target.4:.Connect.public.libraries,.cultural.centres,.museums,.post.offices.and.archives.with.ICTs
Table.4.7:.Selected.museums.with.a.website,.Africa,.2007
Number. Computer-
AR* MF.** MR.*** Website
of.objects ized.
Musée historique
1 400 Yes Yes Yes 0 http://www.epa-prema.net/abomey
d'Abomey, Benin
Musée national du About 300. http://www.culture.gov.bf/textes/etbl_museena-
Yes Yes Yes
Burkina Faso 6 000 Stopped tional.htm
Libreville, Gabon 2 400 No No Yes 419 http://www.numibia.net/gabon/
Robben Isld., South About Very few.
Yes No Yes http://www.robben-island.org.za/
Africa 6 000 Stopped
About http://www.museums.or.ke/content/blogcate-
Kisumu, Kenya No No No
2 500 gory/14/20/
About
Huila, Angola No Yes No No
3 500
About
Sao Tomé No No No 30
1 400
About Few. Word
Madagascar 1 No No Yes
1 300 (destroyed)
Madagascar 2 7 000 No Yes Yes 10%. Excel
About
Musée national du Mali Yes Yes Yes 3668 http://www.mnm-mali.org
10 000
Note: *AR=Accession Register. ** MF=Master File. *** MR=Movement Register.
Source: Adapted from UNESCO/ICCROM/EPA.
(ICCROM) and the Ecole du Patrimoine Africain carried out a study of selected museums in Africa [ICCROM-UNESCO,
2007]. Of the ten museums for which data were collected, six had some type of information available on the web
(Table 4.7). One challenge the museums face is proper cataloguing, documentation and computerization of their col-
lections. This is an essential prerequisite in order for the pieces to be digitized and posted on a website.
Some countries in the Americas publish data on the number of museums (Table 4.8). Several have specific
sites dedicated to museum administration and information. Argentina and Canada have portals displaying the
locations of museums in the country. Few countries list the number of museums with a website, but anecdo-
Table.4.8:.Museums.in.selected.countries.in.the.Americas
Number.
of.muse- Year Source Portal
ums
United States 4 763 2005 US Census
http://www.museevirtuel-virtualmuseum.ca/Search.
Canada 2 400 Canadian Heritage
do?mu=on&lang=en
Dirección Nacional de
Argentina 863 2007 http://sinca.cultura.gov.ar/sic/mapacultural/mapa_cultural.php
Patrimonio y Museos (DNPYM)
Sistema Brasileiro de Museus
Brazil 2 618
— SBM
Consejo Nacional para la
Mexico 1 123 2007
Cultura y las Artes
Source: ITU.
83](https://image.slidesharecdn.com/ictdevolpmentreport2010-100618112450-phpapp01/85/ICT-Devolpment-Report-2010-121-320.jpg)
![WTDR.2010:.Monitoring.the.WSIS.targets
tal evidence suggests that the ratio is high (e.g. portal listings and dedicated national websites for cultural
heritage).
Some countries publish data on the number of museums, generally in statistical yearbooks under a culture section
or through publications of cultural ministries or agencies.55 According to the Russian Federation’s official museum
list, there are 2 204 museums in the country.56 All have a description on the portal supported by the Federal
Agency on Press and Mass Communications and a number of them have their own website.
Developed economies in the Asia and the Pacific region have information about the number of museums and typi-
cally have official museum portals including links to museum websites when available. For example, the Australian
Bureau of Statistics publishes statistics on the ICT services of museums; it reported that of the 1 329 museums in the
country at June 2004, 73.5 per cent had a website (and 11.8 per cent of the 54.9 million pieces in their collections
were available for viewing online).57 The Republic of Korea has 358 museums;58 the National Heritage site lists all the
museums with a description, and most have websites.59 In Japan, the Statistics Bureau reports 1 196 museums;60 the
Japan Internet Museum has entries for around 500, including websites when available. All of Singapore’s 50 or so
museums are online with an entry portal (http://www.museums.com.sg/museums/members/). The main museums
in the region’s large developing nations are online. China’s Statistics Bureau reported 1 722 museums in 2007, of
which the biggest is the National Museum of China (http://www.chnmuseum.cn). Six of the seven museums adminis-
tered by the Ministry of Culture in India have websites, including the oldest in the Asia and the Pacific region (Indian
Museum, Kolkata).
There are a variety of museum-related portals for the Arab States, which give an idea of the number of museums
and website availability. According to the Jordan Tourism Board, the country currently has 27 museums,61 of
which just over a fifth have websites. The Qatar Tourism Authority website lists five museums;62 two have their
own websites and information about the others can be obtained from the Qatar Museums Authority website.63
The Association of Egyptian Travel Businesses on the Internet lists 47 museums on their website.64 Most have a
Table.4.9:.Websites.of.some.of.the.world’s.major.museums
Museum Annual.visitors Website Annual.web.visitors
Musée du Louvre, Paris, France 8 260 000 (2007)67 www.louvre.fr 9.86 million (2007)
Vatican Museums, Vatican City, Rome,
... http://mv.vatican.va ...
Italy
Metropolitan Museum of Art, New York 4.7 million (2008/09) www.metmuseum.org 34.7 million (2008/09)
J Paul Getty Centre, Los Angeles, Cali-
1.6 million (2008) www.getty.edu/museum/ ...
fornia
Musée d’Orsay, Paris, France 3 025 164 (2008)68 www.musee-orsay.fr 5 091 983 (2008)
Uffizi Gallery, Florence, Italy ... www.uffizi.firenze.it ...
Art Institute of Chicago, Illinois 1 434 000 (2008) www.artic.edu/aic/ ...
Tate Modern, London, England 4 647 881 (2008/09) www.tate.org.uk/modern/ 18 494 657
Prado Museum, Madrid, Spain 2 759 029 (2008) www.museodelprado.es ...
National Gallery of Art, Washington, DC 4.8 million (2009) www.nga.gov 45 800 per day (2009)
Note: “...”: data not available.
Source: [Metropolitan Museum of Art, 2009], [J Paul Getty Trust, 2009], [Musée d’Orsay, 2008], [Art Institute of Chicago, 2008],
[Tate Modern London, 2009], [Museo del Prado, 2008], [National Gallery of Art, 2009].
84](https://image.slidesharecdn.com/ictdevolpmentreport2010-100618112450-phpapp01/85/ICT-Devolpment-Report-2010-122-320.jpg)
![Target.4:.Connect.public.libraries,.cultural.centres,.museums,.post.offices.and.archives.with.ICTs
Box.4.4:.Virtual.museum.visits
Establishing a website is just the first step on a museum’s digital journey. A website can provide practical information such as
the history of the museum, what it contains, its location, operating hours and admission fees. The purpose of any museum is to
display its collection, and there are numerous ways the Internet can enhance and extend museum holdings. The most obvious
is to feature digital versions of the key pieces in the collection. Digital photography has improved in quality and prices have
come down, so high-quality digital cameras are becoming increasingly affordable for many museums around the world. Some
museums have photographic units that predate the digital age, which were used for documenting collections and providing
photos of works for catalogues. They are now moving to the digital age. The photography unit of the Indian Museum in Kolkata
digitized 7 149 objects in 2008 [India Ministry of Culture, 2009]. Providing digital versions of key holdings is just a first step,
the eventual goal being to provide online access to a museum’s whole collection. The Internet digitally extends a museum’s
exhibition space, since a website can showcase all of a collection, including works that are not normally displayed because of
a lack of exhibit area or because they are on loan.
The collection can be further enriched over the Internet through extensive documentation. The Internet allows far more infor-
mation to be provided in respect of a piece than can be offered on a physical visit, plus the ability to link it to related things.
The Smithsonian Institute in the United States, which houses 137 million objects in its collection, envisions not only displaying
Isaac Singer’s original sewing machine online but also linking it to a video showing how it works.69
Some museums offer virtual tours on their website. The Louvre in Paris allows the viewer to pan and scroll Leonardo da Vinci’s
masterpiece “Mona Lisa,” but without the crowds, and to tie in to events such as the film “The Da Vinci Code.”70 In addition to
virtual tours, users can download podcasts from some museums to listen to when they visit the museum. The Metropolitan
Museum in New York launched podcasts in 2005, and some 330 000 were downloaded in its 2009 fiscal year [Metropolitan
Museum of Art, 2009]. Dozens of museums now offer podcasts through the Apple iTunes store.
Other extras that museums are adding to their websites include e-commerce capabilities, so that users can purchase advance
tickets online or order guides, catalogues and souvenirs from the museum’s shop. Multilingualism of the website is also im-
portant. Paris’s Musée d’Orsay notes that 60 per cent of its website visitors used the French version in 2008, as against 25 per
cent for English and 6 per cent each for Italian and Spanish [Musée d’Orsay, 2008].
The flurry of activity surrounding museum website development is illustrated by growing international exchanges, assistance
and conferences. Archives & Museum Informatics has been holding the annual “Museums and the Web” international confer-
ence since 199771 and also organizes the annual “Best of the Web” awards, which recognize the top museums in a number of
website categories.72
descriptive page on the association’s website. Collections of some of them are included in the Eternal Egypt web-
site,66 a collaboration of the Supreme Council of Antiquities, the Centre for Documentation of Cultural and Natural
Heritage and IBM Corporation.
Though complete statistics on the extent of museum connectivity around the world are not available, a number of
countries have made impressive progress. In addition to the availability of online information about museums, some
countries have created portals linking and geo-tagging their museums. For example, Greece, which reports that all of
its museums are online, adds functionality through a “cultural map” that displays the locations of all museums and
allows users to select specific types of museums and see their location on the map.
The world’s major museums all have advanced websites, often in different languages, and in addition to reporting the
number of physical visitors some also report the number of online visitors they receive (Table 4.9).66
While they often lack the sophistication of the world’s largest museums, a growing number of museums in develop-
ing countries have established a web presence. For example, the National Museums of Kenya portal features descrip-
tions of the 18 museums comprising the system (http://www.museums.or.ke). The Fiji Museum, which dates back to
85](https://image.slidesharecdn.com/ictdevolpmentreport2010-100618112450-phpapp01/85/ICT-Devolpment-Report-2010-123-320.jpg)

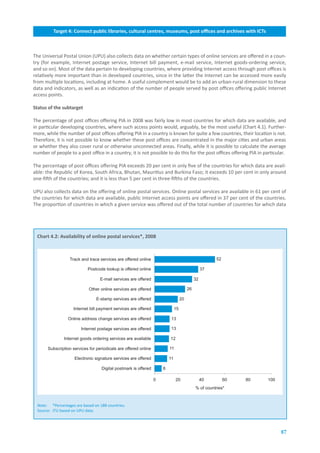
![WTDR.2010:.Monitoring.the.WSIS.targets
Box.4.5:.Examples.of.initiatives.to.connect.post.offices
This box relates some examples of policies or initiatives to connect post offices taken from ICT policy papers. However, as
“before and after” data are not available, it is not possible to assess how successful these announcements and initiatives have
been.
In Lesotho, establishing public Internet access points in post offices was part of the 2005 ICT Policy Paper, within a broader
strategy to use the post offices and the National Library of Lesotho and other public venues to provide public Internet access
throughout the country. In particular, the Ministry of Communications, Science and Technology, in conjunction with relevant
stakeholders from the ICT sector and the private sector, was to ensure that all post offices include public access points for the
Internet and other ICT services by 2010 [Lesotho Ministry of Communications, Science and Technology, 2005].
In Kenya, the 2006 ICT Policy Paper [Communication Commission of Kenya, 2006] stated that the “The government will also
support the development, deployment and maintenance of multipurpose community, public library and post office owned
public access centres.” Furthermore, the policy paper recognizes that “the use of modern communications technology can
significantly improve the speed of mail delivery and funds transfer. The government’s ultimate aim is to have all post offices
connected to the Internet to support electronic mail services.” According to UPU data, close to 52 per cent of post offices in
Kenya offered public Internet access in 2006. While this is already a relatively important percentage of the total number of
post offices, more still could be connected. Furthermore, in 2003 the number of post offices in Kenya also fell short of the UPU
guidelines, with one post office for 36 000 inhabitants in Kenya, significantly less than the one for 6 000 recommended by UPU.
In Mauritius, one aim under the ICT policy for 2007-2011 [Mauritius Ministry of Information Technology and Telecommunica-
tions, 2007] is to use post offices for providing public Internet access points: “Government will provide access to ICTs through
the enhancement of existing public Internet access points (PIAPs) in post offices and the setting up of PIAPs with multipurpose
functions at new locations to be accessed by the whole community.” According to UPU data, some 32 per cent of post offices
in Mauritius offered PIA in 2008, leaving plenty of scope for increasing post-office connectivity.
In Jamaica, the September 2009 ICT policy statement on universal service74 specifies that the government will “continue to
fund connectivity services and supporting infrastructure to educational institutions, libraries, post offices” using the Universal
Service Fund to “(among other initiatives) support connectivity access, the provision of hardware, software and supporting in-
frastructure to schools, provision of hardware and software to libraries and post offices; support content, information literacy,
educational and technical training in ICTs.” According to UPU data, only 0.9 per cent of post offices in Jamaica provided public
Internet access in 2008, indicating that there is still a huge potential for improvement.
In Bhutan, post offices have been revamped into ICT centres. Since 2003, a joint project by ITU, UPU and the governments of
India and Bhutan has managed to connect a total of 37 post offices, and to bring the benefits of digital technologies to people
in rural and remote areas across Bhutan. The project covers some very remote locations that had no telecommunication infra-
structure and now enjoy VSAT-based connectivity, providing their inhabitants with various ICTs, including basic telephone and
fax services and Internet access. Access to telecommunication/ICT services has had a major impact on people’s lives. While
it used to take postal mail five to seven days to reach certain villages, people can now send and receive messages or make
phone calls instantaneously. The project also allowed people in newly connected areas to receive up-to-date information on
the country’s 2008 election results, and helped to modernize Bhutan Post, which was able to improve some of its working
methods and encourage innovation among its staff [ITU-UPU, 2009].
88](https://image.slidesharecdn.com/ictdevolpmentreport2010-100618112450-phpapp01/85/ICT-Devolpment-Report-2010-126-320.jpg)
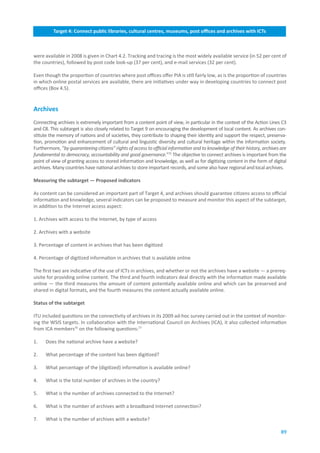
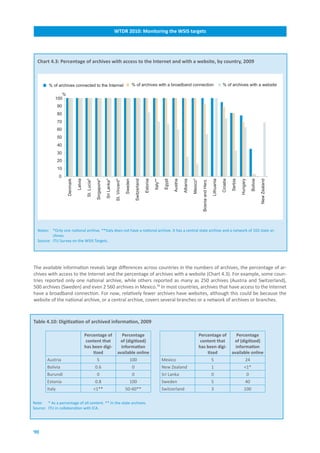


![Target.4:.Connect.public.libraries,.cultural.centres,.museums,.post.offices.and.archives.with.ICTs
Providing public Internet access
Libraries, post offices and — depending on the definition — cultural centres are ideal locations for providing the
community with public Internet access (PIA). They already have an existing infrastructure including a network of
branches, and are open to the public, which means they may reach a population that is not otherwise connected and/
or does not have access to other PIA locations. In addition, libraries hold a repository of information, and electronic
access to information seems a logical extension of their activities.
The available evidence suggests that most public libraries are keen to enter the digital age, but a lack of funding is
often the key barrier. While in developed countries most libraries tend to have access to the Internet, this is not yet
the case in developing countries. Where data on libraries providing public Internet access are available, such as in
Latin America and the Caribbean, they paint a mixed picture. The data for post offices show that offering PIA is not
widespread in most of the countries for which data are available, including in developing countries.
Establishing, or continuing to establish, PIA in libraries and post offices, particularly in developing countries, and
encouraging the provision of online information and services, is a worthwhile goal to pursue, as it has the potential
to reach substantial parts of the population, including those not yet “connected.” In some cases, this may require
greater private-sector involvement, for example through public-private partnerships.
Providing online content
Libraries, museums and archives each have the provision of online content in common. Many libraries have a treas-
ure of local content — from rare Buddhist texts in the National Library of Bhutan to historical documents dating back
to the time of Christopher Columbus in the National Library of Trinidad and Tobago. It is essential these be digitized
and made available online in order to promote cultural diversity (cf. Target 9). Similarly, putting the collections of all
museums and the information held in archives worldwide on the Internet is vital for providing wider access to the
world’s cultural heritage. In most developed countries, these institutions are present on the Internet, although the
available online information could be expanded; and some of the major institutions in developing countries also have
a website, although generally with less information that can be accessed online. Therefore, one of the main chal-
lenges is to bring more institutions in developing countries online and to enrich the content of those already having
a website.
Providing ICTs for libraries, museums and archives is critical for supporting the digitization of cultural heritage and
making it available online to researchers and the public. Unfortunately, many developing countries lack the resources
for basic museum upkeep, let alone budgets for information technology. Bandwidth is also often a constraint, in ad-
dition to Internet connection charges.
One interim solution would be for national cultural agencies to at least create an online portal listing the cultural
institutions in a country, along with a brief description. In the long run, a more progressive solution is required that
would allow individual institutions to build up content on their own websites.
Governments should step up efforts to provide appropriate resources to public libraries, museums and archives for
them to achieve full connectivity by 2015. Although there is still some way to go, especially in developing countries,
the target is attainable by 2015. Indeed, there are many initiatives under way to connect these institutions, and
the cost of connecting them is relatively low, especially since there are relatively fewer of them than households
or schools, thus increasing the feasibility of reaching the target. Supplementary sources of funding may include the
private sector, development agencies and philanthropy organizations, which can be combined with government
budgets to create partnerships for connecting these institutions and enabling them to create websites. An example
of partnerships might be for libraries, museums and archives in developed countries to “adopt” an institution in a
developing country.
There are also examples of private-sector involvement in bringing museum content in developing countries online.
One example of a public-private partnership is IBM working with China, Egypt and Russia to develop web presences
for their cultural heritage.79 The Getty Foundation, part of the Getty Institute that also includes the museum of the
same name, is working with Jordan’s Department of Antiquities to develop an Arabic-English website with a geo-
graphical information system featuring the locations of important cultural heritage sites [J Paul Getty Trust, 2008].
93](https://image.slidesharecdn.com/ictdevolpmentreport2010-100618112450-phpapp01/85/ICT-Devolpment-Report-2010-131-320.jpg)

![Target.4:.Connect.public.libraries,.cultural.centres,.museums,.post.offices.and.archives.with.ICTs
Notes
1
Substantial inputs to the sections on libraries and museums have been provided by Michael Minges. Box 4.6 was provided by Guido Koller
and Manuela Höfler of the Schweizerisches Bundesarchiv. Annick Carteret of the International Council on Archives assisted in the collec-
tion of information from ICA members.
2
See WSIS Geneva Plan of Action, 2003, at: http://www.itu.int/wsis/docs/geneva/official/poa.html, §4
3
See WSIS Geneva Plan of Action, 2003, at: http://www.itu.int/wsis/docs/geneva/official/poa.html #c2, §9
4
See WSIS Geneva Plan of Action, 2003, at: http://www.itu.int/wsis/docs/geneva/official/poa.html#c3, §10
5
See WSIS Geneva Plan of Action, 2003, at: http://www.itu.int/wsis/docs/geneva/official/poa.html#c8, §23
6
See WSIS Geneva Plan of Action, 2003, at: http://www.itu.int/wsis/docs/geneva/official/poa.html#c4, §11 k)
7
http://www.ala.org/ala/research/initiatives/plftas/index.cfm.
8
See WSIS Geneva Plan of Action, 2003, at: http://www.itu.int/wsis/docs/geneva/official/poa.html #c3, §10 h) and i).
9
http://www.theeuropeanlibrary.org/portal/organisation/about_us/aboutus_en.html.
10
http://www.kb.se/english/about/digitazation/.
11
http://europa.eu/rapid/pressReleasesAction.do?reference=IP/06/253&type=HTML&aged=0&language=EN&guiLanguage=en.
13
http://www.wdl.org/en/about/background.html.
13
http://books.google.com/googlebooks/agreement/.
14
http://www.google.com/intl/en/press/pressrel/20081027_booksearchagreement.html.
15
http://www.spiegel.de/international/business/0,1518,473529-2,00.html.
16
http://www.uis.unesco.org/ev.php?ID=6970_201&ID2=DO_TOPIC.
17
IFLA/FAIFE, 2007, World Report, http://archive.ifla.org/faife/report/world_report_2007.htm.
18
The discrepancy could also be caused by the definition of a public library as being primarily financed by public sources. There are around
2 000 “popular” libraries in Argentina supported by local neighbourhood associations. See:
http://www.conabip.gov.ar/contenidos/institucional/que-es-conabip.asp.
19
Australian Bureau of Statistics, Public Libraries, Australia, 2003-04. (2005). http://www.abs.gov.au/AUSSTATS/abs@.nsf/
Latestproducts/8561.0Main%20Features12003-04?opendocument&tabname=Summary&prodno=8561.0&issue=2003-04&num=&view=.
20
National Center for Education Statistics (U.S.). March 2005. Public Libraries in the United States: Fiscal Year 2002.
http://nces.ed.gov/pubsearch/pubsinfo.asp?pubid=2008301.
21
The European Union has put emphasis on the availability of electronic card catalogues in public libraries and defined a six-stage process
in terms of the online functionality [European Commission, 2007].
22
Anon. E-rate and Universal Service. American Libarary Association. http://www.ala.org/ala/issuesadvocacy/telecom/erate/index.cfm.
[Accessed 1 April 2010]
23
http://www.infocentro.gob.ve/.
24
http://www.bnv.gob.ve/.
25
http://www.comunidadandina.org/bda/.
26
http://harvardbusiness.org/product/transforming-singapore-s-public-libraries-abridged/an/805028-PDF-ENG.
27
http://ifla.queenslibrary.org/IV/ifla62/62-sabj.htm.
28
http://www.nlb.gov.sg:80/Corporate.portal?_nfpb=true&_pageLabel=Corporate_portal_page_aboutnlb&node=corporate%2FAbout+NLB
%2FFast+Facts&corpCareerNLBParam=Fast+Facts.
29
http://www2.nalis.gov.tt/Home/tabid/37/Default.aspx.
30
http://www.gatesfoundation.org/topics/Pages/libraries.aspx.
31
http://seattletimes.nwsource.com/html/nationworld/2009108724_apusgatesfoundationlibraries.html.
32
http://www.3td.lv/index.php/en/par/apraksts/.
33
See WSIS Geneva Plan of Action, 2003, at: http://www.itu.int/wsis/docs/geneva/official/poa.html, § 6d).
34
See WSIS Geneva Plan of Action, 2003, at: http://www.itu.int/wsis/docs/geneva/official/poa.html #c8, § 23b)
35
In this case, they should also be considered under Target 1 on community access points.
36
Local Culture Promotion Act, Article 2.
37
Latvia reported that in 2005, 103 cultural centres had access to the Internet, but the total number of cultural centres was not given for
that year. However, 534 cultural centres were reported in 2008.
95](https://image.slidesharecdn.com/ictdevolpmentreport2010-100618112450-phpapp01/85/ICT-Devolpment-Report-2010-133-320.jpg)
![WTDR.2010:.Monitoring.the.WSIS.targets
38
See http://ort.ru/en/sng/complete-list-of-ort-schools-and-centres-in-cis/ukraine/city-kharkov/.
39
See http://portal.unesco.org/geography/en/ev.php-URL_ID=8503&URL_DO=DO_TOPIC&URL_SECTION=201.html.
40
See http://www.comminit.com/en/node/269602/307.
41
See http://www.arabdev.org/node/add/book/parent/90.
42
See WSIS Geneva Plan of Action, 2003, at: http://www.itu.int/wsis/docs/geneva/official/poa.html #c8, § 23b).
43
For example the Picasso Museum in Barcelona notes that over 500 unauthorized photos of its works are on Flickr, as well as over
100 videos on YouTube. http://www.slideshare.net/museupicassobarcelona/museu-picasso-le-voyage-de-web-10-web-20.
44
See WSIS Geneva Plan of Action, 2003, at: http://www.itu.int/wsis/docs/geneva/official/poa.html #c2.
45
See WSIS Geneva Plan of Action, 2003, at: http://www.itu.int/wsis/docs/geneva/official/poa.html #c4, § 11k). This action line is also
important for the other subtargets insofar as specific skills, including ICT skills, are required for building up online content and digitizing
collections.
46
See WSIS Geneva Plan of Action, 2003, at: http://www.itu.int/wsis/docs/geneva/official/poa.html #c8, § 23b).
47
http://icom.museum/hist_def_eng.html.
48
http://www.si.edu/about/.
49
While the UNESCO Institute of Statistics lists a 1999 questionnaire for museum statistics, no data on museums are available from their
website.
50
http://www.egmus.eu/.
51
http://www.egmus.eu/index.php?id=10&L=0&STIL=0.
52
http://icom.museum/vlmp/.
53
Another website, MuseumLink, claims “it will eventually contain links to every museum on the planet, from the world’s largest to the most
obscure (assuming they have a website).” http://www.museumlink.com/.
54
http://www.dac.gov.za/DACinstitutions.html.
55
For example, Japan has data on the number of museums in the “Education and Culture” chapter of its Statistical Handbook [Statistics
Bureau of Japan, 2007]. The Statistical Abstract of the United States has a section on “Arts, Recreation, and Travel” that includes data on
the number of museums, number of employees and revenue (e.g. US Census Bureau, 2010). In Mexico, the number of museums and a
breakdown by state are included in the publication “Estadísticas básicas de la cultura en México” [Consejo Nacional para la Cultura y las
Artes, 2008].
56
http://www.russianmuseums.info.
57
http://www.ausstats.abs.gov.au/ausstats/subscriber.nsf/0/D4CDAABA966DC2CACA25700D00762129/$File/85600_2003-04.pdf.
58
http://www.korea.net/detail.do?guid=28252.
59
http://www.heritage.go.kr/eng/mus/nat_lis.jsp.
60
http://www.stat.go.jp/english/data/handbook/c16cont.htm#cha16_3.
61
http://www.visitjordan.com/visitjordan_cms/Museums/tabid/762/Default.aspx.
62
http://www.qatartourism.gov.qa/pillars/index/1/culture/232.
63
http://www.qma.com.qa/eng/index.php/qma/home.
64
http://www.touregypt.net/museums.htm.
65
http://www.eternalegypt.org/EternalEgyptWebsiteWeb/HomeServlet?ee_website_action_key=action.display.sites&language_id=1.
66
The list has been compiled by a travel website based on the amount of traffic it gets to different listings. See:
http://www.tripadvisor.com/PressCenter-i173-c1-Press_Releases.html.
67
http://www.louvre.fr/media/repository/ressources/sources/pdf/src_document_54288_v2_m56577569831217194.pdf.
68
http://www.musee-orsay.fr/fr/collections/histoire-du-musee/quelques-chiffres.html.
69
http://www.si.edu/opa/annualrpts/2008report/Smithsonian2008.pdf.
70
http://www.louvre.fr/llv/activite/detail_parcours.jsp?CURRENT_LLV_PARCOURS%3C%3Ecnt_id=10134198673458526&CONTENT%3C%3E
cnt_id=10134198673458720&CURRENT_LLV_CHEMINEMENT%3C%3Ecnt_id=10134198673458720&FOLDER%3C%3Efolder_id=14084743
95181115&bmLocale=en.
71
http://www.archimuse.com/conferences/mw.html.
72
http://conference.archimuse.com/forum/mw2009_best_web_sites_selected.
73
See http://publius.cc/dialogue_icts_human_development_growth_and_poverty_reduction/091109 and http://aitec.usp.net/Banking%20
&%20Payment%20Technologies%20EA,,17-19Feb2009/MarkHeffernan_SECTECS%20%5BCompatibility%20Mode%5D.pdf.
96](https://image.slidesharecdn.com/ictdevolpmentreport2010-100618112450-phpapp01/85/ICT-Devolpment-Report-2010-134-320.jpg)

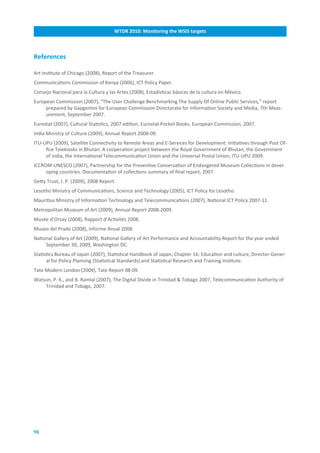
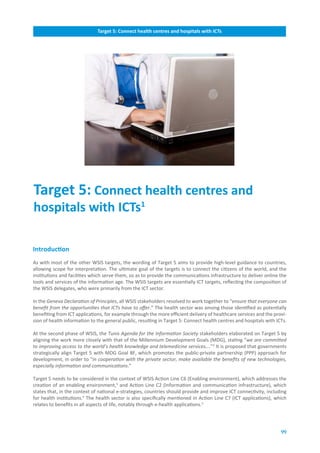
![WTDR.2010:.Monitoring.the.WSIS.targets
Use.of.ICT.for.health.as.an.internationally.agreed.goal
The World Health Organization (WHO) defines the use of ICT for health as ”e-health.”6 Carefully planned introduction
of ICT into the health sector should result in improved ways in which data and information are collected, stored, re-
trieved and shared. ICT has proven to be a powerful tool in supporting more effective delivery of health services and
increasing the efficiency of health systems. Trends show that the adoption of e-health enabling policies and actions in
the health sector started to gain momentum in high-income and upper-middle income countries in the early 1990s.
Uptake by developing countries started more slowly, but has significantly accelerated since 2000 [WHO, 2006].
It should be noted that while Target 5 refers to hospitals and health centres, these are not well defined. Health sys-
tems are highly complex structures that vary from country to country and consist of many inter-related components.
These components are the facilities and institutions which care directly or indirectly for citizens’ health needs, profes-
sional and support staff, infrastructure, health commodities such as medication and technical equipment, logistics
management and finance. They deliver care in public health and educate and deploy the health workforce. As health
systems become increasingly sophisticated and, therefore, a greater challenge to manage, the use of ICTs in process-
ing patient, hospital and health-facility information is becoming an integral part of health-systems management at
all levels of care.
Health systems in most countries comprise three levels of service — primary, secondary and tertiary, but not all
countries have all of these levels. Primary care is the first level of care that a citizen will encounter. Primary care is
non-emergency care, and is usually provided by a medical or nursing practitioner in health centres. Secondary care is
more specialized, and is provided in a hospital setting as either inpatient or outpatient services. Tertiary care refers
to the provision of complex treatments offered in specialized hospitals and provided by medical specialists.
The health sector is highly information-intensive. Providing effective health services requires the extensive collection
of patient data in analogue and digital forms, which are then processed and disseminated within the same institu-
tion or sent to other institutions. Increasingly, these data will not only be shared within the same country, but will be
sent to other countries, if necessary for the treatment of the patient. E-health also serves to broaden the informa-
tion and communication horizons of healthcare workers. Knowledge, information and data can now be accessed and
exchanged locally, nationally, regionally and globally. These opportunities apply equally to developing countries and
to developed countries although, clearly, the challenges are greater in the developing world.
The face of public health services is changing as they adopt ICTs. Examples of applications in the health sector include:
• Electronic health records/electronic medical records EHR/EMR (often used interchangeably): the use of ICTs to
generate, store and share longitudinal real-time electronic records of a patient’s healthcare information
• Telehealth/telemedicine: the use of ICTs to offer diagnostic and treatment services remotely
• M-health/mobile health: the use of mobile devices such as mobile phones for health purposes (Box 5.1)
• Decision-support systems (DSS): the use of online information resources for clinical decision-making
• E-learning: the use of ICTs for the education and ongoing training of health professionals and students
• E-journals: the use of ICTs to create and publish virtual journals and disseminate them via the Internet or CD/
DVD if connectivity is poor.
An example of an initiative that supports the latter two applications is provided in Box 5.2.
100](https://image.slidesharecdn.com/ictdevolpmentreport2010-100618112450-phpapp01/85/ICT-Devolpment-Report-2010-138-320.jpg)
![Target.5:.Connect.health.centres.and.hospitals.with.ICTs
Box.5.1:.M-health
M-health (also known as mobile health) is a relatively recent term for medical and public health practice supported by mo-
bile devices, such as mobile phones, patient monitoring devices, PDAs and other wireless devices [Germanakos et al., 2005].
M-health presents a unique opportunity to improve health services. The massive expansion of mobile technology worldwide
coupled with the continued lack of adequate Internet connectivity in many poorer countries provides fertile ground for m-
health to grow. By the end of 2009, there were an estimated 4.6 billion mobile cellular subscriptions, 3.2 billion of which in
the developing world [ITU, 2010]. Thus, with an estimated mobile cellular penetration rate of 56.8 per 100 inhabitants in the
developing world, mobile technologies constitute a powerful tool for health-related purposes on a large scale.
M-health offers a number of areas of application for public health, including:
• Remote diagnosis and support
• Medication adherence and remote monitoring
• Disease outbreak surveillance and associated data collection and reporting
• Mass dissemination of public health information.
The following case study illustrates the use of m-health in the fight against HIV/AIDS in South Africa.
The.use.of.cell.phones.in.combating.HIV/AIDS.in.South.Africa
South Africa enjoys a very high mobile cellular penetration rate: 90.6 mobile cellular subscriptions per 100 inhabitants in 2008
[ITU, 2010]. The prevalence rate of HIV and AIDS in adults aged 15 to 49 is 18.1 per cent.7 Cell-Life, a Cape Town-based NGO,
is seizing the opportunity to capitalize on the existing highly developed mobile communications infrastructure to combat the
AIDS epidemic by using mobile phones as a health communication tool.
A major ongoing programme of Cell-Life is Aftercare, where health workers provide home-based care to HIV/AIDS patients
receiving antiretroviral treatments (ART). The Aftercare programme uses mobile technology to support treatment. Regimens
are discussed and clinical information is captured using mobile devices. The information is then sent as a text message to a
central patient database. There, a care manager monitors incoming patient data and can respond to health workers’ questions
or provide additional information for the patient. Not only is the programme proving to be effective due to its immediacy in
providing information, but it is helping to build a database of the severity and prevalence of HIV in the region. The cost of the
programme has been kept relatively low through the use of data-collection software which operates even on low-cost mobile
phones.
Source: WHO.
Measuring.Target.5.—.Proposed.indicators
As with the other WSIS targets, there is a need for further clarification of what is being measured and how it is to
be measured. Each element in the target requires a definition in order to ensure national and global consistency of
measurement and reporting and comparable results.
The following definitions are suggested for Target 5:9
1. Hospital — Residential establishment equipped with inpatient facilities for 24-hour medical and nursing care,
diagnosis, treatment and rehabilitation of the sick and injured, usually for both medical and surgical conditions,
and staffed with at least one physician. The hospital may also provide outpatient services.
101](https://image.slidesharecdn.com/ictdevolpmentreport2010-100618112450-phpapp01/85/ICT-Devolpment-Report-2010-139-320.jpg)


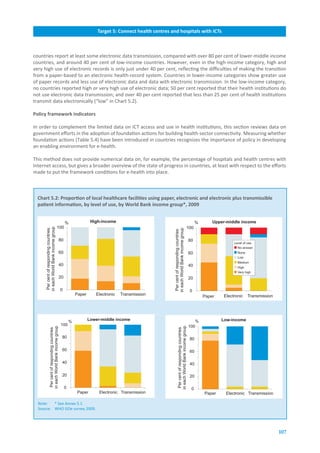


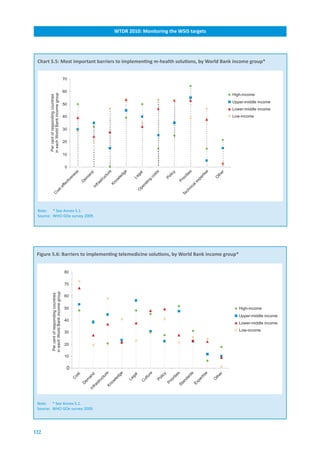


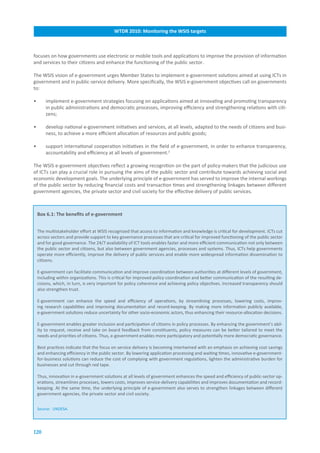
![Target.6:.Connect.all.local.and.central.government.departments.and.establish.websites.and.e-mail.addresses
Target.5:.Connect.health.centres.and.hospitals.with.ICTs
Measuring.Target.6.—.Proposed.indicators
Target 6, namely “Connect.all.local.and.central.government.departments.and.establish.websites.and.e-mail.ad-
dresses,” can be interpreted as comprising three distinct goals:
i) Connect central and local government departments
ii) Establish websites for central and local government departments
iii) Establish e-mail addresses for central and local government departments.
The conceptual framework of the target stemmed from an increasing recognition of the value of integrating technol-
ogy into government so as to find more effective and speedy solutions for more efficient functioning of governments,
improved delivery of basic services and wider dissemination of information to the citizen.
In establishing the WSIS target for e-government, it was deemed important that national and local/municipal gov-
ernments and departments should implement the use of ICTs, be connected online and make the relevant public
officials’ e-mail information available to the citizen as a first step towards providing online information.
However, as is the case for the other WSIS targets, it was not clear exactly how the terms “connecting” central and
local governments or “establishing a website” were to be interpreted. For example, government offices could have
Internet access and/or an established website at varying levels of use. A registered entry point for a ministry or gov-
ernment department does not mean that all its offices and staff are fully equipped with ICTs, or that links have been
established between different government entities. Similarly, simply having e-mail contact information posted on a
government website is not sufficient to allow a thorough assessment of the website in question in terms of effective
service delivery. Experience shows that countries utilize ICTs differently. Assessments based on ICT use show that the
establishment of a website without appropriate and useful navigation, interaction or transaction capability may not
have any impact in terms of developing effective e-government solutions.
The Partnership on Measuring ICT for Development (see Box 2 in the introductory chapter of this report), which was
set up in the wake of WSIS, through its Task Group on E-government Indicators (TGEG), is working on the develop-
ment of a global framework for measuring e-government, including recommendations on a proposed set of indica-
tors which can form a core group to be collected by Member States. Such an approach is important in order to root
out inconsistencies in definitions, methodology, reporting and monitoring of e-government indicators across — and
between — national and local governments, and will lend consistency to international and national benchmarking
efforts. A consistent global approach will also support the application of lessons learnt and best practices in e-gov-
ernment development around the world.
Based on the Partnership’s ongoing work, the following key indicators are proposed for measuring progress towards
Target 6. The proposed indicators consider basic access to and use of ICTs in government, as well as the role of the
government as a provider of public information and services. The suggestions also take into consideration the work
accomplished at the regional level by the Working Group on ICT Measurement of the ECLAC Statistical Conference of
the Americas (SCA-ECLAC), which has been discussing a core list of e-government indicators [OSILAC, 2009] [OSILAC,
2010]. The proposed indicators are based on a straightforward interpretation of the current wording of Target 6, and
the review of the target in the following section follows this interpretation. The indicators will be further refined in
due course, as part of the ongoing work of the Partnership.
Proposed.indicators:
Connect.central.and.local.government.departments
1. Percentage of government employees using the Internet
2. Percentage of government employees using computers
3. Percentage of government institutions with Internet access, by type of access (narrowband, broadband)
4. Percentage of government institutions using corporate networks (LAN, WAN, intranet, extranet)
Establish.central.and.local.government.websites
5. Percentage of central government institutions with established websites3
6. Percentage of local government institutions with established websites3
121](https://image.slidesharecdn.com/ictdevolpmentreport2010-100618112450-phpapp01/85/ICT-Devolpment-Report-2010-159-320.jpg)


![Target.6:.Connect.all.local.and.central.government.departments.and.establish.websites.and.e-mail.addresses
Target.5:.Connect.health.centres.and.hospitals.with.ICTs
Table.6.3:.Countries.with.government.websites,.2003.and.2009
2003 2009
Countries with central government websites 173 189
Countries without central government websites 18 3
Total UN Member States 191 192*
Note: *On 28 June 2006, Montenegro was accepted as a United Nations Member State, bringing the total UN Member States to 192.
Source: [UNDESA, 2003] and [UNDESA, 2010].
past few years reflects increasing attention to user-friendliness for the convenient delivery of information and
services.
In some cases, national portals were consolidated in conjunction with standalone websites as an increasing number
of countries opted to establish separate, but connected, e-government portals, providing a one-stop-shop window
for easy access to all public services. For example, in 2005, the Government of Malta had two separate websites
aimed at different sets of users: one providing information, and one offering online services. Since then, the country
has moved forward in consolidating its online services into an integrated portal bringing together all e-government
services and offering quick, convenient and personalized access to public electronic services.
Some countries have opted for one national site as the main gateway, with links to other service delivery por-
tals aimed at different users (for example the U.S. FirstGov portal, http://www.firstgov.gov, and in Singapore,
http://www.gov.sg).
In another model of e-government, some countries have implemented national online presence with separate portals
designed to offer different access points for different audiences. For example, Norway has the official government
site, described as your gateway to the public sector in Norway (http://norge.no), and another government website
for information from the government and the ministries, (http://www.regjeringen.no) which provides public informa-
tion and services on a wide range of issues such as agriculture, asylum and refugee policy, taxes, the economy, etc.
Many developing countries have also chosen this audience-targeted portal approach. For example, Mauritius
(http://www.gov.mu) has set up dedicated subportals for citizens and the business sectors.
In some countries, instead of the national government website or portal serving as a single point of entry, the Head
of State website serves this purpose, with links to other departments. For example, Algeria has the President’s web-
page (http://www.el-mouradia.dz/francais/Sommaire.html) with links to national institutions such as the Presidency
of the Republic, the National People’s Assembly, the National Council and the various ministries. In other instances,
Head of State websites are provided in addition to a national homepage or a national portal. By 2008, 124 countries
out of the 192 UN Member States had a Head of State website, though in many cases in addition to the national
government website.
In most countries, many government ministries/departments are online, too. By 2008, some 82 per cent of all coun-
tries had established one or more sectoral websites for the ministries of finance, education, health, social welfare
and labour. In around three quarters of the 192 UN Member States, non-executive branches of governments were
also online (Chart 6.1).
As with national homepages/central portals, there is no discernible pattern to the establishment of departmental serv-
ices online. Models vary according to each country’s vision, strategy and needs. Some countries have set up links to the
national portal; others have done so to the Head of State website, where no national portal exists. A few have independ-
ent standalone ministry/department websites which may also serve as the country’s entry point. In Angola, for example,
there is no single national website; instead, there are standalone websites for the National Assembly, the Constitutional
Commission, the National Police, the National Bank of Angola, the Radio and the TV, and several ministries.
125](https://image.slidesharecdn.com/ictdevolpmentreport2010-100618112450-phpapp01/85/ICT-Devolpment-Report-2010-163-320.jpg)
![WTDR.2010:.Monitoring.the.WSIS.targets
Chart.6.1:.Government.ministries.and.departments.with.a.website,.2008
Number Number of countries Per cent of UN Member States %
180 100
160 90
140 80
70
120
60
100
50
80
40
60
30
40 20
20 10
0 0
Government ministries / departments Non-executive branches of government
Source: [UNDESA, 2008].
Table.6.4:.Government.ministries.connected.to.the.national.homepage,.2009
Number.of.ministries.linked.to.the.national.homepage
0 1-5 6-10 More.than.10
Number of countries 52 13 9 118
Percentage of total 27% 7% 5% 61%
Source: [UNDESA, 2010].
The number of online departments varies across countries as well. In larger and more advanced countries, all depart-
ments are online. In developing countries where e-government has not yet fully taken root, only a few individual
departments may be online, indicating little synergy. In such cases, the lack of a national website prevents countries
from enjoying the benefits of e-government that would stem from effective integration of back-end ministries and
departments.
In this context, a review carried out by UNDESA of Member States’ progress in interlinking ministries and other
government departments shows a mixed picture (Table 6.4). While there has been much progress in establishing
websites, less appears to have been done in linking together government departments to improve their combined
efficiency and enhance synergies. For example, whereas the majority (61 per cent) of countries had more than 10
ministries/departments connected to the country’s homepage or main portal, in almost one-third of the countries
none were connected, and another seven per cent had only one to five ministries connected. This suggests that ef-
forts to link up various government departments are still at an early stage worldwide.
126](https://image.slidesharecdn.com/ictdevolpmentreport2010-100618112450-phpapp01/85/ICT-Devolpment-Report-2010-164-320.jpg)
![Target.6:.Connect.all.local.and.central.government.departments.and.establish.websites.and.e-mail.addresses
Target.5:.Connect.health.centres.and.hospitals.with.ICTs
Local government departments
Whereas rapid progress has been made in establishing national government websites, the same does not hold true
at the local level. At the same time, it should be noted that data on local government online are less readily available
than for the national government. Local governments are simply not online, due to a lack of resources, slow imple-
mentation of the overall e-government programme or lack of an integrated e-government development. Where local
governments have come online, the strategy has followed two distinct paths. Local government websites are either
linked from the national webpage, or they exist as standalone sites, delivering services at the local level according to
the country’s constitutional and political governance.
By 2008, more than half of all countries had one or more local government sites connected via the national website
(111 countries, or 58 per cent of the 192 UN Member States [UNDESA, 2008]). In many of these, especially developed
countries, local-level information and services were also available via the integrated services portals, as indicated above.
Looking at the level of municipalities, [Holzer and Kim, 2007] examined digital governance in a selected number of
large cities in the 100 “most wired” economies. The study evaluated the official websites of each of these cities in
their native languages. In 2007, 86 of the 100 cities selected were found to have official municipal websites, and
Seoul, Hong Kong, Helsinki, Singapore and Madrid achieved the highest evaluation score. The study found substantial
regional disparities, even though these appear to ease somewhat over time. In 2007, 50 per cent of the cities selected
in Africa had established official city websites (compared to only 29 per cent in 2005). In Asia, the figure increased
from 78 per cent in 2005 to 89 per cent in 2007. By 2007, 70 per cent of the cities selected in North America had
established official city websites. In Europe, South America, and Oceania, 100 per cent of the selected cities had their
own official website.
iii).Establish.email.contact.and.provide.online.government.services
The fact that a government department has set up a website is a necessary but not a sufficient condition for effec-
tive e-government. Effective e-government is not achieved if the site does not include any information and features
to promote online public services. Collecting information about the types of services offered through the websites
is, therefore, crucial for assessing and identifying the potential impact of e-government. Indeed, the usefulness of a
public website depends primarily on the services offered (Box 6.2).
The UNDESA Global E-Government Readiness Survey monitors the 192 UN Member States in terms of their state of
e-government readiness. The survey is a comparative assessment of the willingness and ability of governments to
provide information and services as they progress towards higher levels of digitized public-service delivery, and an
appraisal of the use of e-government for the delivery of social services to the citizen.
The assessment of government websites is based upon a four-stage model of e-government development, which is
ascending in nature, each stage building upon the previous level of a state’s online services. The model defines stages
of e-readiness according to the degree of sophistication of the services offered. The websites are assessed on the ba-
sis of criteria such as the range of features available on the national portal or an official homepage; links to ministries/
departments; current and archived information, such as policies, laws and regulation, newsletters and downloadable
databases; and more sophisticated interactive and transactional services. The stages are: Stage I: Emerging (where
website information is mostly static and/or unidirectional, with information flowing essentially from government to
the citizen); Stage II: Enhanced (online services of the government enter the interactive mode, with services to en-
hance convenience for the citizen); Stage III: Transactional (two-way interaction and transactional services online);
and Stage IV: Connected (including features that allow citizens to communicate their views and opinions on public
policy issues).
A review of the type of services reveals that not only have countries come online during the past few years, but they
have expanded and consolidated their e-services. First-level participatory features such as contact information or e-
mail are increasingly the norm, as more and more countries around the world take the first online step towards pro-
moting transparency and accountability in the public sector and allowdirect online citizen contact with the relevant
public official. By 2008, 136 countries (out of the 192 UN Member States) had e-mail information available on their
national website, while additional contact information, such as telephone number/fax number, was available in 110
countries in 2008 and in 159 countries by 2009.
127](https://image.slidesharecdn.com/ictdevolpmentreport2010-100618112450-phpapp01/85/ICT-Devolpment-Report-2010-165-320.jpg)
![WTDR.2010:.Monitoring.the.WSIS.targets
Chart.6.2:.Selected.e-government.transactional.services,.2008.and.2009
Number of countries 2008 2009
45
40
35
30
25
20
15
10
5
0
Online form Online payment Online payment of Online bidding Online tracking
submission by card individual registrations / for public of permits
permits contracts
Source: [UNDESA, 2008,) and [UNDESA, 2010].
In regard to the more sophisticated services in Stage III, the availability of selected online transactional services of-
fered by countries on their websites is presented in Chart 6.2. In 2008, online form submission was the most widely
available service, being reported in 39 countries (one-fifth of all 192 UN Member States), and 31 countries offered us-
ers the possibility to make online payments with credit or debit cards. For each of the services for which two years of
data are available, there is an increase in the number of countries offering them. Online tracking of permits remained
the least common service, being offered in 11 countries in 2008, and 21 countries in 2009.
An important aspect of Stage IV (Connected) is the assessment of the government’s capability and capacity to pro-
vide website features for citizen participation in public policy-making. By enhancing government’s ability to request,
receive and take on board feedback from constituents, policy measures can be better tailored to meet the needs
and priorities of citizens. Online provision can be a catalyst for e-inclusion by offering new and better services. In
other words, e-government can contribute to more participatory and potentially more democratic governance. In
this context, it is important to assess how many countries are actively using ICTs for inclusive e-government. Some
progress has been made in the provision of more mature e-government services (Table 6.5). However, much of this
is confined to the more developed economies. Whereas a quarter of the countries have some kind of a statement
of policy encouraging citizen participation, less than half of these countries actually provide mechanisms for formal
consultation and only nine per cent of them provide any feedback to the citizen.
Table.6.5:.Online.services.related.to.citizen.participation,.2009
Statement.or.policy.. Formal.online.. Feedback.on.policies.through.
encouraging.citizen.. consultation the.online.consultation
participation
Number of countries 53 21 18
Percentage of total 28% 11% 9%
Source: UNDESA E-Government Survey 2010.
128](https://image.slidesharecdn.com/ictdevolpmentreport2010-100618112450-phpapp01/85/ICT-Devolpment-Report-2010-166-320.jpg)
![Target.6:.Connect.all.local.and.central.government.departments.and.establish.websites.and.e-mail.addresses
Target.5:.Connect.health.centres.and.hospitals.with.ICTs
Box.6.2:.The.level.of.e-government.services.in.the.EU
The EU assesses e-government according to a five-stage maturity model reflecting the ways in which businesses and citizens
can interact with public authorities. It distinguishes the following stages: (i) Information, (ii) One-way interaction, (iii) Two-way
interaction, (iv) Transaction, and (v) Targetization. [European Commission, 2009]
Many European countries have already reached the third and the fourth levels, offering the possibility of two-way interactions
and transactions. Examples of services on offer in these levels include the availability of electronic forms for most services, and
full electronic case handling, where the user applies for and receives the service online without any additional paperwork. In
the EU model, the fifth level, targetization, provides an indication of the extent to which front and back offices are integrated,
data are re-used and services are delivered proactively. The fourth and fifth levels are jointly referred to as “full online avail-
ability”.
A key indicator used to assess the fourth and fifth stages of the e-government maturity model is the percentage of full online
availability based on 20 basic public services for citizens and enterprises, including income taxes, corporate taxes, job search
services, car registration, enrolment in higher education, health-related services and social contributions for employees. The
four leading European Union nations are Austria, Malta, Portugal and the United Kingdom, each having achieved 100 per cent
online availability in 2009 (Chart 1 Box 6.2).
Chart.1.Box.6.2:.Percentage.of.full.online.availability.of.20.basic.public.services,.Europe
%
100 2009
2007
80
EU 2009 average: 71 %
60
EU 2007average: 59 %
40
20
0
Austria
Malta
Portugal
United Kingdom
Sweden
Slovenia
Estonia
Finland
Denmark
Ireland
France
Norway
Spain
Netherlands
Germany
Belgium
Italy
Luxembourg
Latvia
Hungary
Czech Rep.
Lithuania
Iceland
Slovak Rep.
Poland
Cyprus
Greece
Romania
Bulgaria
Croatia
Switzerland
Source: Eurostat, e-Government Statistics Database
Whereas most governments have developed websites and are increasingly providing public services online, less is
known about how these services are being used. Information on the uptake of e-government services remains scant,
but some insights can be gained from regional or country-level surveys which assess how online services are being
used.
Use of government online services
How citizens and businesses have made use of online government services is illustrated in Box 6.3. The information is
based on the core ICT household and business indicators developed by the Partnership on Measuring ICT for Develop-
ment and collected at the international level by ITU, UNCTAD and Eurostat.
129](https://image.slidesharecdn.com/ictdevolpmentreport2010-100618112450-phpapp01/85/ICT-Devolpment-Report-2010-167-320.jpg)
![WTDR.2010:.Monitoring.the.WSIS.targets
Box.6.3:.Use.of.e-government.services.by.citizens.and.businesses
As most governments have developed websites and are increasingly providing public services online, it is important to know
how these services are being used by individuals and businesses. As can be seen from Chart 1 Box 6.3, in Europe the propor-
tion of Internet users interacting with government institutions ranges from over 80 per cent in Iceland to over nine per cent
in Serbia. For non-European economies, the numbers tend to be lower, ranging from 31 per cent in New Zealand (in 2006) to
close to three per cent in Azerbaijan.
In countries which are in the vanguard of e-government, the uptake of e-government by businesses is much higher than by
the citizen. For businesses using government online services, a higher percentage of such enterprises interact with public
administrations than do individuals, partly because businesses, in general, have greater Internet access and tend to be
more connected than individuals. Since the use of ICTs for business offers the opportunity to increase efficiency, including
through automation, it is to be expected that businesses use e-government services more than the citizen. In the European
Union in 2008, 93 per cent of businesses (with 10 or more employees) had Internet connections, compared to 60 per cent
of households.4
Between 2004 and 2009, the proportion of businesses in EU countries interacting with government organizations over the
Internet was higher, and growing at a faster rate, than the proportion of individuals. Overall, 70 per cent of EU businesses
either obtained information or downloaded official forms from government websites in 2009 (Table 1 Box 6.3). The numbers
remain relatively lower for e-procurement, with less than 15 per cent of enterprises submitting a proposal using an electronic
tendering system.
The use of online government services by business increases with the number of employees (Chart 2 Box 6.3), except in Ice-
land where enterprises with 50-249 employees made greater use of online government services than enterprises with less
than 250 employees. The numbers tend to be higher in European than non-European economies for which data are available.
The United Arab Emirates, New Zealand, Singapore and Brazil are among the highest ranked non-European economies.
Chart.1.Box.6.3:.Percentage.of.Internet.users.interacting.with.general.government.organizations.online,.2009*
%
90
80
70
60
50
40
30
20
10
0
Iceland
Denmark
Norway
Finland
Sweden
Luxembourg
France
Netherlands
Estonia
Austria
Slovenia
Spain
Germany
Cyprus
Portugal
Ireland
United Kingdom
Slovak Rep.
Malta
Belgium
Hungary
Czech Rep.
Latvia
Italy
Poland
Lithuania
New Zealand
Greece
Croatia
Turkey
Canada
TFYR Macedonia
Bulgaria
Brazil
Romania
United Arab Emirates
Egypt
Hong Kong, China
Rep. of Korea
Serbia
Mauritius
Azerbaijan
Note: * Or most recent year available.
Source: ITU based on [Eurostat, 2009] and national sources.
130](https://image.slidesharecdn.com/ictdevolpmentreport2010-100618112450-phpapp01/85/ICT-Devolpment-Report-2010-168-320.jpg)


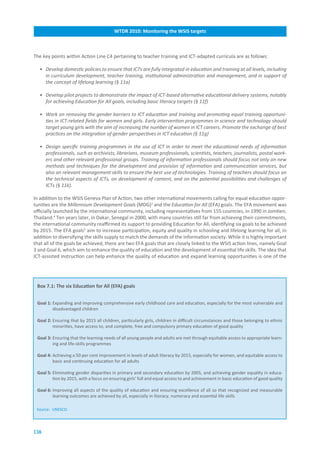
![Target.7:.Adapt.all.primary.and.secondary.school.curricula.to.meet.the.challenges.of.the.information.society
Executive.summary
Box.7.2:.Estonia’s.tiger.leap.from.prerequisites.to.action7
In 1993, the Estonian Information Network of Education and Science (EENet)8 was established by the Ministry of Education and
Culture to improve Internet connectivity and computer training for teachers. Inspired by the early success of EENet’s initiative
during the early nineties, the idea of distributing Internet-connected computers throughout Estonian high schools was first
envisioned and articulated by a journalist in an 1995 newspaper article. Considering Estonia’s size and development trends at
the time, the country was quick to embrace the idea of introducing this new paradigm and enhancing the quality of education,
to join the “developed world” in a single “tiger leap.” The metaphor of a tiger leap became popular and was supported by all
interest groups within society, including the President of the Republic, who announced the launch of the venture in a televi-
sion speech in early 1996.9 The Tiger Leap Foundation was established at the end of 1996.
The main focus of the project was on the acquisition of ICT hardware, the development of data communication networks and
the creation of educational software. Another important policy element was teacher education, as well as fostering a virtual
environment devoted to the Estonian language, culture and heritage.10, 11 Actual work in connecting schools to data communi-
cation networks started after the project evaluation, at the end of 1997.
By 2006, the Tiger Leap programme had succeeded in ensuring that Estonia’s schools were equipped with modern ICTs (in-
cluding broadband access in the vast majority of schools) and had all integrated the use of ICTs in the curriculum. The focus
of the 2006-2009 plan was on the creation of e-learning content and continued improvement of curriculum quality through
the use of ICTs.
stepping stones towards achieving the education-related targets in the WSIS Plan of Action and the EFA goals (for a
complete list of the EFA goals, see Box 7.1).
In view of the challenges faced in meeting the WSIS, MDG6 and EFA targets, it seems unrealistic to assume that
conventional delivery mechanisms will be capable of ensuring the affordable and sustainable provision of quality
and equal education opportunities for all by 2015. Indeed, the biggest challenge for many education systems is to
be able to offer training or learning opportunities to traditionally underserved or marginalized groups. This includes
girls and women who face barriers to schooling; rural populations that are too dispersed to populate regular schools
cost-effectively with reasonable class sizes; children from families in extreme poverty; and special needs groups or
persons with disabilities who have no access to learning centres.
While the lack of ICT infrastructure remains a major constraint for many developing countries, some have gone
beyond connecting schools. Exemplary actions are being taken by governments in terms of policy initiatives that ad-
dress the multi-faceted challenges of adapting curricula in primary and secondary schools to meet the demands of an
ever-changing society (see, for example Estonia, Box 7.2)
Measuring.Target.7.—.Proposed.indicators
Monitoring curricula at the international level in relation to Target 7 can be understood in two ways. On the one
hand, monitoring will track the outputs of ICT-adapted curricula. Almost all existing data on outputs in education are
derived from sample-based international comparative assessments which rely on direct measurement of ICT use in
schools and curricula by students and teachers (see Box 7.3). On the other hand, and of prime importance for Target
7, monitoring must also focus on measuring the inputs required in order to gear curricula to the needs of the infor-
mation society. An evaluation over time of the requisite human and physical capital resources is essential, as these
constitute the foundation for curricula that meet the changing needs of society.
A set of core ICT in education indicators that measure aspects of e-readiness and access to ICT in education systems
was submitted by the Partnership on Measuring ICT for Development to the United Nations Statistical Commission
(UNSC) at its 40th session in February 2009 [Partnership, 2010]. As a response to the need to expand the initial
core list, UIS has established the international Working Group for ICT Statistics in Education (WISE). The purpose of
the working group is to bring together statisticians (national focal points) from ministries of education (or national
statistical offices) from 25 countries around the world to pilot the international Questionnaire on Statistics of ICT in
139](https://image.slidesharecdn.com/ictdevolpmentreport2010-100618112450-phpapp01/85/ICT-Devolpment-Report-2010-177-320.jpg)
![WTDR.2010:.Monitoring.the.WSIS.targets
Box.7.3:.The.use.of.ICT.in.curricula.—.A.review.of.selected.comparative.assessments
The International Association for the Evaluation of Educational Achievement (IEA) has performed international comparative
assessments which focus on measuring student achievement in mathematics, science and reading, and include modules on
ICT use by students and teachers as part of the curriculum. Examples of these studies include the Progress in International
Reading Literacy (PIRLS)12 and the Trends in International Mathematics and Science Study (TIMSS).13 One of the first sample-
based assessments aiming exclusively at measuring the use of ICT in education was the Second Information Technology in
Education Studies (SITES). Initiated in 1997, SITES is a research programme focused on comparative assessment of ICT use in
education across many countries.14 In addition to cross-national data collection, qualitative case studies of innovative peda-
gogical practices were also undertaken.15 SITES 2006 is the third project in the series.16 Another important study is the Organi-
sation for Economic Co-operation and Development’s (OECD) Programme for International Student Assessment (PISA). The
programme, which is a standardized international assessment targeting the performance of 15-year old students, includes a
specific module that examines ICT use by students [OECD, 2006].
The growing prevalence and integration of technology for education over time shows that steps have been taken to bridge
the digital divide in education. In Charts 1 and 2 of Box 7.3, a comparison between the years 2000 and 2006 reveals an overall
increase in the frequency of use of computers at school for 15 year-old students. The median proportion of students that use
computers every day for the same countries has risen modestly from five per cent to nine per cent, while the median value
for the proportion of students that use computers once or twice a week17 reached a relatively high level in 2006 (46 per cent).
Comparison of the figures for students who have never used a computer at school in 2000 (17 per cent) and 2006 (5 per cent)
points to the growing proliferation and use of computers at schools in many countries.
To date, international comparative student assessments remain the predominant source of information for policy questions
regarding ICT use in education. These assessments are essential for identifying variables for the purposes of monitoring trends
in the integration of ICTs in education.
Chart.1.Box.7.3:.Frequency.of.computer.use.at.school,. Chart.2.Box.7.3:.Frequency.of.computer.use.at.school,.
2000 2006
%
%
60
80 Almost every day (median 9%)
Almost every day (median 5%)
A few times each week (median 24%) Once or twice a week (median 46%)
Never (median 17%) 60 Never (median 5%)
40
40
20
20
0
0
Canada
Germany
Chile
Norway
Switzerland
Ireland
Sweden
Denmark
Finland
Australia
Belgium
Liechtenstein
Czech Rep.
Bulgaria
Russia
Thailand
Latvia
Hungary
Germany
New Zealand
Switzerland
Russia
Canada
Chile
Ireland
Norway
Liechtenstein
Belgium
Czech Rep.
Thailand
Sweden
Latvia
Australia
Denmark
Finland
Bulgaria
Hungary
Source: OECD PISA database Source: OECD PISA database
Education. The following four indicators18 suggested to monitor Target 7 in the following sections (Box 7.4) are the
result of this initiative [UNESCO-UIS, 2009a]:
1. Proportion of ICT-qualified teachers in primary and secondary schools (for ISCED levels 1-3)
2. Proportion of teachers trained to teach subjects using ICT (for ISCED levels 1-3)
3. Proportion of schools with computer-assisted instruction (for ISCED levels 1-3)
4. Proportion of schools with Internet-assisted instruction (for ISCED levels 1-3)
140](https://image.slidesharecdn.com/ictdevolpmentreport2010-100618112450-phpapp01/85/ICT-Devolpment-Report-2010-178-320.jpg)
![Target.7:.Adapt.all.primary.and.secondary.school.curricula.to.meet.the.challenges.of.the.information.society
Executive.summary
Box.7.4:.How.is.ICT-assisted.instruction.defined?
ICT-assisted instruction refers to teaching methods or models of instruction delivery that employ ICT in supporting, enhancing
and enabling course-content delivery. It includes any, all or combinations of the following: radio-, television-, computer- and
Internet-assisted instruction
What.are.ICT-related.fields?
ICT-related fields include all programmes that comprise any of the following four fields of education and training [UNESCO-
UIS, 2009a] [Eurostat, 1999]:
Audiovisual techniques and media production is the study of techniques and the acquisition of skills to produce books,
newspapers, radio/television programmes, films/videos, recorded music and graphic reproduction with ICT. It includes pro-
grammes in methods of colour reproduction, photography and computer graphics, as well as the layout for pictures, words
and decorations in the production of books, magazines, posters, advertisements, etc.
Computer science is the study of the design and development of computer systems and computing environments. It includes
the study of the design, maintenance and integration of software applications.
Computer use is the study of using computers and computer software and applications for different purposes. These pro-
grammes are generally of short duration.
Electronics and automation (engineering and engineering trades) is the study of planning, designing, developing, maintaining
and monitoring electronic equipment, machinery and systems. It includes designing computers and equipment for commu-
nication.
Source: [UNESCO-UIS, 2009a].
These indicators will measure the inputs or determinants required for the effective delivery of ICT-adapted curricula.
Inputs in this instance refer specifically to trained teachers as well as the required conditions for the delivery of ICT-
assisted instruction. They serve as the foundation for the integration of ICTs in education systems. The indicators that
monitor these inputs are statistically comparable at a cross-national level, and aim to track progress towards Target 7
and the corresponding action lines identified above. At the international level, the collection and dissemination of
these indicators are under the responsibility of UIS.
The stock of available human capital for teaching is seen as the hallmark for the effective delivery of any curriculum,
in particular one that involves ICT-assisted instruction (for a definition of this indicator, see Box 7.4). One useful
measure in monitoring the stock of human capital is thus the proportion of ICT-qualified teachers (or teachers trained
to teach basic computer skills) in primary and secondary schools. Such a measure sheds light on the extent to which
primary and secondary school teachers have the required ICT training to teach basic computer skills (or computing)
classes. This indicator is part of the core list of ICT indicators identified by the Partnership on Measuring ICT for De-
velopment (Partnership indicator ED8).
A high percentage of ICT-qualified teachers among the overall teaching staff in primary and secondary schools sug-
gests that a country aims to provide learners with basic ICT skills and to meet emerging and evolving skills require-
ments in the information society. This does not automatically mean, however, that basic computer skills (or com-
puting) classes are actually offered to learners by all teaching staff who have received formal training to teach basic
computer skills (e.g. in cases where certain other prerequisites — such as computer labs, basic computer skills course
syllabus, etc. — are not available in schools). Besides its use for international comparison, this indicator can also be
calculated and analysed at national and subnational levels (by ISCED level and grade, geographical region, urban/
rural area, and public/private school) in order to design tailored policies and help implement training actions and
deploy adequate numbers of ICT-trained teachers in schools.
141](https://image.slidesharecdn.com/ictdevolpmentreport2010-100618112450-phpapp01/85/ICT-Devolpment-Report-2010-179-320.jpg)
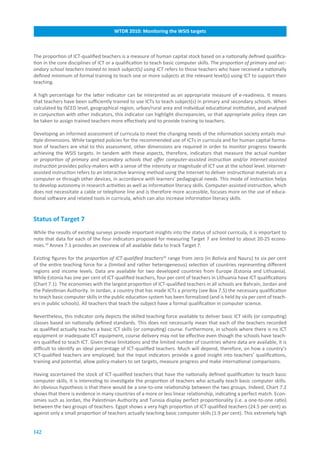

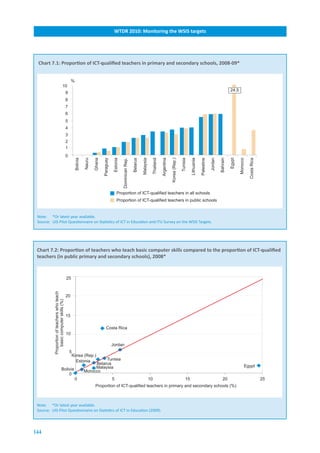

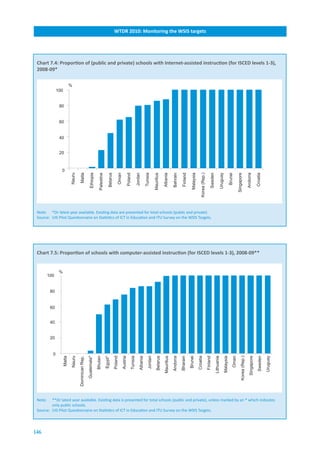
![Target.7:.Adapt.all.primary.and.secondary.school.curricula.to.meet.the.challenges.of.the.information.society
Executive.summary
gies such as radio-, and television-assisted instruction to complement course delivery, according to national circum-
stances.
Chart 7.5 shows that computer-assisted instruction is very prevalent in a number of countries. This type of instruction
is more accessible, because it does not require a cable or telephone connection. It is founded on the use of educa-
tional software and related tools in the curricula. As many as eight countries from different regions and at different
levels of development indicate that they have fully adopted this mode of instruction in their schools. A country’s
development status does not necessarily seem to determine the level of computer-assisted instruction, since both
Austria and Poland — two developed, European countries — have lower levels (76 and 69 per cent) than a number
of developing countries, including Tunisia, Jordan and Mauritius. A number of countries, including Malta, Nauru, the
Dominican Republic and Guatemala, report no or little computer-assisted instruction in their schools. On the other
hand, these countries may have a greater prevalence of other forms of ICT-assisted instruction such as television- and
radio-assisted instruction.
Conclusions.and.recommendations
Under the right conditions, it is believed that ICTs can have a massive impact on the expansion of learning oppor-
tunities to greater and more diverse populations, beyond cultural barriers, and outside the confines of teaching
institutions or geographical boundaries [Haddad and Draxler, 2002]. Indeed, technology can improve the teaching
and learning process by reforming conventional delivery systems. As a tool, ICTs enhance the quality of learning and
facilitate state-of-the-art skills formation.
Guaranteeing an adequate supply of trained teachers is of critical importance and remains a major challenge con-
fronting many countries throughout both the developing and developed world. While only a limited number of coun-
tries collect data on the proportion of ICT-qualified teachers, there are large variations among countries. Some en-
tirely lack trained staff and therefore remain unprepared to adapt their curricula to the information society. Similar
discrepancies exist in terms of the proportion of primary and secondary teachers trained to teach subjects using ICT
facilities, with the proportion ranging from zero in some countries to 100 per cent in others.
Without an adequate pool of skilled teachers, adapting curricula to meet the needs of the information society is argu-
ably unattainable. It is widely understood that ICTs by themselves cannot provide the education that learners need in
order to be productive citizens in society and to contribute to the economic, social and political life of their countries.
Success in implementing and leveraging ICTs in education in the conventional classroom setting is heavily dependent
on teachers. Moreover, without the necessary investments in infrastructure to support a curriculum that intends to
encapsulate ICT in the learning process, the formation of practical ICT skills of both learners as well as teachers is
hampered. By definition, schools that do not have the supporting ICT infrastructure and ICT-trained teachers are not
in a position to deliver pedagogical initiatives such as computer- and Internet-assisted instruction.
In a general sense, adapting curricula means modifying the way content is presented and delivered. It means adjust-
ing the curriculum to ensure that all ICT-mediated content is accessible to all students. Adapting the curriculum to in-
tegrate ICTs requires emphasis on design, development and implementation of instructional approaches that provide
multiple means of representation and multiple means of student engagement. The inclusion of ICTs in curriculum
design means that more flexibility is required in order to be able to adjust to learners.
For the limited sample of countries for which data are available on the different forms of ICT-assisted instruction, the
variation across countries is striking. While a number countries show evidence of an ICT-adapted curriculum in all or
a majority of their primary and secondary schools, only a small proportion of schools in many developing countries
have the requisite inputs to effectively integrate ICT as part of the curriculum. Countries which have adopted full-
scale implementation of computer- and Internet-assisted instruction in their schools also have a relatively higher
proportion of trained teachers, whereas other countries show signs that they are still in the early stages of imple-
mentation. Looking at the gap observed, albeit across the limited number of countries with available data, countries
which are in the earlier stages of e-readiness can propel their progress by seizing opportunities to determine what
activities or conditions are necessary, learning from more advanced countries which have employed effective models
and policies for integrating ICTs in their curricula.
147](https://image.slidesharecdn.com/ictdevolpmentreport2010-100618112450-phpapp01/85/ICT-Devolpment-Report-2010-185-320.jpg)

![Target.7:.Adapt.all.primary.and.secondary.school.curricula.to.meet.the.challenges.of.the.information.society
Executive.summary
Notes
1
Substantial inputs to this chapter have been provided by Mr Claude Akpabie from the UNESCO Institute for Statistics (UIS), Ms Beatriz
Valdez-Melgar (UIS), Dr Khalida Shatat from the Jordan Ministry of Education and Mr Joel Peetersoo from the Estonian Ministry of Educa-
tion and Research. These inputs are greatly acknowledged.
2
See WSIS Geneva Plan of Action, § 11 at: http://www.itu.int/wsis/docs/geneva/official/poa.html#c4.
3
MDG Target 2 is to “achieve universal primary education.” For more information on the target and its indicators, see:
http://mdgs.un.org/unsd/mdg/Host.aspx?Content=Indicators/OfficialList.htm.
4
The movement was launched at the World Conference on Education for All in 1990 by UNESCO, UNDP, UNFPA, UNICEF and the World
Bank and signed by delegates from 155 countries, as well as representatives from some 150 governmental and non-governmental organi-
zations. For more information, see: http://www.unesco.org/en/efa/the-efa-movement/efa-goals/.
5
For an overview of the UNESCO Education for All Goals, see:
http://portal.unesco.org/education/en/ev.php-URL_ID=50558&URL_DO=DO_TOPIC&URL_SECTION=201.html.
6
The latest MDG regional assessment (progress chart) highlights that a number of regions are not on track for achieving target 2 of the
MDGs, see: http://mdgs.un.org/unsd/mdg/Resources/Static/Products/Progress2009/MDG_Report_2009_Progress_Chart_En.pdf.
7
The content of this box was contributed by Mr Joel Peetersoo, Analyst for Research and Development, Estonian Ministry of Education and
Research. For more information on the “Tiger Leap,” see: http://www.tiigrihype.ee/.
8
EENet. Akadeemilise andmeside areng Eestis, at: http://www.eenet.ee/EENet/40.html.
9
Jõesaar, A. & Muuli, K. (2005). Ilves kavandab Eestile tiigrihüpet uude sajandisse, at: http://www.eenet.ee/EENet/18.html.
10
Mattson, T. (1997). Tiiger ampsab tuleval aastal vaid 35,5 miljonit, at:
http://www.postimees.ee/leht/96/09/24/kuum.htm and RISO (Estonia State Information System).
11
Aastaraamat (1996). Infotehnoloogia rakendamisest ja infosüsteemide arengust valitsusasutustes, at:
http://www.riso.ee/et/pub/1996it/p3.html.
12
International Association for the Evaluation of Educational Achievements (IEA), PIRLS 2006, at: http://www.iea.nl/pirls20060.html.
13
International Association for the Evaluation of Educational Achievements (IEA), TIMSS 2007, at: http://www.iea.nl/timss2007.html.
14
International Association for the Evaluation of Educational Achievements (IEA) (1999). SITES M1, at:
http://www.iea.nl/sites-m1.html?&no_cache=1&sword_list[]=m1.
15
International Association for the Evaluation of Educational Achievements (IEA), 2002, SITES M2, at:
http://www.iea.nl/sites-m2.html?&no_cache=1&sword_list[]=m2.
16
International Association for the Evaluation of Educational Achievements (IEA), 2006,.SITES M3, at:
http://www.iea.nl/sites20060.html?&no_cache=1&sword_list[]=m1.
17
The wording for category items in the 2000 and 2006 questionnaire modules differs. The item for weekly frequency in the 2000 question-
naire reads: “A few times each week” whereas the 2006 questionnaire item reads: “Once or twice a week.”
18
ISCED refers to the International Standard Classification of Education and is used to define the levels and fields of education. ISCED levels
1, 2, and 3 refer to primary, lower secondary and (upper) secondary education. For more information, see [UNESCO 1997].
19
Data are based on the UIS Pilot Questionnaire on Statistics of ICT in Education (which is limited to a group of 25 economies, including the
Palestinian Autonomous Territories (Palestinian Authority)), as well as on the ITU Survey on the WSIS Targets.
20
Teachers trained to teach basic computer skills (or computing) refer to teachers considered qualified according to national standards
or norms to teach basic computer skills (or computing) courses. All teachers trained specifically in ICTs under pre-service or in-service
schemes according to nationally defined qualification standards are counted as qualified. At higher ISCED levels, in particular, teachers
trained to teach computing should have a nationally required academic credential in an ICT-related field of study, such as computer sci-
ence.
21
The content of this box was contributed by Dr Khalida Shatat, Director of Studies and Technology Projects, Jordan Ministry of Education.
22
http://www.icdlegypt.gov.eg/FactsAndFigures.aspx.
23
http://www.icdlegypt.gov.eg/Inside.aspx.
24
UNESCO Bangkok (2006). Malaysia — ICT in Education: Regional and Country Overviews. UNESCO, at:
http://www.unescobkk.org/education/ict/themes/policy/regional-country-overviews/malaysia/.
149](https://image.slidesharecdn.com/ictdevolpmentreport2010-100618112450-phpapp01/85/ICT-Devolpment-Report-2010-187-320.jpg)

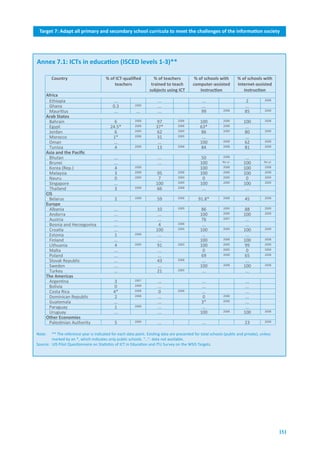


![Target.8:.Ensure.that.all.of.the.world’s.population.have.access.to.television.and.radio.services
or TV set is also essential to make use of the service. Furthermore, in the case of television, some form of electric
current is also needed (e.g. minimally equivalent to the power of a car battery). Figure 8.1 illustrates the relationship
between coverage, electricity and television set availability in the case of South Africa.
The third methodological concern relates to the unit of access. The target refers to population. While it can be useful
to measure the percentage of the population who can listen to or view broadcasting, in practice this kind of data is
not widely available across countries. While some broadcasting markets measure audience shares in terms of the
number of people listening to or watching a service, this does not capture the total potential market.
A more common and almost universally available measure is the percentage of households that have a broadcast de-
vice. This information is typically asked for in censuses and household surveys. It has been a useful measure of access,
since broadcasting is often a shared experience among family or friends. Furthermore, the existence of a broadcast-
ing receiver in a household suggests that different family members have access. Having said that, the personalization
of ICTs is resulting in more individual possession and usage of media devices. It is common in developed nations and
high-income developing-country households to find more than one broadcasting receiver. What is now different is
that individuals increasingly possess their own devices, such as mobile phones or laptop computers, which are also
capable of receiving terrestrial broadcasting signals or streamed broadcasts over the Internet (Box 8.1).
Box.8.1:.Broadcasting.and.the.Internet
Broadcast-like services are continually evolving on the Internet. Some are extensions of traditional broadcasting, such as con-
ventional radio or television stations with websites that feature streaming of audio or video programmes (i.e. webcasting).
Others are unique to the Internet, such as Internet-only broadcast stations.
There are thousands of Internet radio stations. In 2008, some 33 million people in the United States listened to Internet radio
stations at least once a week [Arbitron, 2008]. Many stations offer podcasts, providing users an opportunity to listen to the
broadcast at a different time. Internet-only radio stations have been affected by copyright and licensing disputes with record
labels, which have had an impact on their growth.6
A growing number of television broadcasters provide back episodes of popular programmes on their websites. Some broad-
casters’ websites also offer live programming, particularly for sporting events. Hulu, a US-based joint venture of several broad-
casting companies, offers thousands of videos.7
There is also a lot of unique audio and video on the Internet that does not fit into the traditional broadcasting realm. One of
the most popular is YouTube, which started as a peer video upload site but now also has mainstream broadcasters such as
BBC posting content.8
While the Internet initially took ideas from broadcasting and applied them to the Internet, the reverse is now increasingly
true. Some broadcasters flash their website across their programmes indicating where users can go for past episodes or more
information about the programme. Multichannel TV operators have picked up on peer video such as YouTube by allowing
subscribers to upload self-produced videos, which can be downloaded from on-demand channels.
The popularity of the Internet for watching video is growing. In Germany, for example Internet users watched 6.4 billion videos
on the Internet in August 2009 alone.9 The leading site was YouTube, with 2.7 billion videos viewed. Half of the top ten sites
were those of traditional broadcasters, including local TV companies SAT1 and RTL.
Traditional and new media synergies have expanded another step with the emergence of Internet-ready televisions. In ad-
dition to traditional TV, these new hybrids can also search the Internet for the viewer, and display Internet content such as
YouTube videos.10 Users that do not have Internet-ready televisions can access films and videos from rental sites over the
Internet using streaming devices.
So far, no Internet-only site has established a reputation for originally created news and information through their own
network of correspondents around the world and professional studios. Traditional broadcasters are desperately trying to
strengthen their web presence or strike collaborative deals with Internet sites in order to pre-empt this from happening. Inex-
pensive digital cameras and camera phones would make it easy to get content from collaborators around the world, but thus
far Internet-only broadcasters lack the credibility that traditional media outlets enjoy.
155](https://image.slidesharecdn.com/ictdevolpmentreport2010-100618112450-phpapp01/85/ICT-Devolpment-Report-2010-193-320.jpg)

![Target.8:.Ensure.that.all.of.the.world’s.population.have.access.to.television.and.radio.services
only analogue terrestrial channels through a satellite master antenna television (SMATV) system. In a few cases, the
number of subscriptions may be underreported by operators in order to avoid regulatory fees or payments due to
content providers, or because they are not licensed to provide service.
The three indicators identified to monitor access to TV and radio services are listed in Table 8.1. The first two are part
of the Core List of Indicators adopted by the Partnership on Measuring ICT for Development [Partnership, 2010]. At
the international level, the data collection is under the responsibility of ITU.
Status.of.Target.8
This section analyses the current level of radio and television coverage and household penetration around the globe.
It also examines the worldwide status of multichannel television (terrestrial digital, cable, satellite and IPTV) and the
emergence of mobile TV, which is not included in the list of indicators to monitor Target 8 but could be considered a
useful indicator in the future. Given that TV penetration is very high in developed countries, the primary focus is on
developing countries.
In respect of access to broadcast signals, Target 8 has largely been achieved. Although recent data are not available,
terrestrial analogueue radio and TV coverage figures already stood at 95 and 89 per cent, respectively, in 2002.
If satellites are taken into account, then practically the whole world is covered by broadcasting. For example, the
WorldSpace system covers most of the world (except North America and Australia) with radio service through three
geostationary satellites. The beam of its AfriStar satellite, launched in 1998, covers all of Africa and has 59 channels.
There are numerous DTH satellite systems in operation around the world, offering both radio and TV channels.
Regarding the proportion of households with a radio, the majority of developed countries have stopped compiling
this statistic, since penetration levels are very high (usually close to 100 per cent) and there is more interest in newer
ICTs, particularly the Internet.
In the developing world, recent data on the proportion of households with a radio (Chart 8.1) show that, in the major-
ity of countries, more than 75 per cent of households have a radio. Only few countries with available data, including
Cameroon, India and Mongolia, have less than half of their households equipped with a radio.
In some developing countries, the proportion of households with a radio is actually decreasing. This may partly be
explained by methodological issues. While, according to the ITU definition, a radio is “a device capable of receiving
broadcast radio signals….It includes a radio set integrated in a car or an alarm clock and digital audio player (MP3
player), but excludes radios integrated with a mobile phone or in a computer” [Partnership, 2010] , some countries
still collect data only on standalone radio devices.
The decline in radios for some countries may also suggest that, if the conditions are right in terms of affordability,
coverage, content and electricity, then households may prefer TV viewing over radio listening. Radio service has
often been cited as the most important medium for low-income developing nations, given that it does not require
electricity and radio sets are relatively inexpensive. Yet television seems to be more popular when available. Data for
the Philippines, for example, show that TV is the main medium for acquiring knowledge and information even though
household radio penetration was higher.11
The difficulty with radio statistics is illustrated by Bangladesh, a least developed country (LDC). As opposed to what
may be expected, there are more households with a television in Bangladesh (30 per cent) than with radio (23 per
cent) [NIPORT, 2009].12 Adding to the confusion is the fact that more households have a mobile phone (32 per cent)
than either a TV or a radio.13 According to a study, less than a third of radios worked and only around a fifth of the
population listened to the radio, compared to over 60 per cent who watched television. The study notes that this may
be explained by a “rapid increase in the opportunity to watch TV in the country and the failure of the public radio to
attract people.” [Golam Nabi Jewel, 2006]
Despite the difficulties with radio statistics, radio continues to play an important role in many LDCs, particularly in
rural areas where electricity is limited (see Box 8.2 and Chart 8.4).
157](https://image.slidesharecdn.com/ictdevolpmentreport2010-100618112450-phpapp01/85/ICT-Devolpment-Report-2010-195-320.jpg)
![WTDR.2010:.Monitoring.the.WSIS.targets
Chart.8.1:.Proportion.of.households.with.a.radio,.2007-08
%
100
90
80
70
60
50
40
30
20
10
0
Ukraine
Ecuador
Ghana
Nigeria
Namibia
Bahrain*
Swaziland*
Egypt
Costa Rica
Sri Lanka
Panama
El Salvador
South Africa
Malaysia
Honduras
Nicaragua*
Peru
Venezuela
Paraguay
Bolivia
Mexico
Brazil
Uruguay
Mongolia*
Pakistan*
India*
United Arab Emirates
Zimbabwe*
Indonesia
Cameroon
Sierra Leone
Jordan
Thailand
Montenegro
Dominican Rep.
Bosnia and Herz.
Philippines
Note: *Data refer to 2006. Data in this chart are presented for all countries where data were available, except for LDCs since they are
featured in Chart 8.4.
Source: ITU World Telecommunication/ICT Indicators database and OSILAC, ECLAC.
Box.8.2:.Community.radio
Radio remains the prevalent broadcasting device in many least developed countries (LDCs). A transistor radio does not require
electricity and is cheaper than a television. There are initiatives to reduce the operating cost of a radio to near zero through
devices that do not require batteries. According to Freeplay, manufacturer of a wind-up radio, people in LDCs spend on aver-
age six per cent of their income on batteries (USD 24/year).14 Freeplay has distributed over 400 000 batteryless radios to some
40 developing countries since 2003, directly benefiting more than six million people.
While radio devices have become more affordable for the developing world, users need something to listen to, particularly
since conventional radio stations may not reach rural and remote areas. In some countries, community radio has been able to
fill the void. Community radio is typically programmed and operated by local people, broadcasting informative content that
is relevant to those that live in the area.
Advocates of community radio point to a measurable impact on the local population in terms of improving lives through the
provision of important information such as agricultural advice, as well as the power to effect positive behaviour change. For
example, the Population Media Centre has community radio operations in 15 countries in Africa, Asia and the Pacific and
Latin America, and reaches people through soap-opera type programmes on topics such as gender, HIV and family planning.
It found that the radio programmes positively influenced behaviour and were a more appropriate and cost-effective solution
than other media. [CIMA, 2007]
While some governments have a lenient attitude towards community radio, others have been more restrictive, either forbid-
ding it or imposing restrictive licensing conditions that include high spectrum charges for the use of radio frequencies or limit
the coverage area of broadcasts.15
158](https://image.slidesharecdn.com/ictdevolpmentreport2010-100618112450-phpapp01/85/ICT-Devolpment-Report-2010-196-320.jpg)
![WTDR.2010:.Monitoring.the.WSIS.targets
While many countries in the world have a higher proportion of households with a TV than with a radio, the contrary
is true for most African countries and LDCs.
A comparison of the majority of the world’s 50 least developed countries (LDCs) shows that radio is much more
prevalent than TV. In addition, there are important differences in penetration rates among countries. They range
from three per cent of households with a TV in Chad, to 86 per cent in the Maldives. The differences are smaller in
terms of the proportion of households with a radio, which range from 21 per cent in Myanmar, to almost 90 per
cent in Samoa, for countries where data are available (Chart 8.4). The LDC average shows that about one in three
households has a TV, compared to two out of three households with a radio. Also, only ten per cent of LDCs have a
Chart.8.4:.Proportion.of.LDC.households.with.a.radio.and.a.TV,.2007-08.or.latest.available.year
%
100
Households with a radio
90
Households with a TV
80
70
60
50
40
30
20
10
0
Afghanistan
Angola
Bangladesh
Benin
Bhutan
Burkina Faso
Cambodia
Chad
Congo D.R.
Djibouti
Ethiopia
Guinea
Haiti
Kiribati
Lao P.D.R.
Lesotho
Liberia
Madagascar
Malawi
Maldives
Mali
Mauritania
Mozambique
Myanmar
Nepal
Niger
Rwanda
S. Tomé & Principe
Samoa
Senegal
Tanzania
Timor-Leste
Tuvalu
Uganda
Yemen
Zambia
LDC average
Note: For LDCs that are not featured in this chart, no data are available.
Source: ITU World Telecommunication/ICT Indicators database and DHS.
Box.8.3:.TV.in..tv.(Tuvalu)
Tuvalu’s some 10 000 inhabitants live on nine islands in the south Pacific with a total land area of around 25 km2, making it one of
the smallest countries in the world. The nation’s Internet country code top-level domain (ccTLD) is the catchy “.tv”. Tuvalu struck
a deal with Internet entrepreneurs to sell the domain name in 1999 in return for the payment of USD one million every three
months.17 The idea was that television companies would be interested in having the domain. By January 2009, some 100 000 IP
addresses had been assigned to the .tv domain name, including the music channel MTV and Liverpool Football Club.18
Ironically, there is no terrestrial television service in Tuvalu. Nevertheless, around half of households have a television [Tuvalu
Government, 2006]. Some use satellite dishes to watch overseas networks.19 It appears that many Tuvaluans are also using
their television set to watch pre-recorded material and play games. There were just as many households with a DVD player as
a TV, and 14 per cent had a PlayStation.
160](https://image.slidesharecdn.com/ictdevolpmentreport2010-100618112450-phpapp01/85/ICT-Devolpment-Report-2010-198-320.jpg)
![Target.8:.Ensure.that.all.of.the.world’s.population.have.access.to.television.and.radio.services
household television penetration higher than 50 per cent, as against half of LDCs with a household radio penetration
higher than 50 per cent.
Although radio penetration is higher in LDCs, the inconsistency of the data makes it difficult to draw definite conclu-
sions. In Laos, as household TV penetration goes up, radio — or at least possession of simple battery-powered radios
— goes down:
“Household ownership increased from 31% to 41% for televisions... At the same time, ownership of radios ...
went down. This should not be viewed as a sign of impoverishment. Rather, with higher income, households
substitute radios with televisions...” [Schoenweger, 2006].
In Tuvalu, half of the households have a TV even
though there is no terrestrial television (see
Chart.8.5:.Proportion.of.LDC.households.with.a.TV.com- Box 8.3).
pared.to.GDP.per.capita.(USD),.2008.(or.latest.available.
year) Although LDCs are the world’s poorest nations,
it may be surprising that income alone does not
significantly explain the lack of access to broad-
% casting, and seems to have less impact than other
100
factors such as the availability of electricity and
diversity of content. Statistically, there is less of a
80
Households with a TV
relationship between household television own-
R 2= 0.50
60 ership and income in the LDCs than there is with
electricity (Charts 8.5 and 8.6). The importance of
40 electricity and its close relationship to TV is con-
firmed by numerous studies: TV is typically the
20 second major reason (after lighting) that house-
holds opt for electricity.20
0
0 1 000 2 000 3 000 4 000 5 000 6 000
Differences in household TV penetration at simi-
GDP per capita (USD)
lar income levels reflect the uncertainty regard-
ing the impact of income levels. Among the LDCs,
Source: ITU World Telecommunication/ICT Indicators database and IMF
(GDP per capita data).
Angola is richer than the Maldives (based on
2008 GDP per capita income). Yet the Maldives
has a household TV penetration of 39 per cent,
higher than Angola, mainly due to the availabil-
ity of electricity. Household electrification is over
Chart.8.6:.Proportion.of.LDC.households.with.electricity,.com- 90 per cent in the Maldives, compared to just 38
pared.to.households.with.a.TV,.2008.(or.latest.available.year) per cent in Angola. Another example is Cambodia,
Haiti and Kiribati. They all have similar per capita
incomes, yet Cambodia’s household TV penetra-
%
100 tion is over twice that of Haiti and five times more
than Kiribati. What is interesting about this exam-
ple is that Cambodia actually has a lower house-
Households with a TV
80
R2= 0.73 hold electrification rate than Haiti or Kiribati. But
60 TV content is much more abundant in Cambodia.
The country has seven terrestrial channels plus
40
a recently launched DTH service, compared to
three terrestrial channels in Haiti and no domes-
20
tic television service in Kiribati. This vastly greater
0
amount of content has driven Cambodian house-
0 20 40 60 80 100 holds to overcome a lack of grid electricity by
Households with electricity (%) looking for other sources to power television sets,
particularly car batteries.21
Source: ITU World Telecommunication/ICT Indicators database and IMF
(GDP per capita data). It is instructive to examine the gap between
households with electricity and households with
161](https://image.slidesharecdn.com/ictdevolpmentreport2010-100618112450-phpapp01/85/ICT-Devolpment-Report-2010-199-320.jpg)
![WTDR.2010:.Monitoring.the.WSIS.targets
Chart.8.7:.Gap.between.LDC.households.with.electricity.and.households.with.television,.%,.latest.available.
year
Difference (D) in the proportion of households with electricity (a) and the proportion of households with a TV (b) [D=a-b]
Proportion of households with a TV
120
Group 1: more Group 2: households have Group 3: more households with electricity than with a TV
households with a TV similar TV and electricity
than with electricity levels
80
40
0
Niger
Angola
Madagascar
Malawi
Zambia
Mali
Liberia
Cambodia
Lesotho
Burkina Faso
Mozambique
Senegal
Chad
Congo D.R.
Tanzania
Rwanda
Uganda
Mauritania
Benin
Yemen
Cape Verde
Haiti
Guinea
Lao P.D.R.
Ethiopia
Maldives
S. Tomé & Principe
Myanmar
Djibouti
Bangladesh
Timor-Leste
Nepal
Kiribati
Samoa
Bhutan
Tuvalu
-40
Source: ITU World Telecommunication/ICT Indicators database.
television in the LDCs (Chart 8.7). Many of the countries with the biggest gap — i.e. having a far higher level of
household electrification penetration than household TV penetration — are in the Pacific, where there are few or no
domestic terrestrial television stations (Group 3). Although households have the electricity to power television sets,
there is not enough compelling content to encourage them to own a TV. At the other extreme are countries where
household television penetration exceeds electricity (Group 1). It seems that compelling broadcast content is avail-
able to drive households to find other ways to power television sets. One such example is Cambodia, as mentioned
earlier. A third group are those countries where television availability in households is close to electricity availability
(Group 2). Here, the constraint seems to be both electrical and monetary. Household TV penetration rises with elec-
tricity availability, but either there is not enough compelling content, or incomes are too low to drive the demand
for off-grid electricity or to raise television ownership above electricity availability. These insights about different
barriers to TV uptake can help policy-makers identify barriers to higher TV penetration levels and thus make the right
policy decisions.
In conclusion, it would be erroneous to assume that the broadcasting digital divide is attributable solely to income.
Though income is indeed a barrier, particularly for the poorest of households (including in middle-income nations),
data suggest that electricity is an even bigger barrier and that content, though difficult to quantify, also seems to play
a major role. Steps to rectify the digital broadcasting divide must consider all these factors if they are to be successful.
162](https://image.slidesharecdn.com/ictdevolpmentreport2010-100618112450-phpapp01/85/ICT-Devolpment-Report-2010-200-320.jpg)
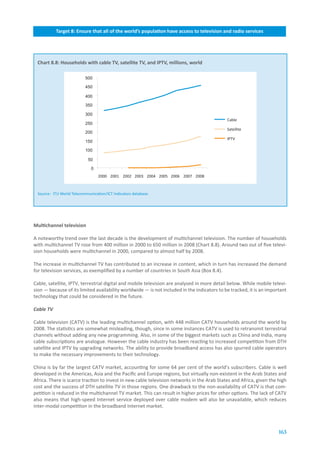
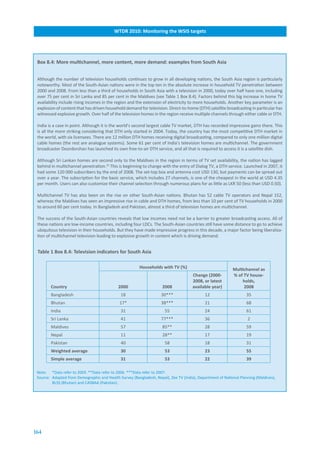
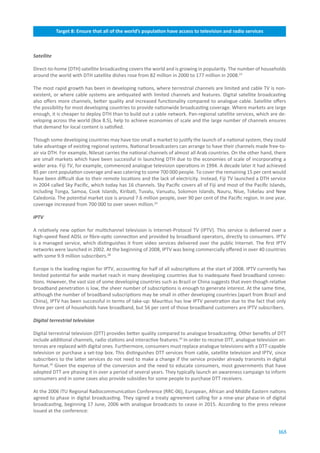

![Target.8:.Ensure.that.all.of.the.world’s.population.have.access.to.television.and.radio.services
nounced that the switchover would be completed in three to five years.33 Although India adopted the DVB-T standard
back in 1999, DTT is operational only in a few urban areas and no date has been announced for switchover. Instead,
efforts seem to be focused on providing digital TV through DTH satellite.
In North America, the United States completed its DTT conversion on 12 June, 2009 when analogue terrestrial broad-
casts ceased. In Canada, this is scheduled to happen on 31 August, 2011. In Latin America and the Caribbean, many
countries are still in the process of selecting a DTT standard or have only recently done so. Brazil has launched DTT,
with the end of analogue broadcasts scheduled for 2016.34
Mobile.TV
The ability to transmit live radio and television programmes to mobile handsets could eventually help to increase ac-
cess to broadcasting. A growing number of mobile handsets have the capability to create and display video images.
The video can be created from a camera built into the handset, downloaded from digital cameras or the Internet, or
streamed over mobile networks. Mobile broadcasting goes a step further, by sending live programming to the mobile
handset.
Mobile handsets with radio reception chips to receive domestic analogue broadcasts have been available for some
time. A more recent phenomenon is the delivery of digital TV to mobile handsets equipped with a reception chip.
Japan, the Republic of Korea and the United States are the trendsetters in deploying this technology.
The Republic of Korea became the first country in the world to offer mobile TV in 2005. The service is delivered via
either terrestrial or satellite digital broadcasts, using Digital Mobile Broadcasting technology (T-DMB and S-DMB)35,
to mobile handsets with a reception chip. The number of mobile TV users in the Republic of Korea stood at 17 million
at the end of 2008, of whom almost two million were receiving satellite broadcasts. Many other developed countries
have followed suit. In Japan, the mobile TV service was launched in April 2006. The service is known as “1-seg” be-
cause it uses one of the thirteen segments that make up the Japanese digital broadcasting standard channel — Inte-
grated Services Digital Broadcasting-Terrestrial (ISDB-T).
Mobile TV was launched in the United States in 2006, with some operators partnering with MobiTV, which provides
broadcast signals either over the existing cellular network (thus expanding the number of handsets that can be used,
since a reception chip is not required) or to handsets with reception chips. MediaFLO is another mobile TV service
that uses spectrum freed up by the digital conversion in the United States. It provides the service to mobile opera-
tors, who in turn market it to their customers. There were an estimated 11 million mobile TV viewers in the United
States in 2008. [Nielsen, 2009]
In Europe, a number of countries have launched mobile TV using Digital Video Broadcast-Handheld (DVB-H) tech-
nology, which provides broadcasts of live digital terrestrial television channels. Countries that have launched com-
mercial mobile TV services include Albania, Austria, Finland, France, Hungary, Italy, the Netherlands and Switzerland.
Several developing countries have launched mobile TV services (see Table 8.2) and a number are conducting trials
(e.g. Ghana, Indonesia, Libya, Malaysia, Peru, South Africa, Uruguay). Ironically, some countries have launched digital
mobile TV before making terrestrial digital television available.
A key consideration for the mass take-up of mobile services in developing countries will be cost. The price of a TV-
capable mobile handset will inevitably be higher than that of an entry-level handset on account of the need to sup-
port video and, typically, for a TV signal reception chip. The decision will likely be based on the price of alternatives
(e.g. a digital television set or computer) and the desirability of mobility. Service pricing will also be a fundamental
factor. In some countries, mobile-delivered television is free, while in others there are service plans. Options such as
advertiser-sponsored programming or tiered pricing (making some channels free while charging for others) might be
alternatives.
Since only a limited number of countries have started launching mobile TV services by 2010 (with even fewer moni-
toring subscriber numbers), no indicator has been proposed. However, the number of mobile TV subscriptions or the
proportion of mobile TV subscriptions as a percentage of total mobile cellular subscriptions could be useful indicators
in the future.
167](https://image.slidesharecdn.com/ictdevolpmentreport2010-100618112450-phpapp01/85/ICT-Devolpment-Report-2010-205-320.jpg)
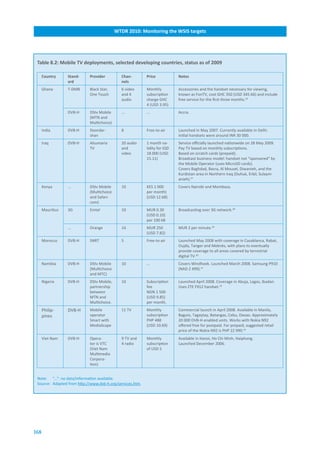
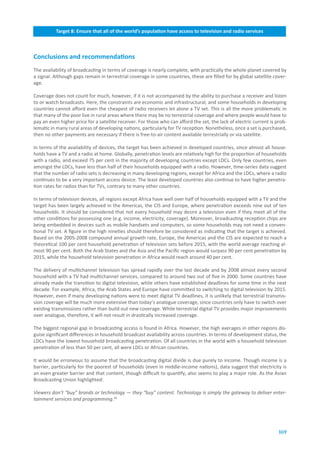


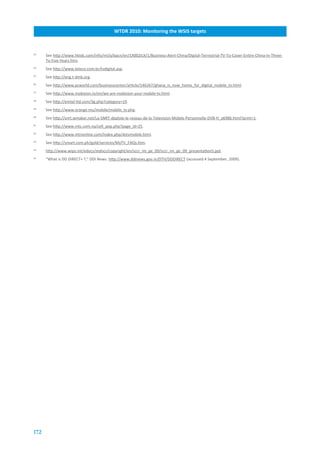


![Target.3:.Connect.scientific.and.research.centres.with.ICTs
Target.9:.Encourage.the.development.of.content
Target.9:.Encourage.the.development.of.
content.and.put.in.place.technical.condi-
tions.in.order.to.facilitate.the.presence.and.
use.of.all.world.languages.on.the.Internet1
Introduction
Internet access is the physical precondition for being able to use the Internet and enjoy its benefits. With the rapid
growth in the number of Internet users, reaching an estimated 26 per cent of the world’s population by the end of
2009 [ITU, 2010], the amount of content2 on the Internet has also been increasing, boosted by broadband Internet
applications and the emergence of Web 2.03 and social networks. There are no agreed figures for the number of
webpages,4 but the best testimony to the incredible size of the web is the fact that search engines have now ceased
indexing a significant portion of it.
Internet access is only part of the story, however. The true essence of the Internet is that it fosters communication
between humans (and with networked objects), and allows them to obtain and exchange meaningful information.
This raises the question of the relationship between content and users. It is imperative that all users worldwide
should be able to find Internet content which is meaningful to them. Hence, this content has to be available in their
mother tongue, which in turn means that content in local languages is required.
This is the issue of linguistic diversity in cyberspace addressed by WSIS Target 9. The aim is to achieve the greatest
possible diversity in order to serve the online needs of people everywhere. This is a relevant and indeed pressing is-
sue for establishing a global information society, since it is directly linked to the basic principle of equality of rights in
society, and indirectly to the ecology of cyberspace.
UNESCO, which conducted the process that culminated in the Convention on the Protection and Promotion of the
Diversity of Cultural Expressions [UNESCO, 2005], is coordinating WSIS Action Line C8, which identifies many priorities
to be considered for achieving the target, including the following:5
175](https://image.slidesharecdn.com/ictdevolpmentreport2010-100618112450-phpapp01/85/ICT-Devolpment-Report-2010-213-320.jpg)
![WTDR.2010:.Monitoring.the.WSIS.targets
• Develop and implement policies that preserve, affirm, respect and promote diversity of cultural expression and
indigenous knowledge and traditions through the creation of varied information content.
• Support local content development, translation and adaptation, digital archives, and diverse forms of digital
and traditional media by local authorities.
• Provide content that is relevant to the cultures and languages of individuals in the information society.
• Nurture the local capacity for the creation and distribution of software in local languages, as well as content
that is relevant to different segments of population.
• Cooperate with indigenous peoples and traditional communities to enable them to more effectively use and
benefit from the use of their traditional knowledge in the information society.
• Promote technologies and research in such areas as translation, iconographies, voice-assisted services and the
development of necessary hardware and a variety of software models, including proprietary, open-source soft-
ware and free software, such as standard character sets, language codes, electronic dictionaries, terminology
and thesauri, multilingual search engines, machine-translation tools, internationalized domain names, content
referencing as well as general and application software.
Some of the recommendations in Action Line C8 are directly aimed at indigenous populations, who are generally not
well represented on the Internet and deserve special attention. Most of the action line refers directly to ways of fos-
tering or encouraging the development of content (or the translation of existing content), and some provisions also
address the crucial issue of software. Other WSIS targets, such as Target 4 (Connect public libraries, cultural centres,
museums, post offices and archives with ICTs) also have a direct link to Target 9 in promoting linguistic diversity and
local content online.
Target 9 and the corresponding action lines are set in an extremely fast-changing context, with rapid growth of
Internet users and content. As a result of the concept of users evolving to include objects,6 the current Internet Pro-
tocol addressing scheme has been stretched to its limits, and IPv67 has been implemented (besides other protocol
improvements) in order to change the order of magnitude of the possible number of different networked entities,8
which will allow this exponential growth to continue for many years to come.
The persistence of the so-called “digital divide” [ITU, 2010] is also, at least partly, related to the issue of languages
and content on the Internet, in particular with regard to online equality [Pimienta, 2009). Equality is often interpreted
in terms of physical access, focusing on the gap between those who have access to the technology and those who
have not. Policies have been set accordingly to increase access, for example by putting in place shared resources (e.g.
telecentre projects and community access points — see also Targets 1 and 4), more affordable technologies (e.g. low-
cost PCs) or more pervasive technologies (e.g. cell phones).
However, in order to reduce the digital divide, barriers beyond mere access also need to be addressed to give all
users the potential to benefit from information and communication. Users need the skills to use the technology and
exploit the benefits it offers.9 The issue of content availability in the user’s language is fundamental: without content,
access itself becomes useless. There is no simple technological or practical answer for content production in cyber-
space, an activity which mirrors the complexity inherent in the economic behaviour of individuals.10 While ICT4D11
specialists tend to agree that local content production12 is desirable, the question of how to provide incentives to
achieve it in practice remains unresolved, for now.
One reason for the relatively low policy priority given to this issue is the lack of indicators on languages on the Inter-
net. To date, the digital divide has often been measured in terms of access rather than use and content, even though
the divides for the latter two are likely to be greater than the access divide.
For example, while Africa accounted for two per cent of total Internet users in 2007 (and 11 per cent of the world’s
population), its share of content production, in both national and local languages, was even lower. Furthermore, only
0.6 per cent of total worldwide content in English or French was in African servers (as estimated by FUNREDES/Union
Latine).13 The Language Observatory Project (LOP)14 estimated that the percentage of webpages accounted for by lo-
cal African languages (or at least the small subset of them which are localized)15 ranged from 0.06 per cent to 0.006
176](https://image.slidesharecdn.com/ictdevolpmentreport2010-100618112450-phpapp01/85/ICT-Devolpment-Report-2010-214-320.jpg)
![Target.3:.Connect.scientific.and.research.centres.with.ICTs
Target.9:.Encourage.the.development.of.content
per cent of total Internet content. Even though in some cases these rates may have increased somewhat since then,
they are likely to have remained very low. In the case of local languages, the proportion may even be smaller, given
the speed of growth of Internet content in the main languages present on the Internet.
Some people consider English as a lingua franca16 in the digital world, thus minimizing the importance of the issue of
linguistic diversity and the availability of local content. However, while English is a major language for business or sci-
ence and the official language of many countries in Asia and Africa, it has been estimated that less than 15 per cent of
the world’s population understand it.17 Furthermore, in many countries where English is the official language, a large
proportion of the population does not actually use it (the same holds true for the use of French in many francophone
African countries or in Haiti, for example). If meaningful access to the digital world is considered a prerequisite for
becoming an active citizen of the information society, then the issues of access and content in local languages or
mother tongue are central to democracy in the information society.
Evidence from UNESCO studies18 suggests that not being educated in one’s mother tongue is a serious handicap. If
the Internet, which has become an important indirect source of information and knowledge and a practical compo-
nent in education systems, is meant to be for everyone, then it must speak everyone’s language, again highlighting
the importance of this target.
The top barriers to ICT uptake, or reasons cited for not having the Internet at home, are a lack of perceived need; cost
(of equipment and/or service); and a lack of skills [European Commission, 2009]. The results from a recent survey by
the US Federal Communications Commission (FCC) also highlight that, in order to further increase connectivity, it is
necessary to teach people who are not yet connected how to navigate the web and find online information that is
valuable to them, so that they learn to appreciate the benefits offered by connectivity [Horrigan, 2010] (see Box 9.1).
Given that a lot of content on the Internet, and “Internet-related vocabulary,” is in English (or at least this might be
the perception),19 countries with higher levels of English language scores could be expected to have higher Internet
adoption. There is indeed a positive correlation between the percentage of households with the Internet and the
number of Internet users, on the one hand, and proficiency in English, on the other, as proxied by TOEFL20 scores.21
This shows that being able to understand and use English terms could be a factor in Internet uptake and highlights
the importance of increasing the number of languages on the Internet.
Target 9 deals with two separate but related issues: first, the ability to use a given language on the Internet, and sec-
ond, the provision of appropriate content. The first can be addressed with technical solutions, whereas the second
requires a comprehensive set of conditions, many of which are not purely technical. It is one thing to ensure that the
technical conditions for a language to be used on the Internet (localization) are in place,22 but another for this lan-
guage to gain all the attributes of major languages on the Internet (full representation). See Box 9.2 for more details.
Box.9.1:.Understanding.digital.concepts
In addition to a lack of information about the benefits that can be obtained from using the Internet and a lack of digital literacy
skills, the level of English language skills and the availability of local content could also be related factors in Internet usage levels,
especially as English is sometimes considered as the lingua franca of the Internet. Using the recent US FCC survey results, [Horrigan,
2010] finds that even in the United States where English is the first language, broadband users exhibit varying degrees of under-
standing of digital concepts, which, in turn, influences what they do online. For example, survey respondents received a series of
questions asking them how well they understood various terms related to computers and the Internet. The following shares of
broadband users said they understood the listed terms very well: refresh or reload — 61 per cent, operating system — 44 per cent;
Internet browser cookie — 42 per cent; JPEG file — 41 per cent; spyware or malware — 40 per cent; and widget — 16 per cent.
The study found that those with greater understanding of these terms were more intensive users of the Internet. Some 29 per cent
of broadband users said they did not understand any of the listed terms very well, while 24 per cent understood five or six of the
terms very well. The former group was found to be doing only about half of the online activities that the better informed group did.
These findings suggest that skills, including language skills, play a role in how the Internet is being used.
177](https://image.slidesharecdn.com/ictdevolpmentreport2010-100618112450-phpapp01/85/ICT-Devolpment-Report-2010-215-320.jpg)
![WTDR.2010:.Monitoring.the.WSIS.targets
Box.9.2:.Requirements.for.the.presence.of.languages.on.the.Internet
There are many requirements for full representation of a language in cyberspace. A codification scheme for the alphabet and
an appropriate keyboard layout are necessary but not sufficient conditions. Indeed, there is a set of conditions which, com-
bined with an appropriate policy framework, will eventually permit the existence of content commensurate in just proportion
with a language’s population of speakers. These are [Diki Kidiri, 2007]:
• a written form for the language (languages which are only oral do not receive the full range of benefits of digital processing);23
• a comprehensive codification for the alphabet and fonts (for reading and writing of documents);
• basic linguistic software for the language (word processor, e-mail management, messaging, browsing);
• a supported keyboard with the alphabet of the language;
• advanced linguistic software (for spellchecking, syntax checking, alternative choices for sequence of letters, online dictionar-
ies, etc.);
• accessibility resources in the language for users with disabilities (such as software for the blind);
• human resources trained to perform the (above) activities of creation and implementation;
• an informed and motivated user community driving content production (this in turn drives indirect requirements for educa-
tion packages in the language for digital literacy, information literacy and content production);
• comprehensive content responding to the needs of the user community;
• content duly indexed by existing search engines (or alternative search engines specialized in the language);
• articulation with other languages (in particular, translation software from/to a set of other languages);
• sufficient funding from governments or international organizations to support the process leading to the fulfilment of all
these conditions.
The task of achieving this target is complex and can only be fully accomplished with the involvement of all stakehold-
ers. Indeed, a sufficient number of users have to be more than just content consumers, and also take responsibility
for content production, generating culturally meaningful content and useful services (for example for online com-
merce and tourism). User involvement would ideally occur as a bottom-up process, but for many languages the criti-
cal mass is not present and other key elements may be lacking, such as the existence of qualified leaders who pull the
process and/or the existence of a government sensitive to the importance of the issue and willing to put in place the
appropriate policies and incentives, in consultation with all relevant stakeholders.
Measuring.Target.9.—.Proposed.indicators
Internationally comparable and recent data on languages and content on the Internet are not widely available. In-
dicators on access to ICTs are more readily available than indicators on the use of ICTs, ICT skills or digital and in-
formation literacy.24 This dearth of indicators may also have contributed to a relative lack of policy attention given
to supporting linguistic diversity on the Internet. Measurement of languages on the Internet is also complicated by
technical difficulties, which are likely to worsen over time as the Internet continues to expand in size.
To measure this target, initial focus could be placed on collecting two basic indicators:
1. Proportion of Internet users by language
2. Proportion of webpages by language (Box 9.3)
These indicators could also be collected for different Internet “subspaces” such as the blogosphere, social networks
and newsgroups. Ideally, a breakdown by user characteristics (country, region, gender, age, family of languages)
would also be available, and compiled at regular intervals so as to follow the rapidly evolving trends in cyberspace.
178](https://image.slidesharecdn.com/ictdevolpmentreport2010-100618112450-phpapp01/85/ICT-Devolpment-Report-2010-216-320.jpg)
![Target.3:.Connect.scientific.and.research.centres.with.ICTs
Target.9:.Encourage.the.development.of.content
Box.9.3:.Measuring.the.number.of.webpages.by.language
The basic method for measuring the percentage of webpages in a given language involves crawling the space to be measured
and applying identification and counting techniques. Basically, if the language has a specific script for encoding, the pages are
counted from that parameter. If the same script is shared by many languages (like for instance the Latin script), a language-
recognition algorithm is required to identify the different languages sharing the same script.
The major inconvenience of this method is the time required to crawl. Today, this factor even makes the method prohibitive
as the size of the space to be crawled expands indefinitely. Alternative techniques are required to apply the crawling method
in a smaller space while remaining statistically representative. Some methods use a small randomly obtained sample of the
web, but the result is statistically questionable.
LOP focuses on minority languages in top-level domains only (even removing countries with too large a webspace like China).
Results, even if they are not fully representative, have shown a very low penetration of local languages on the web for Asian
and African languages. It has been demonstrated [Nandasara et al, 2008] [Suzuki et al, 2002], that the local language percent-
ages follow “Zipf’s Law” — the n-th ranked language speaker is one n-th of the population of the top-ranked language. This
suggests that the number of webpages written in each language follows a progressive power-law curve where the order of
magnitude of presence of local languages continues to decrease; the authors refer to this as the “digital language divide.”
Finally, other methods have applied the power of search engines to a set of words which are carefully selected to hold the best
semantic and syntactic equivalence across languages. This is the approach that has been followed by FUNREDES/Union Latine,
which was able to offer consistent measurements, with more complex indicators, between 1998 and 2007, albeit only for a
subset of languages. The continuing expansion of the size of the web is showing the limits of all of these methods, however,
and further discussion is required to identify ways to produce reliable figures.
For more details see [Paolillo, et al. 2005] and [Pimienta, 2008].
However, a number of additional indicators would be required as well in order to measure linguistic diversity in
cyberspace fully. These indicators should, ideally, reflect the behaviour of end users with regard to languages in cy-
berspace. This includes considerations such as: users’ mother tongue and second languages spoken, language set for
software interfaces, percentage of e-mails read or written by language, percentage of visited webpages by language.
Indirect indicators could also be complied, for example, by looking at the online availability of e-government informa-
tion and applications in different languages, and to what extent related applications are available for minorities or
immigrants in their mother tongue.
Status.of.Target.9
Unfortunately, the field of linguistic diversity indicators is still in its infancy and data are scant. Before looking at the
languages that can be found on the Internet, it is useful to get an overall picture of languages in today’s world. The
most recent indicative figures on living languages in the world are given in Table 9.1, and the regional distribution in
Chart 9.1. A country-level comparison of the number of Internet users and the number of living languages suggests
that there is a correlation between Internet penetration rates and language diversity, many countries (for example,
in Africa) with low Internet penetration having high language diversity, and vice versa.
Overall, the following facts can be reported about the state of languages in the world as at 2009: 25
• 1 per cent of languages are spoken by at least 10 million people
• 1 per cent of languages are spoken by 94 per cent of world population
• 96 per cent of languages are spoken by 4 per cent of world population
• More than 50 per cent of languages are spoken by less than 10 000 people
179](https://image.slidesharecdn.com/ictdevolpmentreport2010-100618112450-phpapp01/85/ICT-Devolpment-Report-2010-217-320.jpg)
![WTDR.2010:.Monitoring.the.WSIS.targets
Table.9.1:.Distribution.of.languages.by.number.of.first-language.speakers,.2009
Population.range Living.languages Speakers
Number % Number %
100 million to 1 billion 8 0.1 2 308 548 848 38.7
10 million to 100 million 77 1.1 2 346 900 757 39.4
1 million to 10 million 304 4.4 951 916 458 16.0
100 000 to 1 million 895 13.0 283 116 716 4.8
10 000 to 100 000 1 824 26.4 60 780 797 1.0
1 000 to 10 000 2 014 29.2 7 773 810 0.1
100 to 1 000 1 038 15.0 461 250 0.01
10 to 100 339 4.9 12 560 0.0
1 to 10 133 1.9 521 0.0
Unknown 277 4.0
TOTAL 6.909 100 5.959.511.717 100
Source: [Lewis, 2009].
Chart.9.1:.Regional.distribution.of.languages,.2009
Percentage of languages* Percentage of speakers**
Pacific 0.1
Pacific 18.1 Africa 12.2
Europe 26.1 Americas 0.8
Africa 30.5
Europe 3.4
Asia 60.8
Asia 33.6 Americas 14.4
Note: * Living languages that originate in the specified area. ** People who use languages that originate in the specified area as their first
language regardless of where in the world they may live.
Source: [Lewis, 2009].
• 70 per cent of languages are spoken in only 20 (developing) countries
• Less than one third of languages have a written form.26
There is no straightforward way of mapping these languages onto their online existence as there are very few data
and indicators on the state of languages online.
Indeed, indicators of linguistic diversity in cyberspace are very limited. A visual representation of the relative number
of languages represented in various ways in the virtual world, compared to the number of living languages in the real
world, is given in Figure 9.1.
180](https://image.slidesharecdn.com/ictdevolpmentreport2010-100618112450-phpapp01/85/ICT-Devolpment-Report-2010-218-320.jpg)
![Target.3:.Connect.scientific.and.research.centres.with.ICTs
Target.9:.Encourage.the.development.of.content
Figure.9.1:.Key.figures.for.languages.on.the.Internet,.2010
Number of
languages
41 recognized
by Google
271
(number of languages
with Wikipedia entries)
500
(estimated number of localized languages)
7 000
(number of languages still in use in the world)
Note: There is no agreement among demo-linguists27 on the size of the language universe, but the figures usually range between 6 000
and 9 000. Differences are explained by the difficulty of defining the distinction between a dialect and a language. The number of
localized languages is an estimate.
Source: Ethnologue, SIL International (Summer Institute of Linguistics), Wikipedia and Google.
Technically, measuring the online presence of languages is complicated. Unicode 28 does not encode languages
but scripts, a script being a collection of characters, some of which could be shared by different languages. In
many cases, a single script may be used to write tens or even hundreds of languages (e.g. the Latin script). In
other cases, only one language employs a particular script (e.g. Hangul, which is used only for the Korean lan-
guage).29 The approximate figure of 500 localized languages represents, therefore, the set of languages whose
character sets are covered by the set of 140 scripts which have been encoded so far, 90 of them related to writ-
ten languages.
One of the striking developments since the conclusion of WSIS is the growth of user-driven content and the emer-
gence of social networking sites. Although it is not possible to ascertain from available data whether the sites were
accessed in local languages, the Asia and the Pacific region registered the largest number of unique visitors between
June 2007 and June 2008 (Table 9.2). The Middle East and Africa showed the strongest growth in the numbers of
unique visitors (66 per cent), followed by Europe (35 per cent) and Latin America (33 per cent), though the Middle
East and Africa and Latin America are growing from much lower numbers. According to Facebook’s Timeline [Face-
book, 2010a], the number of active users grew from one million people in December 2004 to 400 million in Febru-
ary 2010. Of the active users, 100 million access Facebook through mobile devices [Facebook, 2010b]. Facebook is
growing strongly in the Asia and Pacific region and at the start of 2010, for example, there were 17 million users in
Indonesia with a monthly growth rate of 13 per cent. Other high growth rates were observed for India and Thailand
(both 12 per cent) and Malaysia (10 per cent) [Facebook, 2010c].
Given the significance of user-driven content, it is also important to look at the linguistic representation of social
networking sites, for example. Thus, as of early 2010, 52 languages were available for translation in Google translate,
and the Internet browsers Internet Explorer and Mozilla supported 63 and 70 languages, respectively. Furthermore,
many “international” websites, such as Amazon, eBay, Google and Facebook, now propose localized versions, often
also in local languages. Thus, Facebook was available in 67 languages, Blogger in 50, Youtube in 19, Flickr in 8, Twitter
in 6, and Linkedin in 4 languages.
181](https://image.slidesharecdn.com/ictdevolpmentreport2010-100618112450-phpapp01/85/ICT-Devolpment-Report-2010-219-320.jpg)
![WTDR.2010:.Monitoring.the.WSIS.targets
Table.9.2:.Growth.of.social.networking.sites,.by.region,.June.2007-June.2008,..
Total worldwide audience, age 15+, home and work locations
Unique.visitors.(thousands)
June.2007 June.2008 Percentage.change
Worldwide 464 437 580 510 25%
Asia and the Pacific 162 738 200 555 23%
Europe 122 527 165 256 35%
North America 120 848 131 255 9%
Latin America 40 098 53 248 33%
Middle East and Africa 18 226 30 197 66%
Source: comScore World Metrix [ComScore, 2008).
Microsoft also plans to translate Windows 7 and Office 2010 into a further 59 local languages by June 2011, in addi-
tion to the 101 languages (including Azeri, Georgian, Macedonian, Uzbek, Bosnian, Punjabi and Kyrgyz) into which its
most popular software packages have already been translated.30
As the field of linguistic diversity indicators is still
in its infancy, the only indicator which has been
Chart.9.2:.Top.ten.languages.on.the.Internet,.2009 available thus far (and without any reliable de-
gree of precision) is the distribution of Internet
users by language. This was offered, with a trans-
English 464 parent methodology, by Globalstat, until 2005,31
Chinese 321 and subsequently by Internetworldstats, although
Spanish 131
limited only to the figures for the top ten languag-
Japanese 94
es in terms of users (Chart 9.2), and without much
French 74
information on the methodology and sources.32
Portuguese 73
Some of these figures are available over time.
German 65
Between 1996 and 2007, the percentage of Eng-
Arabic 41
lish-speaking Internet users33 has dropped from
Russian 38
80 per cent to around 30 per cent,34 reflecting the
Korean 37
fact that non-English speakers are increasingly
All the rest 258 getting online.
0 100 200 300 400 500
Internet users (millions) As for the number of webpages per language, the
published data have shown huge discrepancies
Source: Internet World Stats, www.internetworldstats.com/stats7.html. since the first studies published back in 1996 (see
[Pimienta et al, 2010] for more details).
The most promising effort has been made by LOP,
which has been able to produce unique figures for minority languages in top-level domains of Africa and Asia. Howev-
er, the rapidly increasing size of the web makes it more and more difficult to crawl entire top-level domains. The most
consistent publisher of data, and the only one with the capacity to produce indicators by subcategories, has been
FUNREDES/Union Latine. However, its scope is limited to Latin languages, German and English, and, unfortunately,
as its methodology is based on search engines, since 2007 it is no longer in a position to produce reliable figures.
Indeed, in recent years the indexes of search engines have stopped reflecting a substantial proportion of the online
universe and the results are beginning to show obvious biases and errors in their search occurrence counting figures.
Therefore, just as Internet stakeholders are starting to acknowledge the importance of the production of reliable in-
dicators for linguistic diversity in order to set policies and measure their impact, the task of producing such indicators
182](https://image.slidesharecdn.com/ictdevolpmentreport2010-100618112450-phpapp01/85/ICT-Devolpment-Report-2010-220-320.jpg)


![Target.3:.Connect.scientific.and.research.centres.with.ICTs
Target.9:.Encourage.the.development.of.content
Notes
1
Substantial contributions to this chapter were made by Daniel Pimienta from FUNREDES, with inputs from Daniel Prado (Union Latine),
Jean-François C. Morfin (Intlnet), Viola Krebs (ICVolunteers), and Deirdre Williams (St Lucia). ITU is also very grateful for the ccTDL data
provided by Matthew Zook from ZookNIC.
2
On the Internet, content is any information (webpages, messages, software...) that is available for retrieval by the user, in any format
(e.g. text, image, audio, video).
3
The term Web 2.0 refers to what is perceived as a second-generation of the web, characterized by dynamic, shareable and user-generat-
ed content, such as in social networks.
4
It is worth noting that the size of the “invisible web” — the part of the web containing dynamic pages which are not indexable (such as
data bases) — is estimated as being 500 times larger than the visible web [Bergman, 2001].
5
See WSIS Geneva Plan of Action, 2003, at: http://www.itu.int/wsis/docs/geneva/official/poa.html#c8, §23.
6
The term “Internet of objects,” or “Internet of things,” alludes to the idea that many devices (such as household coffee machines or
refrigerators) will eventually be accessible via the Internet through innovative applications. See
http://www.itu.int/wsis/tunis/newsroom/stats/The-Internet-of-Things-2005.pdf for more details.
7
Internet Protocol version 6 (IPv6) is the next-generation Internet layer protocol for packet-switched networks and the Internet.
8
IPv4 addresses use 32 bit/s, while IPv6 uses 128 bit/s, allowing 2128 (about 3.4×1038) addresses.
9
See the eleven barriers to use of ICT for human development, presented in a spiral form in [Pimienta, 2009].
10
It is not straightforward to describe individual decisions to produce and browse or not in a particular language. Nonetheless, incentives
could be put in place to stimulate the production of local content, and/or content in local languages.
11
Information and Communication Technologies for Development (ICT4D) refers to the application of ICTs for development in general and
poverty reduction in particular.
12
Local content production does not imply that the locally produced content is only consulted locally. As a matter of fact, empirical data
lead to the observation that locally produced content in a globalized world tends to be consulted globally. The existence of diasporas and
of people interested in research and study of local cultures from abroad are only two of the reasons to explain that phenomenon.
13
All references from FUNREDES/Union Latine can be consulted in the FUNREDES/Union Latine Observatory of Linguistic and Cultural Diver-
sity at: http://funredes.org/lc.
14
The Language Observatory Project (http://www.language-observatory.org/) is a consortium of universities initiated and coordinated by
the University of Technology of Nagaoka, Japan. For more information, see http://gii2.nagaokaut.ac.jp/gii/.
15
“Localizing content” refers to the process of translation into the local language and adaptation of the content to the local culture. “Local-
izing language” is meant in this chapter as the process of allowing a language to be usable in the digital environment, and it refers then
basically to a technical process of codification of the corresponding character set.
16
A lingua franca is a language systematically used to communicate between persons not sharing a mother tongue.
17
While figures for speakers of a given language (especially a second language) vary considerably and up-to-date figures are hard to find,
the low rate of change allows the use of less recent figures. In 1996, David Graddol, writing for the British Council, estimated ”speakers
of English” to be 750 million (source “The Future of English” — http://www.britishcouncil.org/learning-elt-future.pdf), which, compared
with the 5.7 billon world population for 1996, gives a percentage of 10 per cent. Ethnologue, citing sources from 1999, gives a figure
of a little more than 508 million English speakers (341 million first language) which, compared with the 6 billon of world population for
1999, gives a percentage of less than 8.5 per cent. [Malherbe, 1999] offered the figure of 600 million, which set against the 1999 world
population gives a percentage of a little more than 10 per cent. Union Latine (cited in [Pimienta, 2009]) gave a figure of 670 million in
2008, which also means a proportion of just over 10 per cent. Other sources may give higher figures (for example [Prado, 2010] provides
estimates of 824 million or 729 million for 2009 depending on the assumptions made), which is why it is necessary to leave a margin by
stating less than 15 per cent. In a similar context, [Graddol, 2006], using data from the World Tourism Organization, states that three-
quarters of tourism situations involve non-English speakers in non-English-speaking countries.
18
Children who are not educated in their mother tongue have lower grades as well as a higher rate of failure to go on to the next level (see
http://www.unesco.org/en/languages-in-education/).
19
Practical, or technical, computer language also does not exist in all languages. For example, words such as copy, paste, file, mouse, drive,
operating system, network, burning a CD, download, broadband, Instant Messenger, etc. are often taken from English. This might consti-
tute a barrier to people who do not speak English or do not feel at ease using English terminology.
20
Test Of English as a Foreign Language. See http://www.ets.org. This is an imperfect proxy, because TOEFL exams tend to be taken by
those who plan to live, work or study abroad. Therefore, it tends to be a relatively small proportion of individuals in a country who take
TOEFL exams. Furthermore, this proportion may vary widely across countries, and is likely to reflect other factors such as the resources
allocated to English teaching. Nonetheless, in spite of these limitations, TOEFL test scores currently constitute the only widely available
measure of English proficiency where English is not the mother tongue.
21
[OECD, 2006] and [van Welsum and Xu, 2007] use TOEFL scores as a proxy for English language skills, and [Lee, 2009] uses TOEFL scores
to proxy the effect of English proficiency on economic growth.
189](https://image.slidesharecdn.com/ictdevolpmentreport2010-100618112450-phpapp01/85/ICT-Devolpment-Report-2010-227-320.jpg)
![WTDR.2010:.Monitoring.the.WSIS.targets
22
In Asia and Africa, IDRC supports the localization of local languages through initiatives which gather many partners from various coun-
tries, in a collaborative manner. The Asian group is also strongly involved in the process of the development of IDNs. Both groups organ-
ize regional meetings which contribute to the necessary awareness-raising among stakeholders.
23
However, broadband evolution and the combined management of audio and video may eventually open the door for some type of digital
processing for oral languages, while the Internet is becoming less and less text centred.
24
Digital literacy consists of equipping people with ICT concepts, methods and skills to enable them to use and exploit ICTs. The related
concept of information literacy consists of providing people with concepts and training in order to process data and transform them into
information, knowledge and decisions. It includes methods to search and evaluate information, elements of information culture and its
ethical aspects, as well as methodological and ethical aspects for communication in the digital world.
25
Based on data from [Crystal, 2006], Ethnologue and UNESCO.
26
Some sources state than only one tenth of languages have a written form.
27
People with linguistic skills researching on the demographic elements of languages.
28
UNICODE (http://unicode.org), one of the pillars of the progress made in multilingualism, is a non-profit association formed as a consor-
tium which sets standards for encoding character sets and scripts.
29
See http://unicode.org/standard/supported.html and http://unicode.org/iso15924/iso15924-num.html for more complete explanations
and for the set of supported scripts.
30
Balancing Act Africa, Issue No. 481, 20 November 2009 (http://www.balancingact-africa.com/).
31
Thanks to the “Wayback engine” of archive.org, it is possible to see a snapshot of one of the latest products:
http://web.archive.org/web/20041019013615/www.global-reach.biz/globstats/index.php3.
32
http://www.internetworldstats.com/stats7.htm.
33
These figures refer to both first and second language English speakers.
34
The last figure for 2009, given by InternetWorldStats, is 27.6 per cent of English-speaking users on the Internet (source
http://www.internetworldstats.com/stats7.htm).
35
Limited to English, French, Portuguese and Spanish.
36
See http://funredes.org/lc for more details.
37
Top-level domains (TLDs) are divided into two classes. Generic top-level domains (gTLDs) include for example “.com” or “.org,” while
country code top-level domains (ccTLDs) are used and reserved for countries or dependent territories expressed as two letter country
codes [OECD, 2009].
38
This is an imperfect proxy, as it does not take generic top-level domains (gTLDs) registered in each country into account, nor the fact that
these registrations can be influenced by factors such as registration pricing policies. The relative shares of ccTLDs and gTLDs vary across
countries. Nonetheless, domain-name registrations are an indicator of interest in adopting a web presence and ultimately an indicator of
the development of the Internet [OECD, 2009].
39
See http://funredes.org/lc and the observation of Latin languages, German and English.
40
The Organisation Internationale de la Francophonie (OIF), a governmental organization bringing together 56 States, contributes to pro-
moting diversity. Its four main action lines include one for “digital technologies.” OIF was present during the WSIS process as an advocate
of linguistic and cultural diversity in cyberspace. Supporting content creation in French and in the local languages of the Member States
is an indirect part of the objective “to support and value digital expression of francophone communities.” This translates, for example,
into a programme to fund initiatives in the field (Information Highway Francophone Fund). Progress in content development in Spanish
and French, and the productivity of French content relative to other languages, suggests that policies to support the production of local
content can have measurable effects.
41
See http://www.puntcat.cat/en_index.html.
42
http://idrc.ca.
43
http://www.panl10n.net/.
44
http://www.panafril10n.org/.
45
The MAAYA network brings together more than 25 partners with a dynamic of fostering collaboration in concrete projects. UNESCO,
which is a member of the MAAYA network, is the UN body which promotes the theme of linguistic diversity, both in the real world
(protecting endangered languages) and in the virtual world (for instance in a signed agreement with ICANN) and, as mentioned in the
introduction, coordinates with ITU for WSIS Action Line C8. See http://maaya.org.
46
See for instance the plenary session chaired in Rio de Janeiro by the Brazilian Minister of Culture in
http://www.intgovforum.org/Rio_Meeting/IGF2-Diversity-13NOV07.txt.
47
See http://news.bbc.co.uk/2/hi/8333194.stm.
48
International Symposium on Multilingualism and Cyberspace, see http://maaya.org/spip.php?article105.
49
In Latin America, the project “En mi Idioma” (in my language) enables the Misak community of Colombia to design a website for lan-
guage education. Enlace Quiche, in Guatemala, trains bilingual teachers and supports the production of educational packages in Maya
190](https://image.slidesharecdn.com/ictdevolpmentreport2010-100618112450-phpapp01/85/ICT-Devolpment-Report-2010-228-320.jpg)


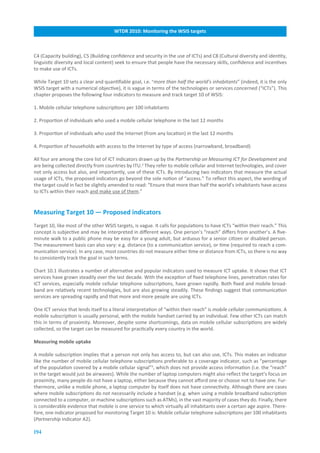


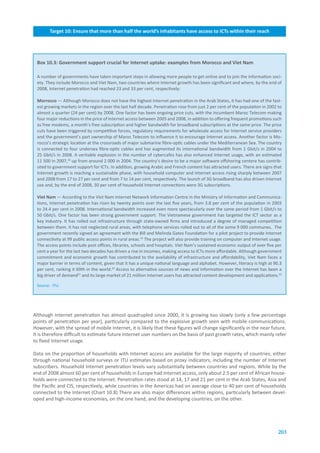
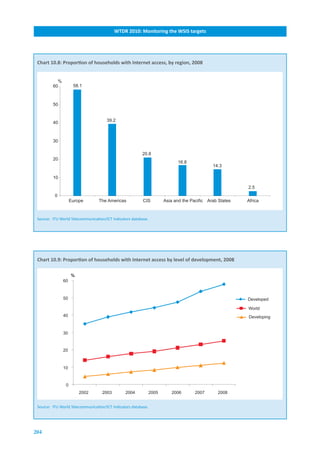


![Target.10:.Ensure.that.more.than.half.the.world’s.inhabitants.have.access.to.ICTs.within.their.reach
Target.8:.Ensure.that.all.of.the.world’s.population.have.access.to.television.and.radio.services
Notes
1
See WSIS Geneva Plan of Action , 2003, at: http://www.itu.int/wsis/docs/geneva/official/poa.html#c3.
2
The Partnership on Measuring ICT for Development is a multistakeholder partnership launched in 2004. To achieve its main objective —
namely, to increase the availability and quality of internationally comparable ICT data — it has developed a core list of ICT indicators.
For more information on the Partnership and its core list of indicators, see: http://www.itu.int/ITU-D/ict/partnership/index.html and the
introduction to this report.
3
For more information on this indicator, see Chapter 1 of this report.
4
Leahy, Joe (2010). India’s mobile sector gets a reality check, Financial Times, 2 March, 2010.
5
The issue of duplicate subscriptions (multiple SIM cards) is confirmed by a 2007 study carried out by the operator Mobistar. The study
found that in 2007 duplicate subscriptions in Belgium accounted for 14% of mobile penetration (84% instead of 98%). See: Mobistar.
Analyst Presentation: Full year results 2007. 5 February 2008.
6
The Partnership on Measuring ICT for Development recommends three months. See [Partnership, (2010)].
7
Berg Insight estimates that the number of cellular network connections worldwide used for machine-to-machine communication will
grow from 47.7 million connections in 2008 at a compound annual growth rate (CAGR) of 25.6% to 187.1 million connections in 2014. In
the coming years millions of motor vehicles, utility meters, POS-terminals, security alarms and other machines will become networked.
See: http://www.researchandmarkets.com/research/99ba52/the_global_wireles.
8
Ministère du Plan et Macro International. 2008. Enquête Démographique et de Santé, République Démocratique du Congo 2007. Calver-
ton, Maryland, U.S.A.: Ministère du Plan et Macro International.
9
See [Partnership (2010)], page 25.
10
See: http://www.comscore.com/Press_Events/Press_Releases/2009/3/UK_iPhone_Users.
11
See: htt://pwww.ushahidi.com.
12
See: http://www.pesinet.org/wp/.
13
See: http://www.safaricom.co.ke/index.php?id=745.
14
See: http://www.manobi.sn/sites/sn/.
15
See: http://www.itweb.co.za/index.php?option=com_content&view=article&id=2508:namibia-takes-the-lead-in-mobile-
television&catid=190:mobile-and-wireless-technology#prcontacts.
16
See for example the United States Federal Communications Commission’s website on broadband, at http://www.fcc.gov/broadband/ and
[OECD (2009b)].
17
See: http://www.gsmworld.com/membership/our_members.htm.
18
See: http://www.bladi.net/democratisation-d-internet-les-cybercafes-resisteront-ils.html.
19
See: http://www.gatesfoundation.org/press-releases/Pages/improving-public-internet-access-in-vietnam-090420.aspx.
20
See Human Development Report 2009, at: http://hdrstats.undp.org/en/countries/country_fact_sheets/cty_fs_VNM.html.
21
See: http://news.bbc.co.uk/2/hi/asia-pacific/6169057.stm.
22
See: http://www.reuters.com/article/pressRelease/idUS132289+28-May-2009+BW20090528.
23
For a list of the 27 countries included in the EU-27 group, see: http://europa.eu/abc/european_countries/index_en.htm .
24
For example, the European Commission finds that: “Higher mobile termination rates make it harder for fixed and small mobile opera-
tors to compete with large mobile operators. These divergences, and differing regulatory approaches, undermine the Single Market and
Europe’s competitiveness.” http://europa.eu/rapid/pressReleasesAction.do?reference=IP/09/710&format=HTML&aged=0&language=EN
&guiLanguage=nl.
25
GSMA, Global Mobile Tax Review 2006-2007. http://www.gsmworld.com/our-work/public-policy/regulatory-affairs/policy-recommenda-
tions-for-developing-countries/global_mobile_tax_review.htm.
26
See for example page 16 of the Executive Summary of [OECD(2009a)].
209](https://image.slidesharecdn.com/ictdevolpmentreport2010-100618112450-phpapp01/85/ICT-Devolpment-Report-2010-247-320.jpg)