Download to read offline

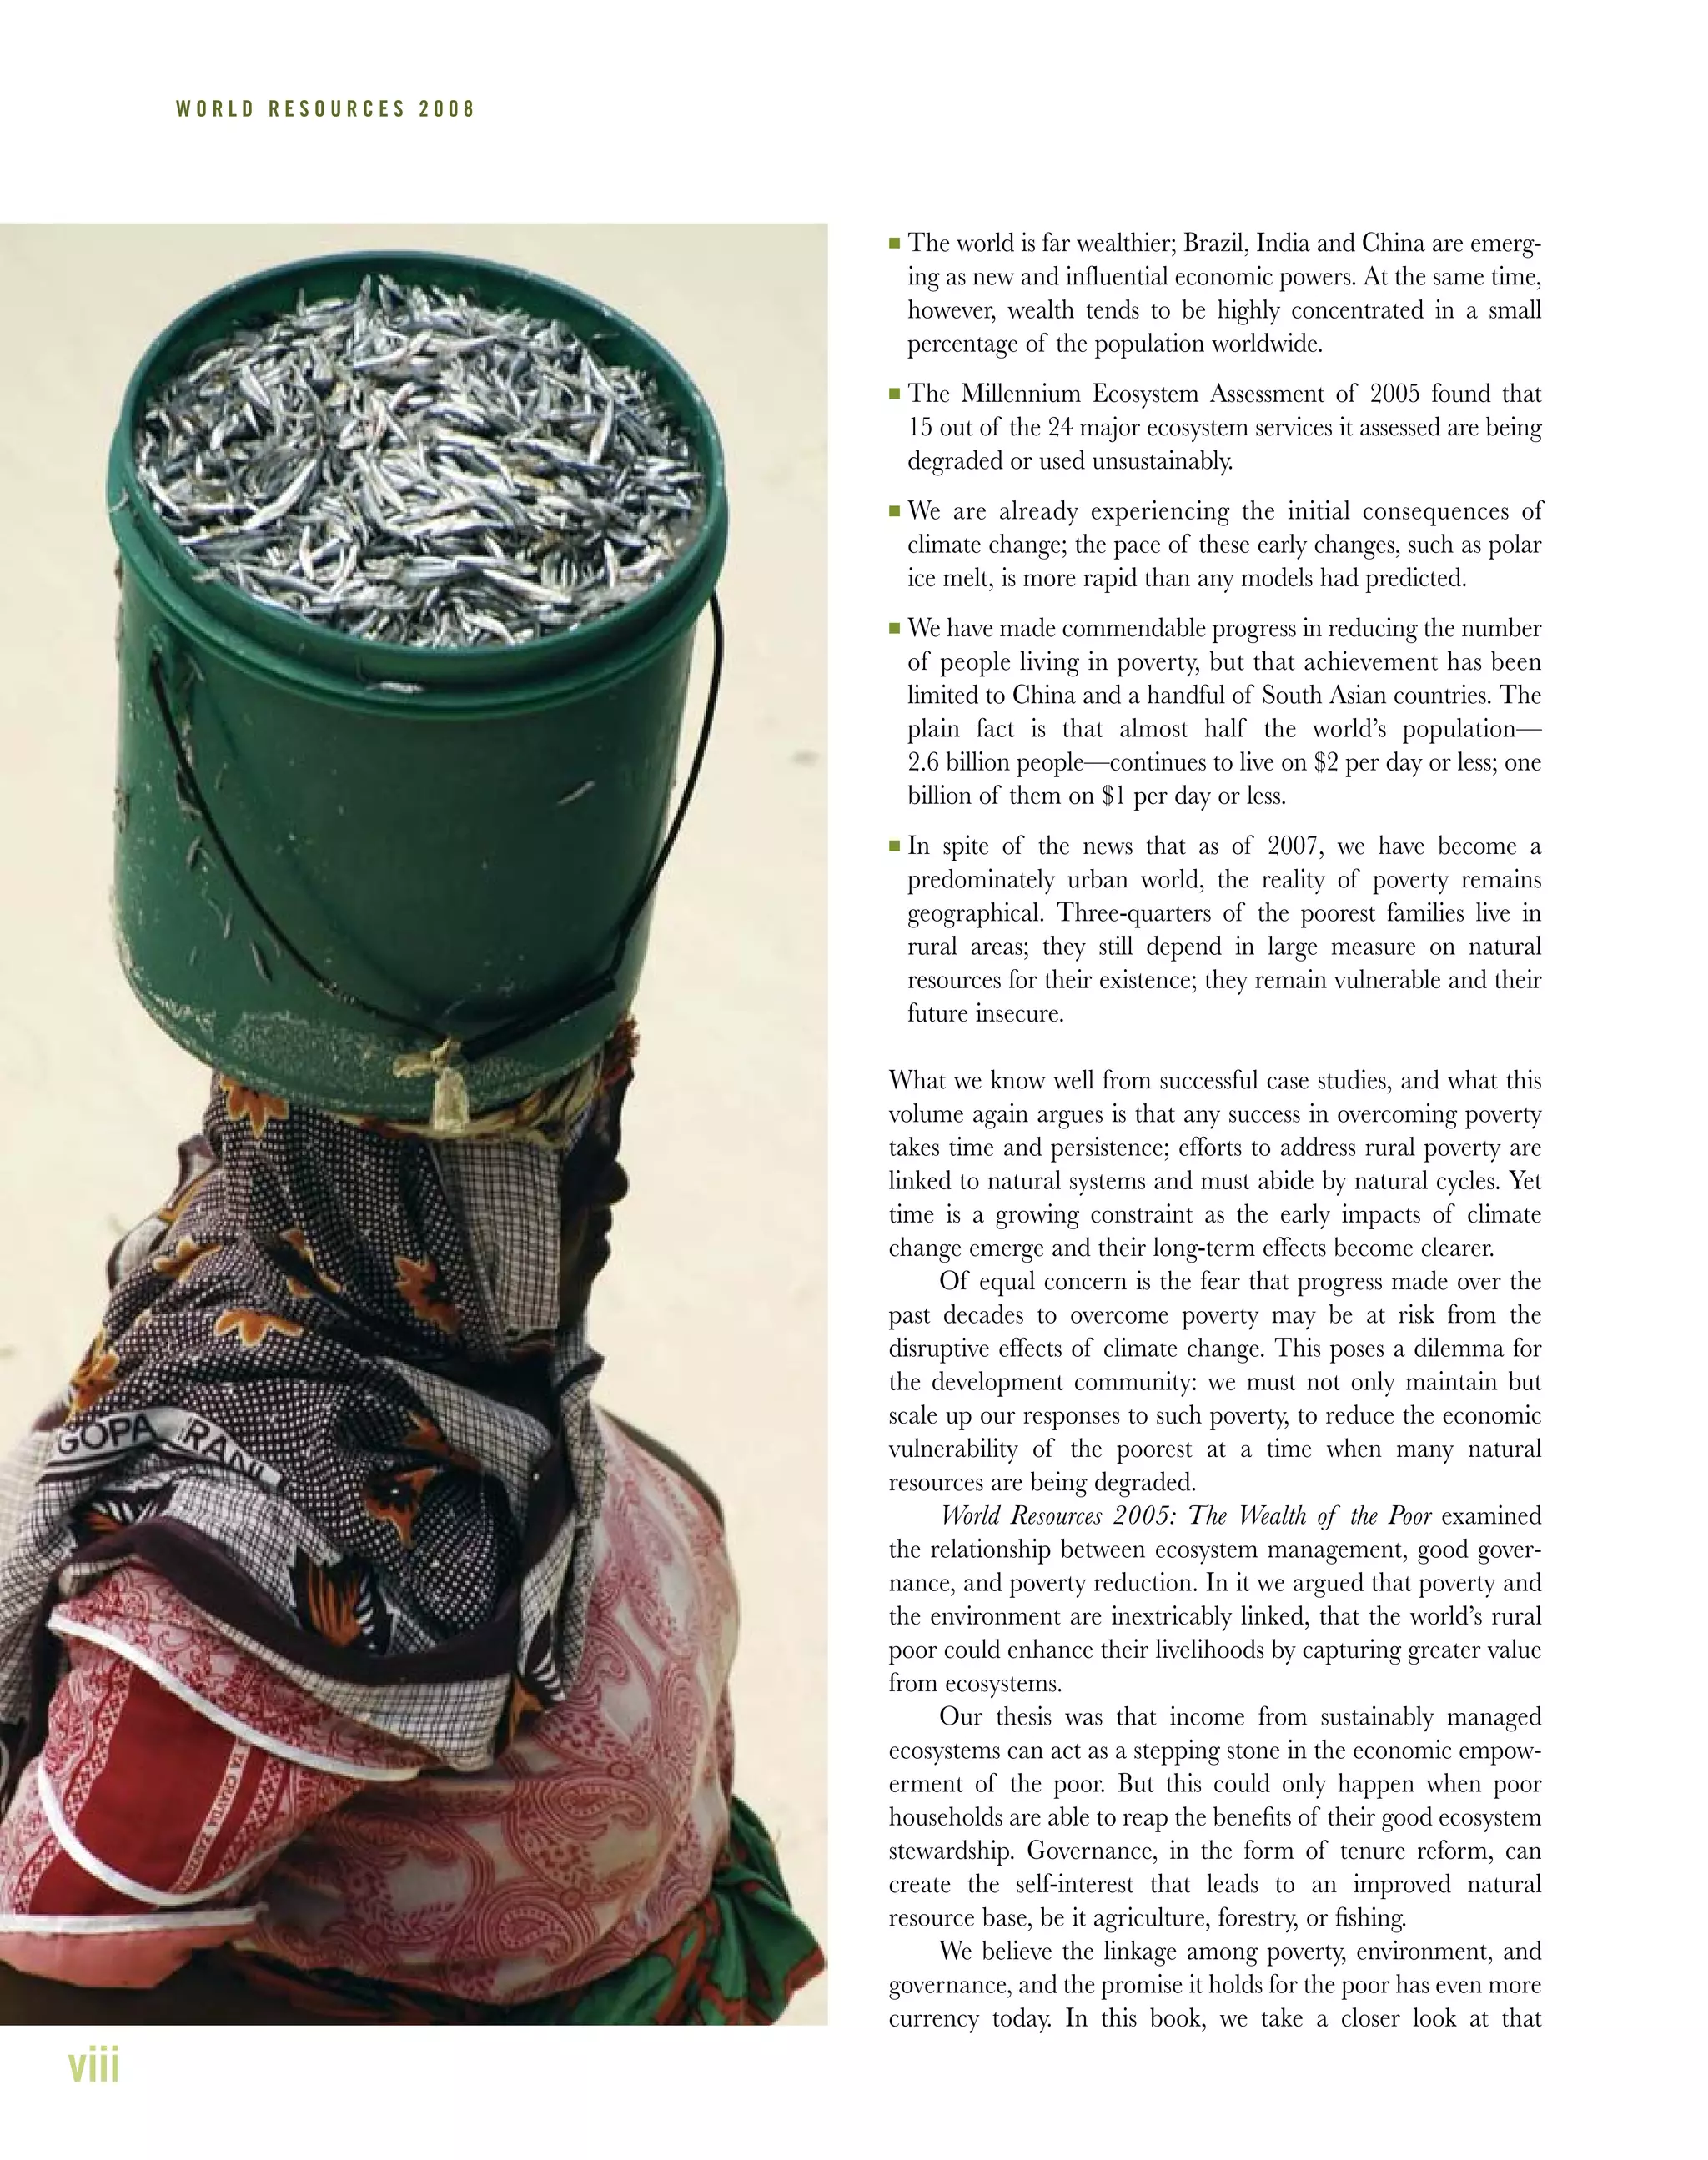
![40
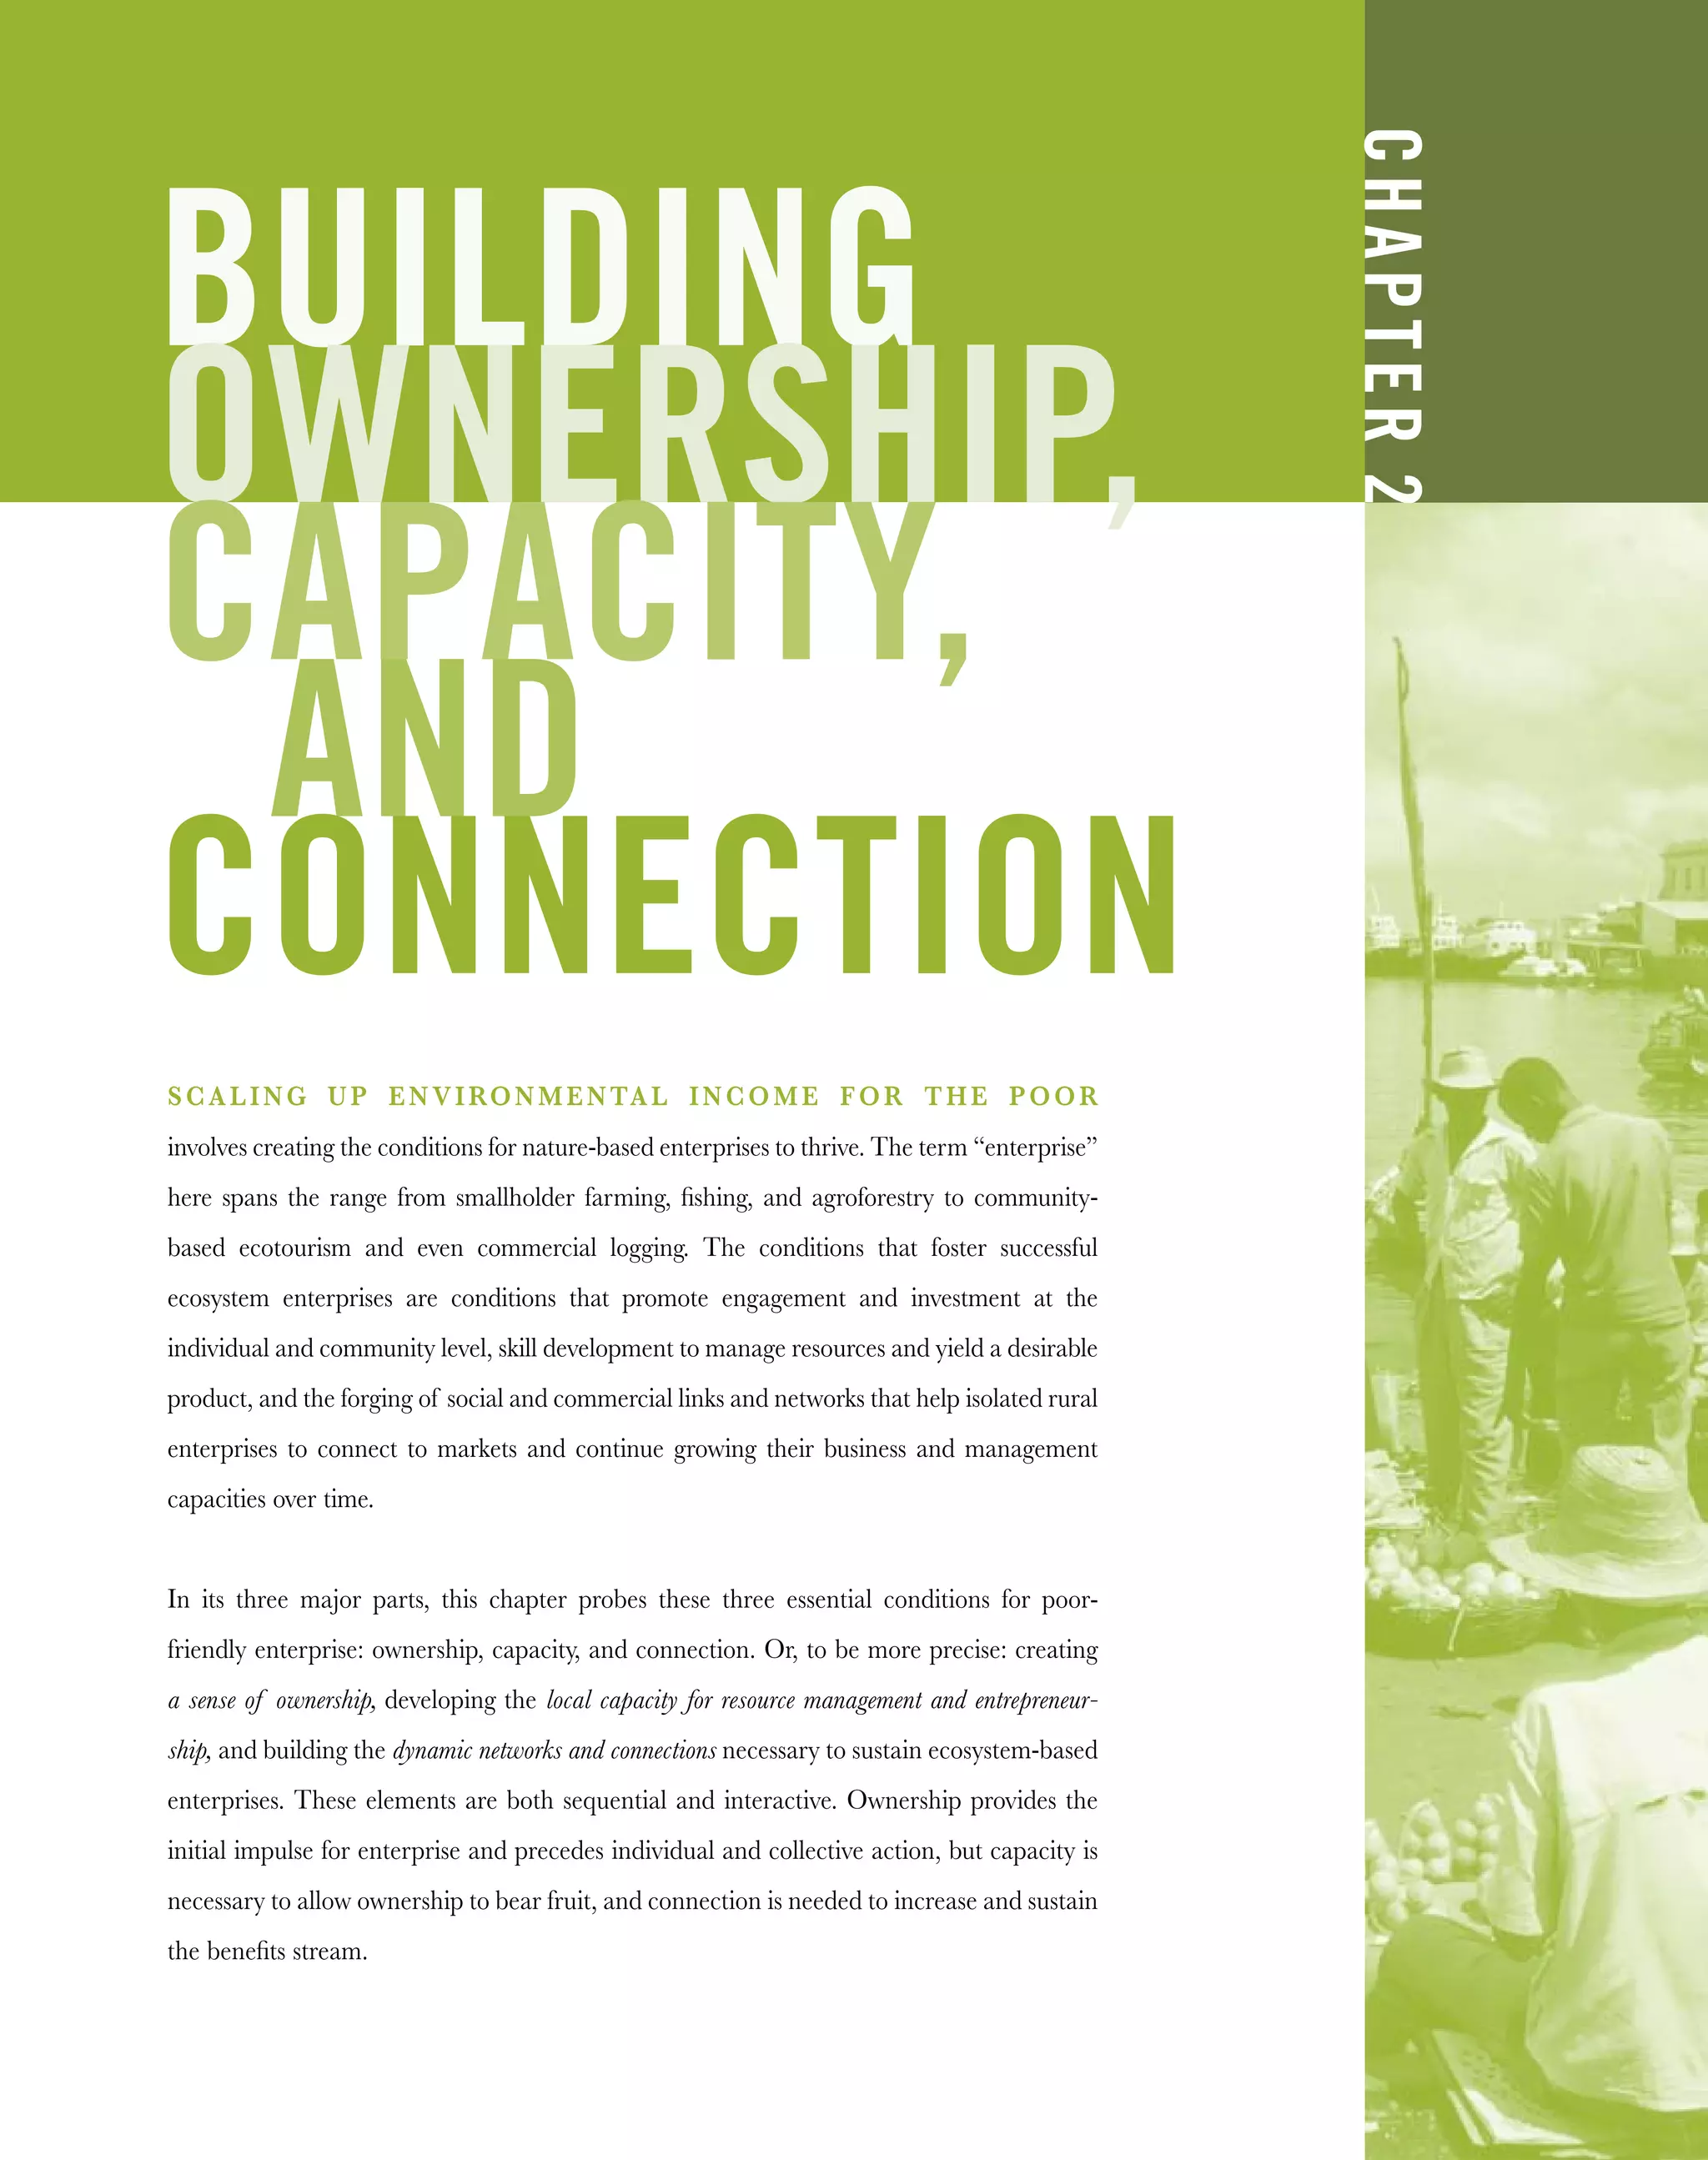
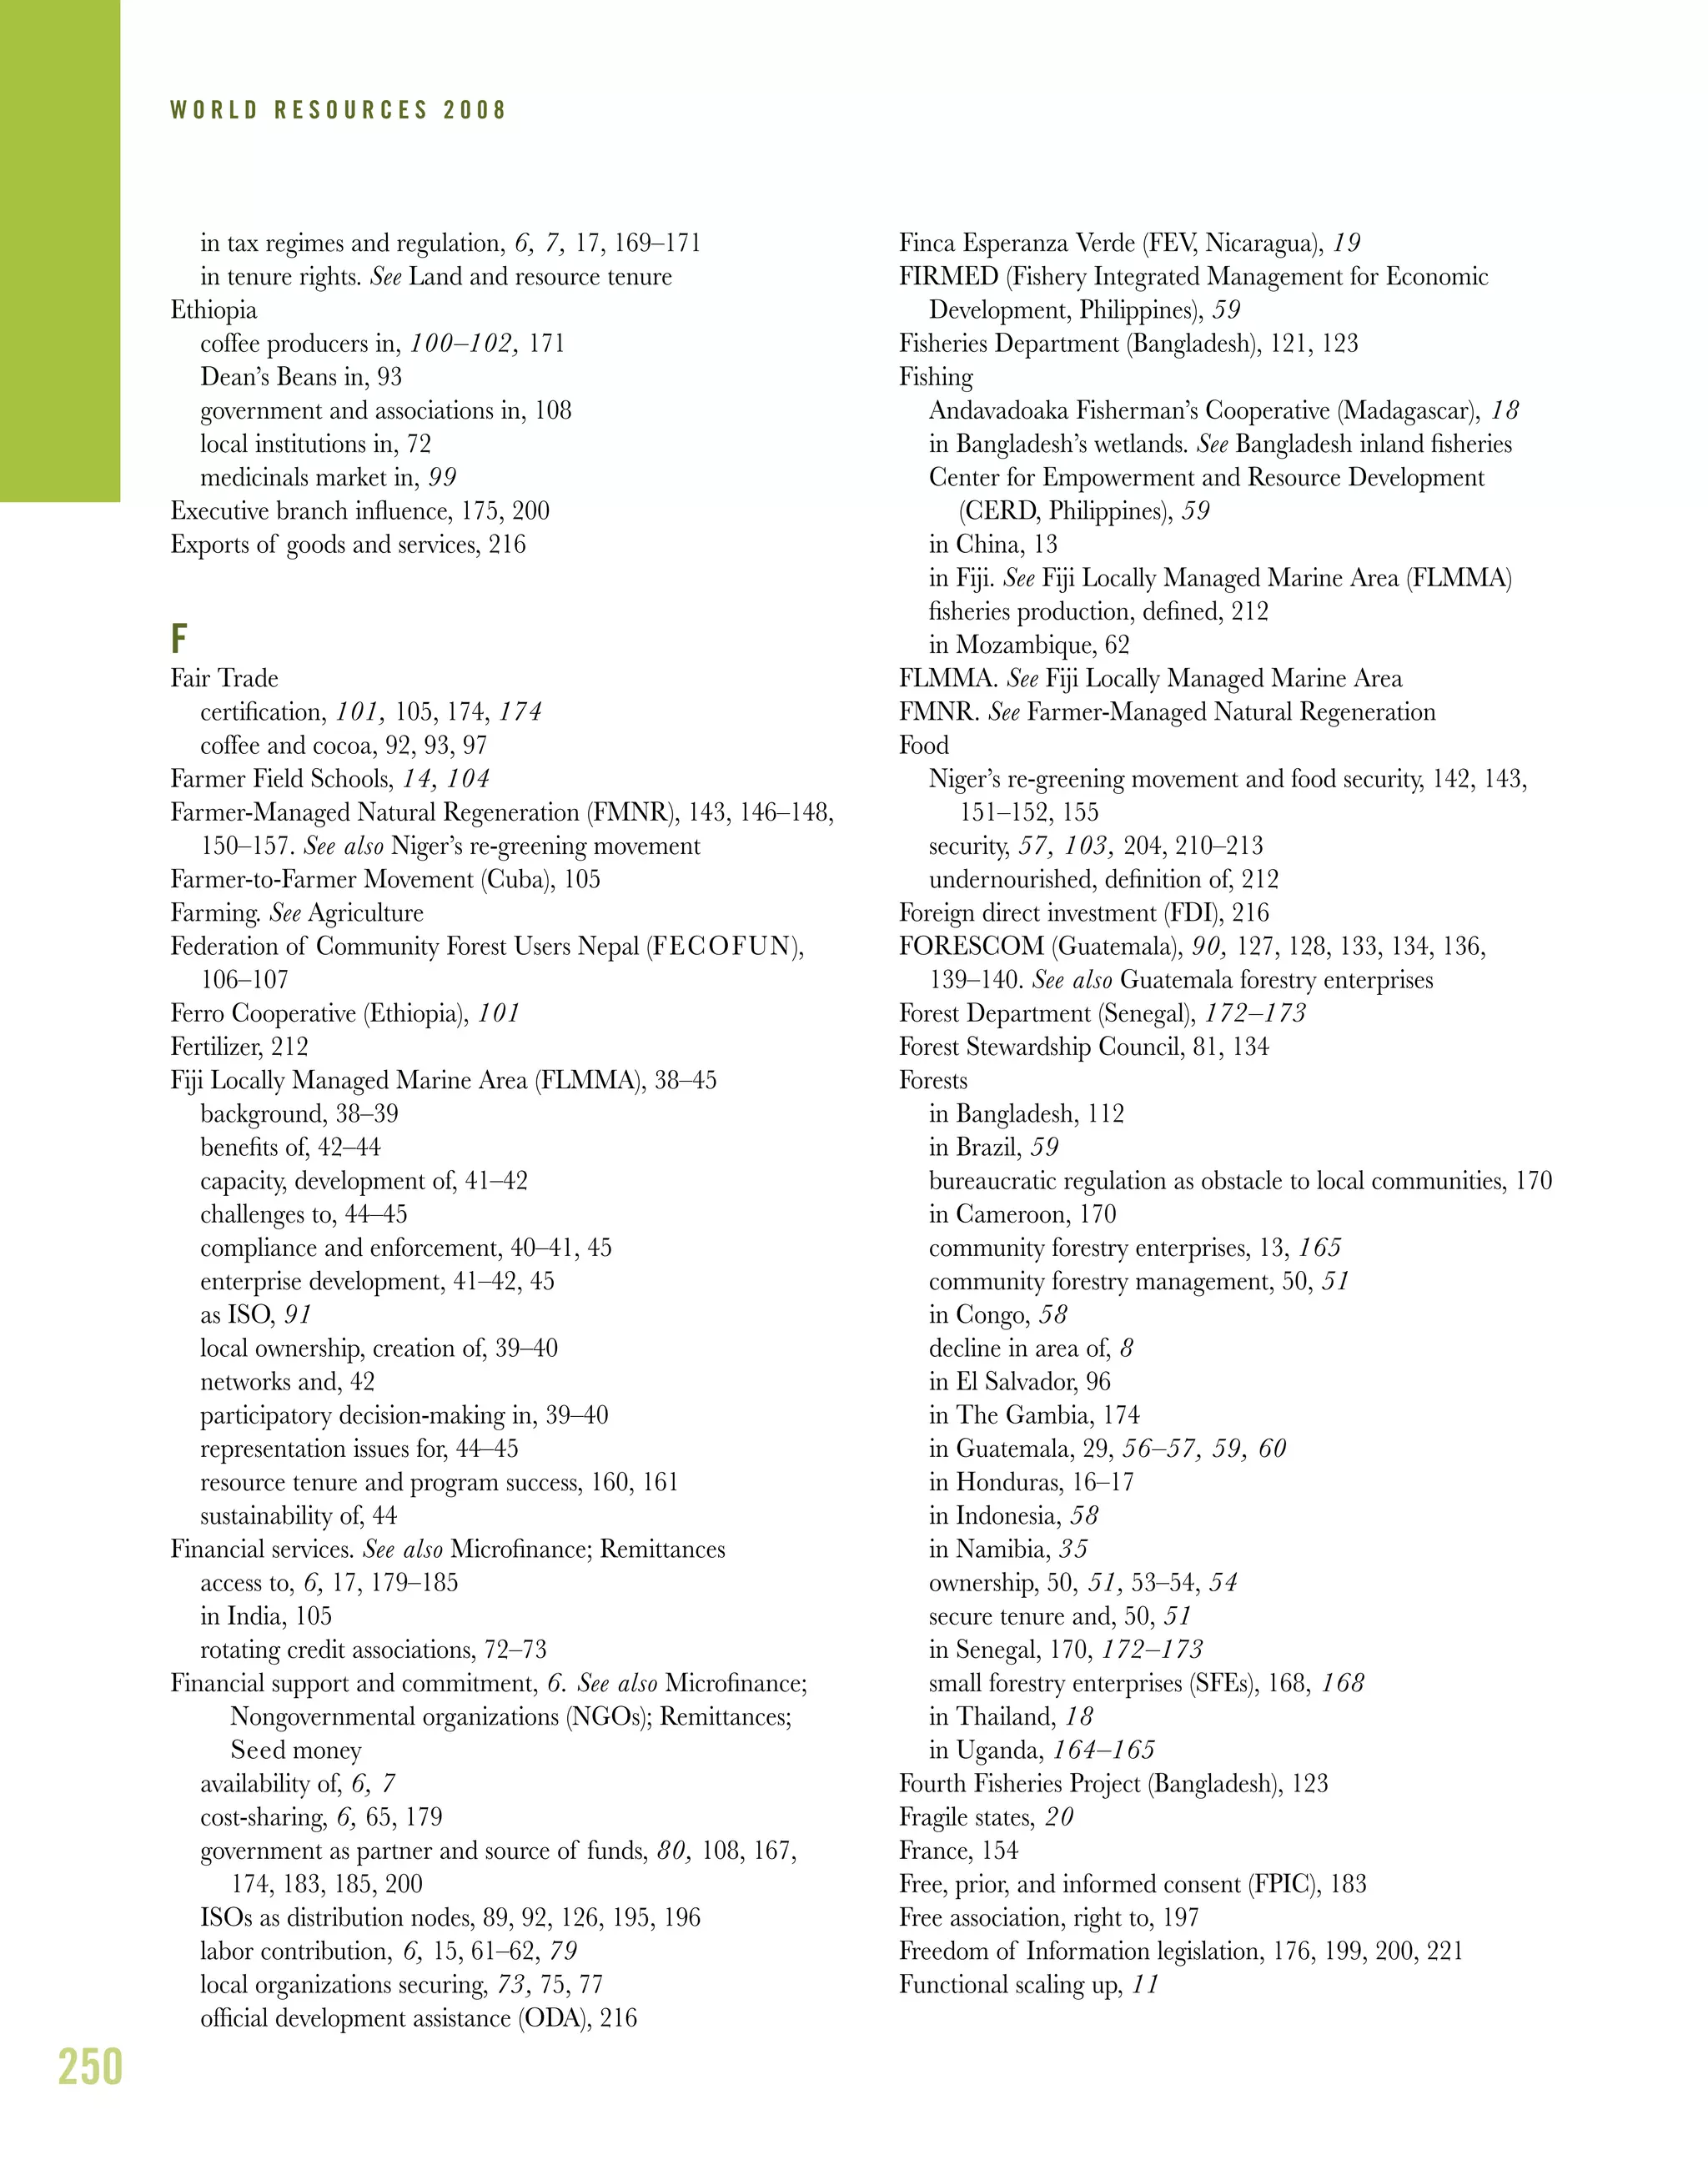
UPDATE: FIJI
extensively with the community during this period to provide
assistance. Support from a neutral party like USP that is not
aligned with any interest group in the community is often very
helpful to stakeholders in reaching consensus.
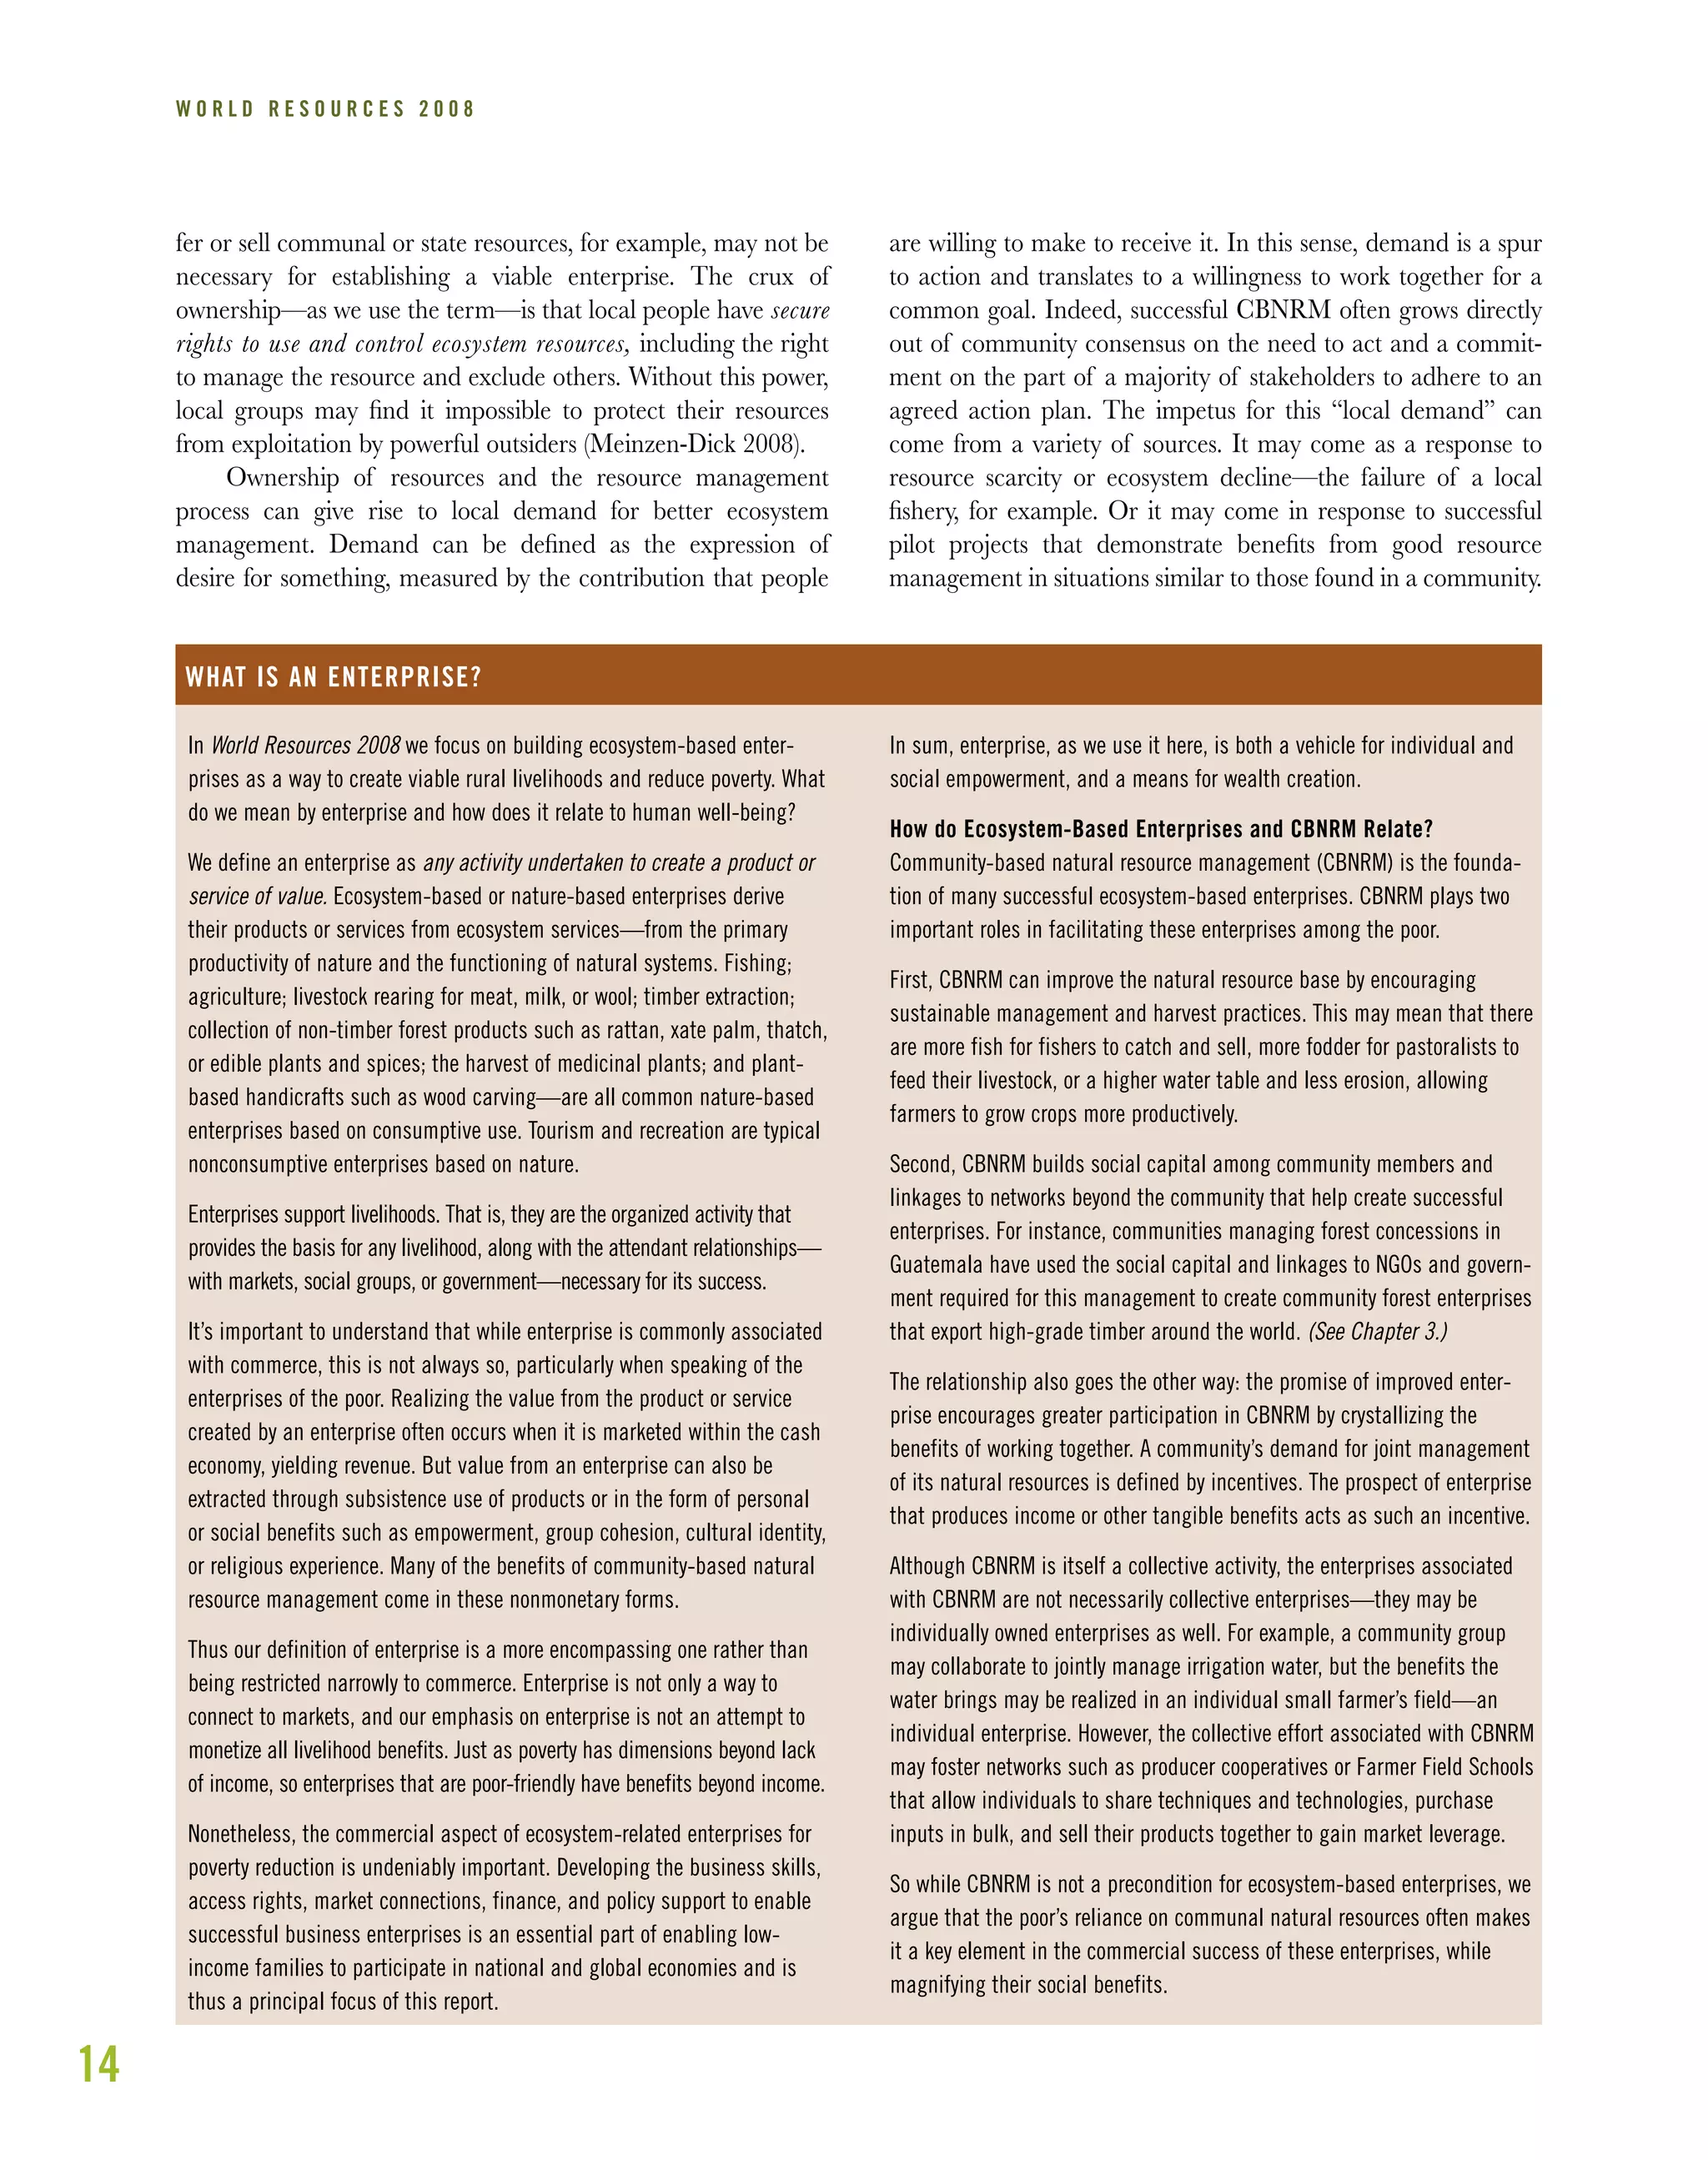
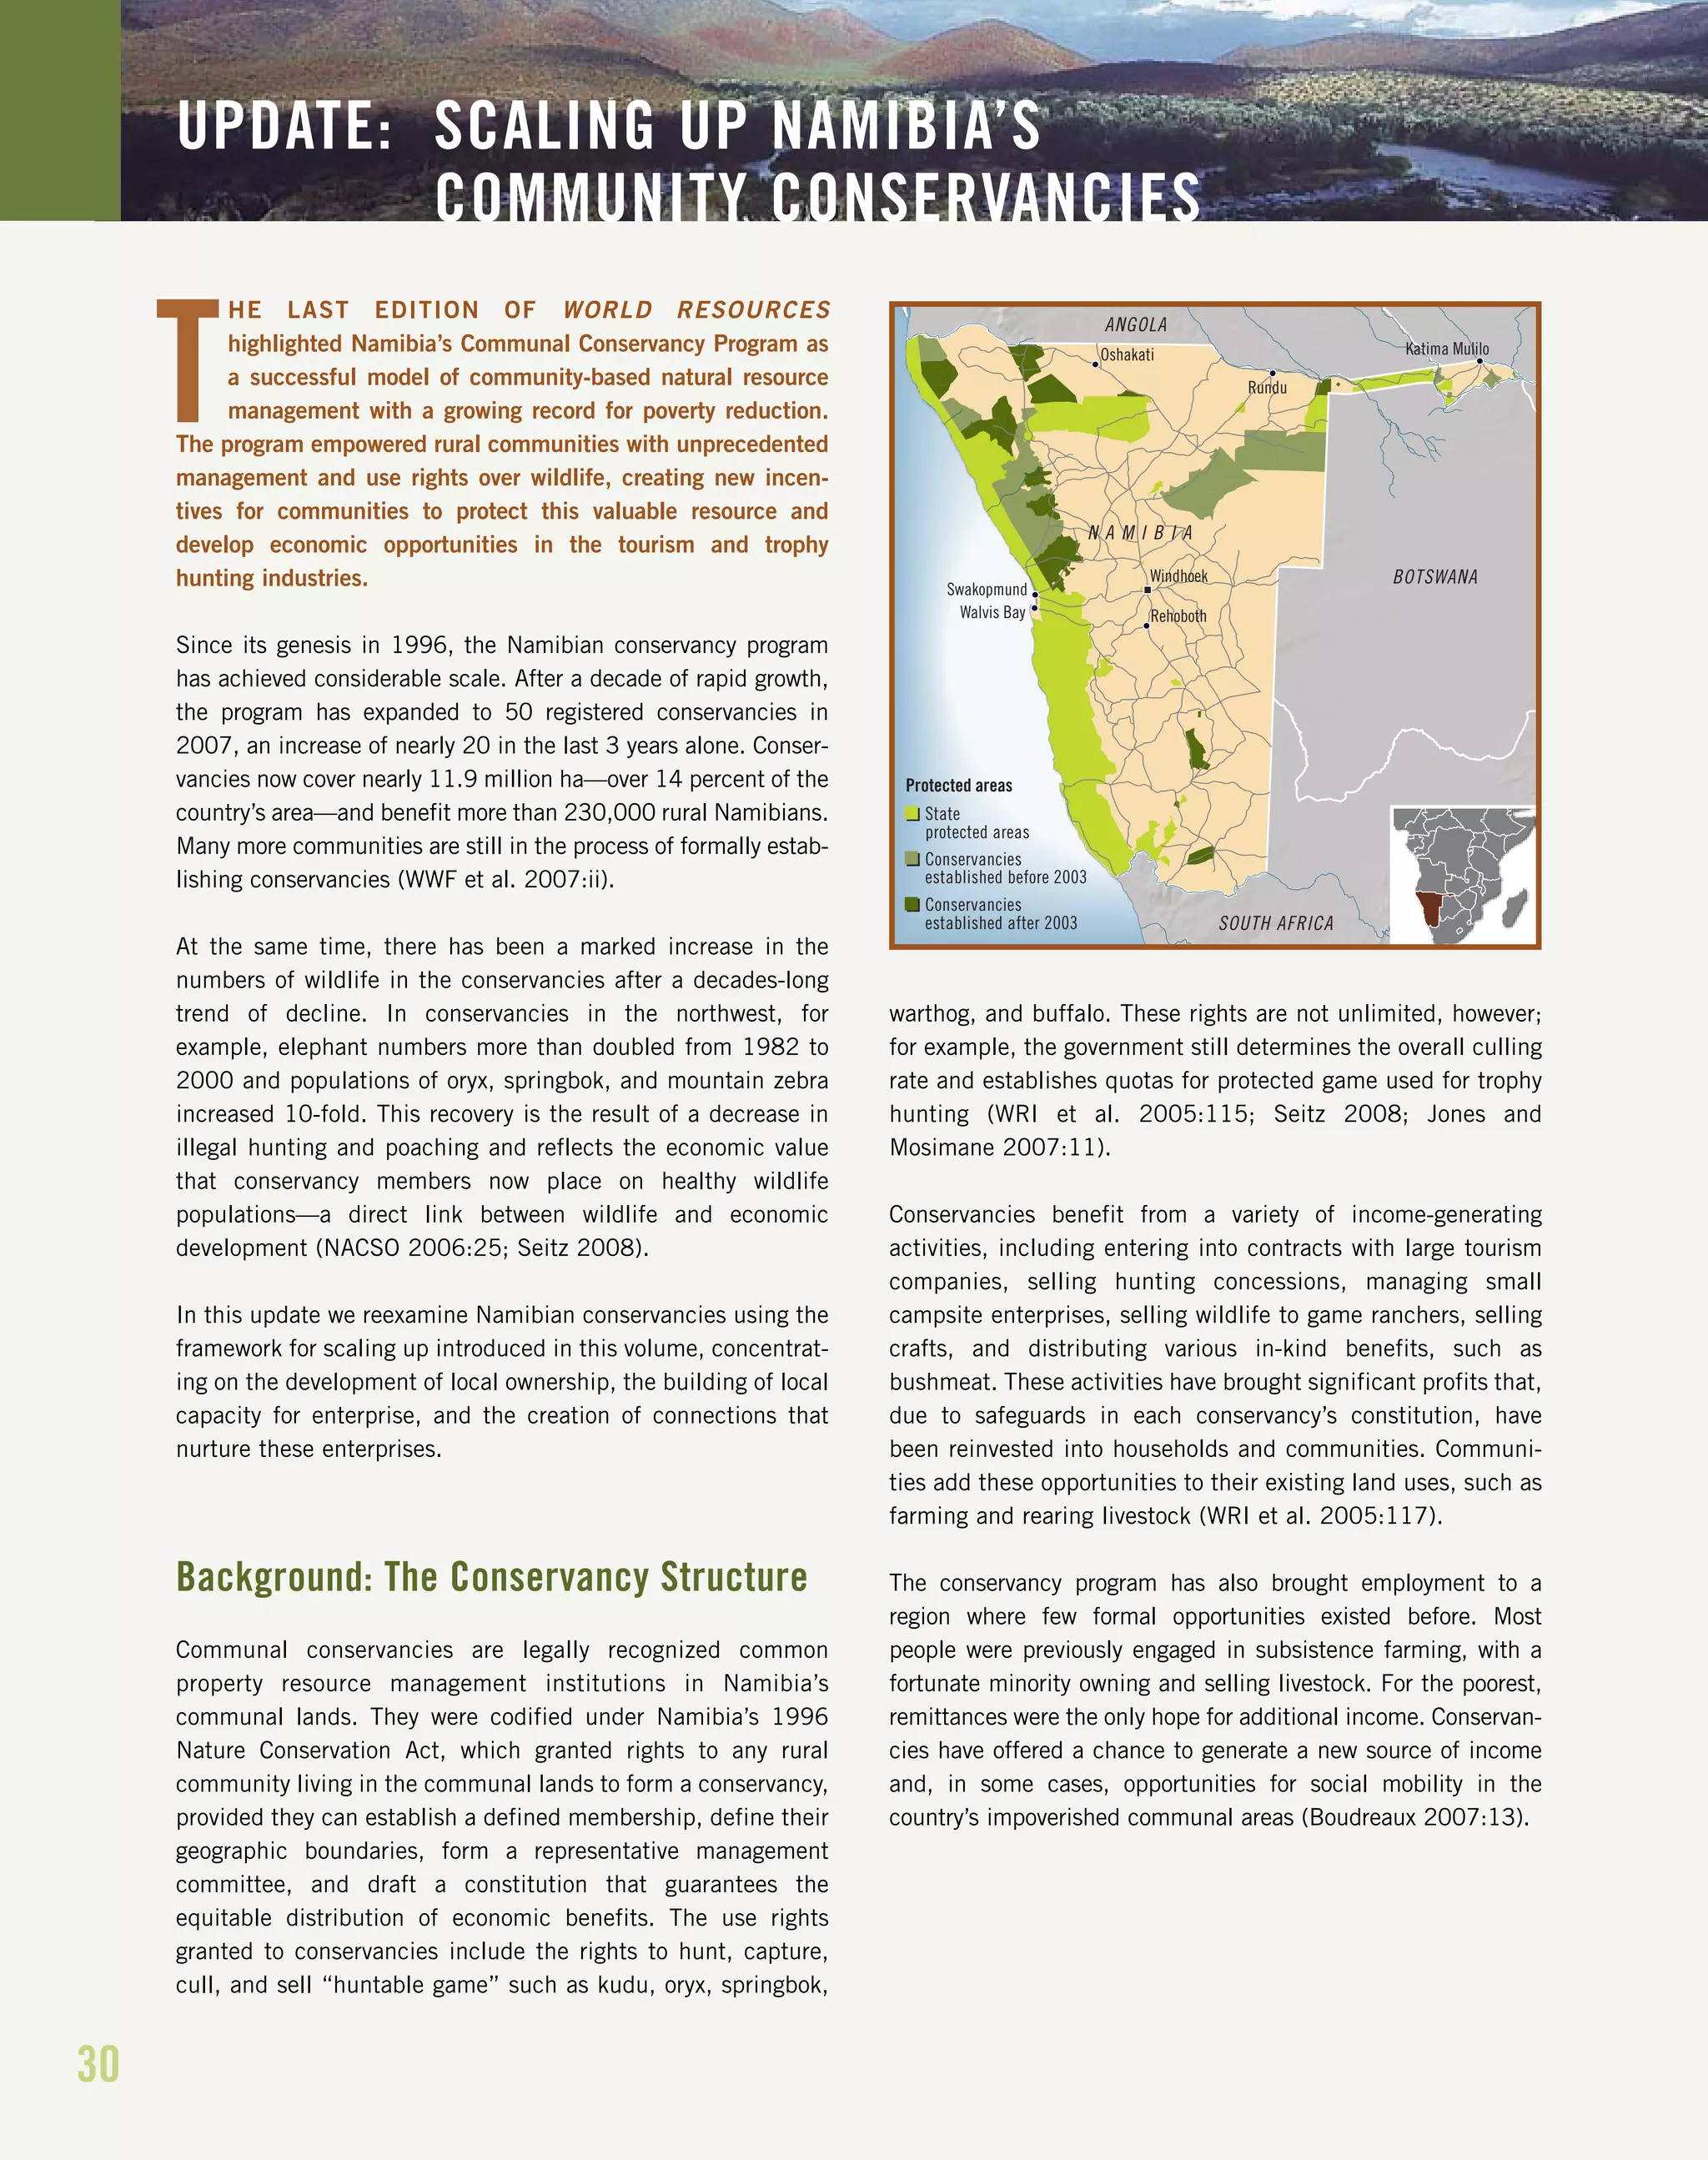
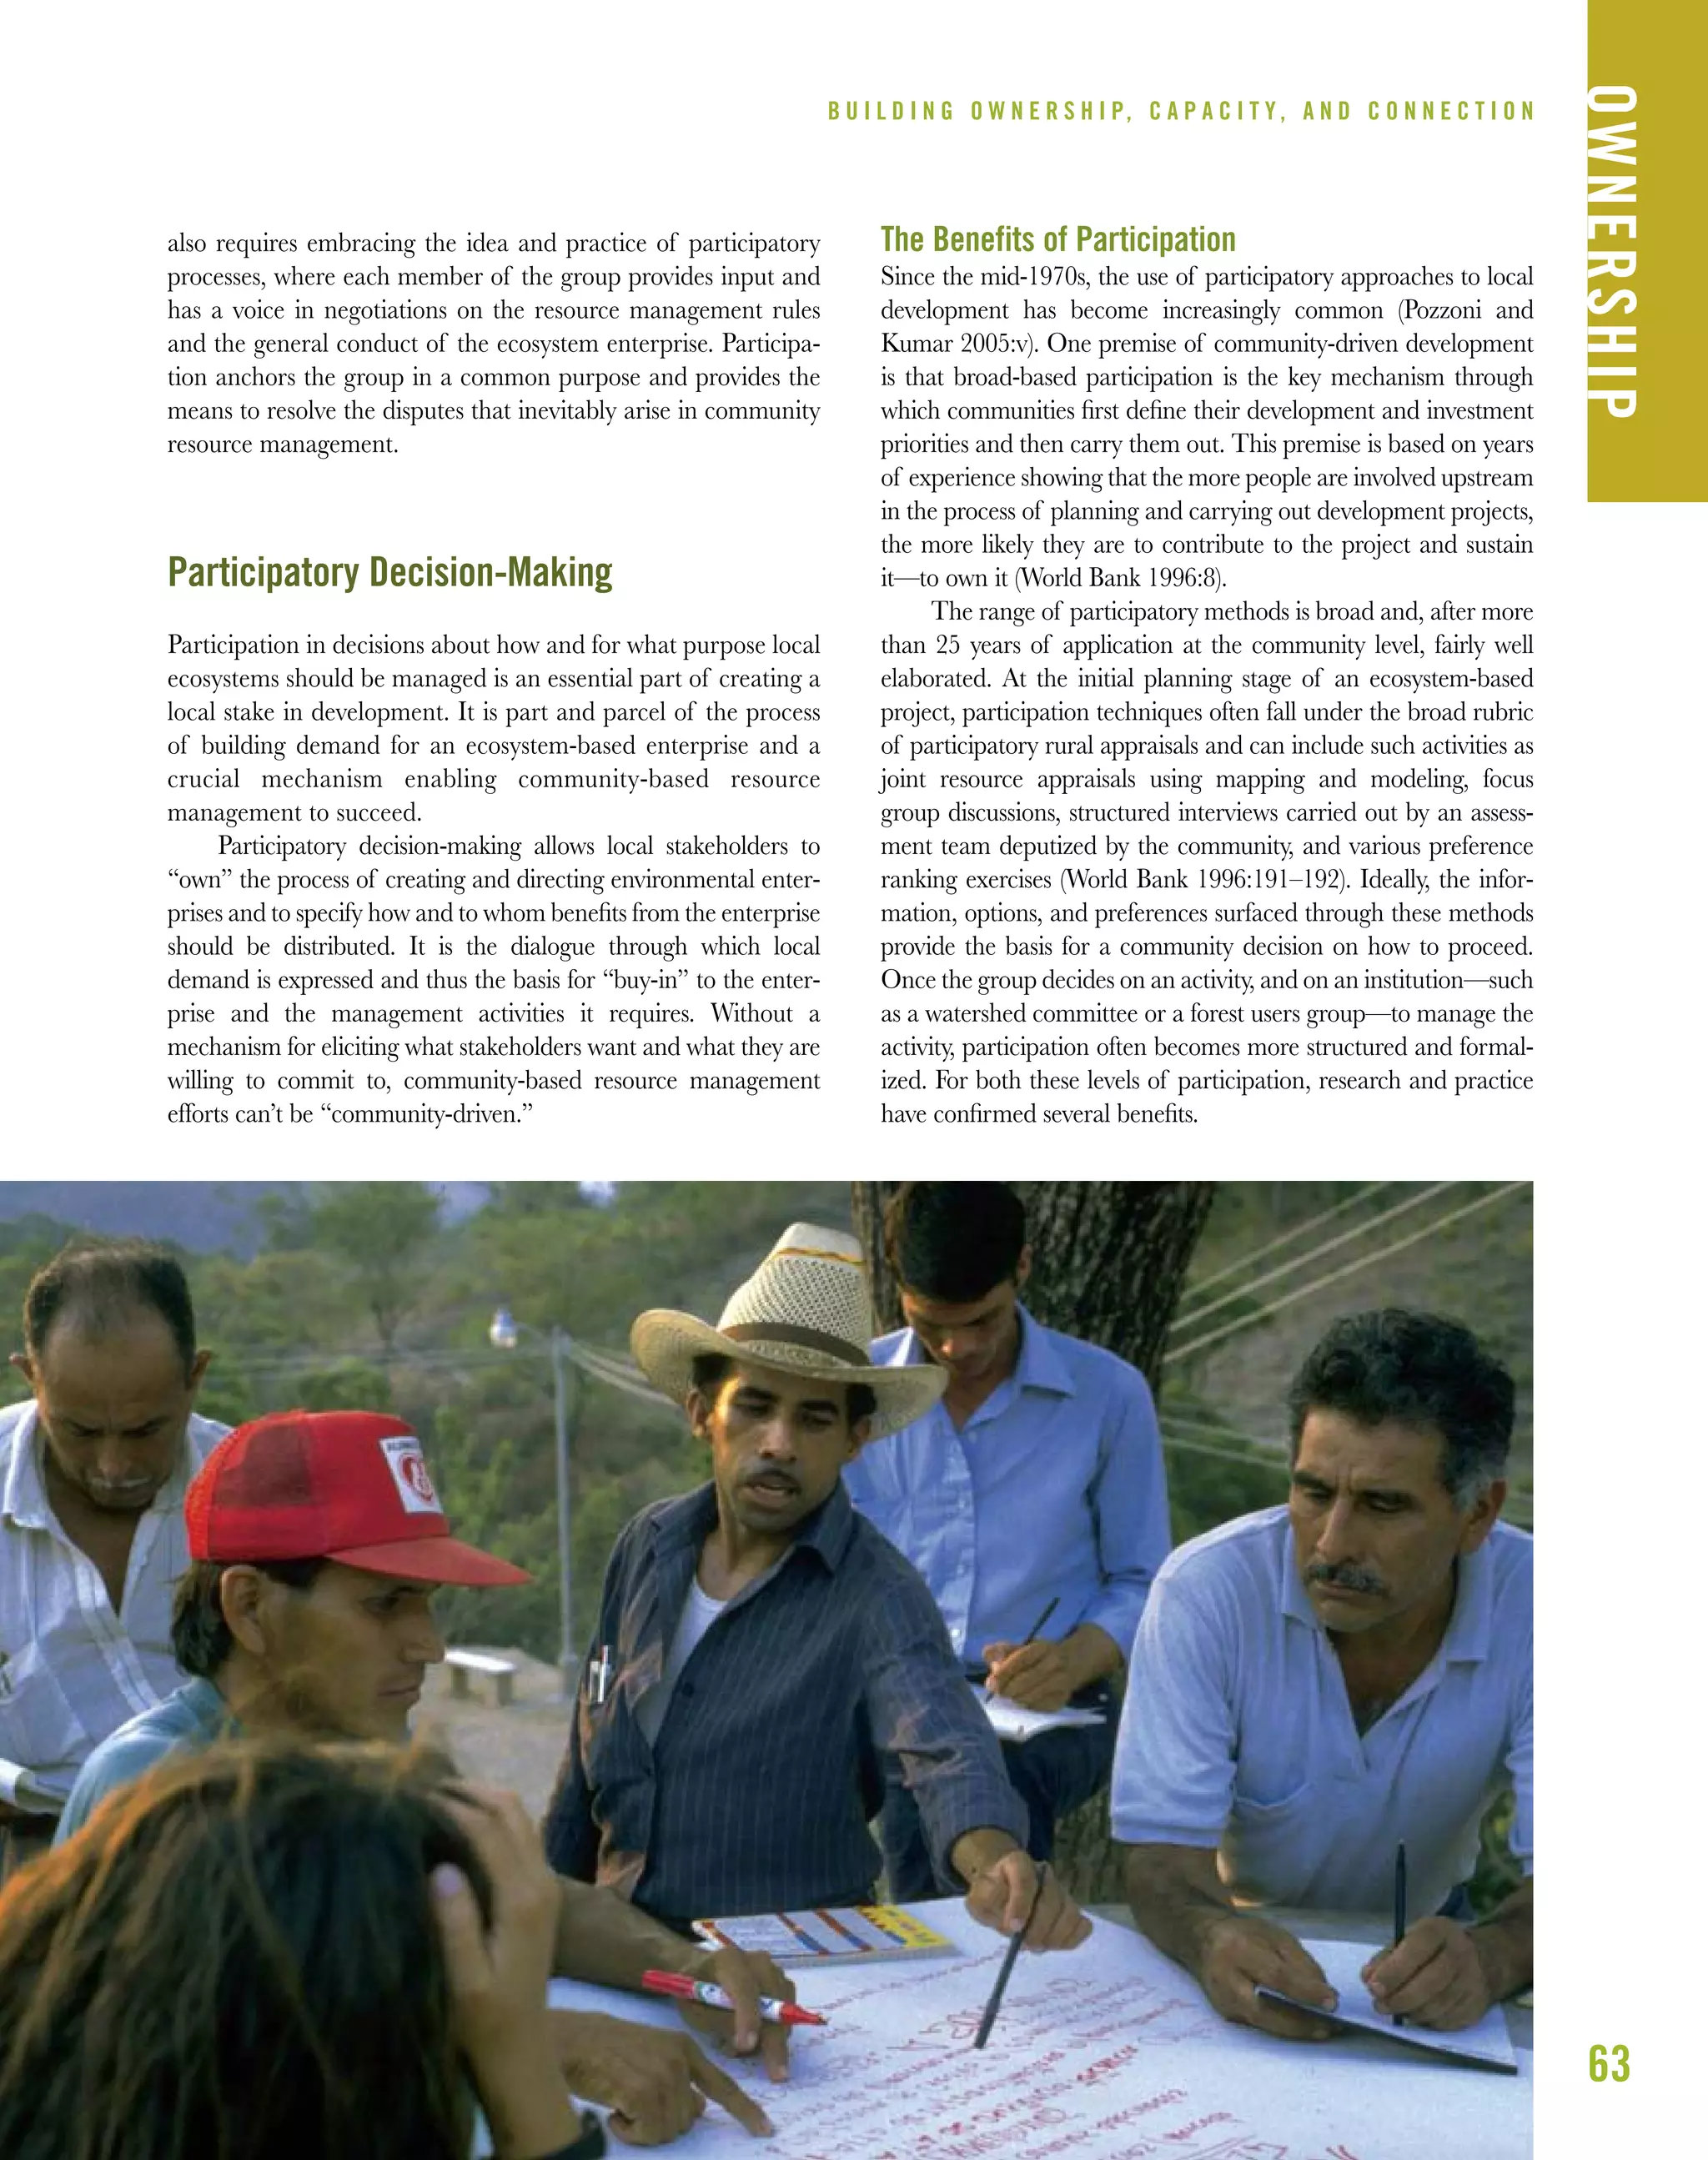
Once rules governing resource use are established, an iqoliqoli
committee is formed to coordinate LMMA work as well as to
represent the community before relevant institutions on issues
involving the LMMA. The iqoliqoli committee has the responsi-
bility, as designated by the vanua (traditional community
council), for making all management decisions concerning the
LMMA, following consultation with residents through village
council meetings (van Beukering et al. 2007:11).
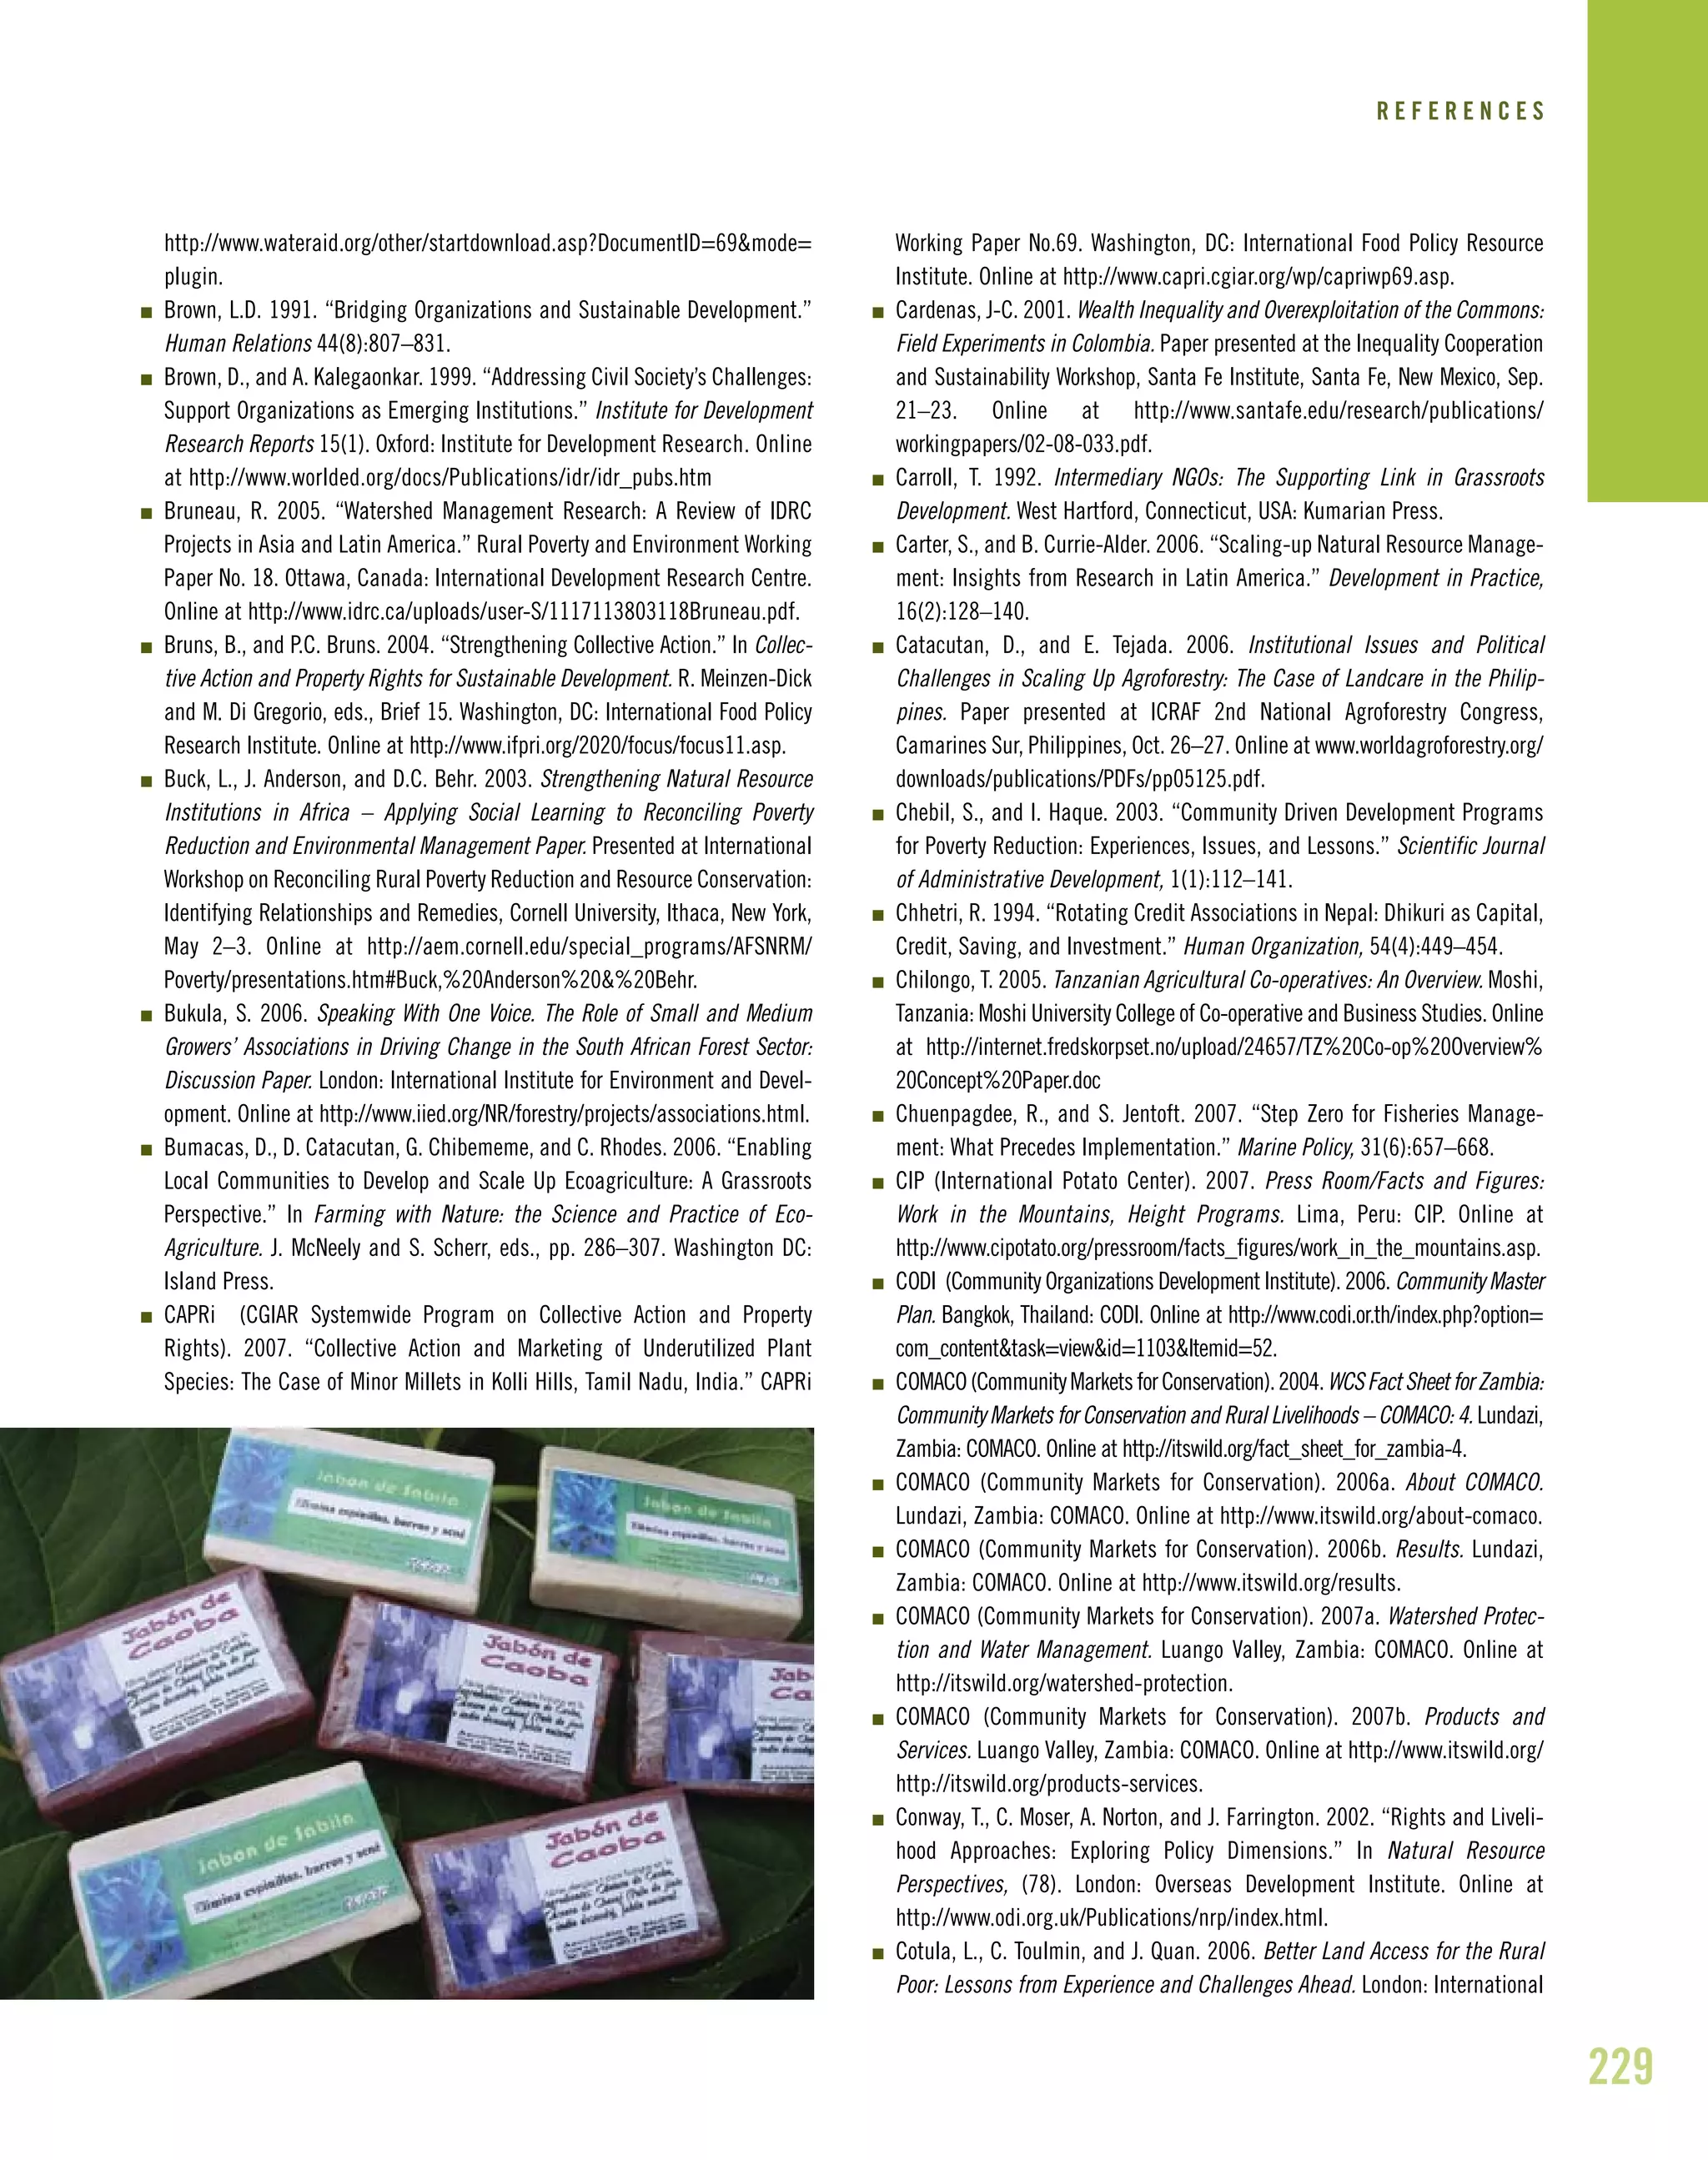
In the community of Navakavu, for example, the iqoliqoli
committee consists of 21 members, including landowners and
the headman from each of the four main villages using the
iqloiqoli, as well as the individuals serving in key posts estab-
lished by the LMMA process: biological monitors, fish wardens
(one from each village), and the leader of the youth environ-
mental drama group (van Beukering et al. 2007:11–12).
People in the villages of Navakavu are confident about the
committee’s competence and its responsiveness to community
demands. As one villager noted, “The establishment of the
[iqoliqoli] committee has helped each member recognize their
assigned duties and has encouraged them to perform well in
their area” (Leisher et al. 2007a:8).
The relatively small size of LMMAs (compared with large MPAs
administered by central authorities) tends to foster a stronger
sense of ownership and engagement by the locals. The limited
scale of the resource ensures that the impact of conservation
measures can be detected sooner. In the case of Navakavu, the
LMMA is even within sight of the managing villages, adding to
their sense of control (Leisher et al. 2007a:32).
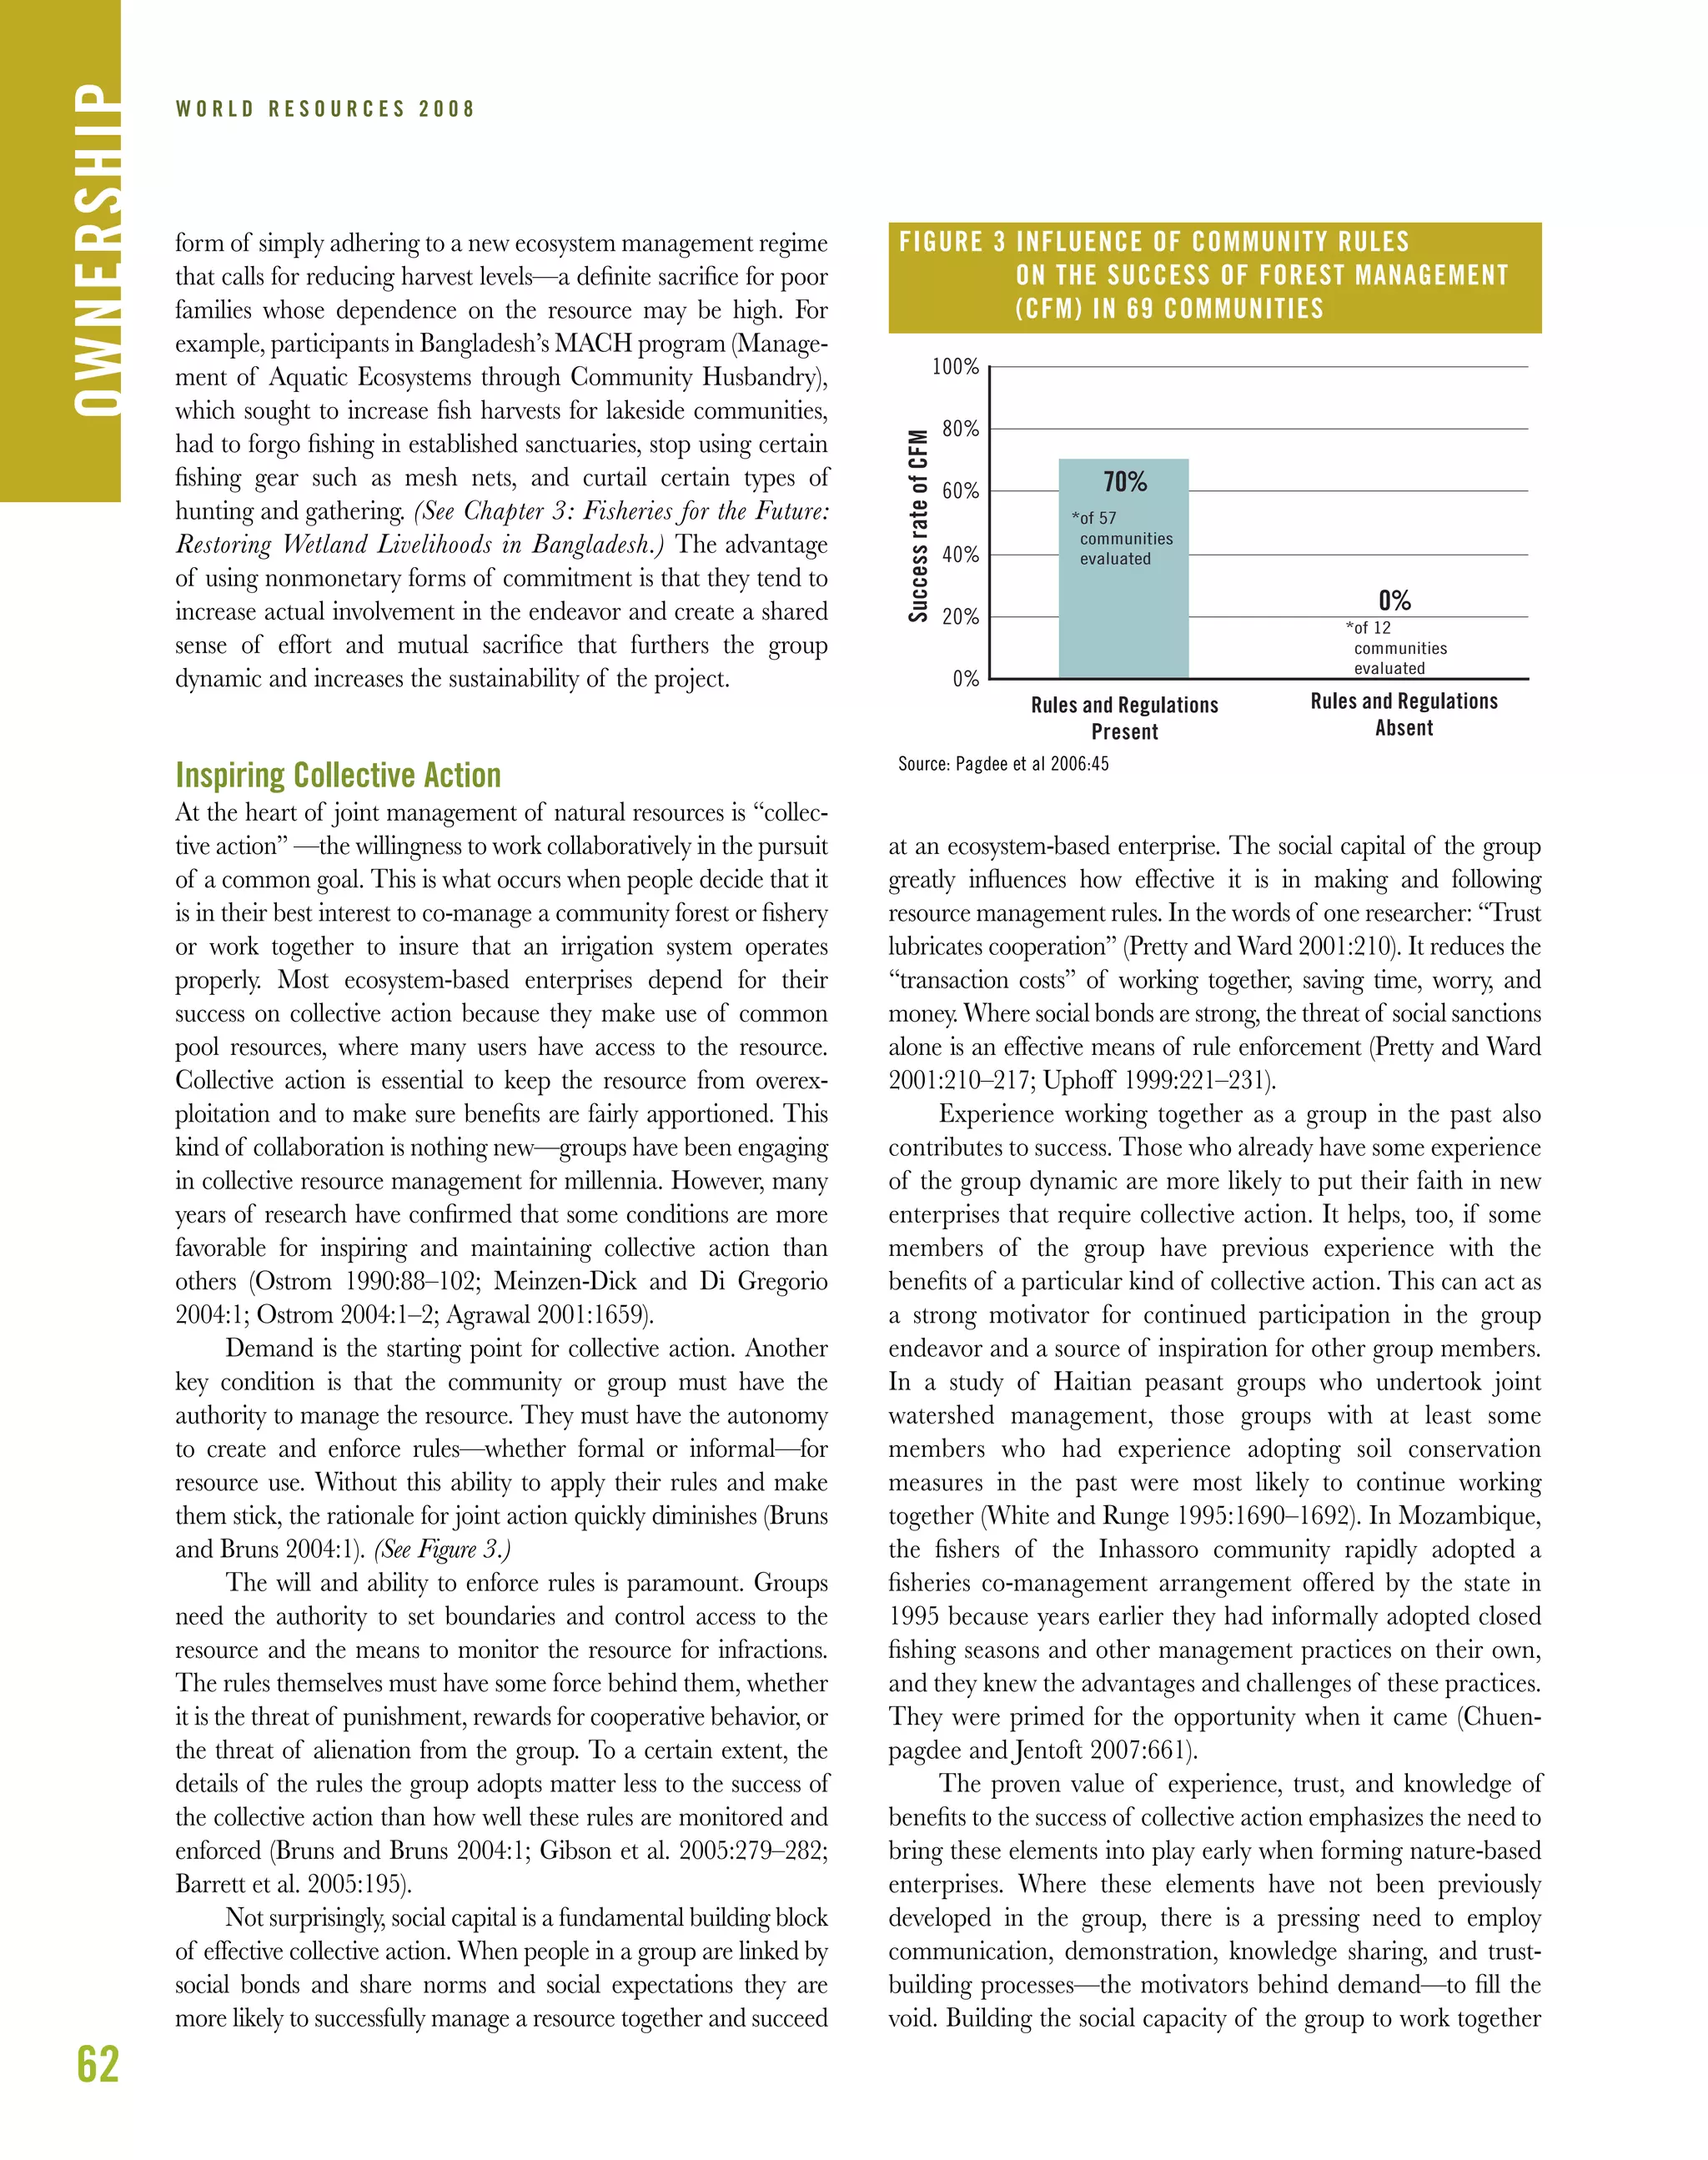
Compliance and Enforcement
When a community establishes an LMMA, the improvement in
the condition of marine resources attracts poachers from both
inside and outside the community. Thus monitoring compliance
with established resource rules and minimizing poaching is](https://image.slidesharecdn.com/worldresources2008rootsofresilience-150506081253-conversion-gate02/75/World-resources-2008_roots_of_resilience-52-2048.jpg)

![82
W O R L D R E S O U R C E S 2 0 0 8CAPACITY
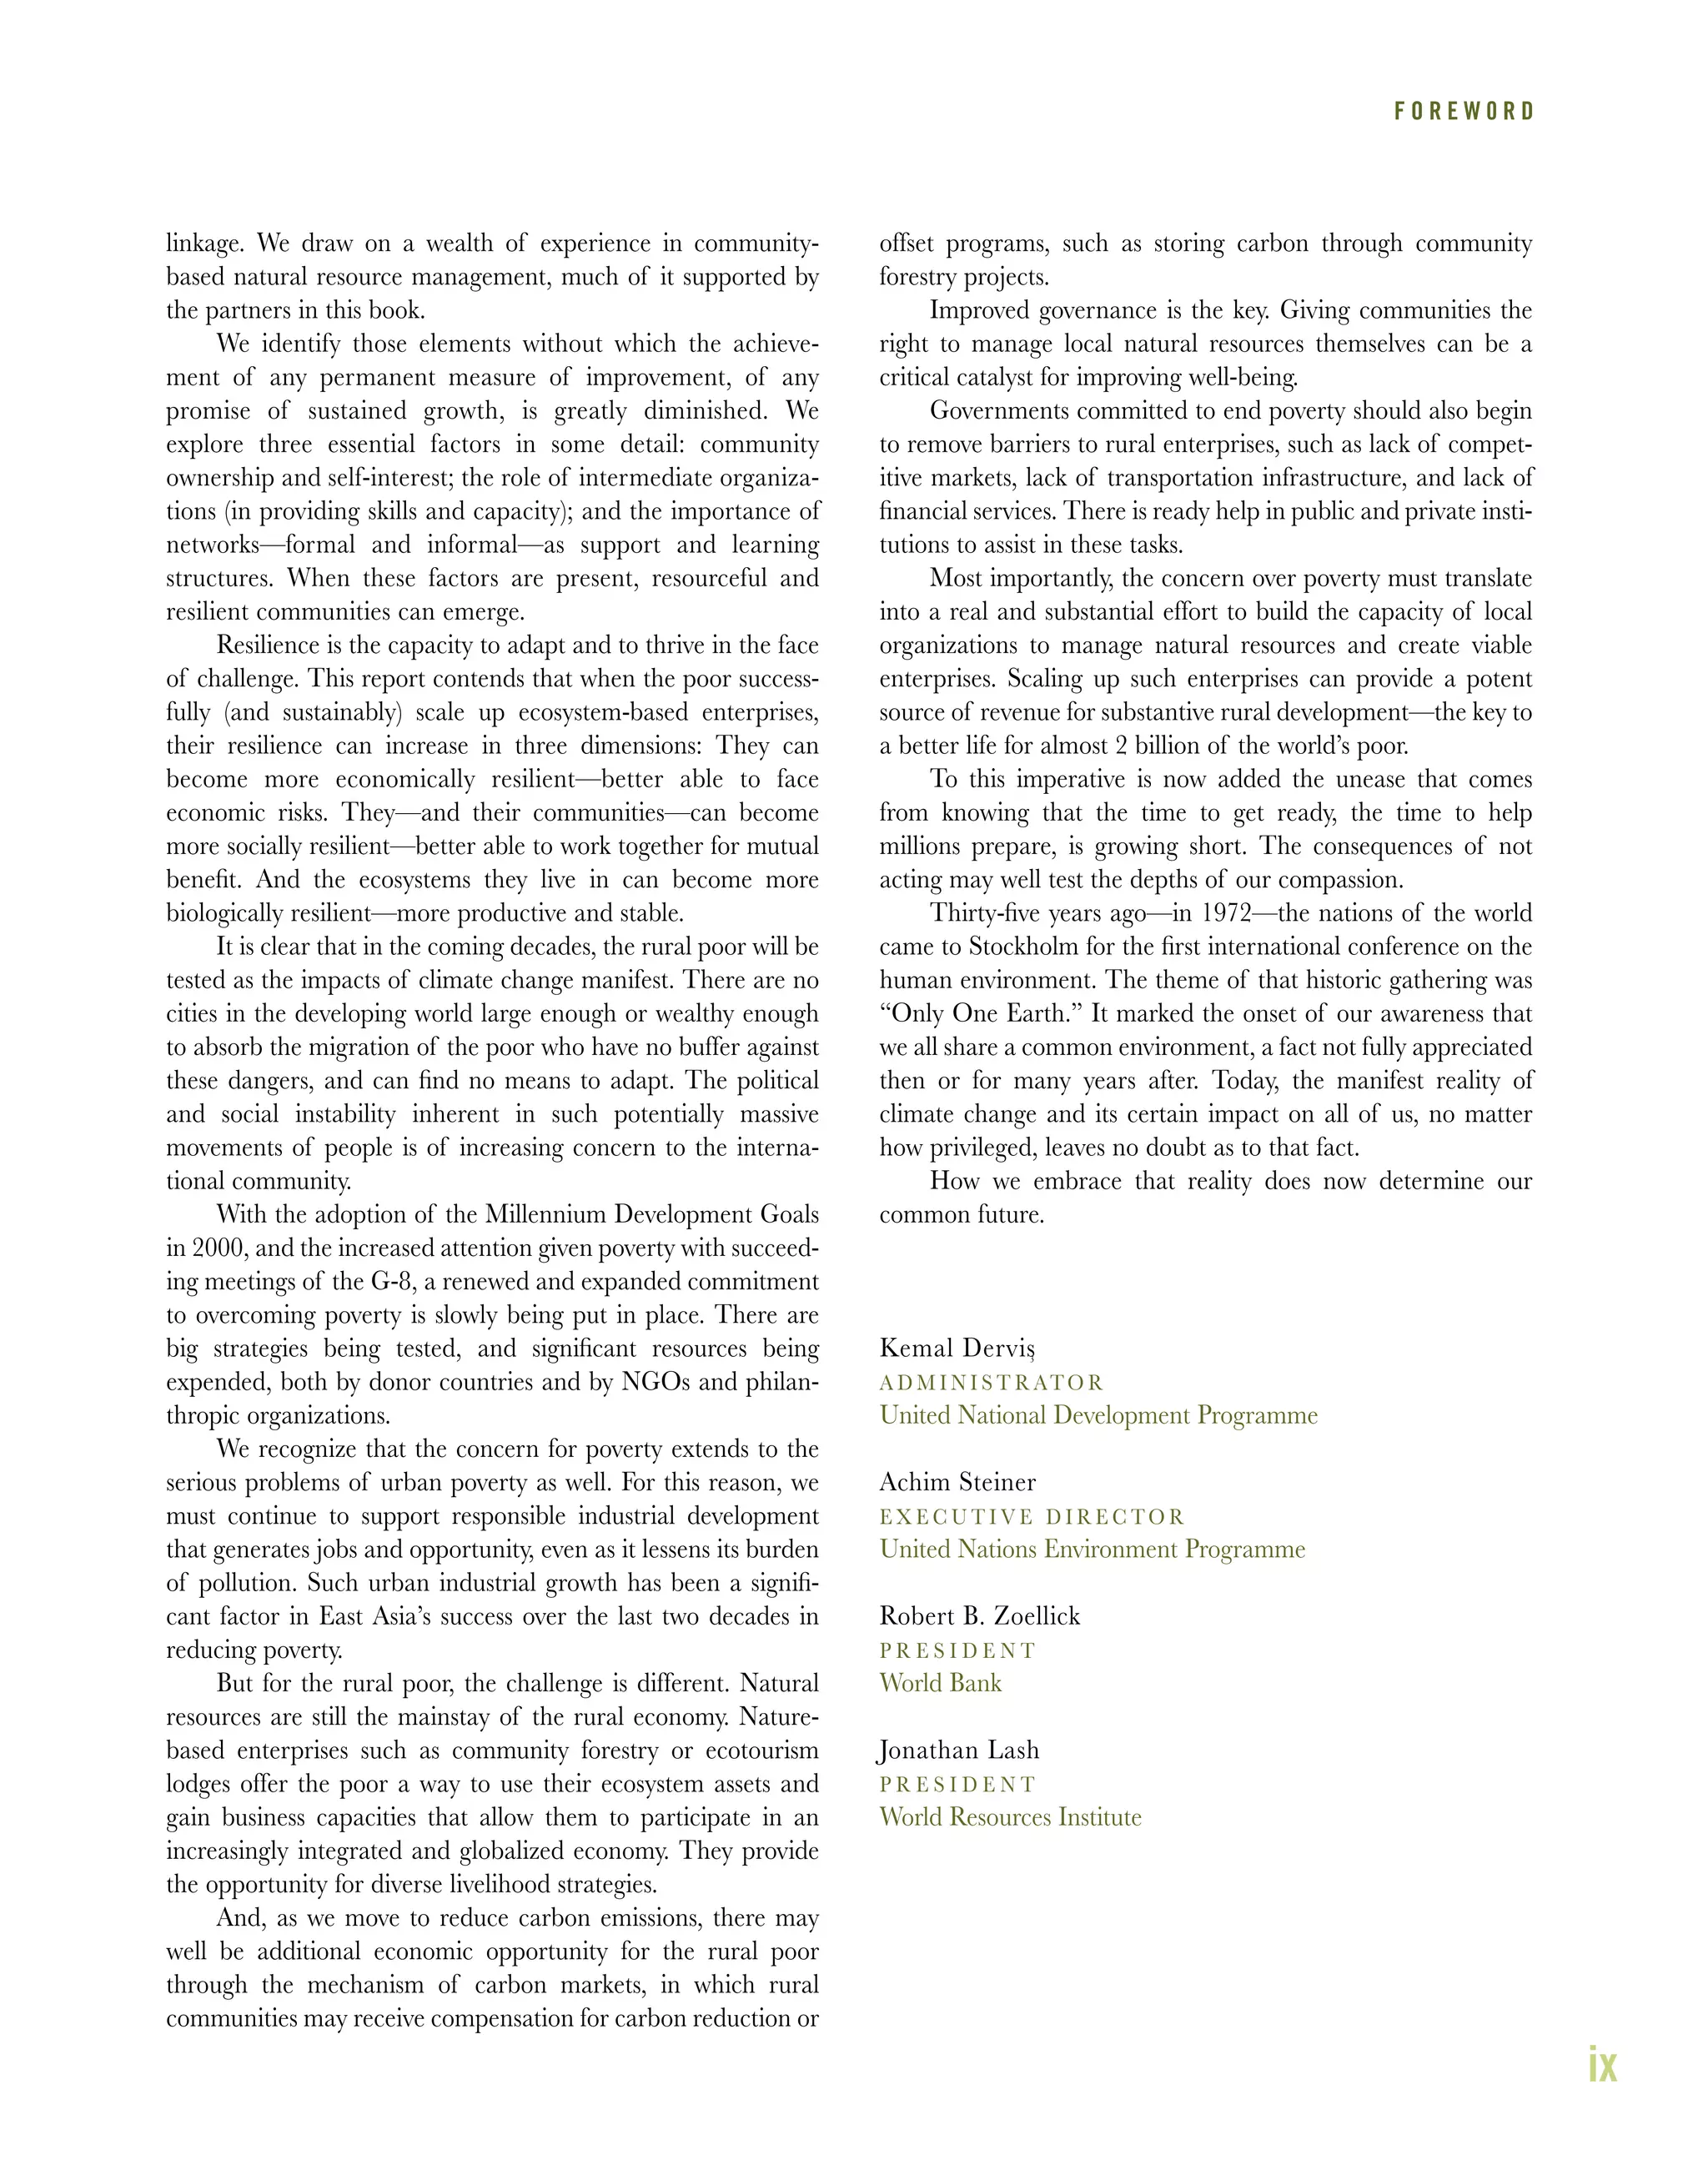
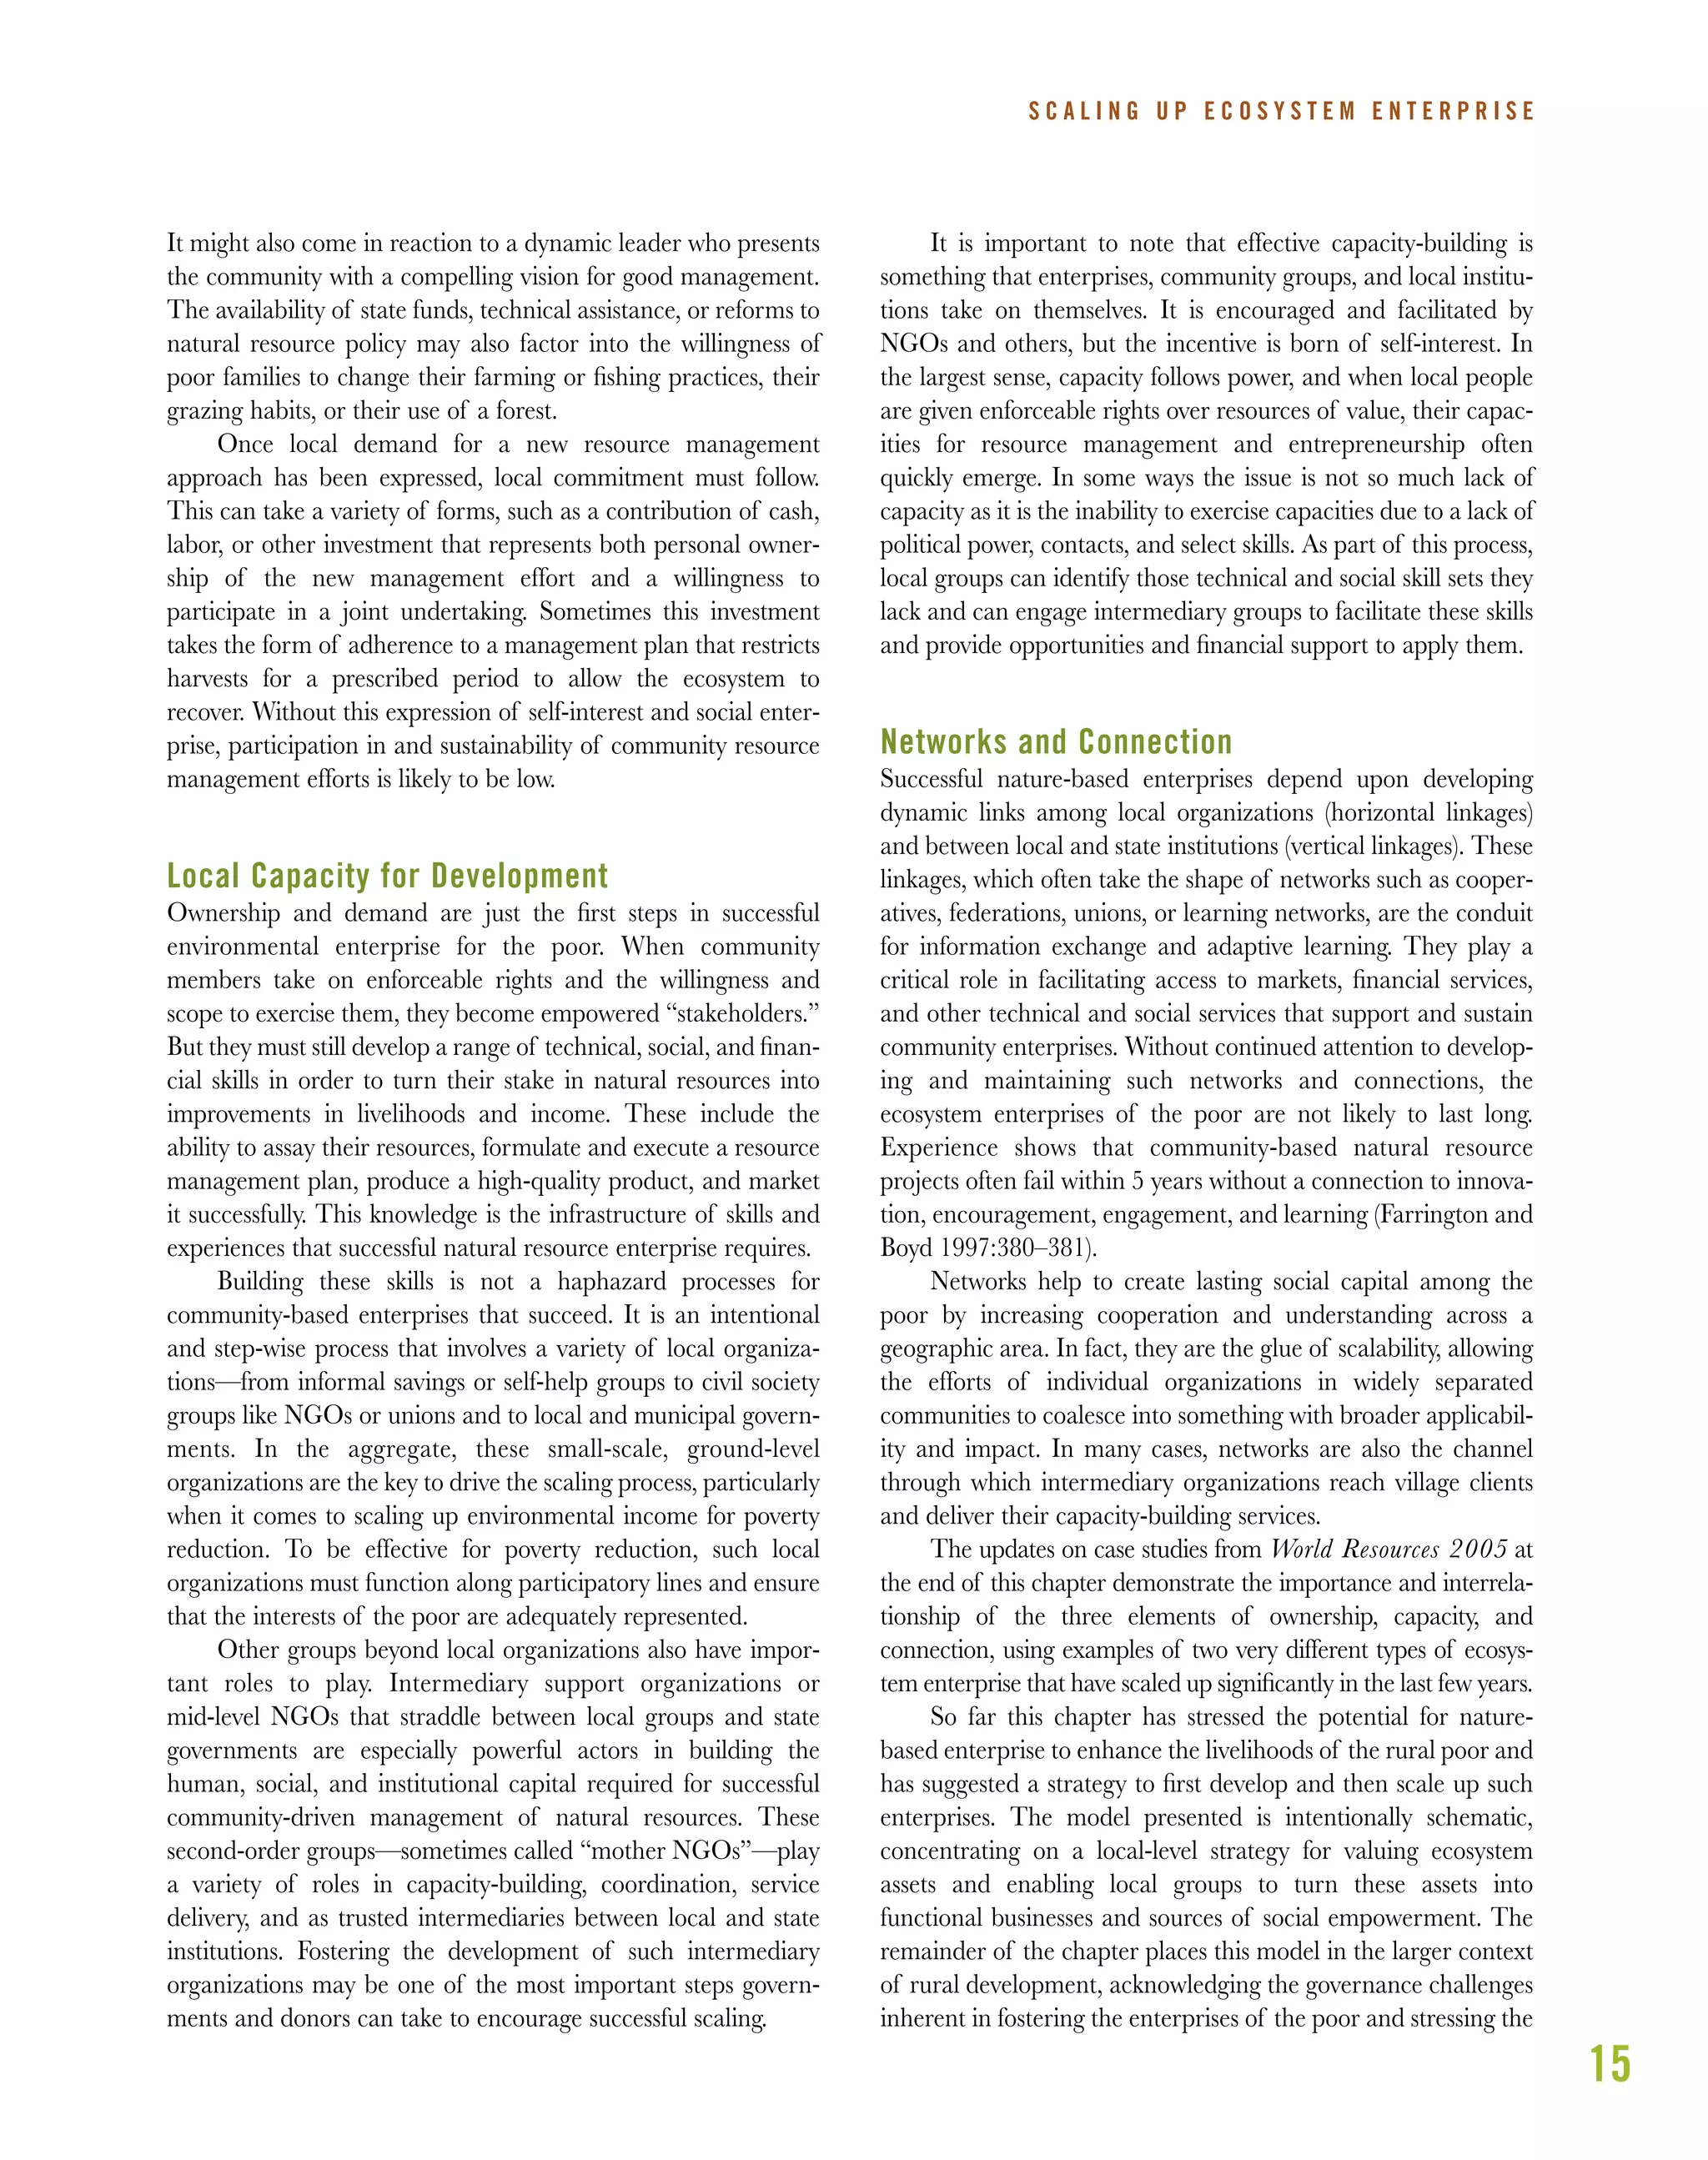
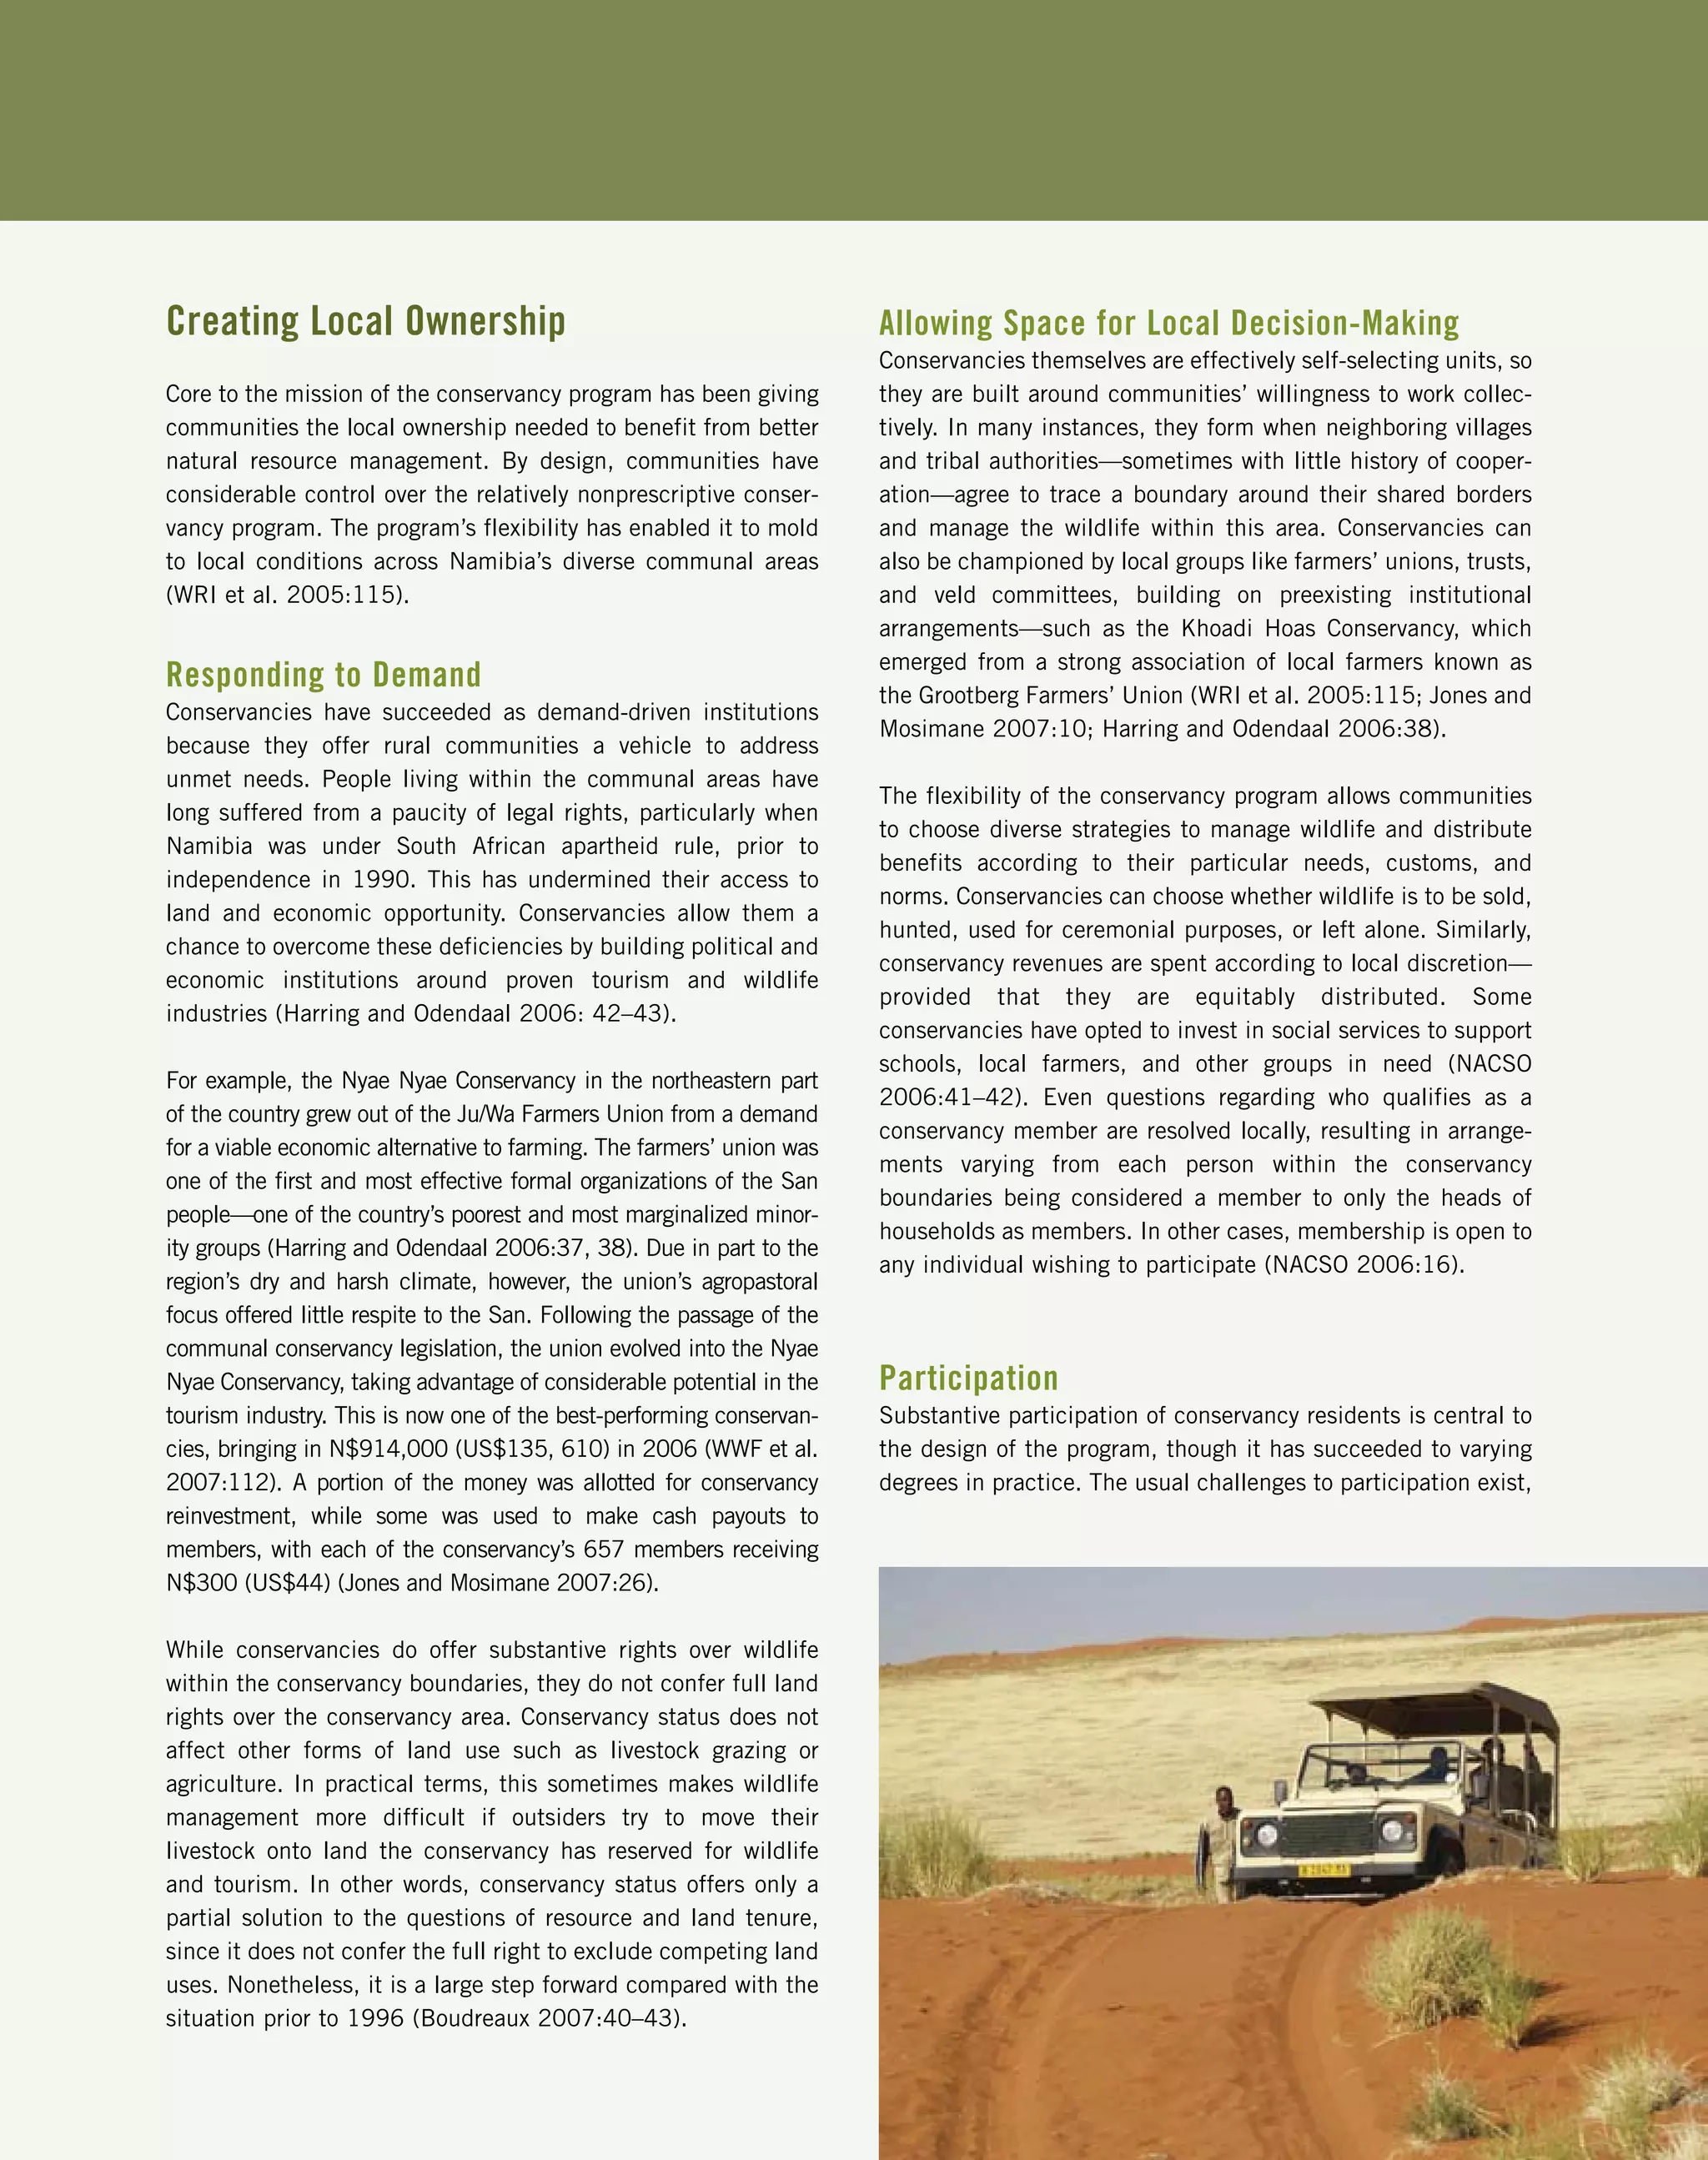
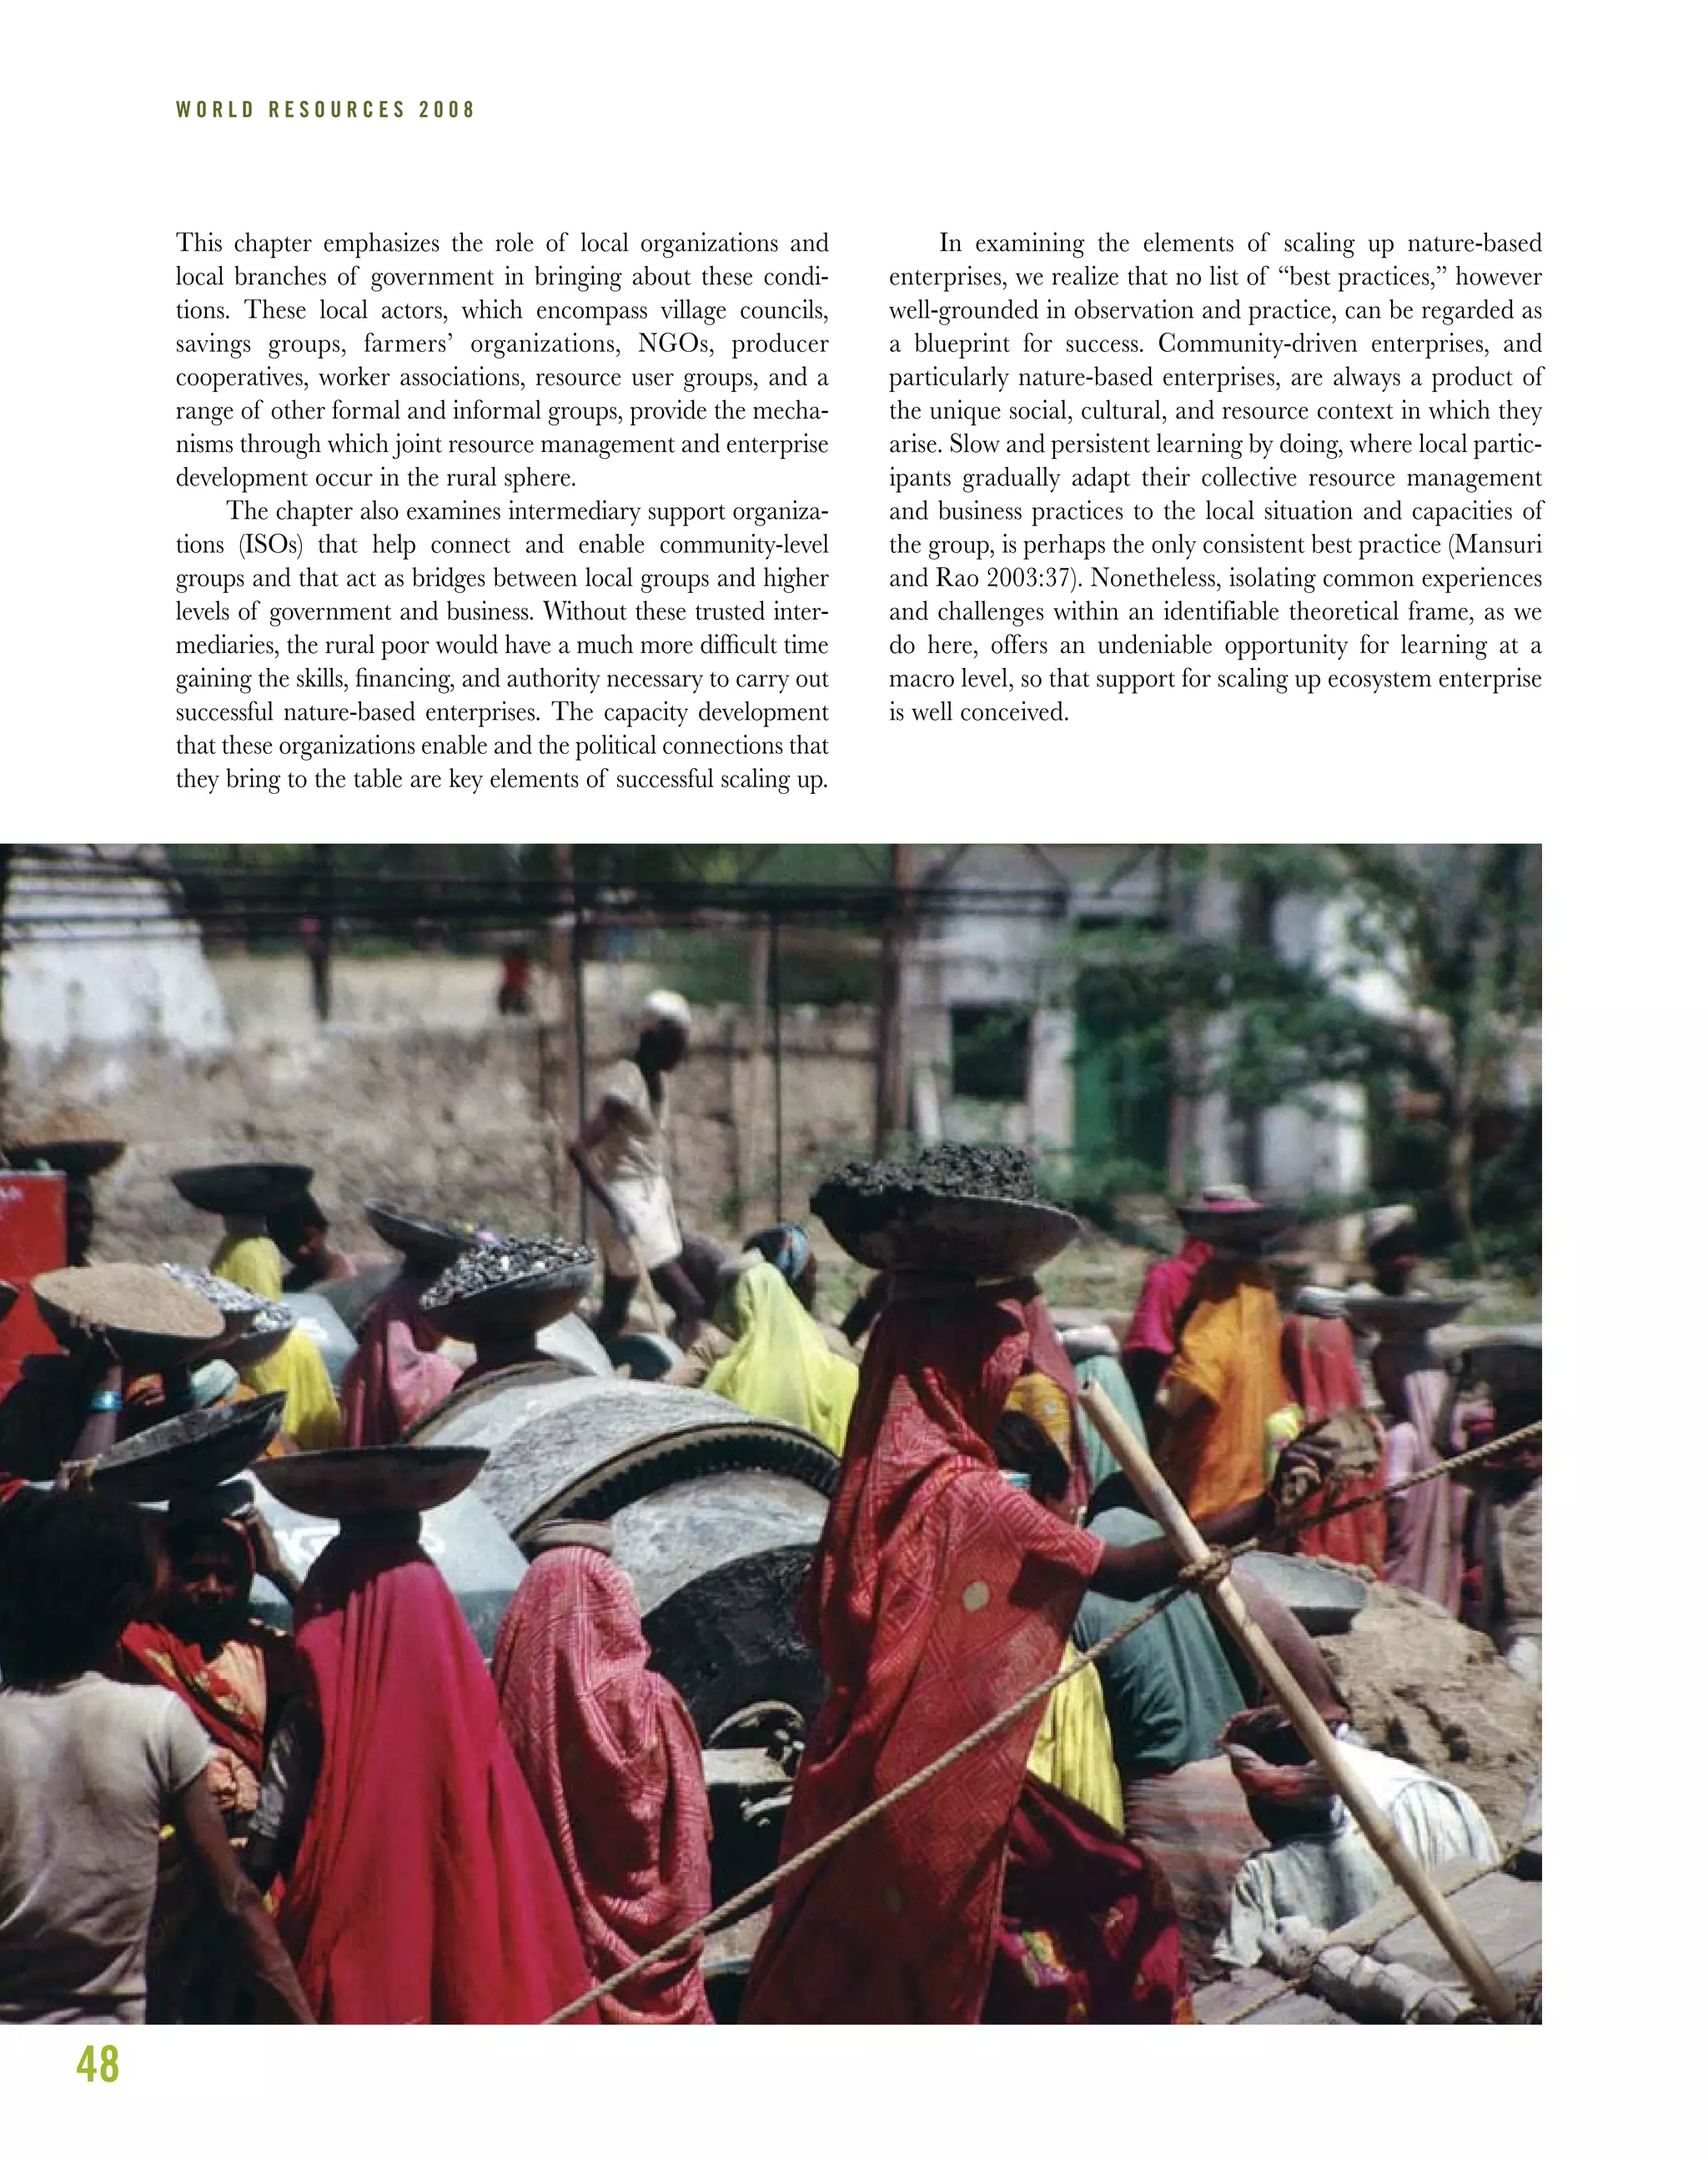
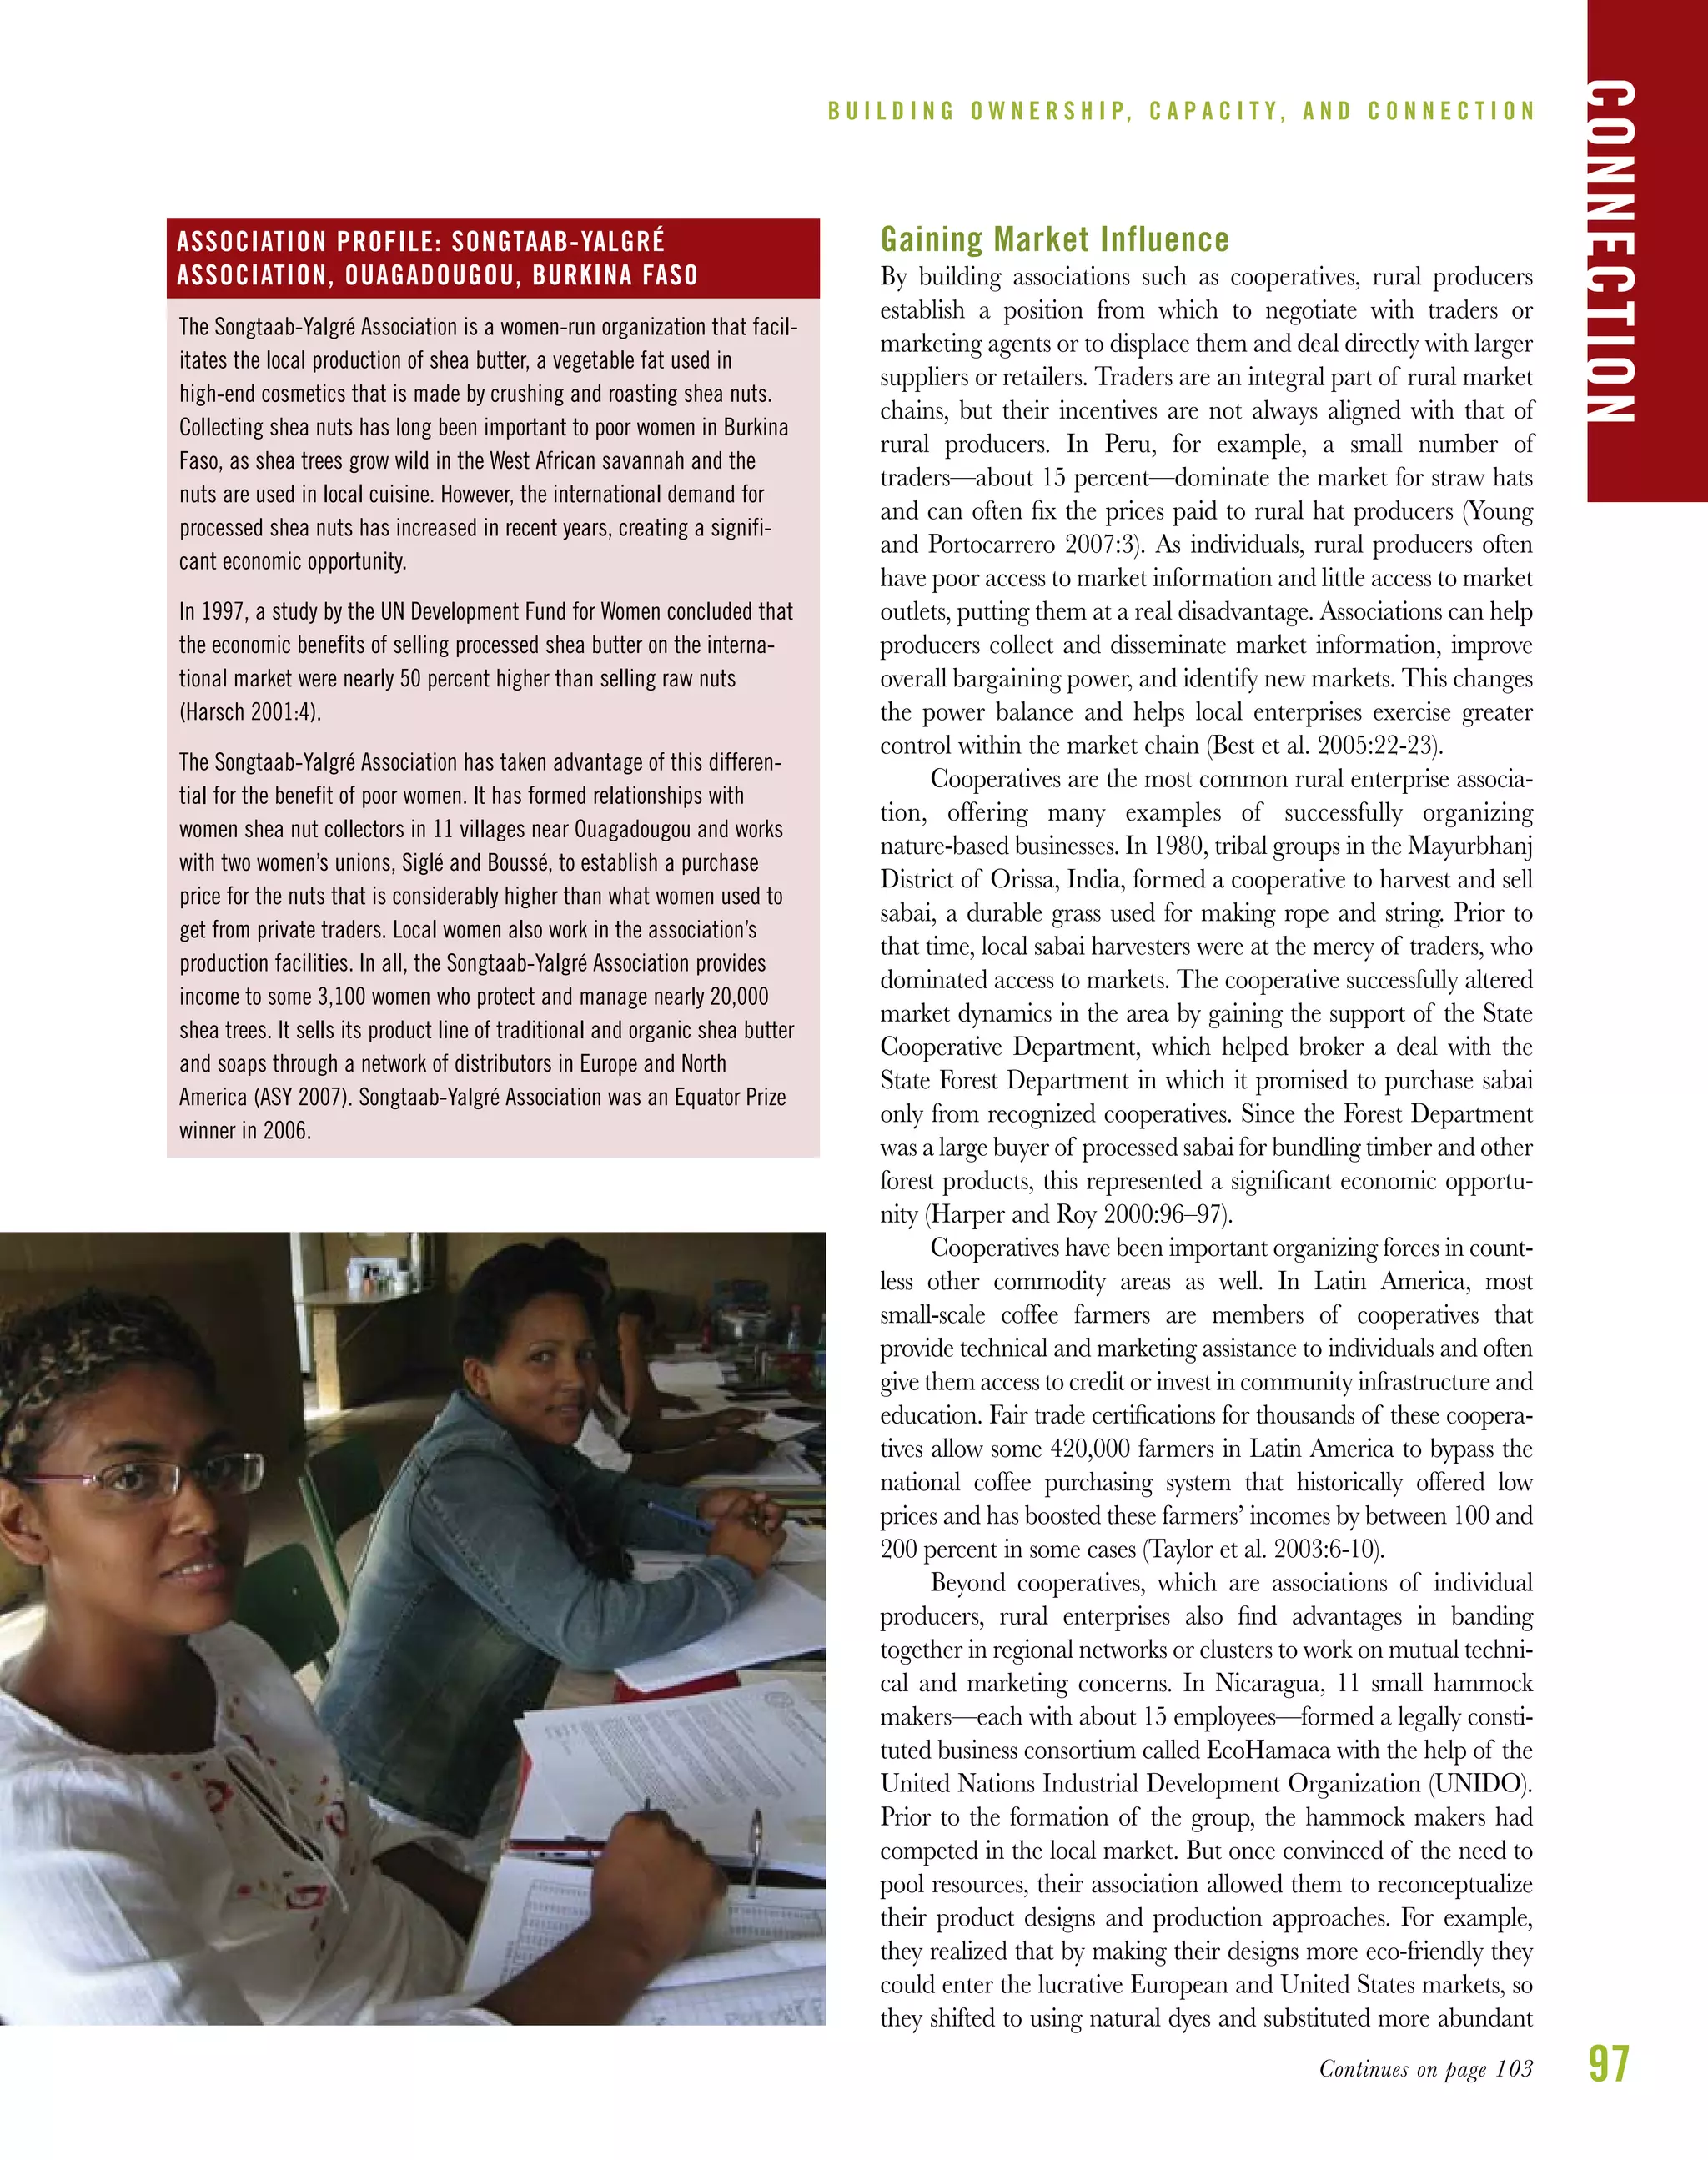
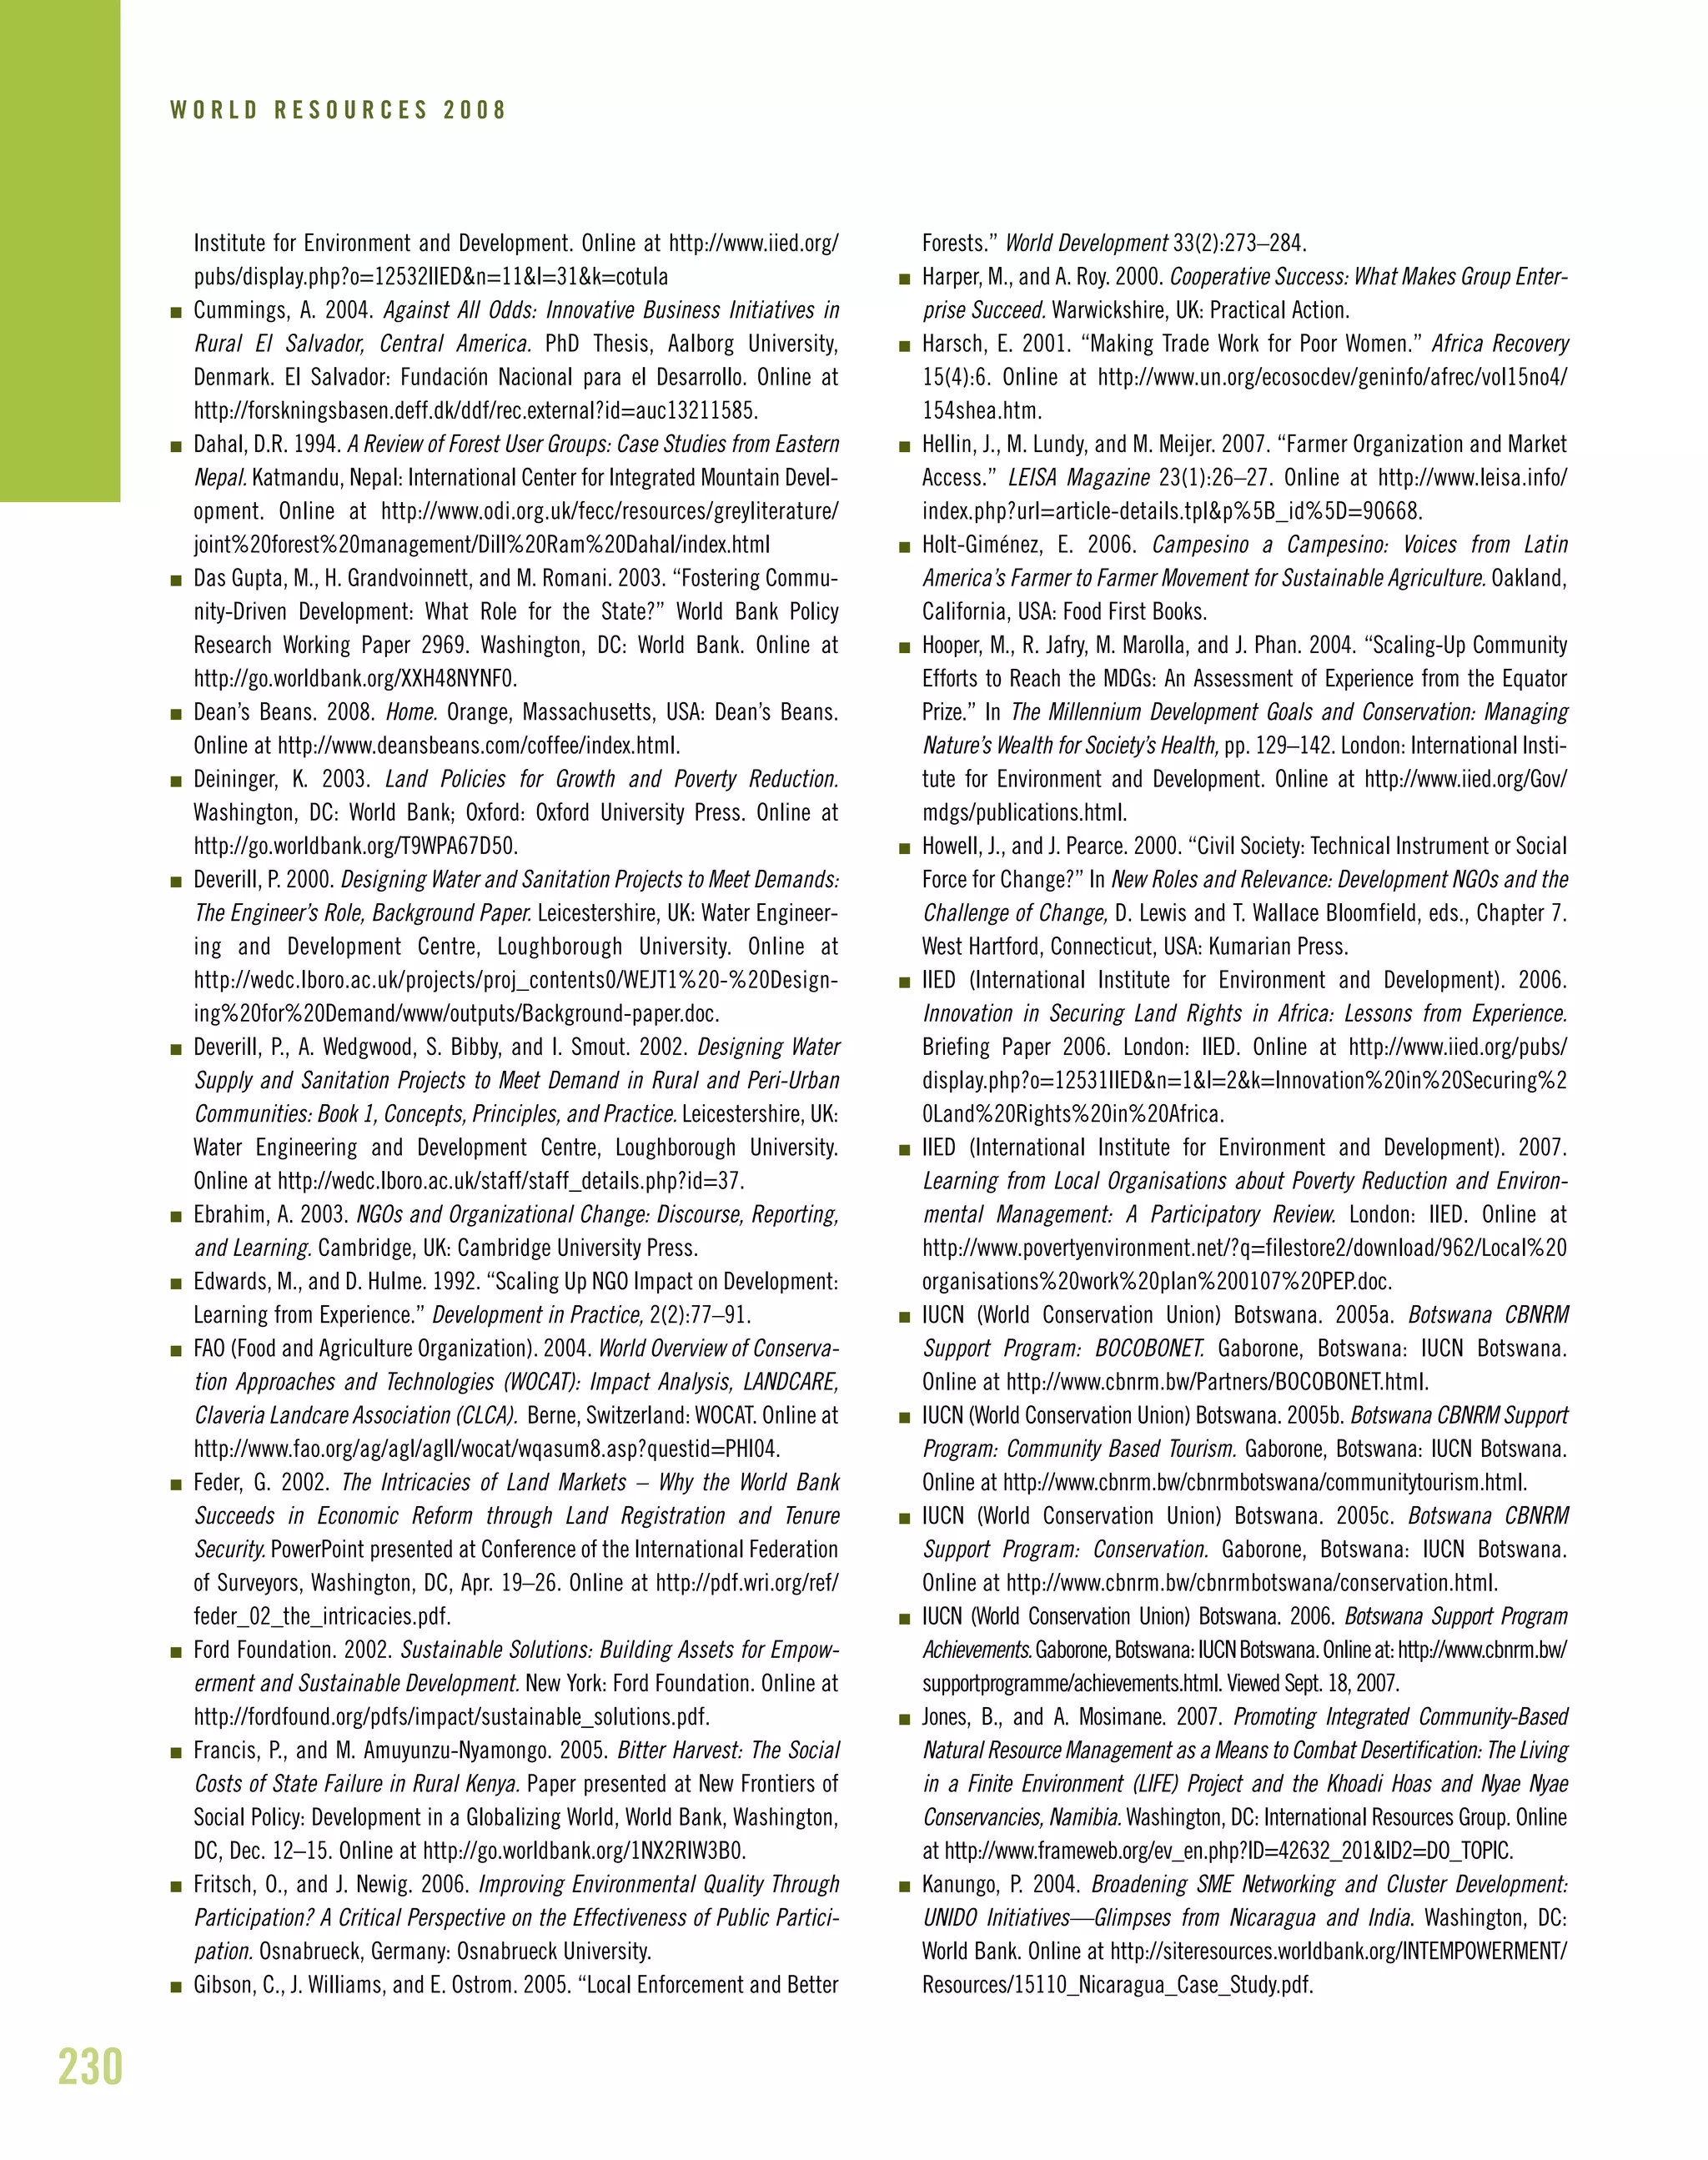
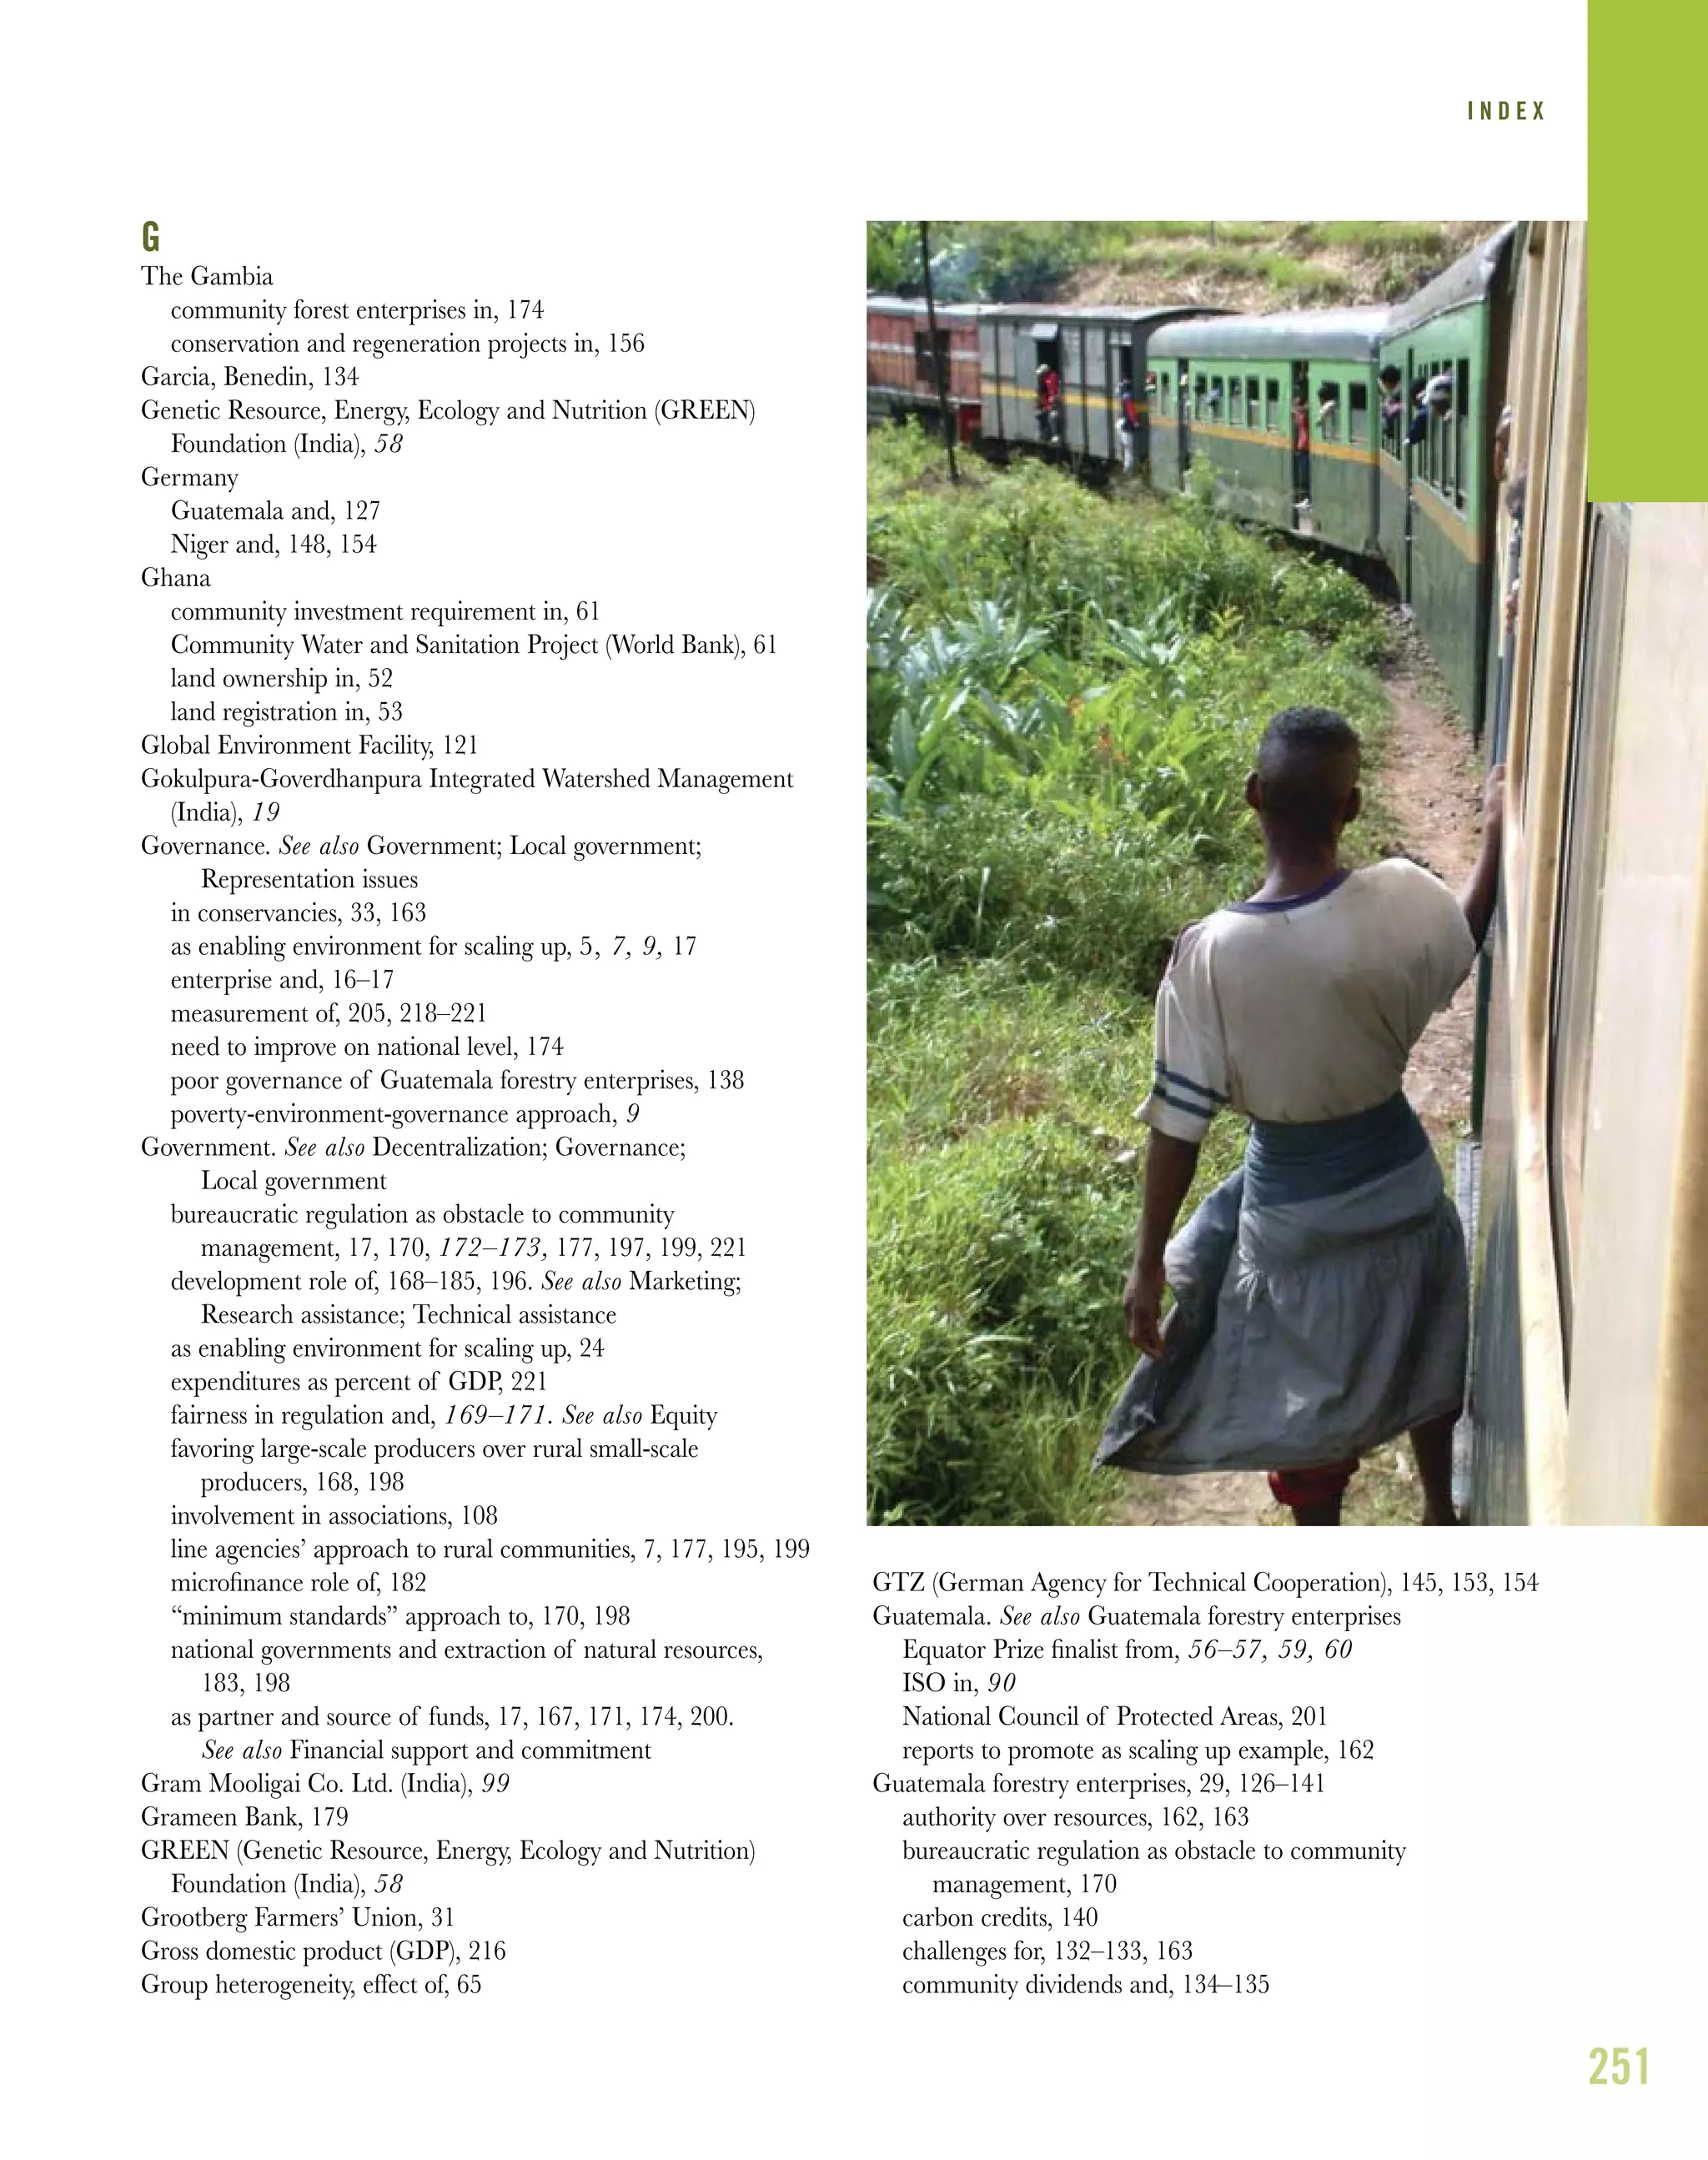
The ANAI Association, winner of the 2002 UN Equator Prize, describes itself
as a “grassroots support organization,” helping other grassroots groups in
Costa Rica’s Talamanca region to carry out sustainable agriculture projects
and conservation initiatives, from agroforestry to sea turtle conservation and
ecotourism (ANAI 2005a). ANAI grew out of a loose partnership between
North American biologists and Talamancan farmers in the late 1970s,
initially formed to provide technical support for conservation-focused
community development projects (ANAI 2005b). Since then, ANAI has used
training courses, seed grants, networking, and targeted research to support
the efforts of 20 grassroots conservation organizations, a 1,500-member
farmers’ cooperative, and 16 local ecotourism ventures (ANAI 2005c).
When ANAI first began working on agroforestry in the 1970s, there were few
local organizations to work with on the ground. As a result, while it was
providing seeds and training to community groups willing to participate in
agroforestry projects, ANAI also placed an early emphasis on building the
organizational and technical capacities of local groups. ANAI’s focus on local
capacity-building took a major step forward in 1991 when it established its
Regional Training Center. Here, ANAI offers agriculture, health, technology,
conservation, and leadership workshops to local indigenous communities
(ANAI 2005d). Over time, ANAI has evolved into a true intermediary support
organization, channeling funds to grassroots organizations and connecting
them to sources of technical, financial, and marketing support. It has also
become skilled in creating linkages to government agencies, research insti-
tutions, and international funders and in promoting the efforts of its clients
to these actors (Carroll 1992:217).
The substance and tenor of ANAI’s work has changed over the years, largely
as a result of the organization’s own success. For instance, ANAI began its
efforts to conserve Leatherback sea turtles in 1985, concentrating initially on
reducing poaching by protecting the beach of the Gandoca-Manzanillo Wildlife
Refuge, where the turtles came ashore to breed. Between 1985 and 2004,
ANAI developed an entire program to achieve both development and conserva-
tion goals through scientific monitoring, community outreach and education,
and ecotourism. By 2003, the new ecotourism ventures were generating over
US$93,000 for the coastal communities, and poaching was virtually non-
existent (ANAI 2005e). The project had become so successful that ANAI’s
central coordinating role no longer seemed appropriate. The project spun off
from ANAI and joined WIDECAST, a global network of turtle conservation
groups and researchers (WIDECAST Latin American Program 2007).
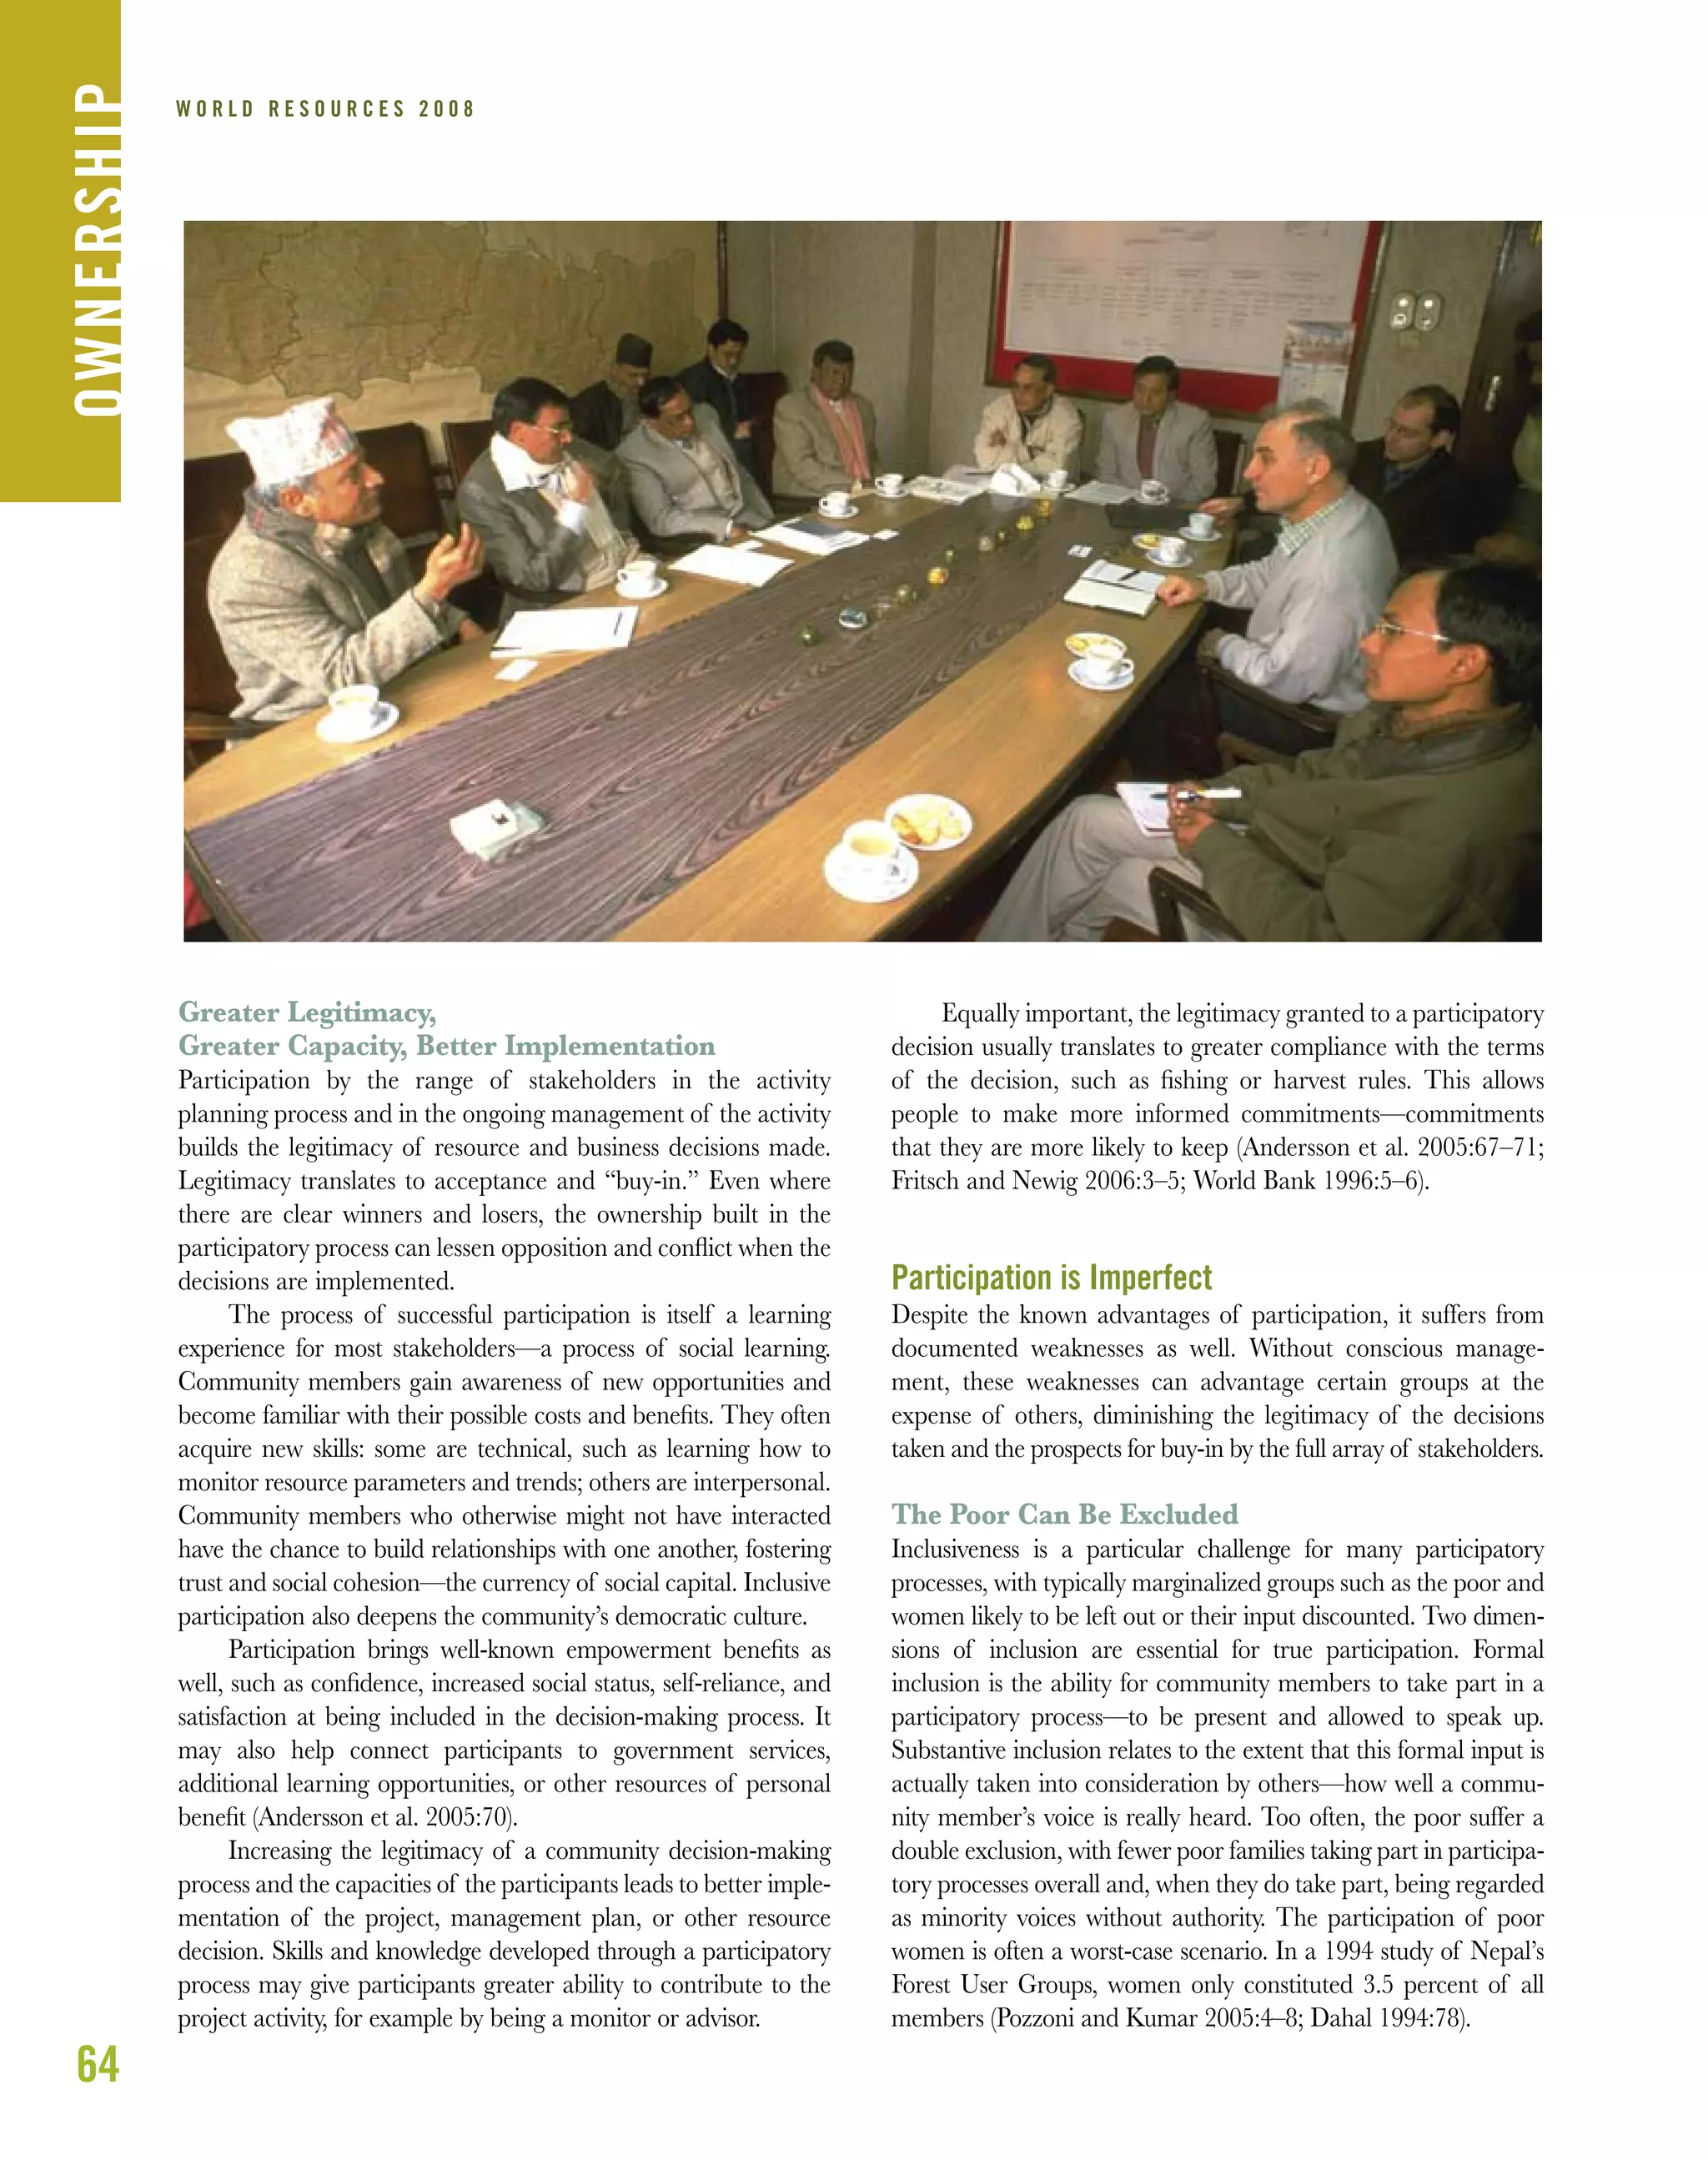
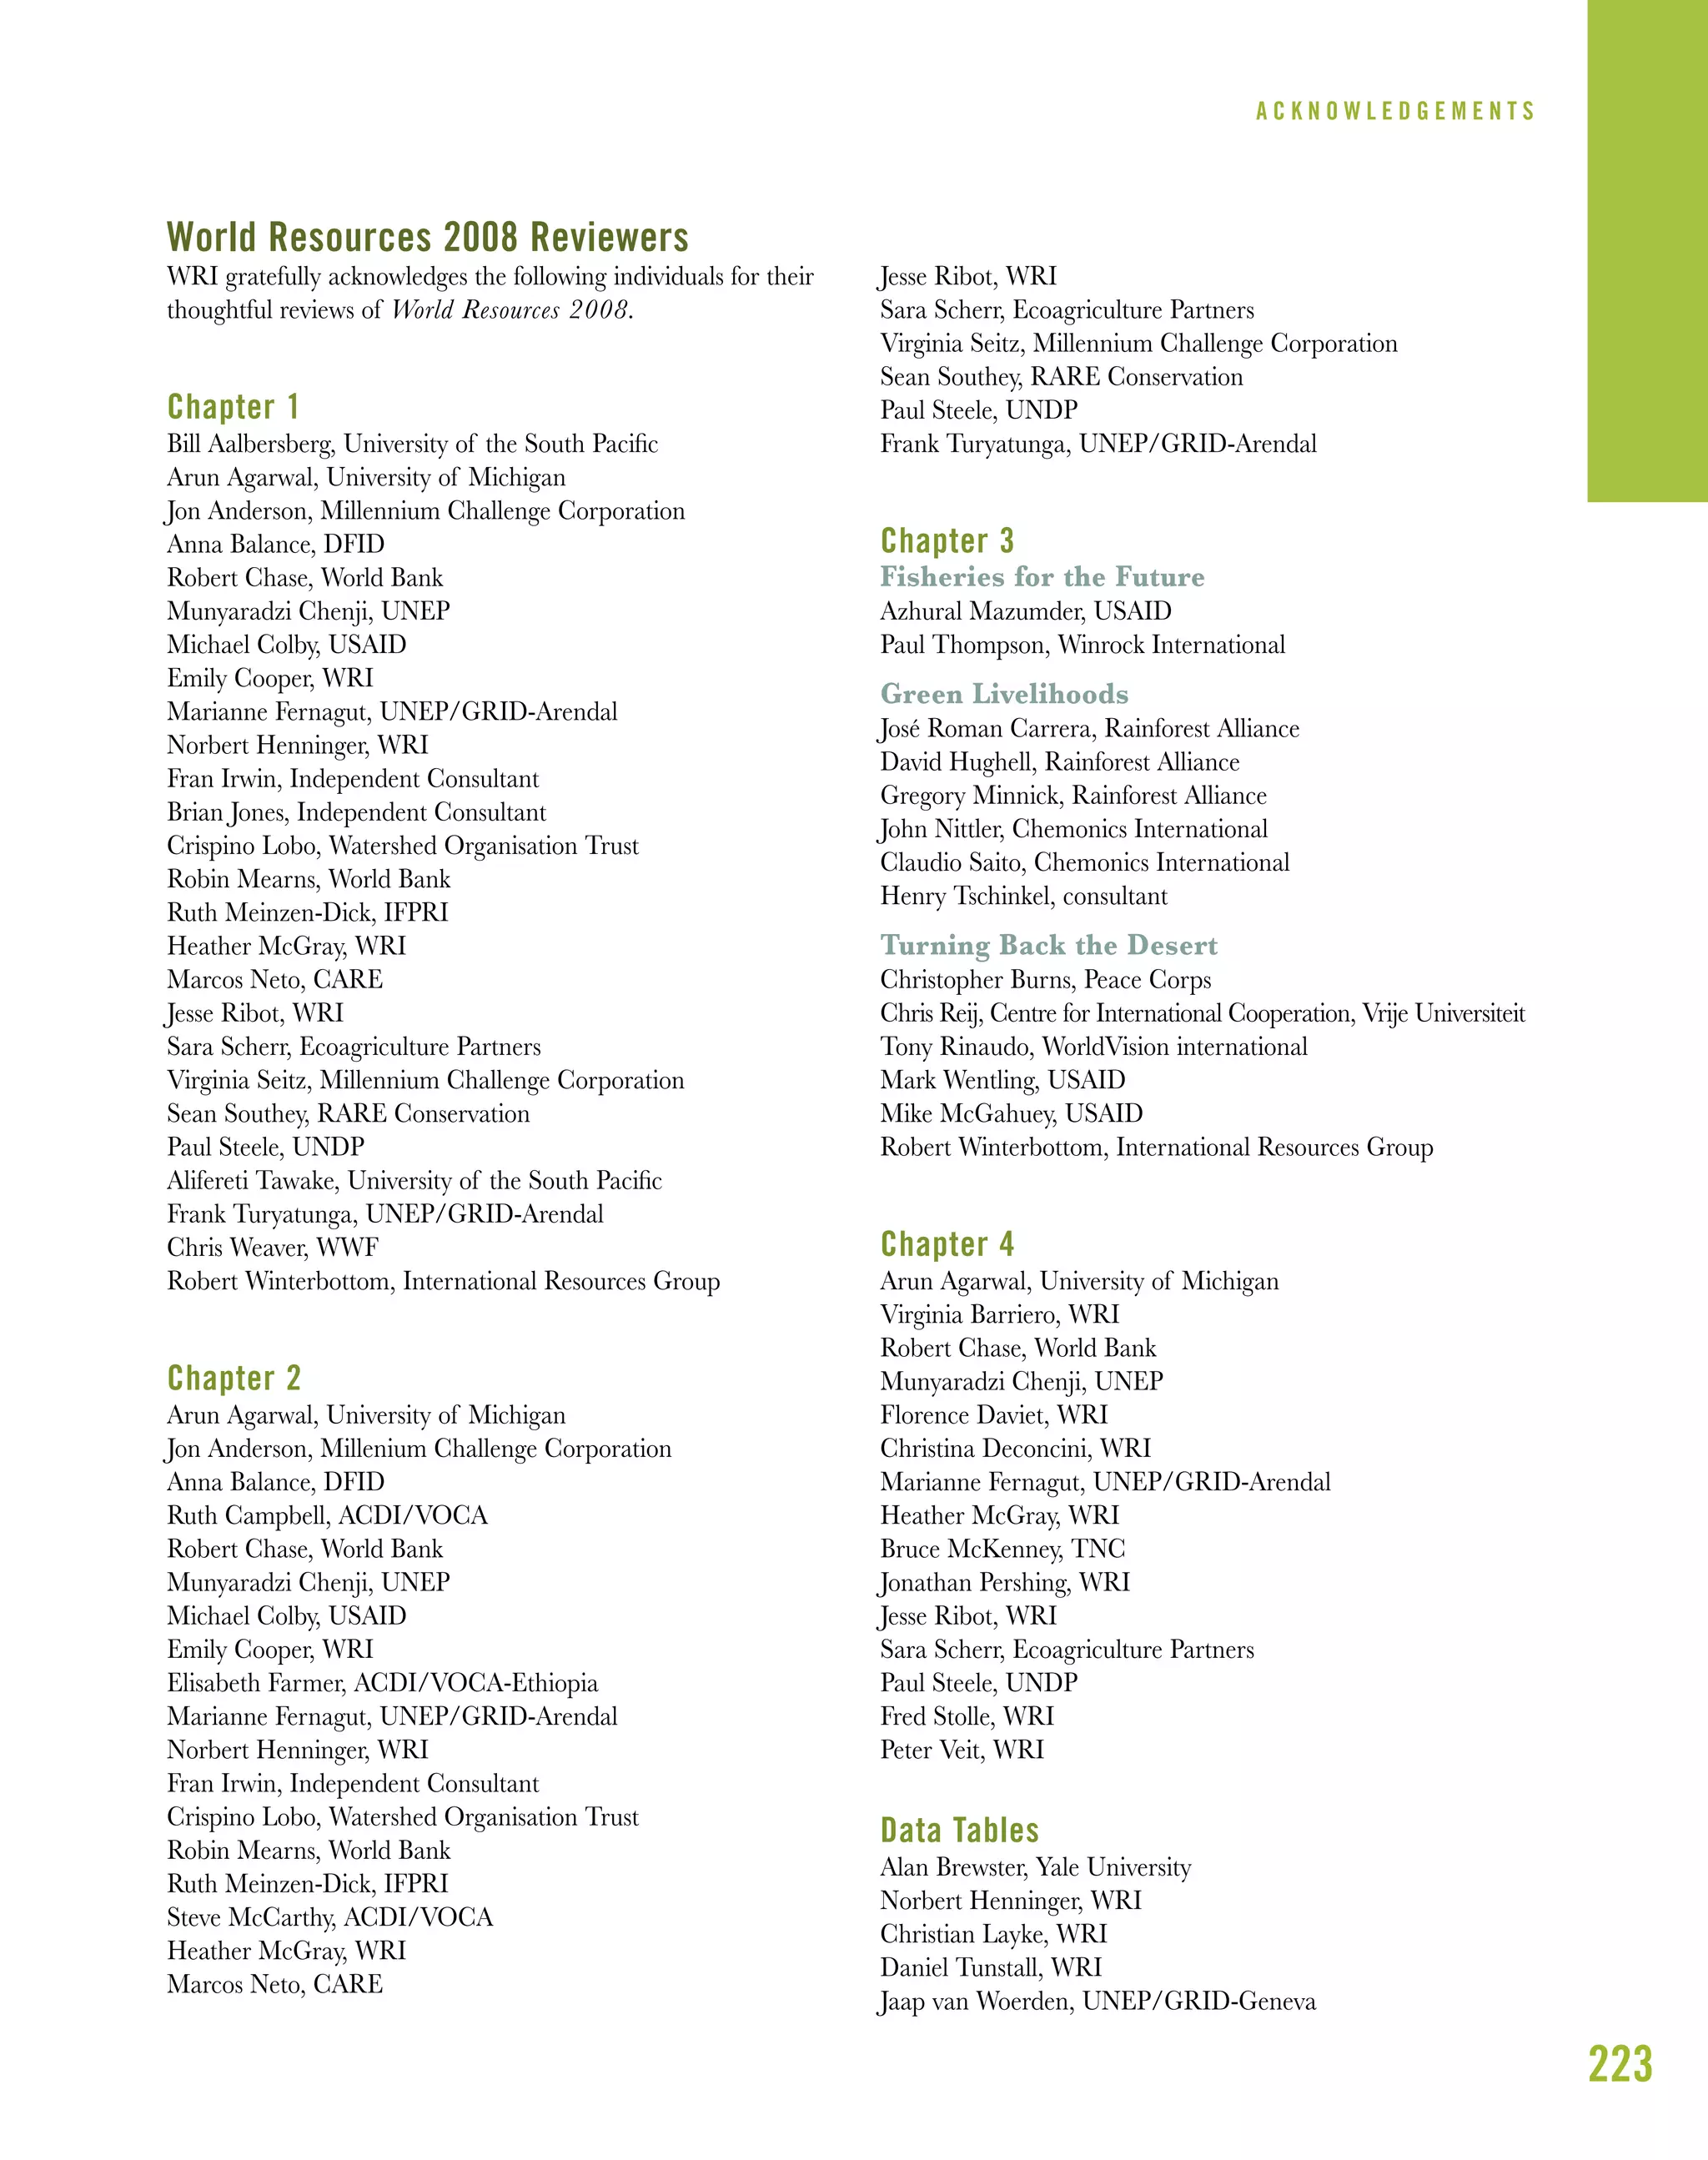
ISO PROFILE: ANAI ASSOCIATION, TALAMANCA, COSTA RICA
ANAI views the spin-off as a mark of its success and its evolution. In fact,
its stated purpose is to become part of the local fabric of support, function-
ing as just one node in a network of self-sufficient local organizations. In
ANAI’s own words: “The role of locally based Grassroots Support Organiza-
tions like ANAI is increasingly recognized as a necessary part of what may be
called an ‘ecology of organizations,’ including specialized technical aid
groups, donors, lending institutions, advocacy and watchdog groups,
government agencies, and grassroots or ‘base’ groups….At every stage it
has been appropriate for us to ask ourselves what we should be doing for
others and what we should be training our neighbors to do [themselves].
Increasingly, though, local groups are taking the initiative to let us know
what they think they can do, and what they would like to learn to do, and
where they need help” (ANAI 2005a).
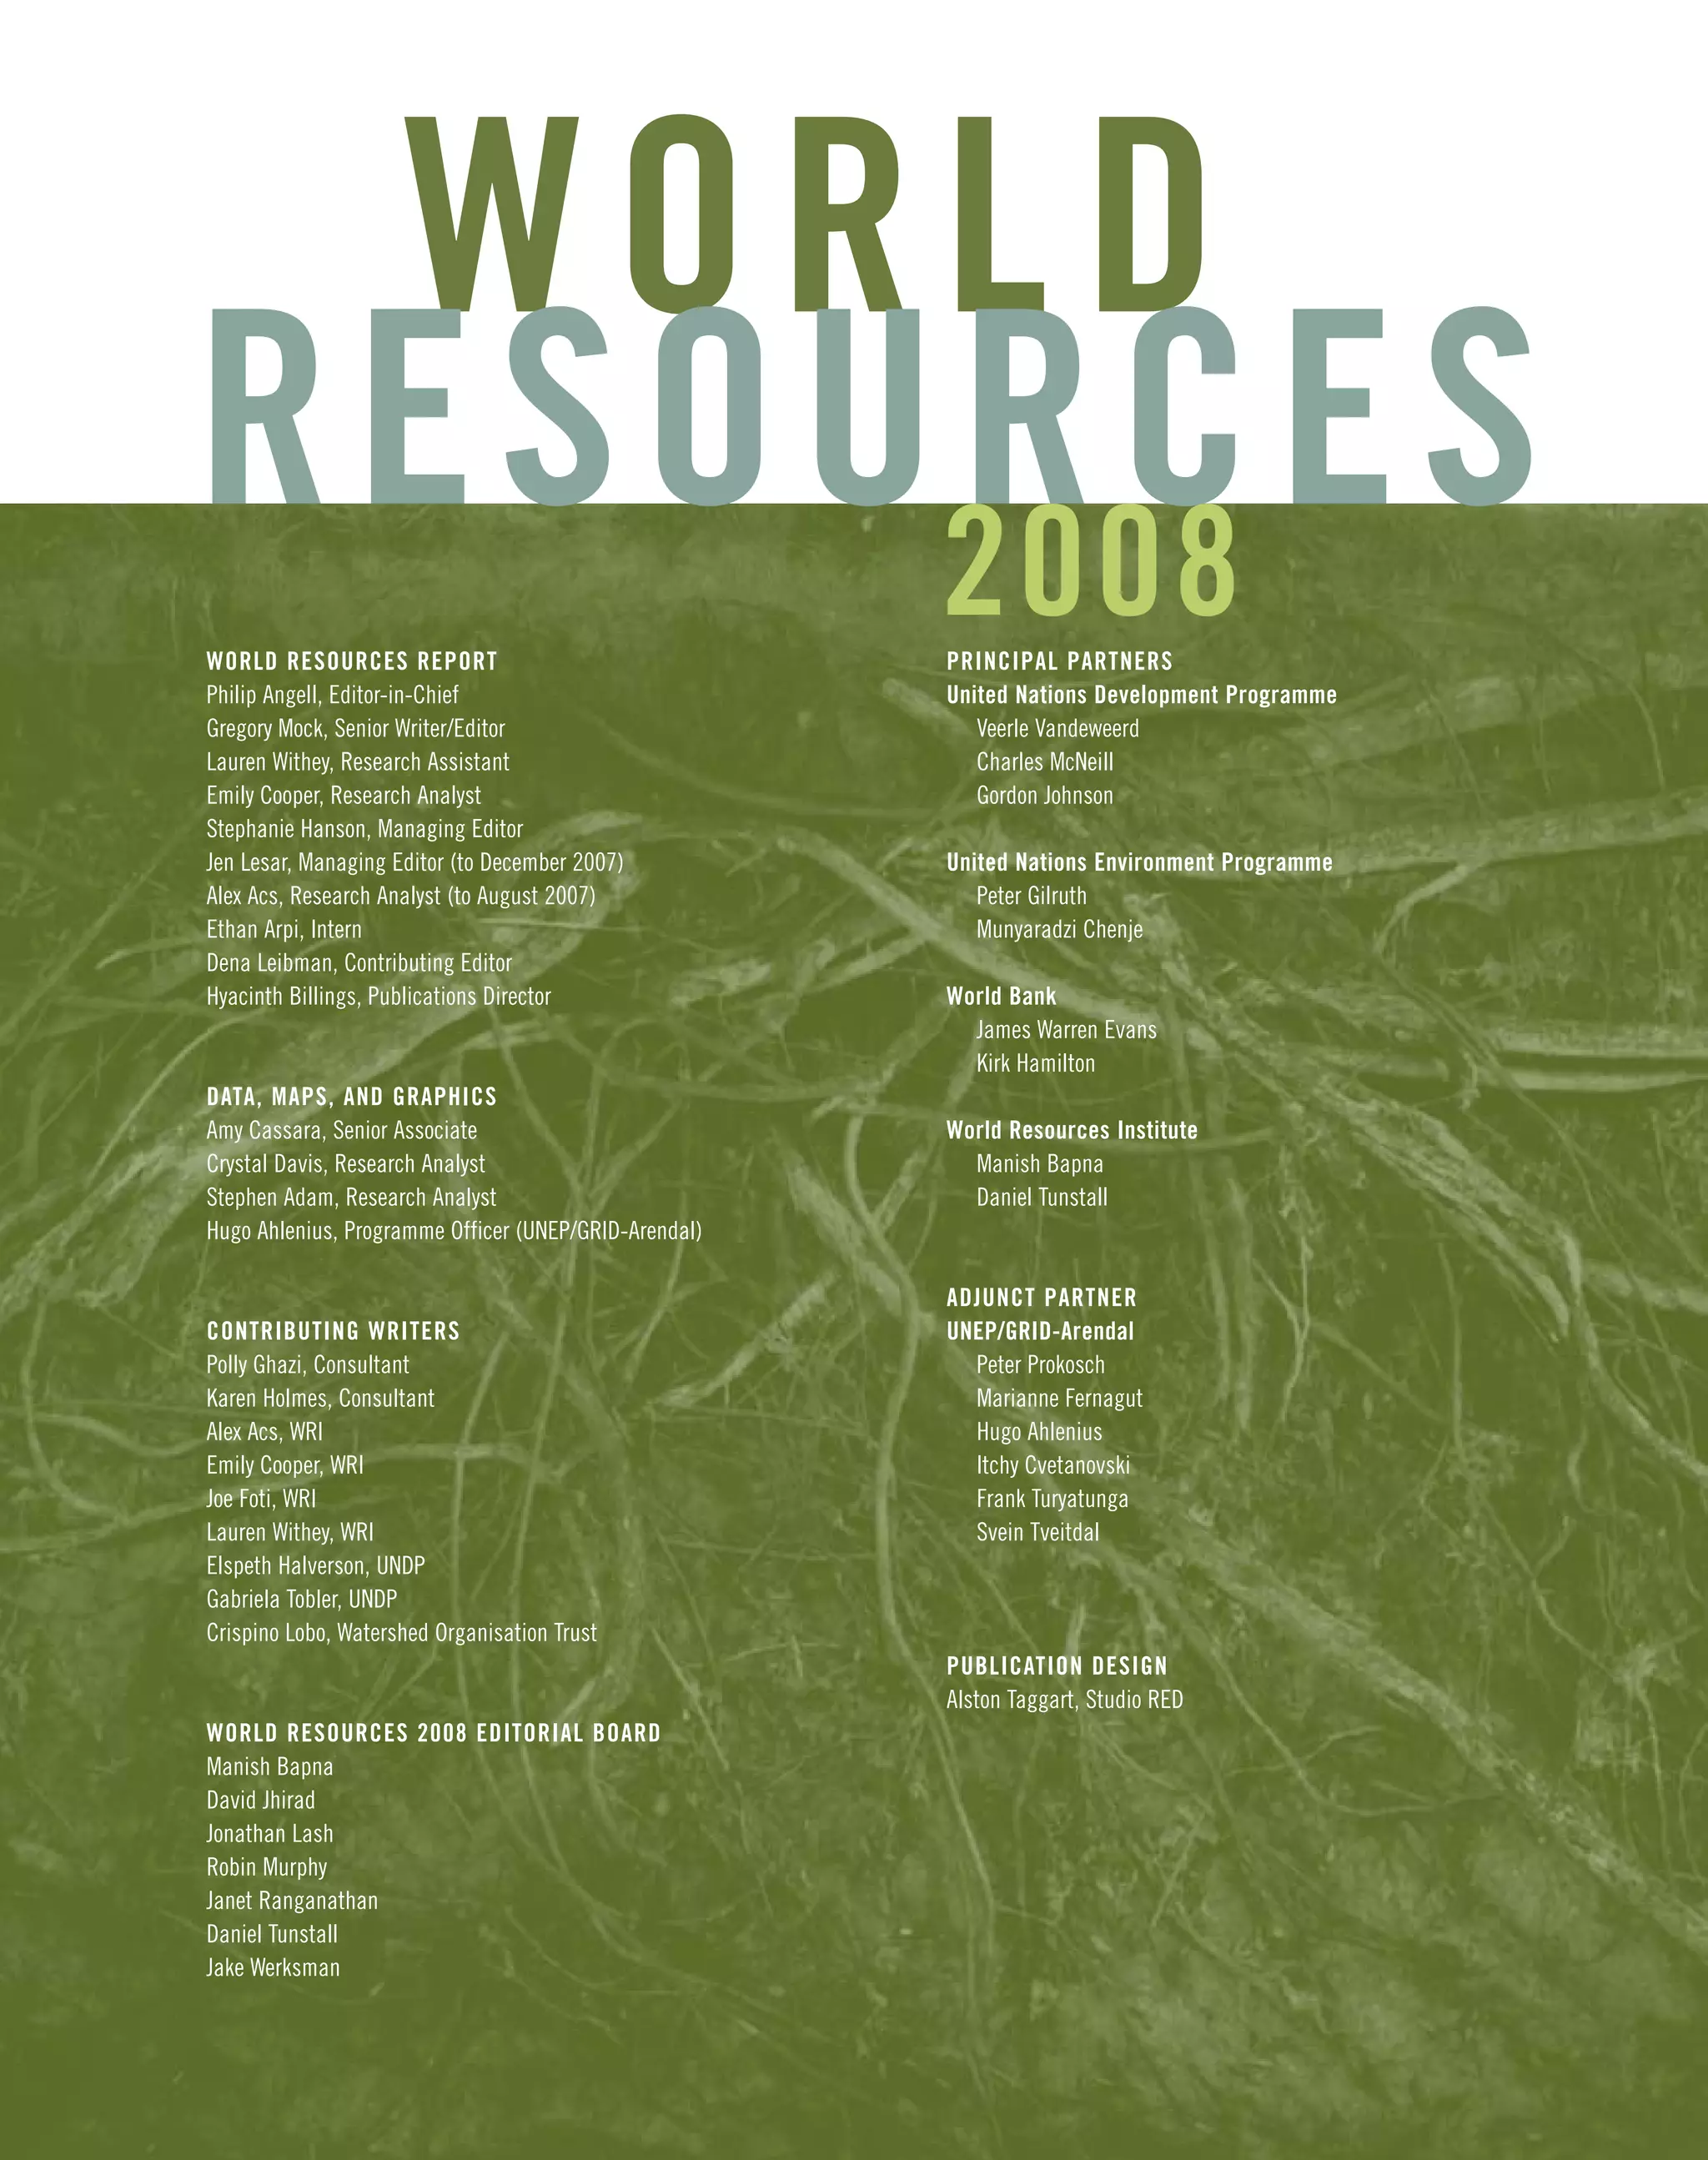
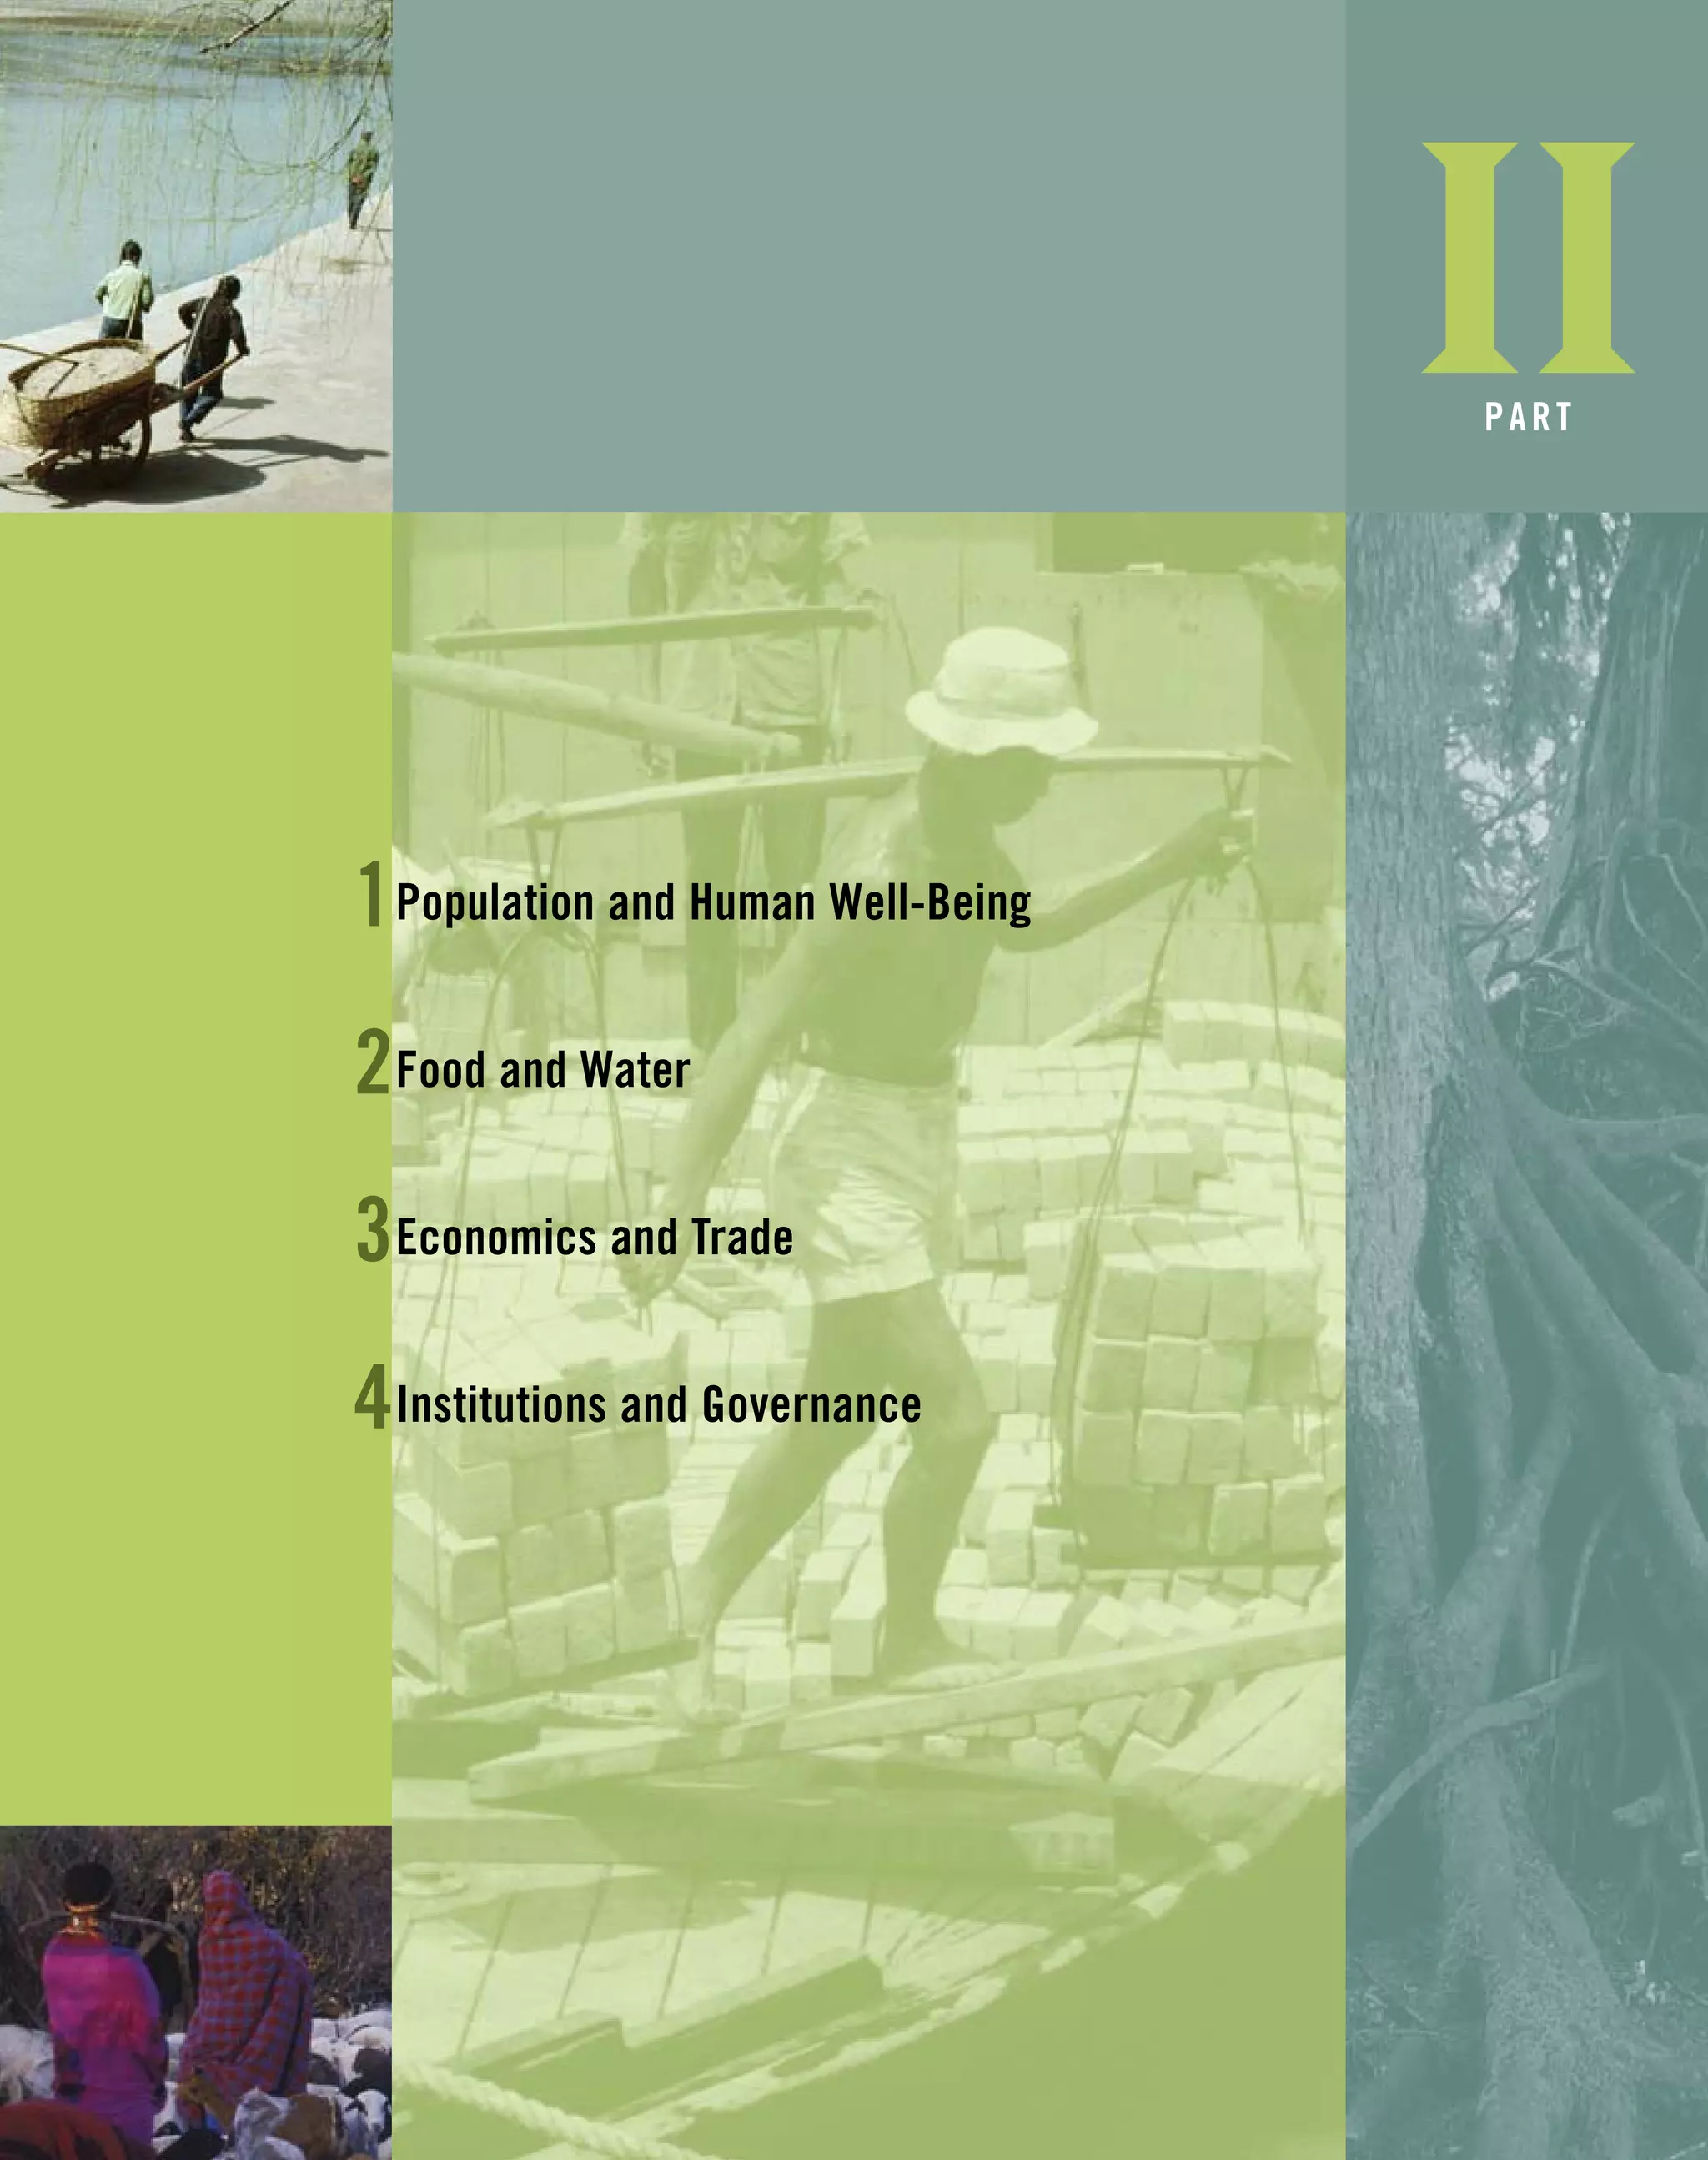
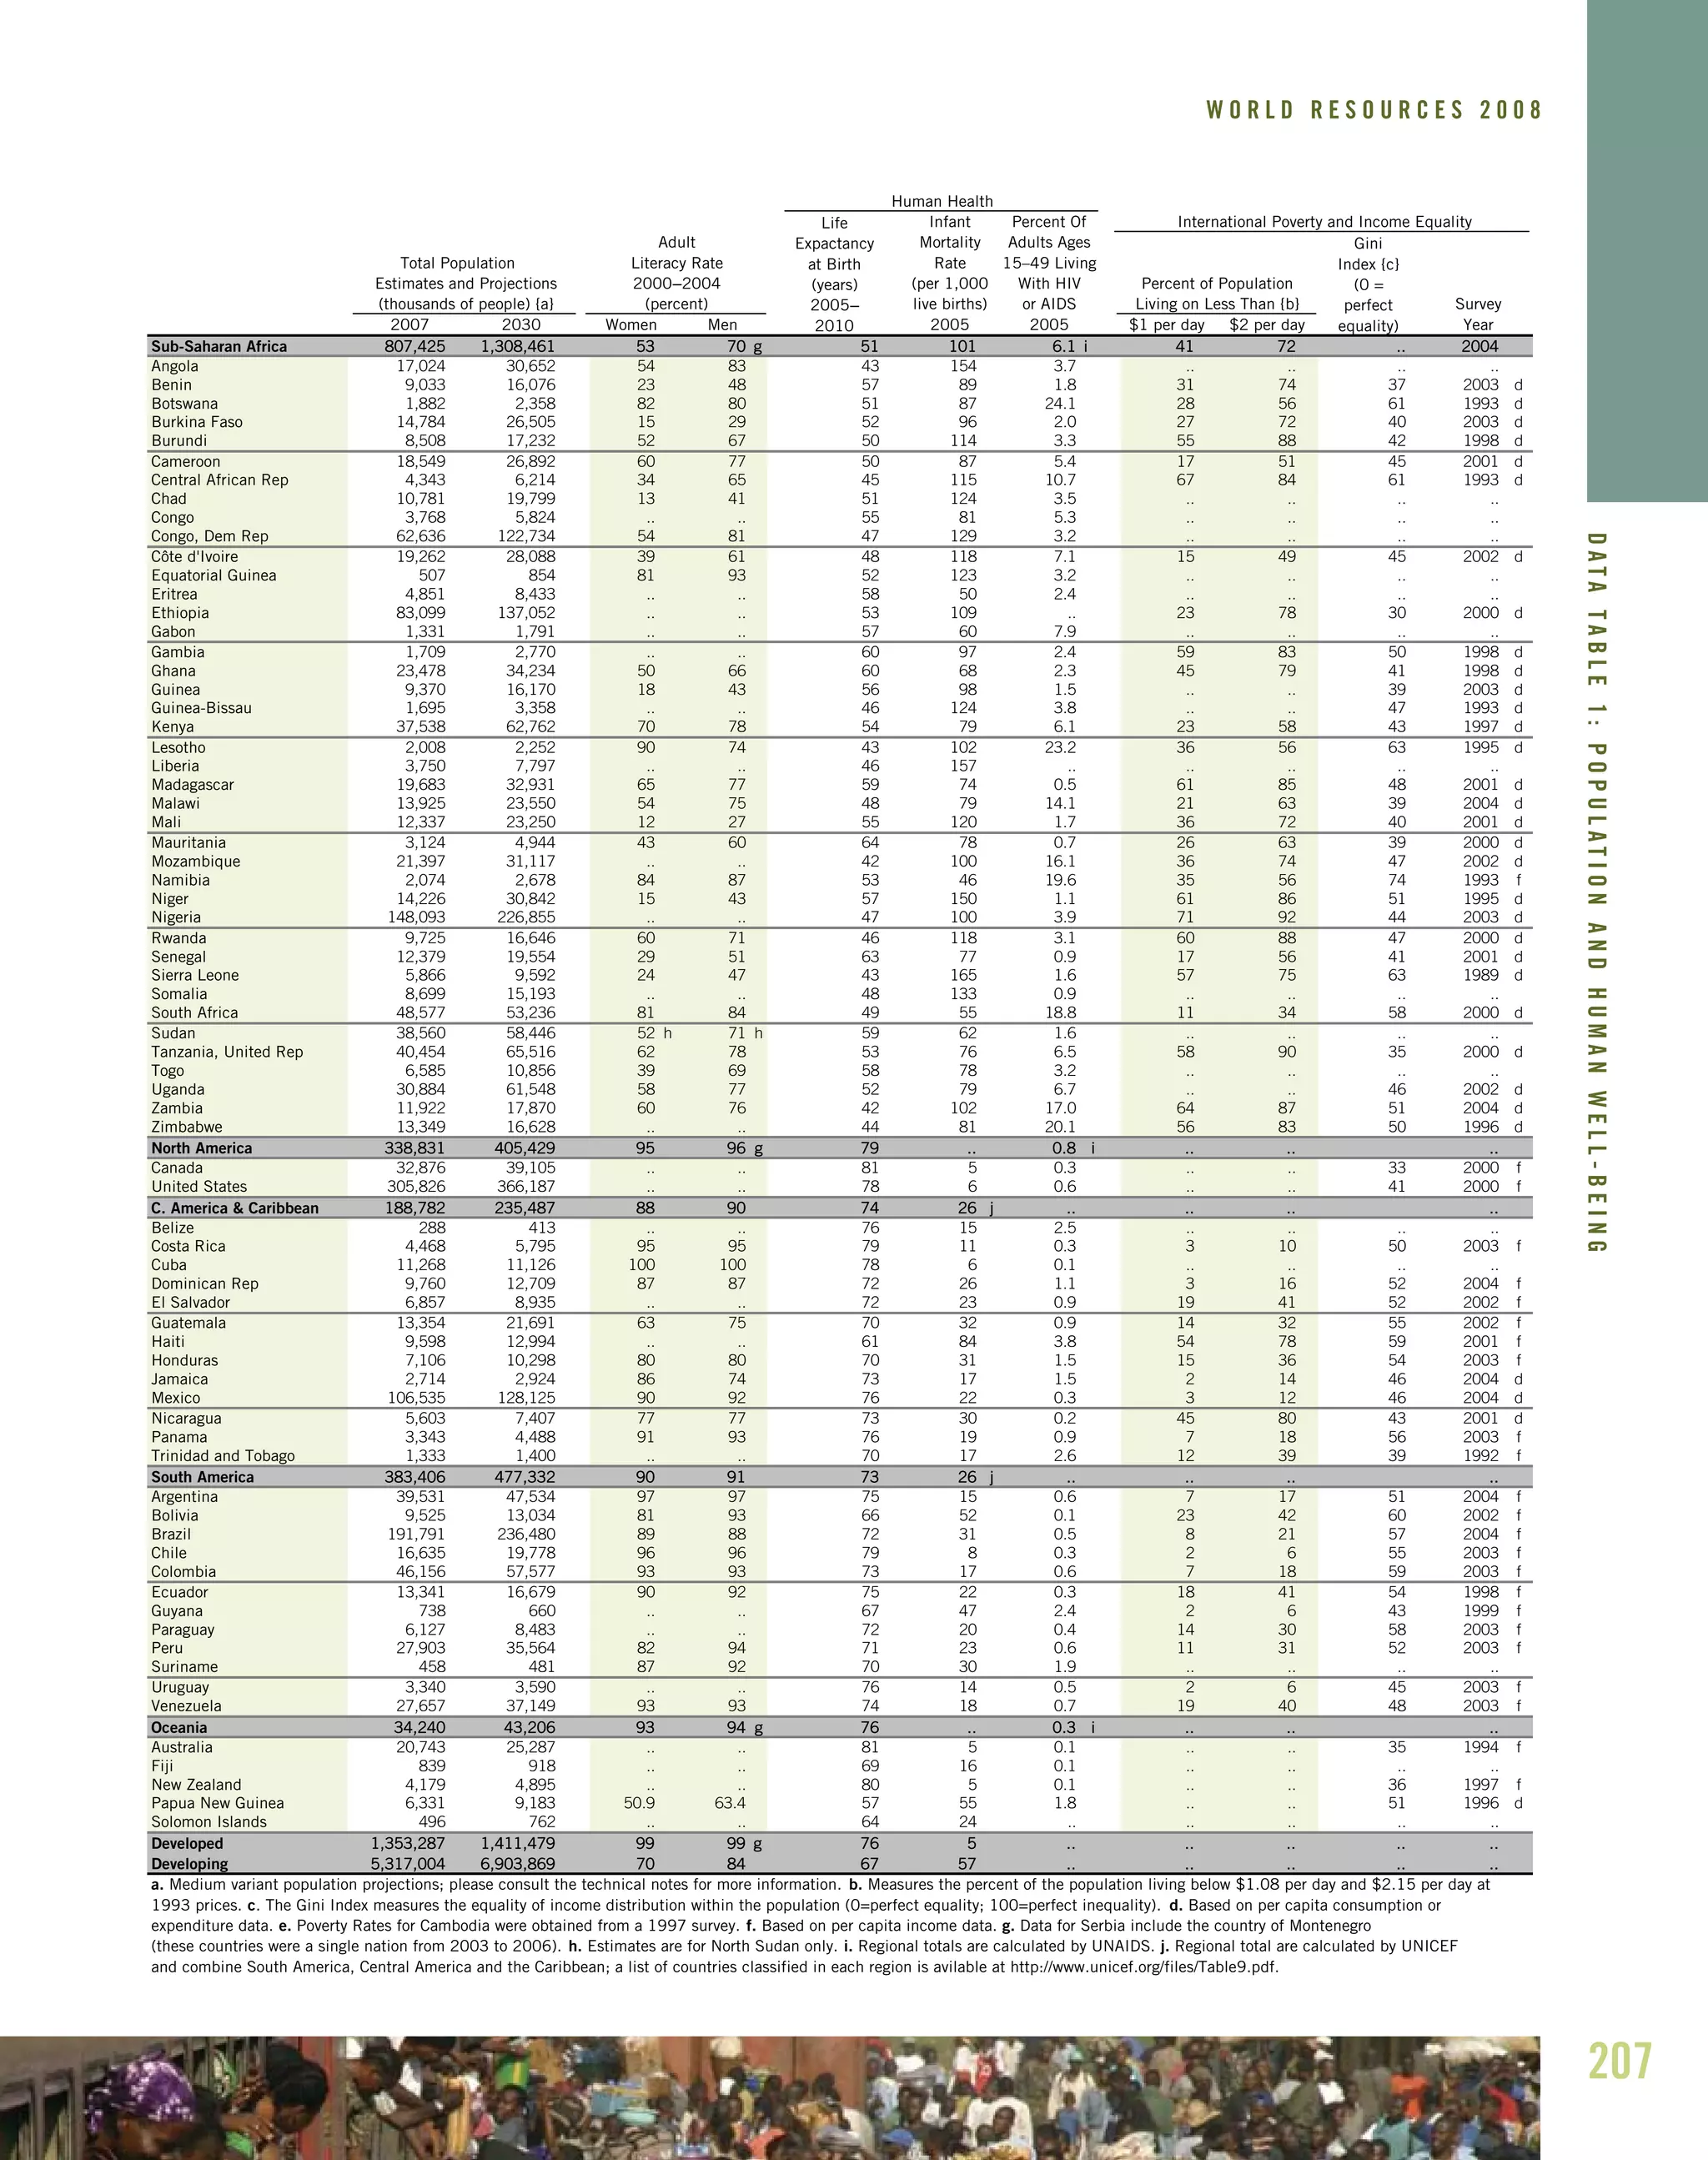
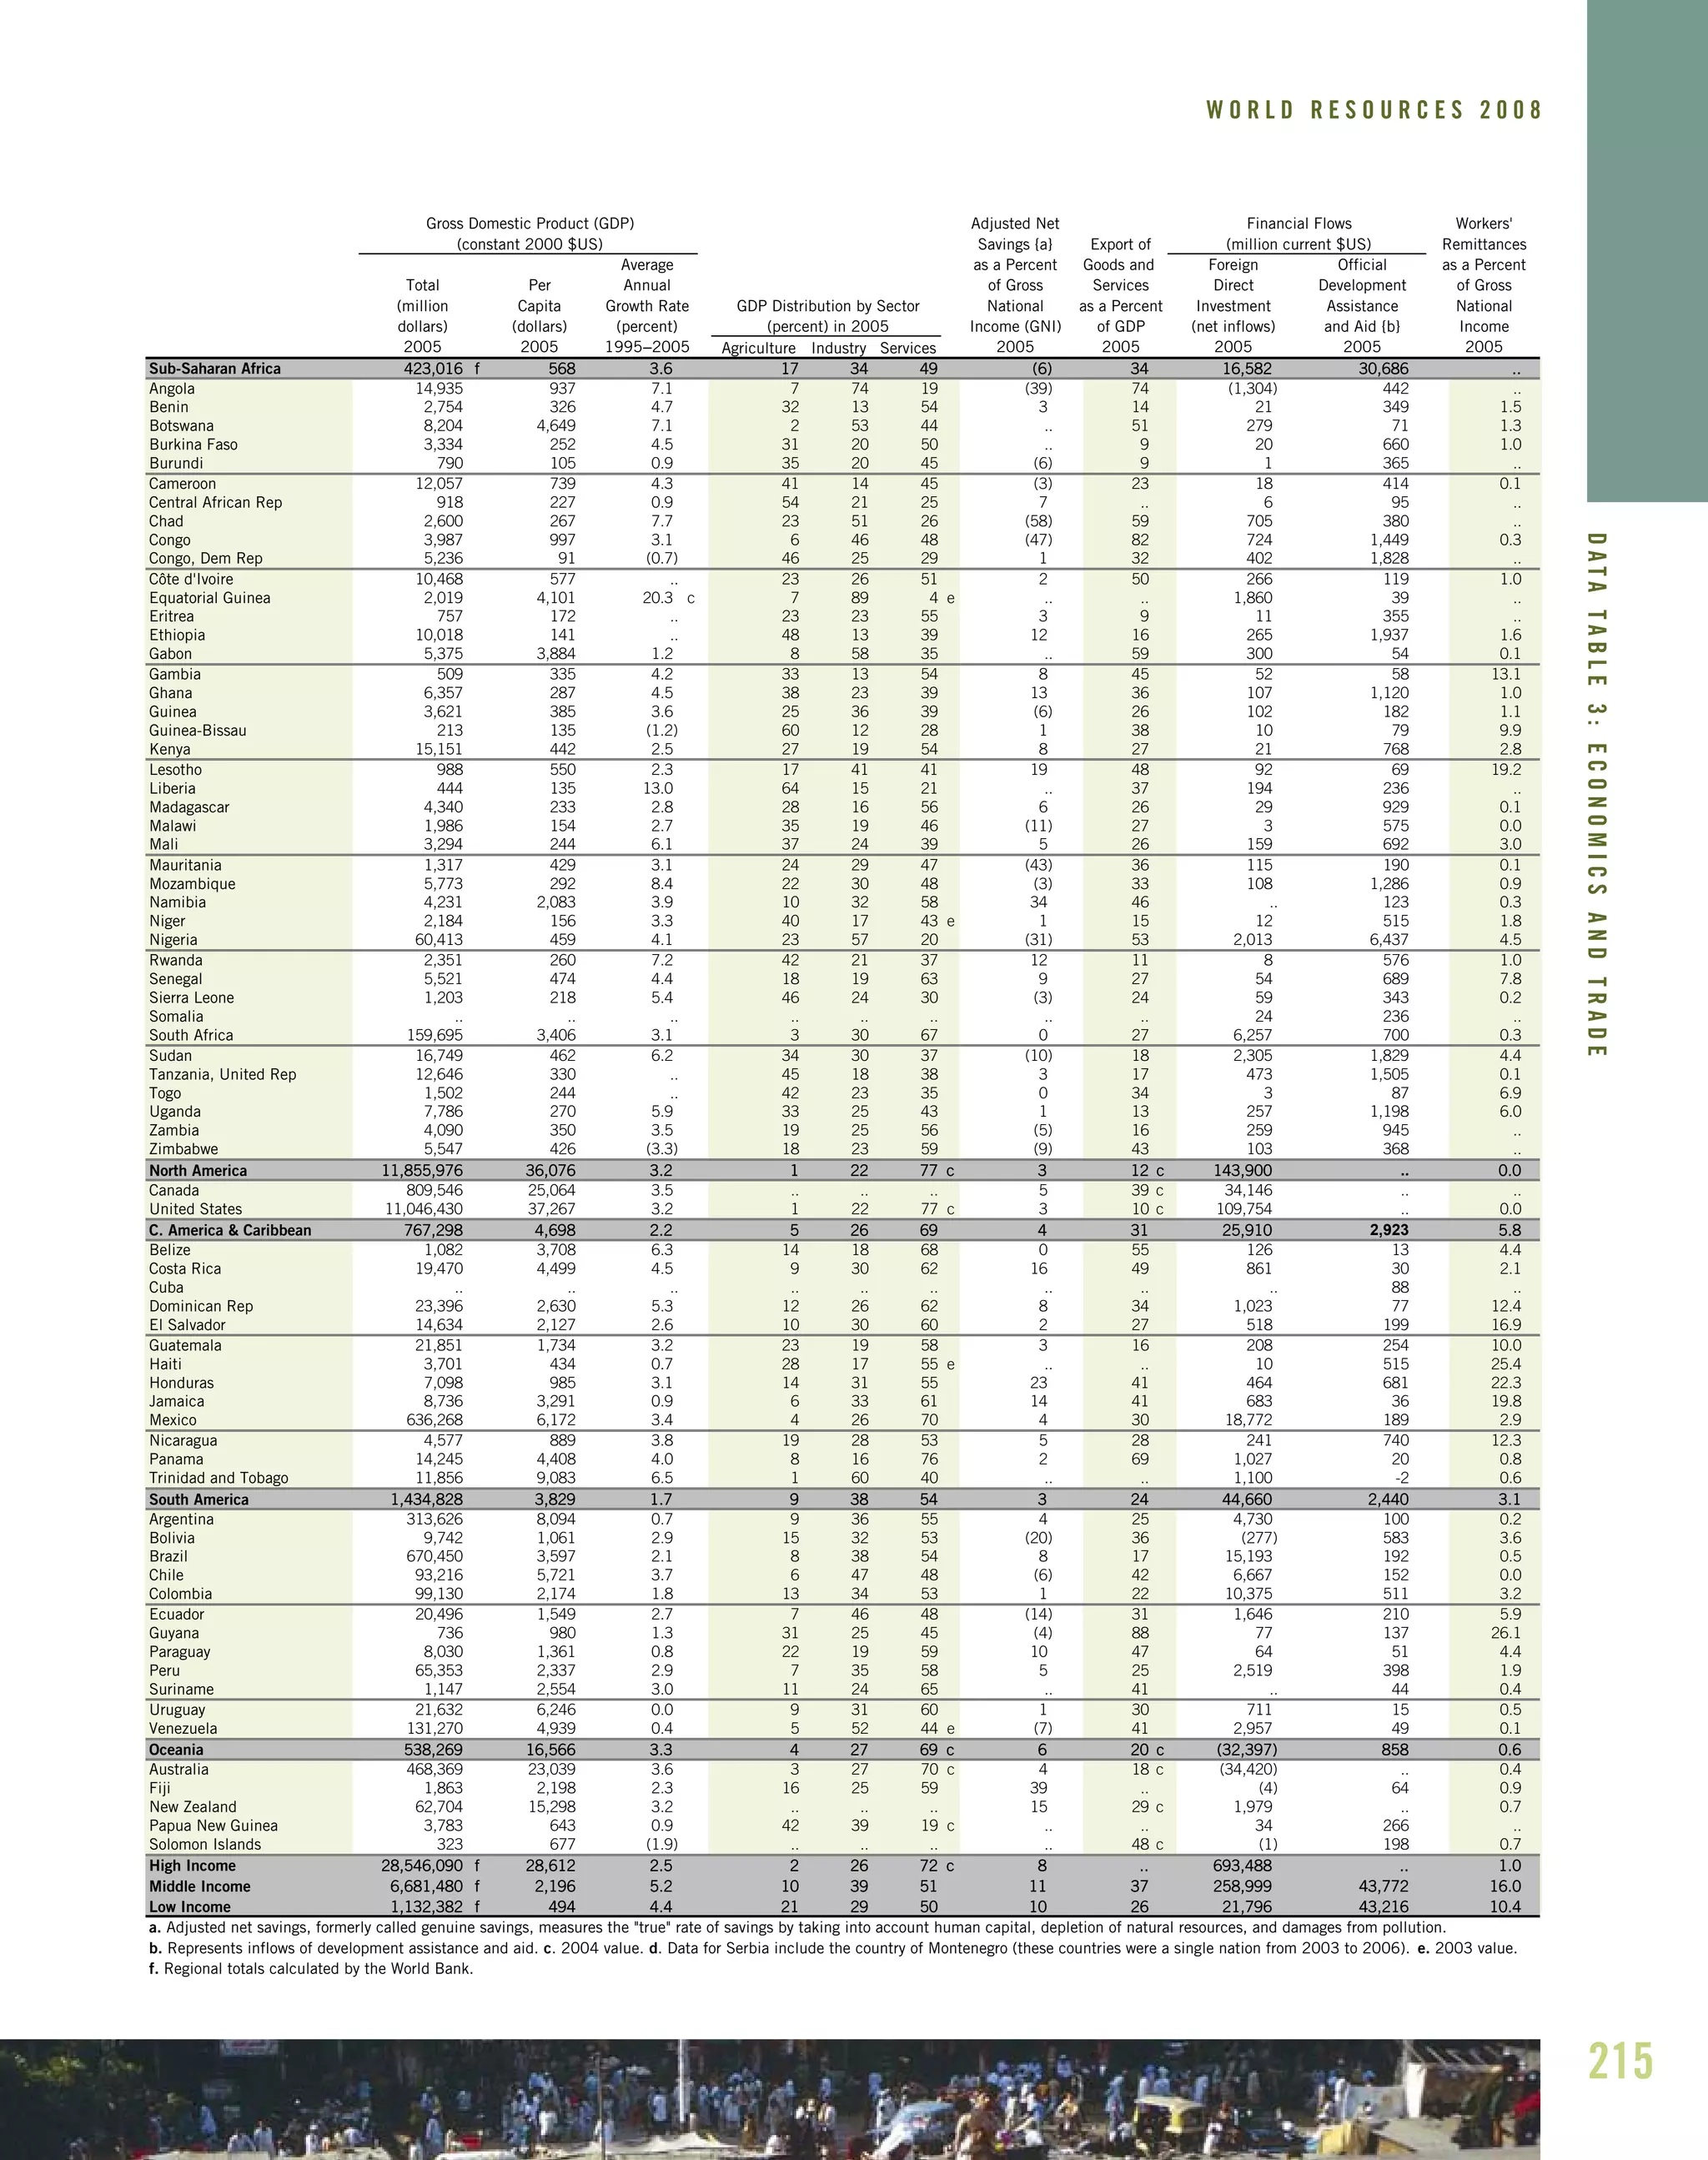
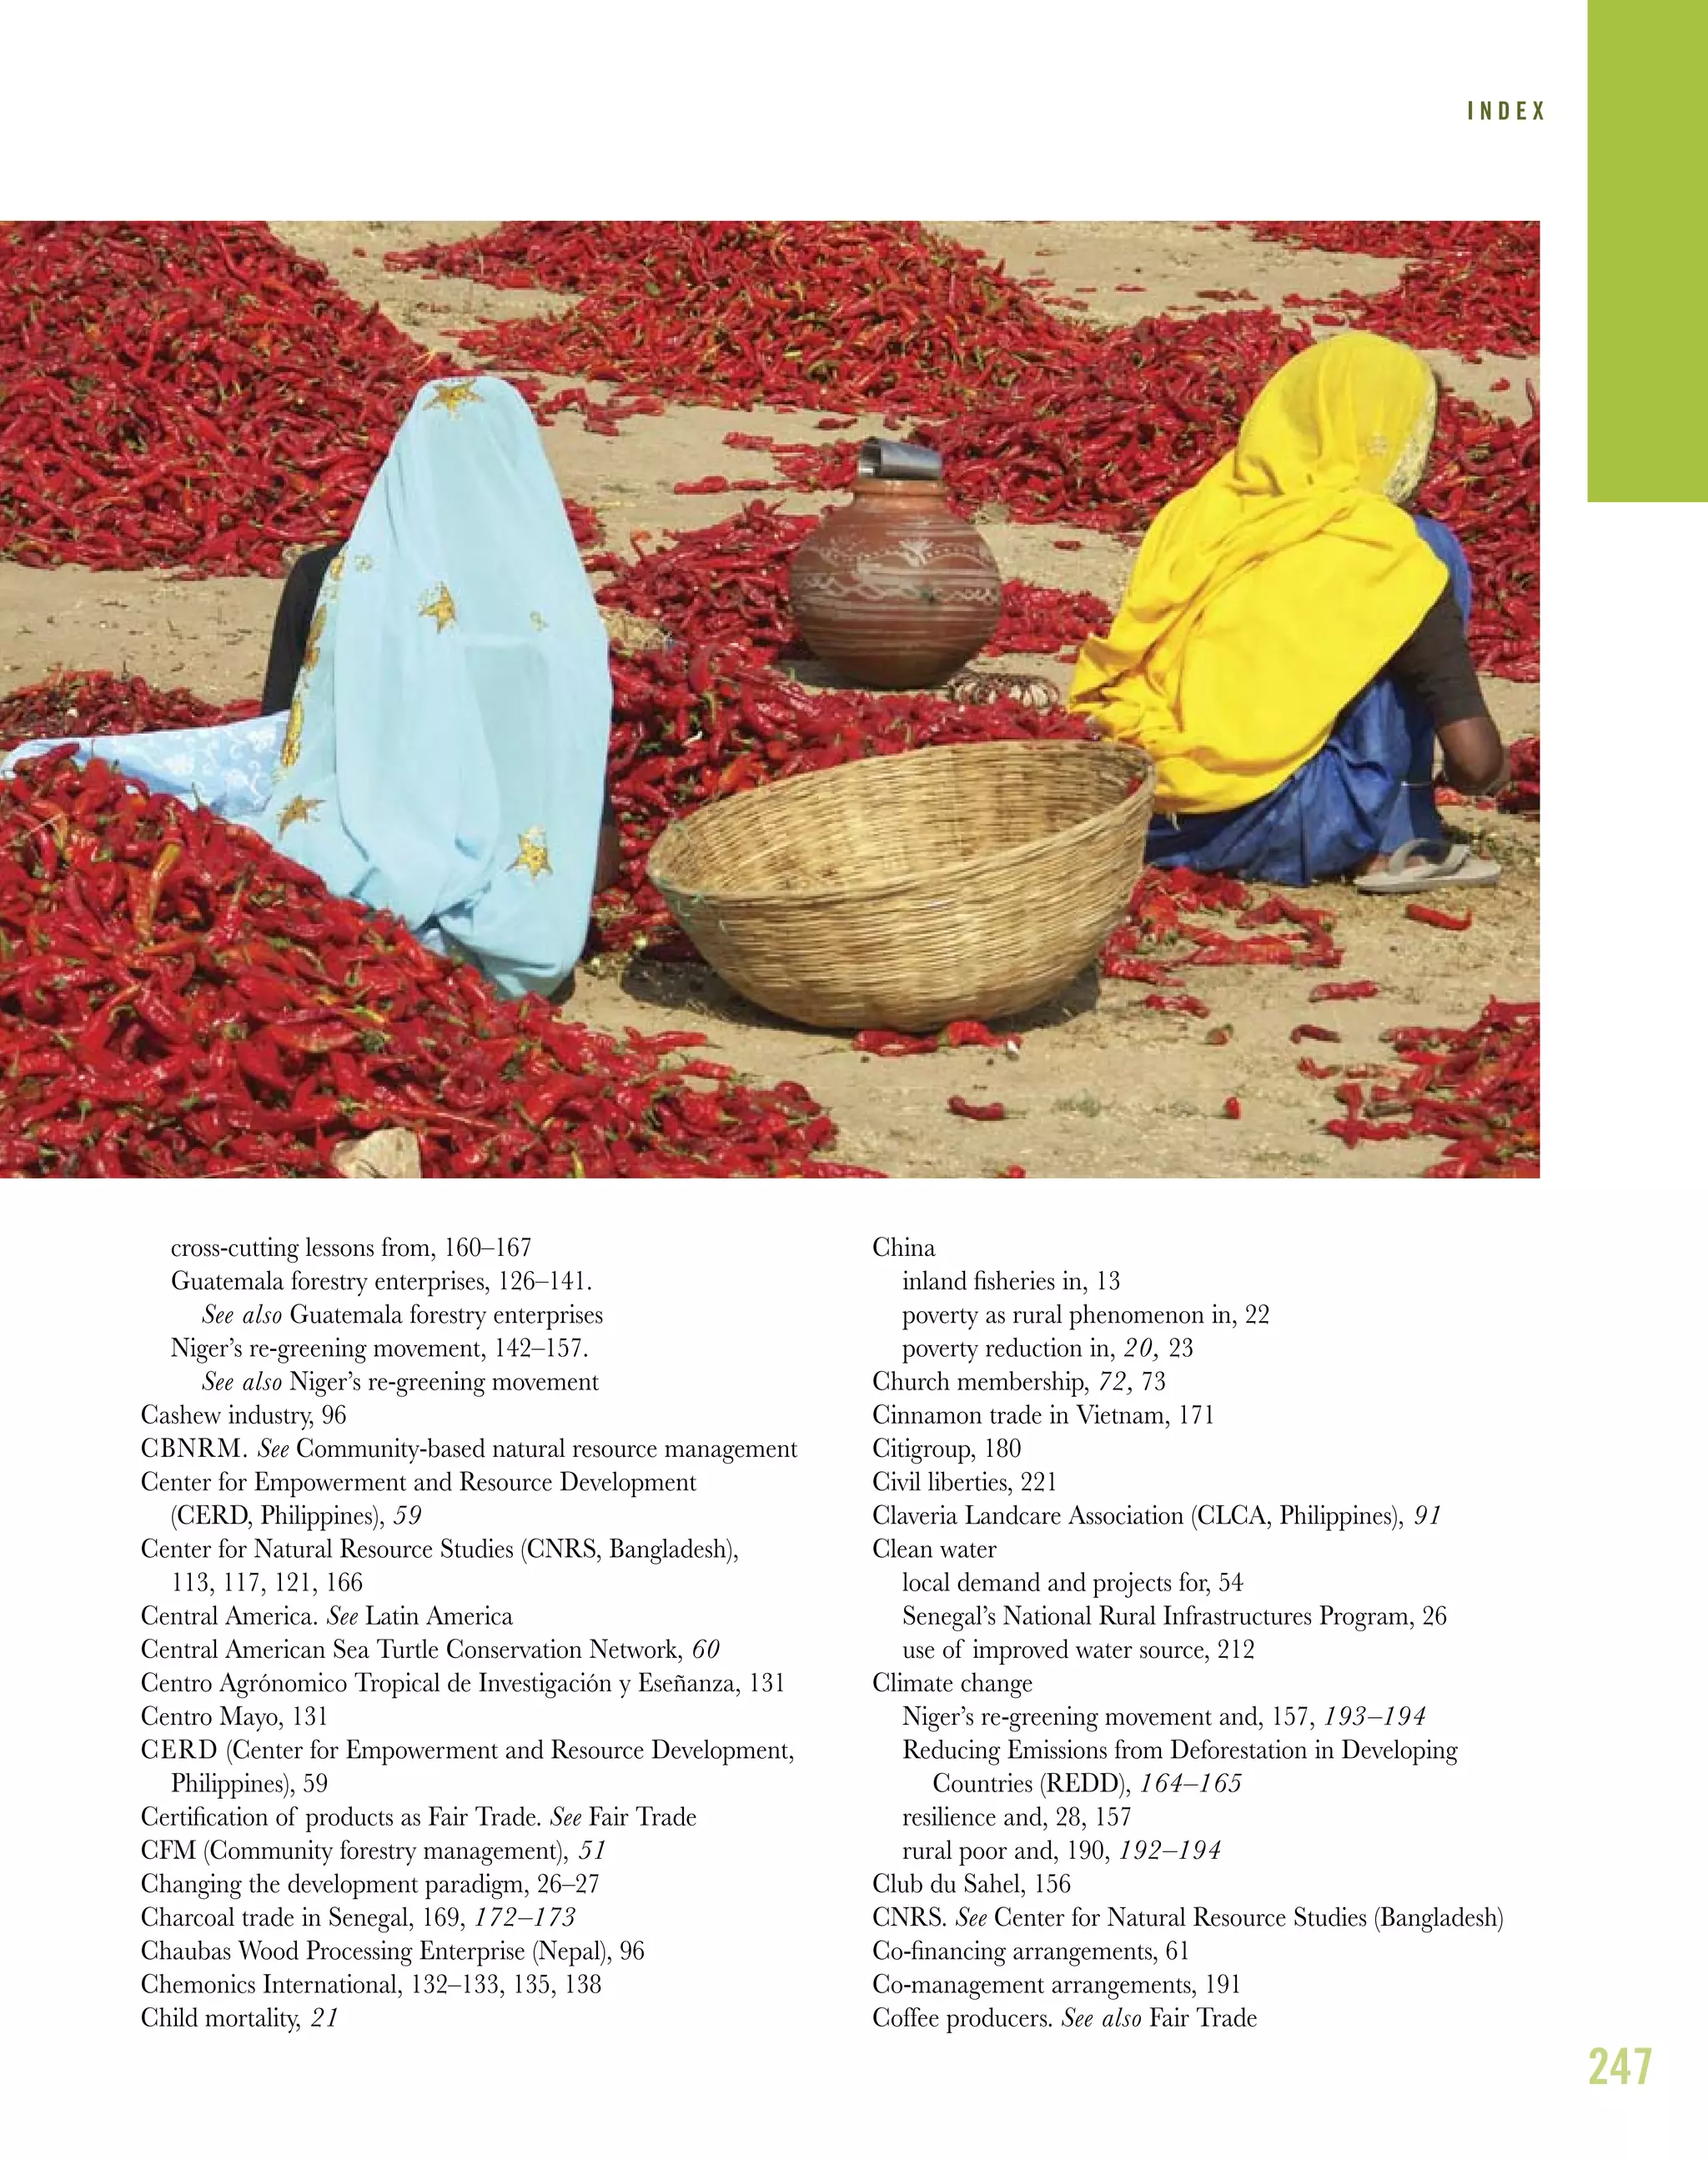
Focus
Capacity-Building
Information
Service Provision
Networking
Source: ANAI 2005a, 2005b, 2005c, 2005d, 2005e.
Activities
I Hold workshops and outreach activities in:
I Agricultural diversification
I Organic certification
I Sea turtle restoration
I Health
I Organizational management and leadership
I Collect, analyze, and distribute information about:
I Ecotourism markets
I Agricultural best practices
I Biodiversity
I Agricultural markets
I Work with local enterprises to develop business plans
I Distribute donor funds to local initiatives
I Partner with Costa Rican government to secure good
policies for sustainable development projects and
conservation of biodiversity
I Coordinate enterprise and NGO coalitions, such as
ecotourism networks and farmers’ cooperatives
HOW DOES ANAI FACILITATE
SUSTAINABLE COMMUNITY DEVELOPMENT?
Evidence indicates that early attention to social processes is
worth the effort. In analyses of watershed development projects in
India, researchers have found that NGO-led projects have tended
to invest more heavily than government-led projects in social
organizing. As a result, most NGO projects recorded a higher
success rate in terms of creating self-sustaining local institutions—
such as village watershed committees—that continued to manage
their lands sustainably and profitably (Sharma et al. 2005:2; Kerr
et al. 2002:77; Turton et al. 1998:2).
Social capacity-building is a matter of emphasizing process
as well as substance. What this often means for ISOs is that guided
social interactions and group learning are deliberately incorpo-
rated as part of technical capacity-building courses, in order to
induce a new social dynamic in the group. In some cases, these
participatory exercises and guided group interactions are broken
out separately and become a precursor to the community under-
taking group action in the field.
The Watershed Organisation Trust in India has recently
begun piloting an approach to social capacity-building when it
begins to work with a new community on watershed rehabilitation
and water harvesting. It calls its approach wasundhara—a term which
means “mother earth” and connotes caring and compassion within](https://image.slidesharecdn.com/worldresources2008rootsofresilience-150506081253-conversion-gate02/75/World-resources-2008_roots_of_resilience-94-2048.jpg)

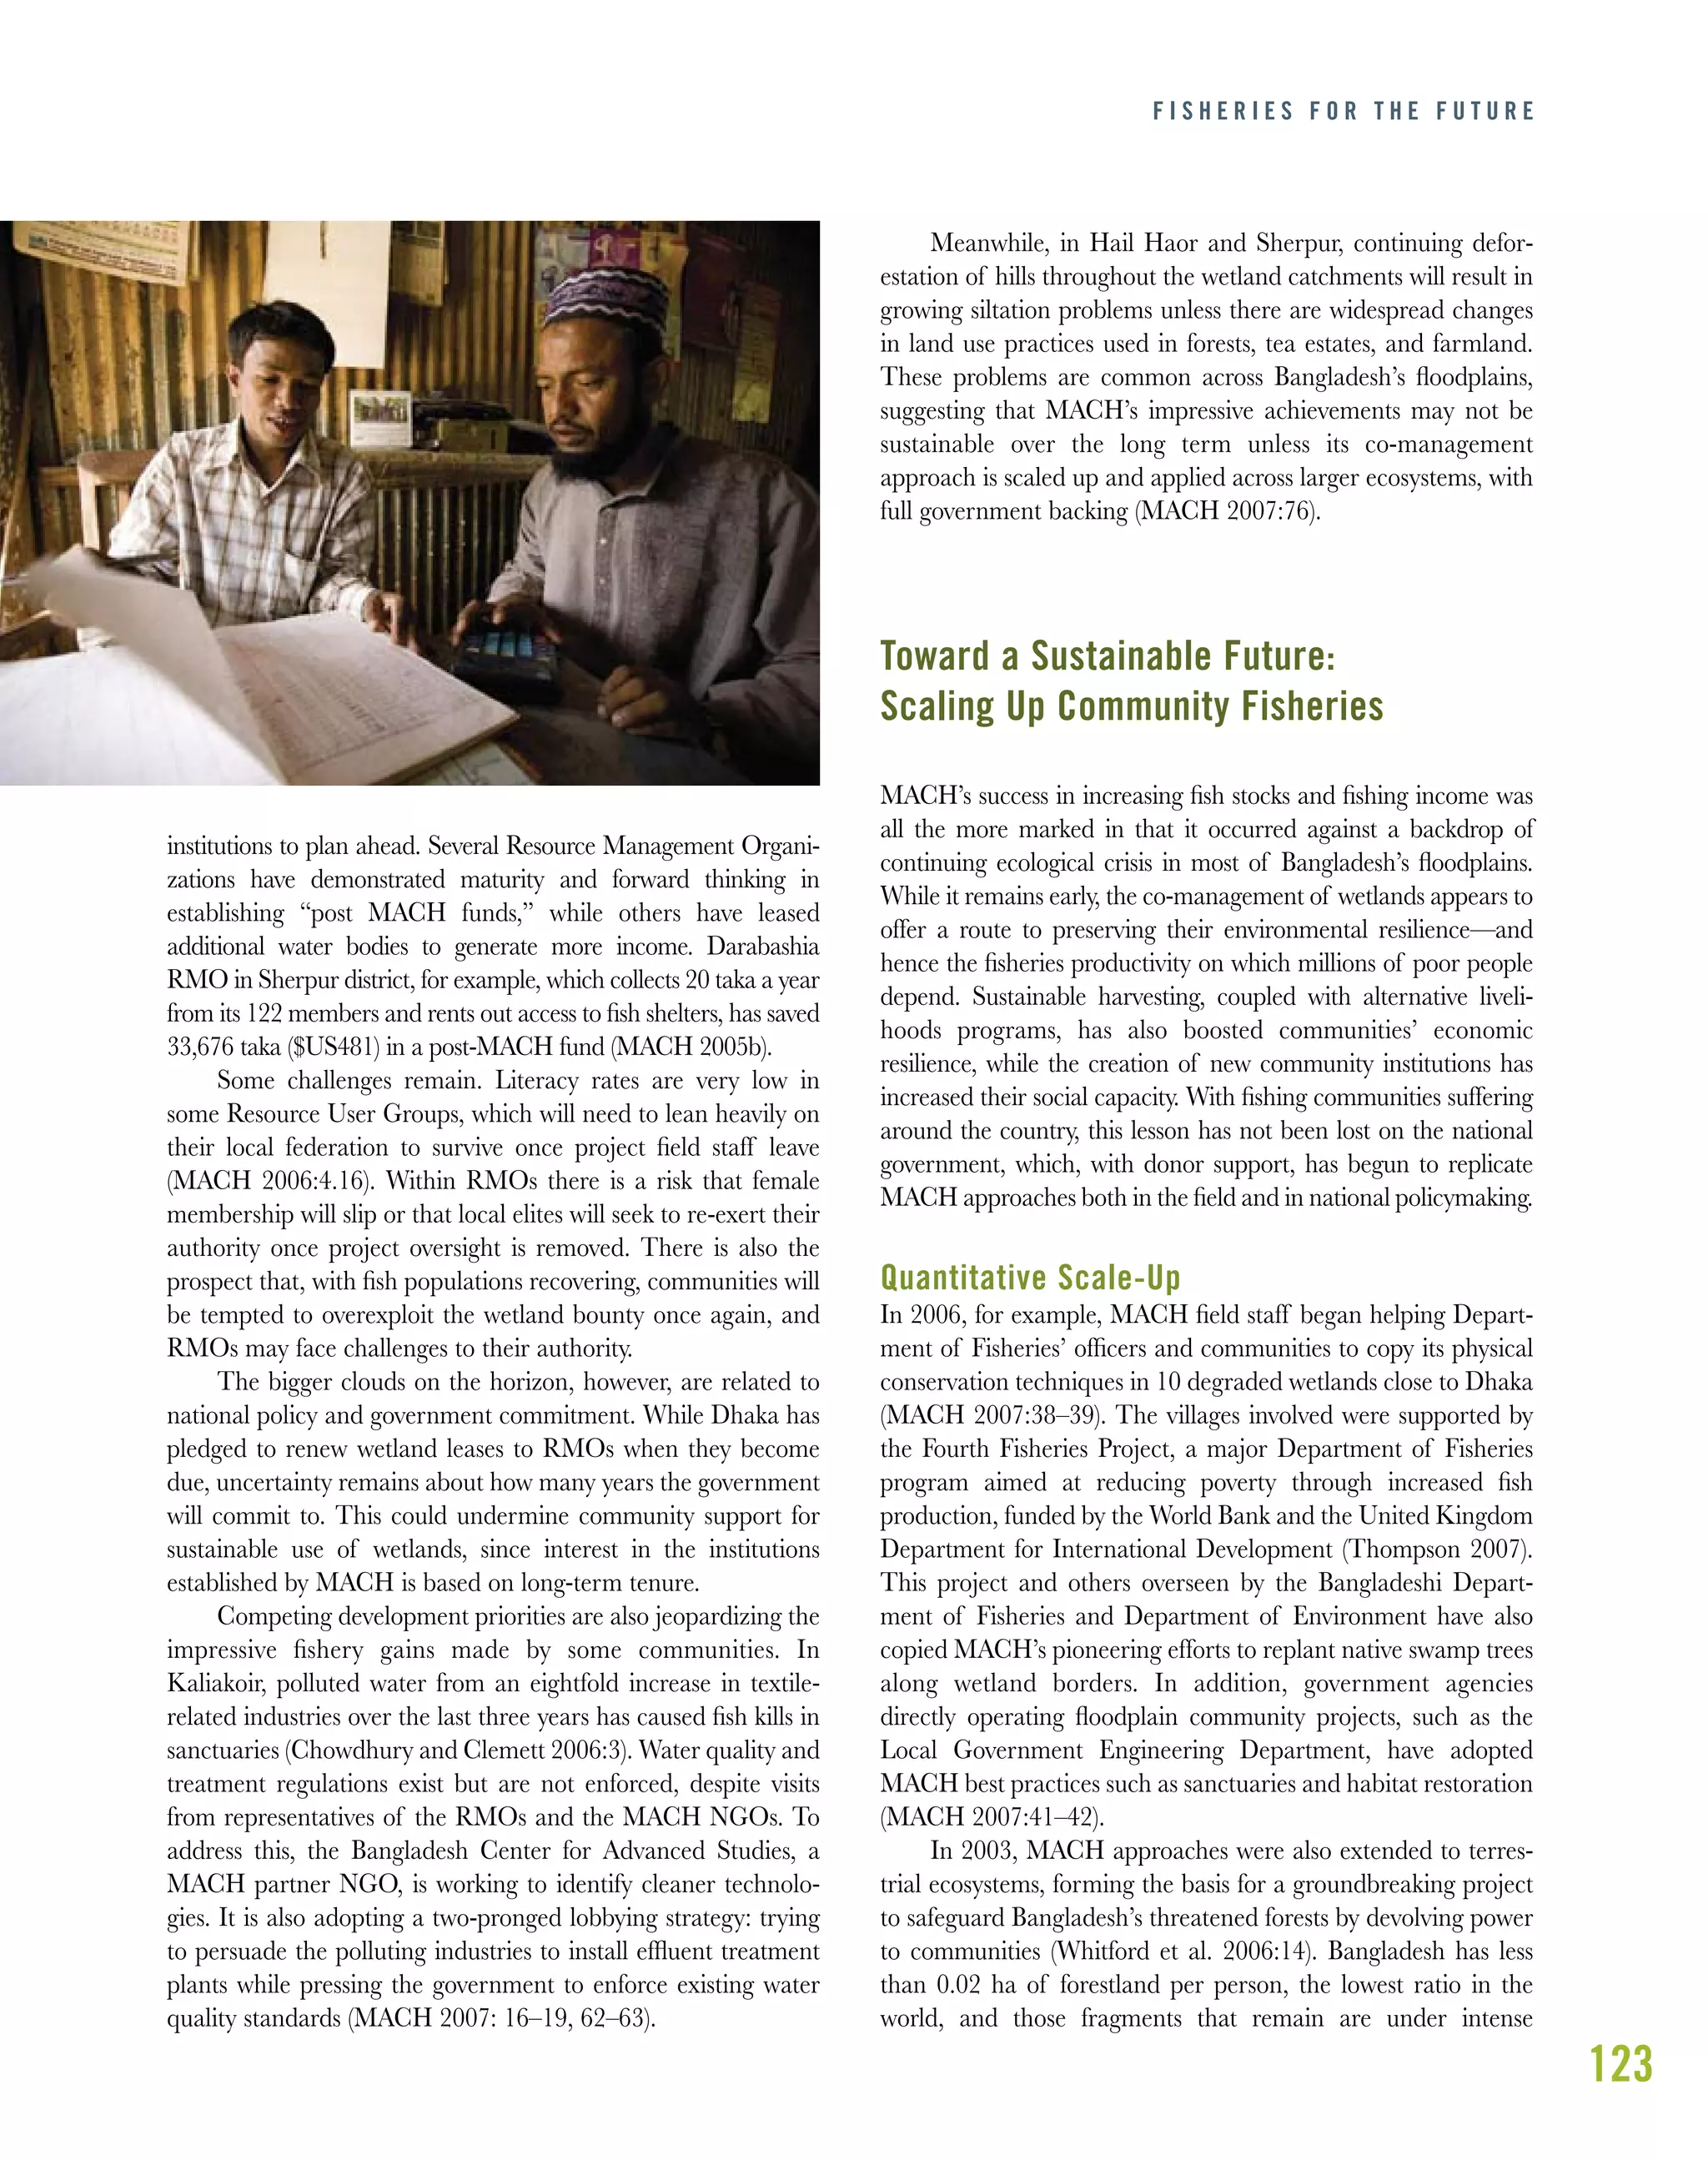
![122
W O R L D R E S O U R C E S 2 0 0 8
which has since banned all fishing, bird hunting, and harvest-
ing of edible water plants (MACH 2007:47). By 2007, a
midwinter census recorded more than 7,000 water birds in
Baikka Beel, including such rare species as the Pallas’ Fish
Eagle and Greater Spotted Eagle (MACH 2007:38), and
MACH had built a watch tower to accommodate an influx of
ecotourists. The Bangladesh government is now applying for
Hail Haor to receive international protected wetland status
under the Ramsar Convention (MACH 2007:vi).
Land-based habitat management has also brought conser-
vation dividends. Communities planted more than 600,000
trees from 48 native species to restore swamplands and wetland
border forests and to counter erosion on the banks of rivers and
streams. Over the long term, the tree planting program will
also bring economic benefits to communities. While the swamp
forests will be preserved, tree branches can be lopped for fuel
and for brushwood that is placed in the water to attract fish.
MACH also estimates a healthy return from the first felling
cycle of non-swamp trees at US$1.04 million in today’s prices
between 2015 and 2020. Through benefit-sharing agreements
a substantial part of this will go to community organizations,
with the rest reserved for landowners and local government
(MACH 2007:14-15; 53).
Sustaining Success:
Lessons and Challenges
Two clear advantages help to explain the MACH program’s
success as a conservation and anti-poverty initiative: the large
sums of donor money invested and government support for
decentralizing wetland management. But there were several
other key elements that reflect the framework laid out earlier in
this book and that have wider resonance.
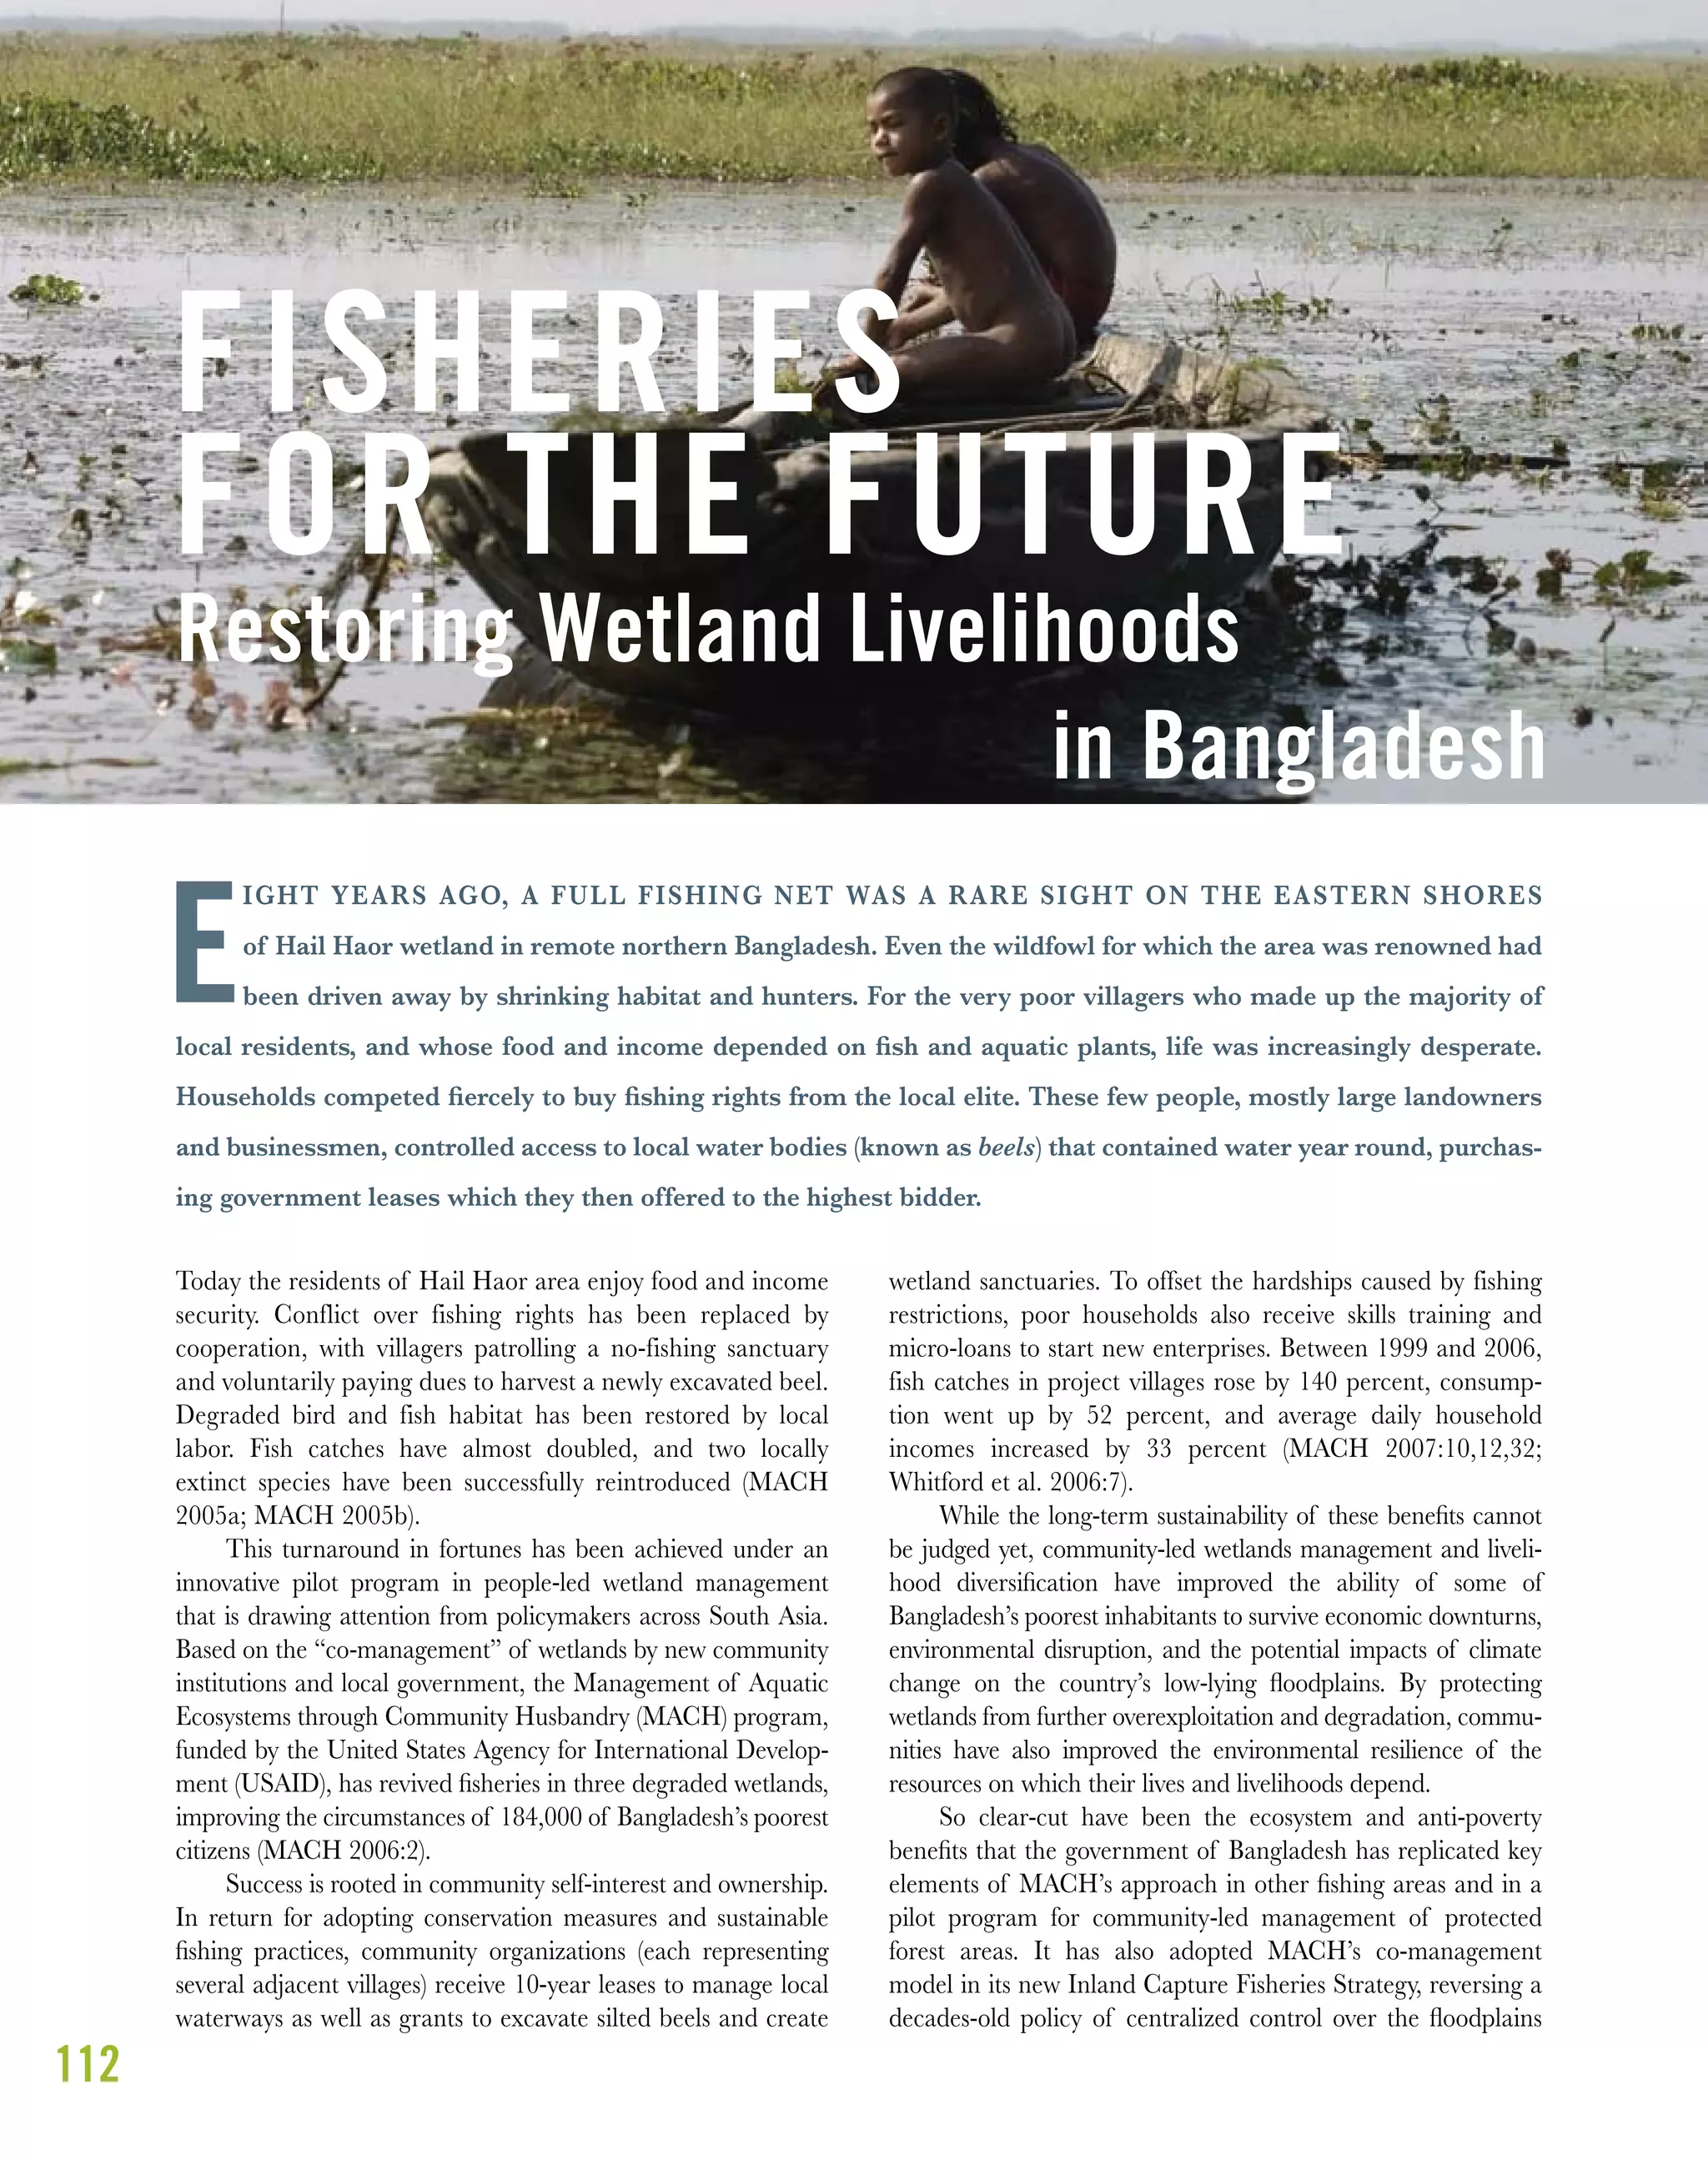
First and most important, the program was built on communi-
ties’ self-interests. Villagers were granted rights and powers to use
natural resources and responsibilities to manage and protect them.
If they failed, their livelihoods and investment (of user dues and
time volunteered) were at stake. Second, because of the co-manage-
ment arrangement with local administrators, these new institutions
were not isolated; they worked well within the existing governance
framework. Third, the implementing NGOs worked effectively as
intermediary organizations—acting as a bridge between
villagers and local and national governments to develop
democratic, equitable, and effective community-based institutions.
Fourth, effective networking, outreach, and organizational
scale-up over the nine years of the program prevented the
project villages from being mere
temporary islands of good
practice. Instead, the new
institutions were left on a good
footing to prosper after donor
funds and NGO expertise began
to be withdrawn in 2007.
Fifth, endowment funds for
RMOs and revolving credit
funds for resource user groups
provided financial security once
the project funding dried up.
As a result, the commu-
nity institutions nurtured by
MACH are now self-sufficient
enough not only to survive but
to prosper. So concluded the
team of consultants sent to
evaluate the program in 2006,
reporting that most resource
management organizations
and user groups “appear
capable of managing the
fishery resources and income
generation activities respec-
tively [and] should be able to
sustain themselves financially
for the indefinite future”
(Whitford et al. 2006:27).
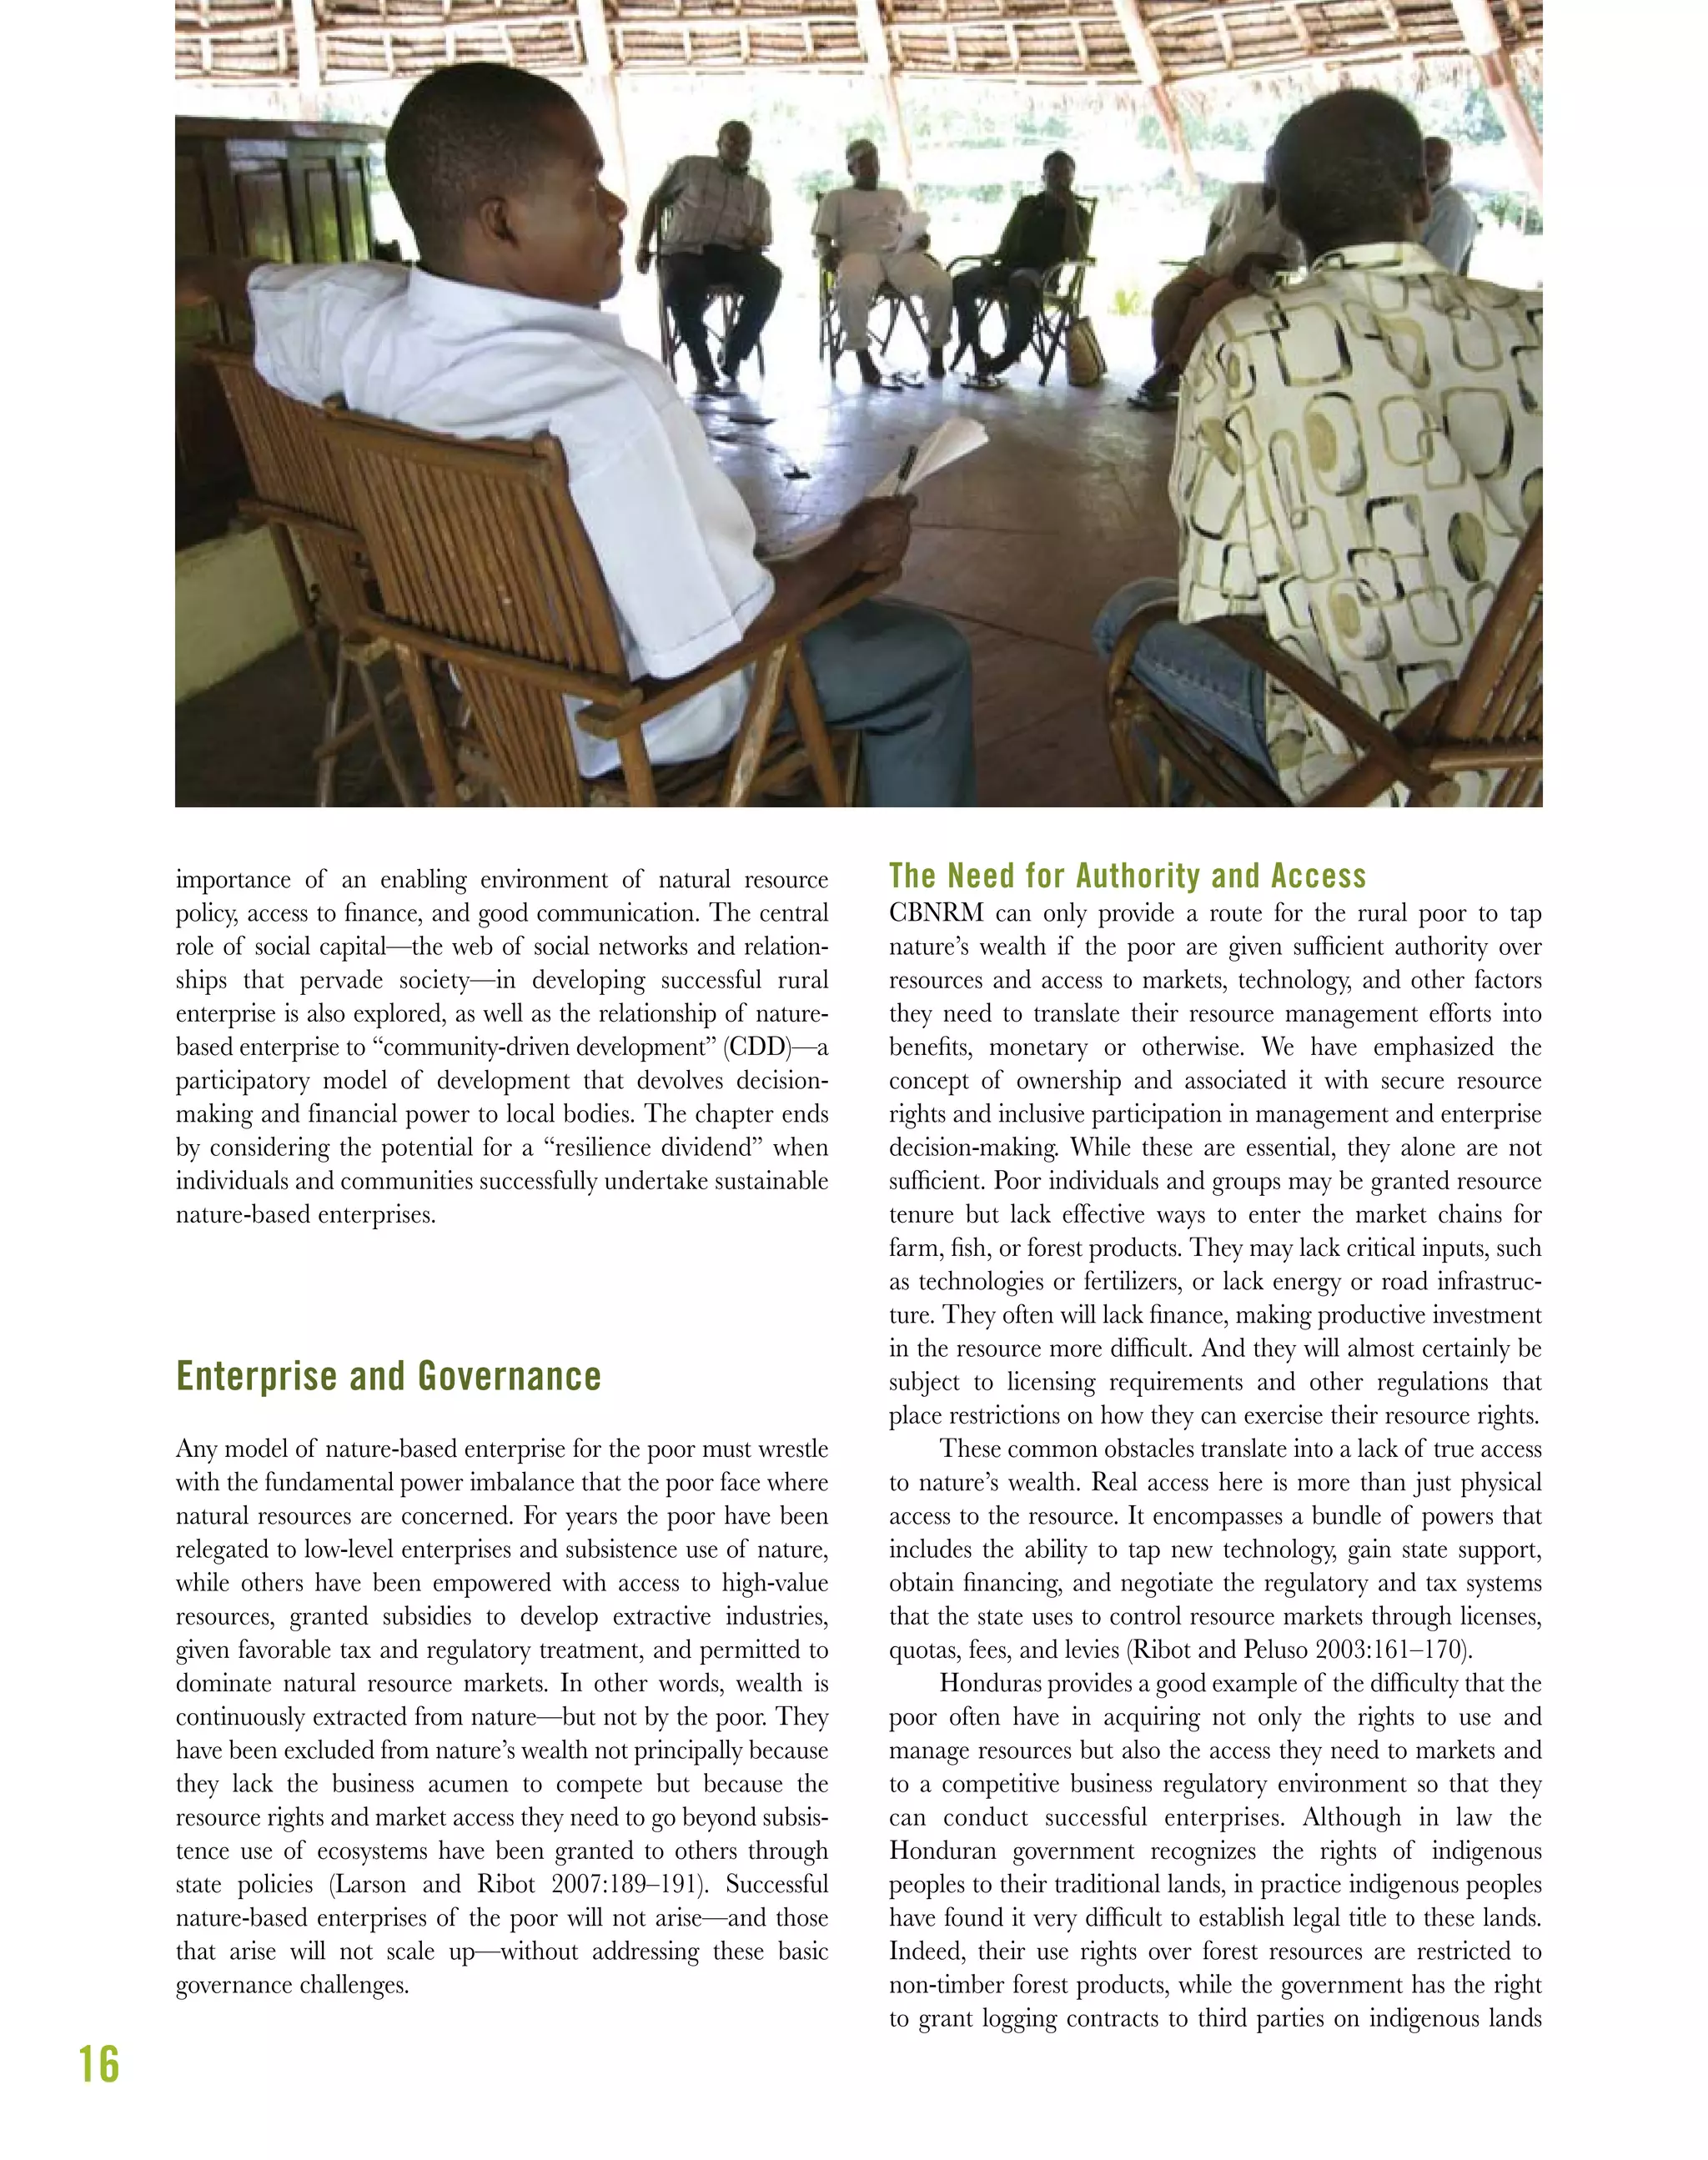
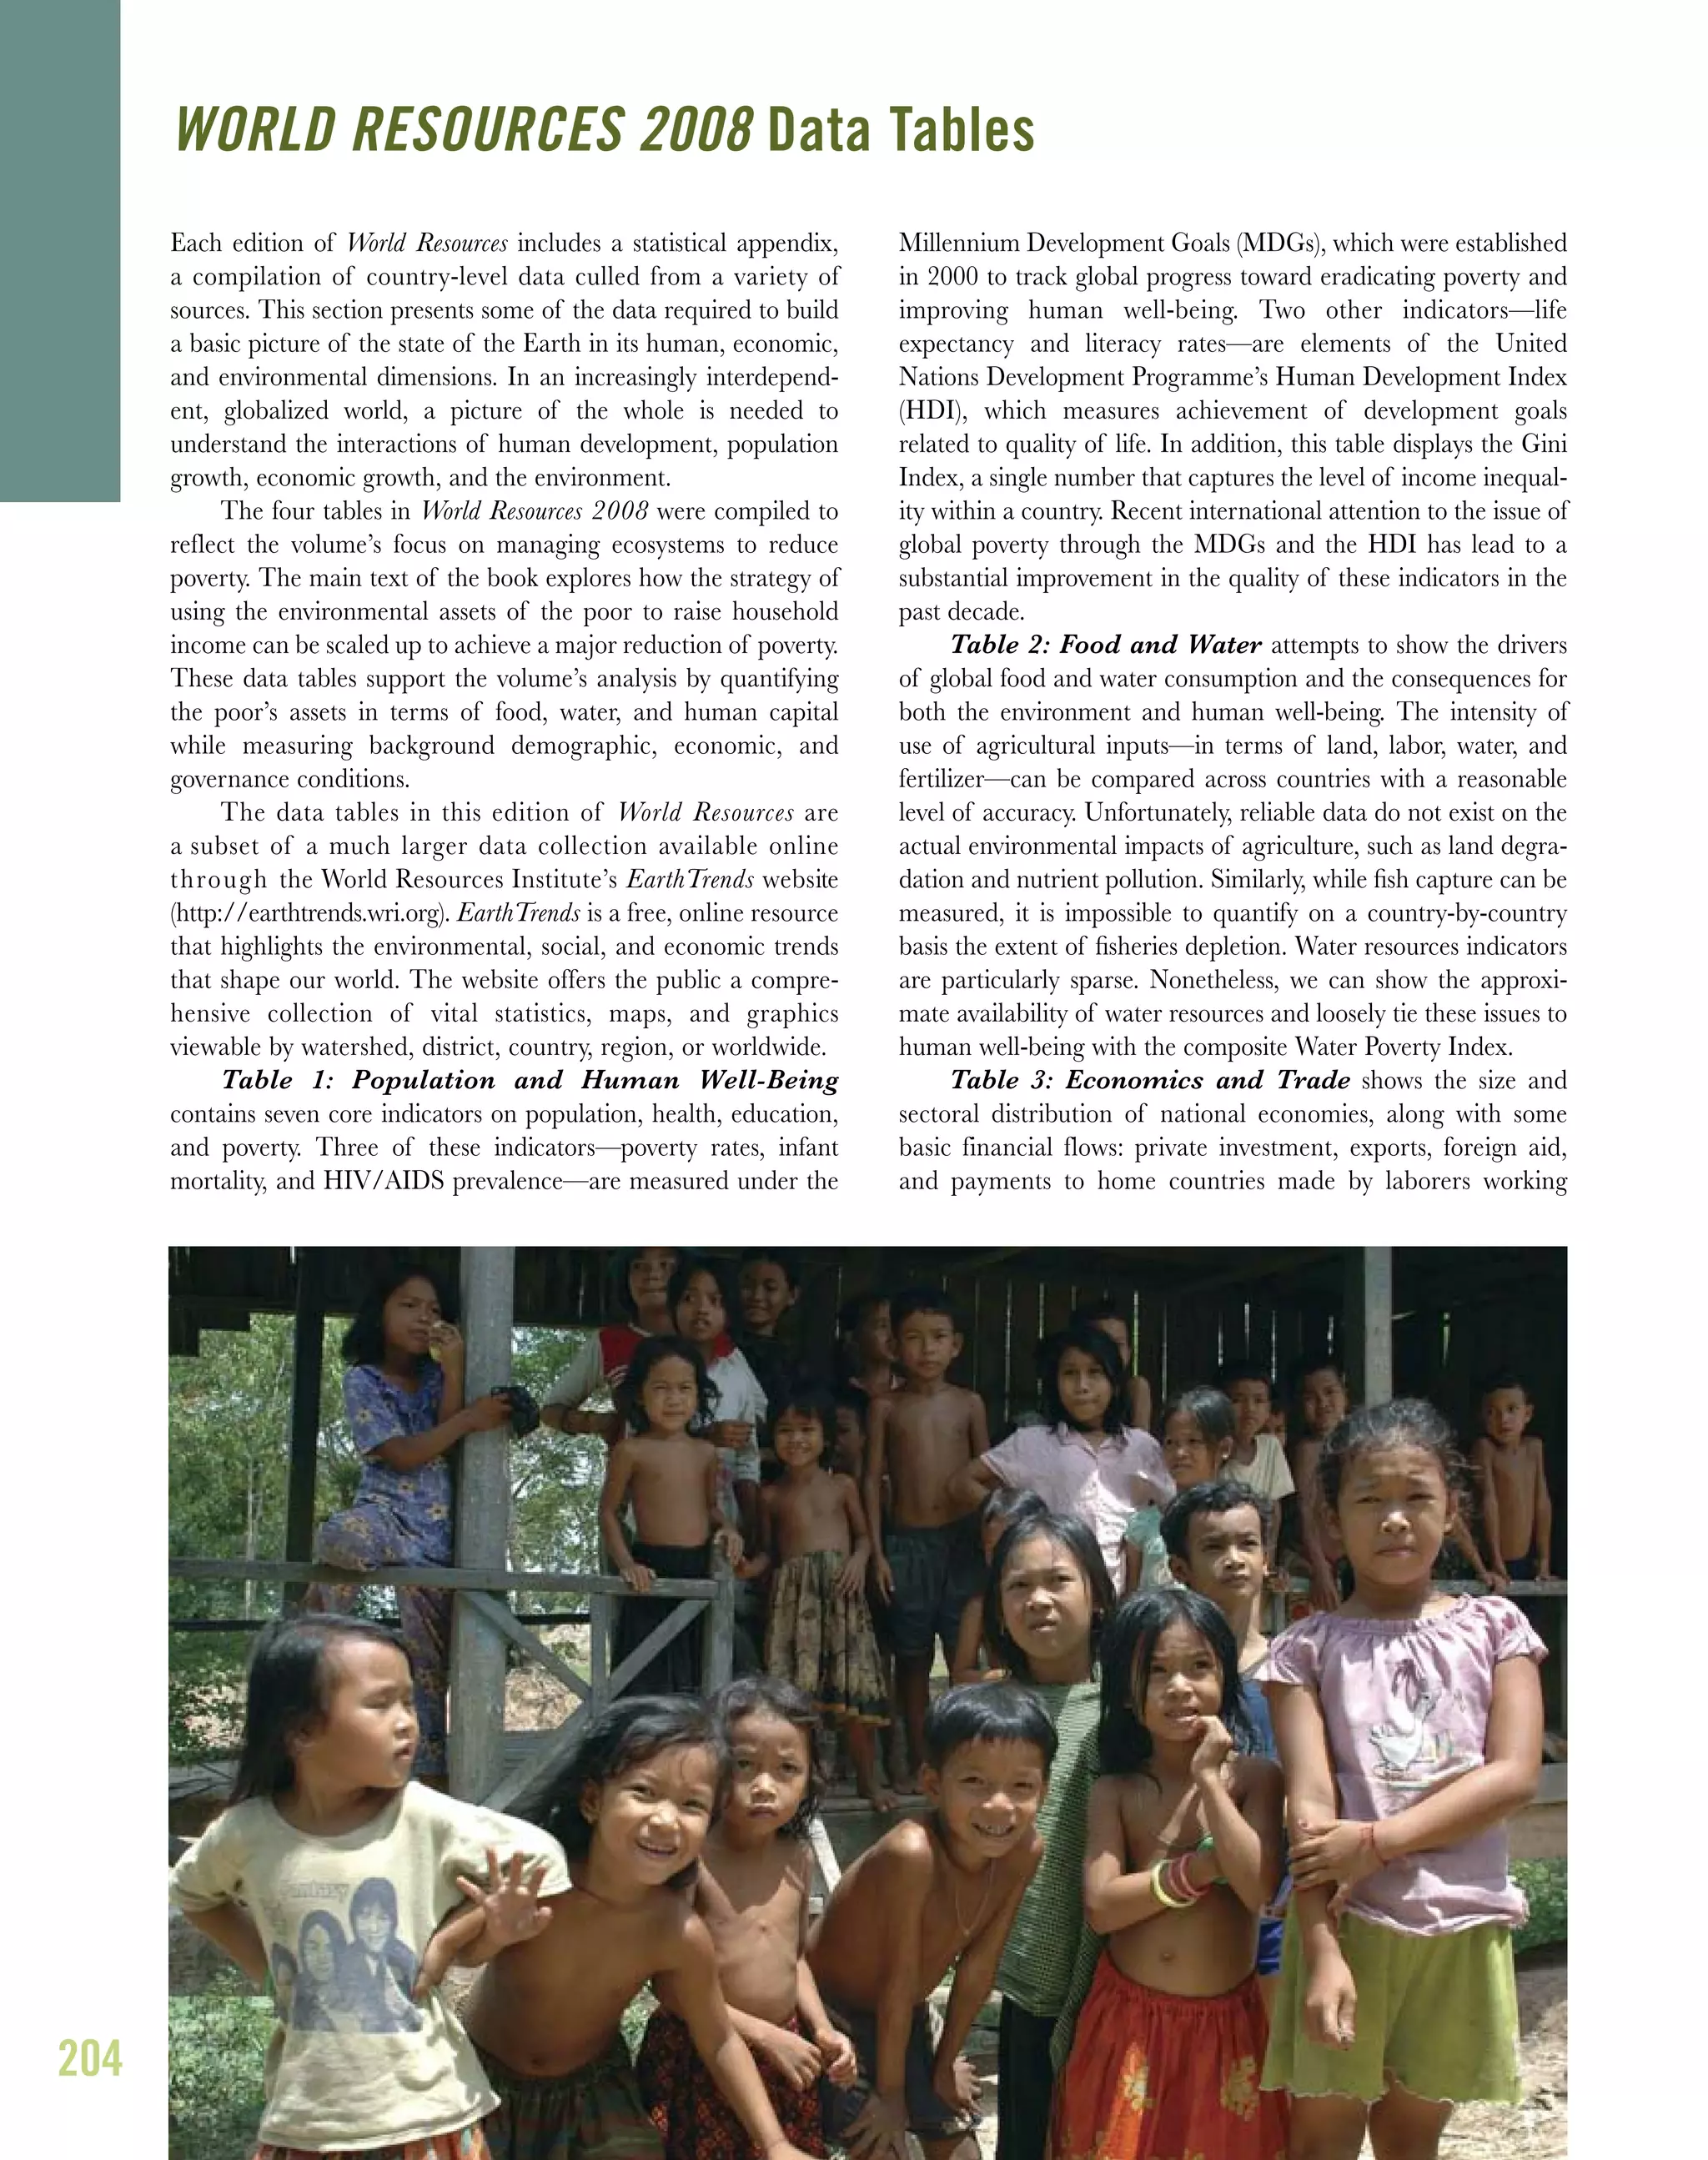
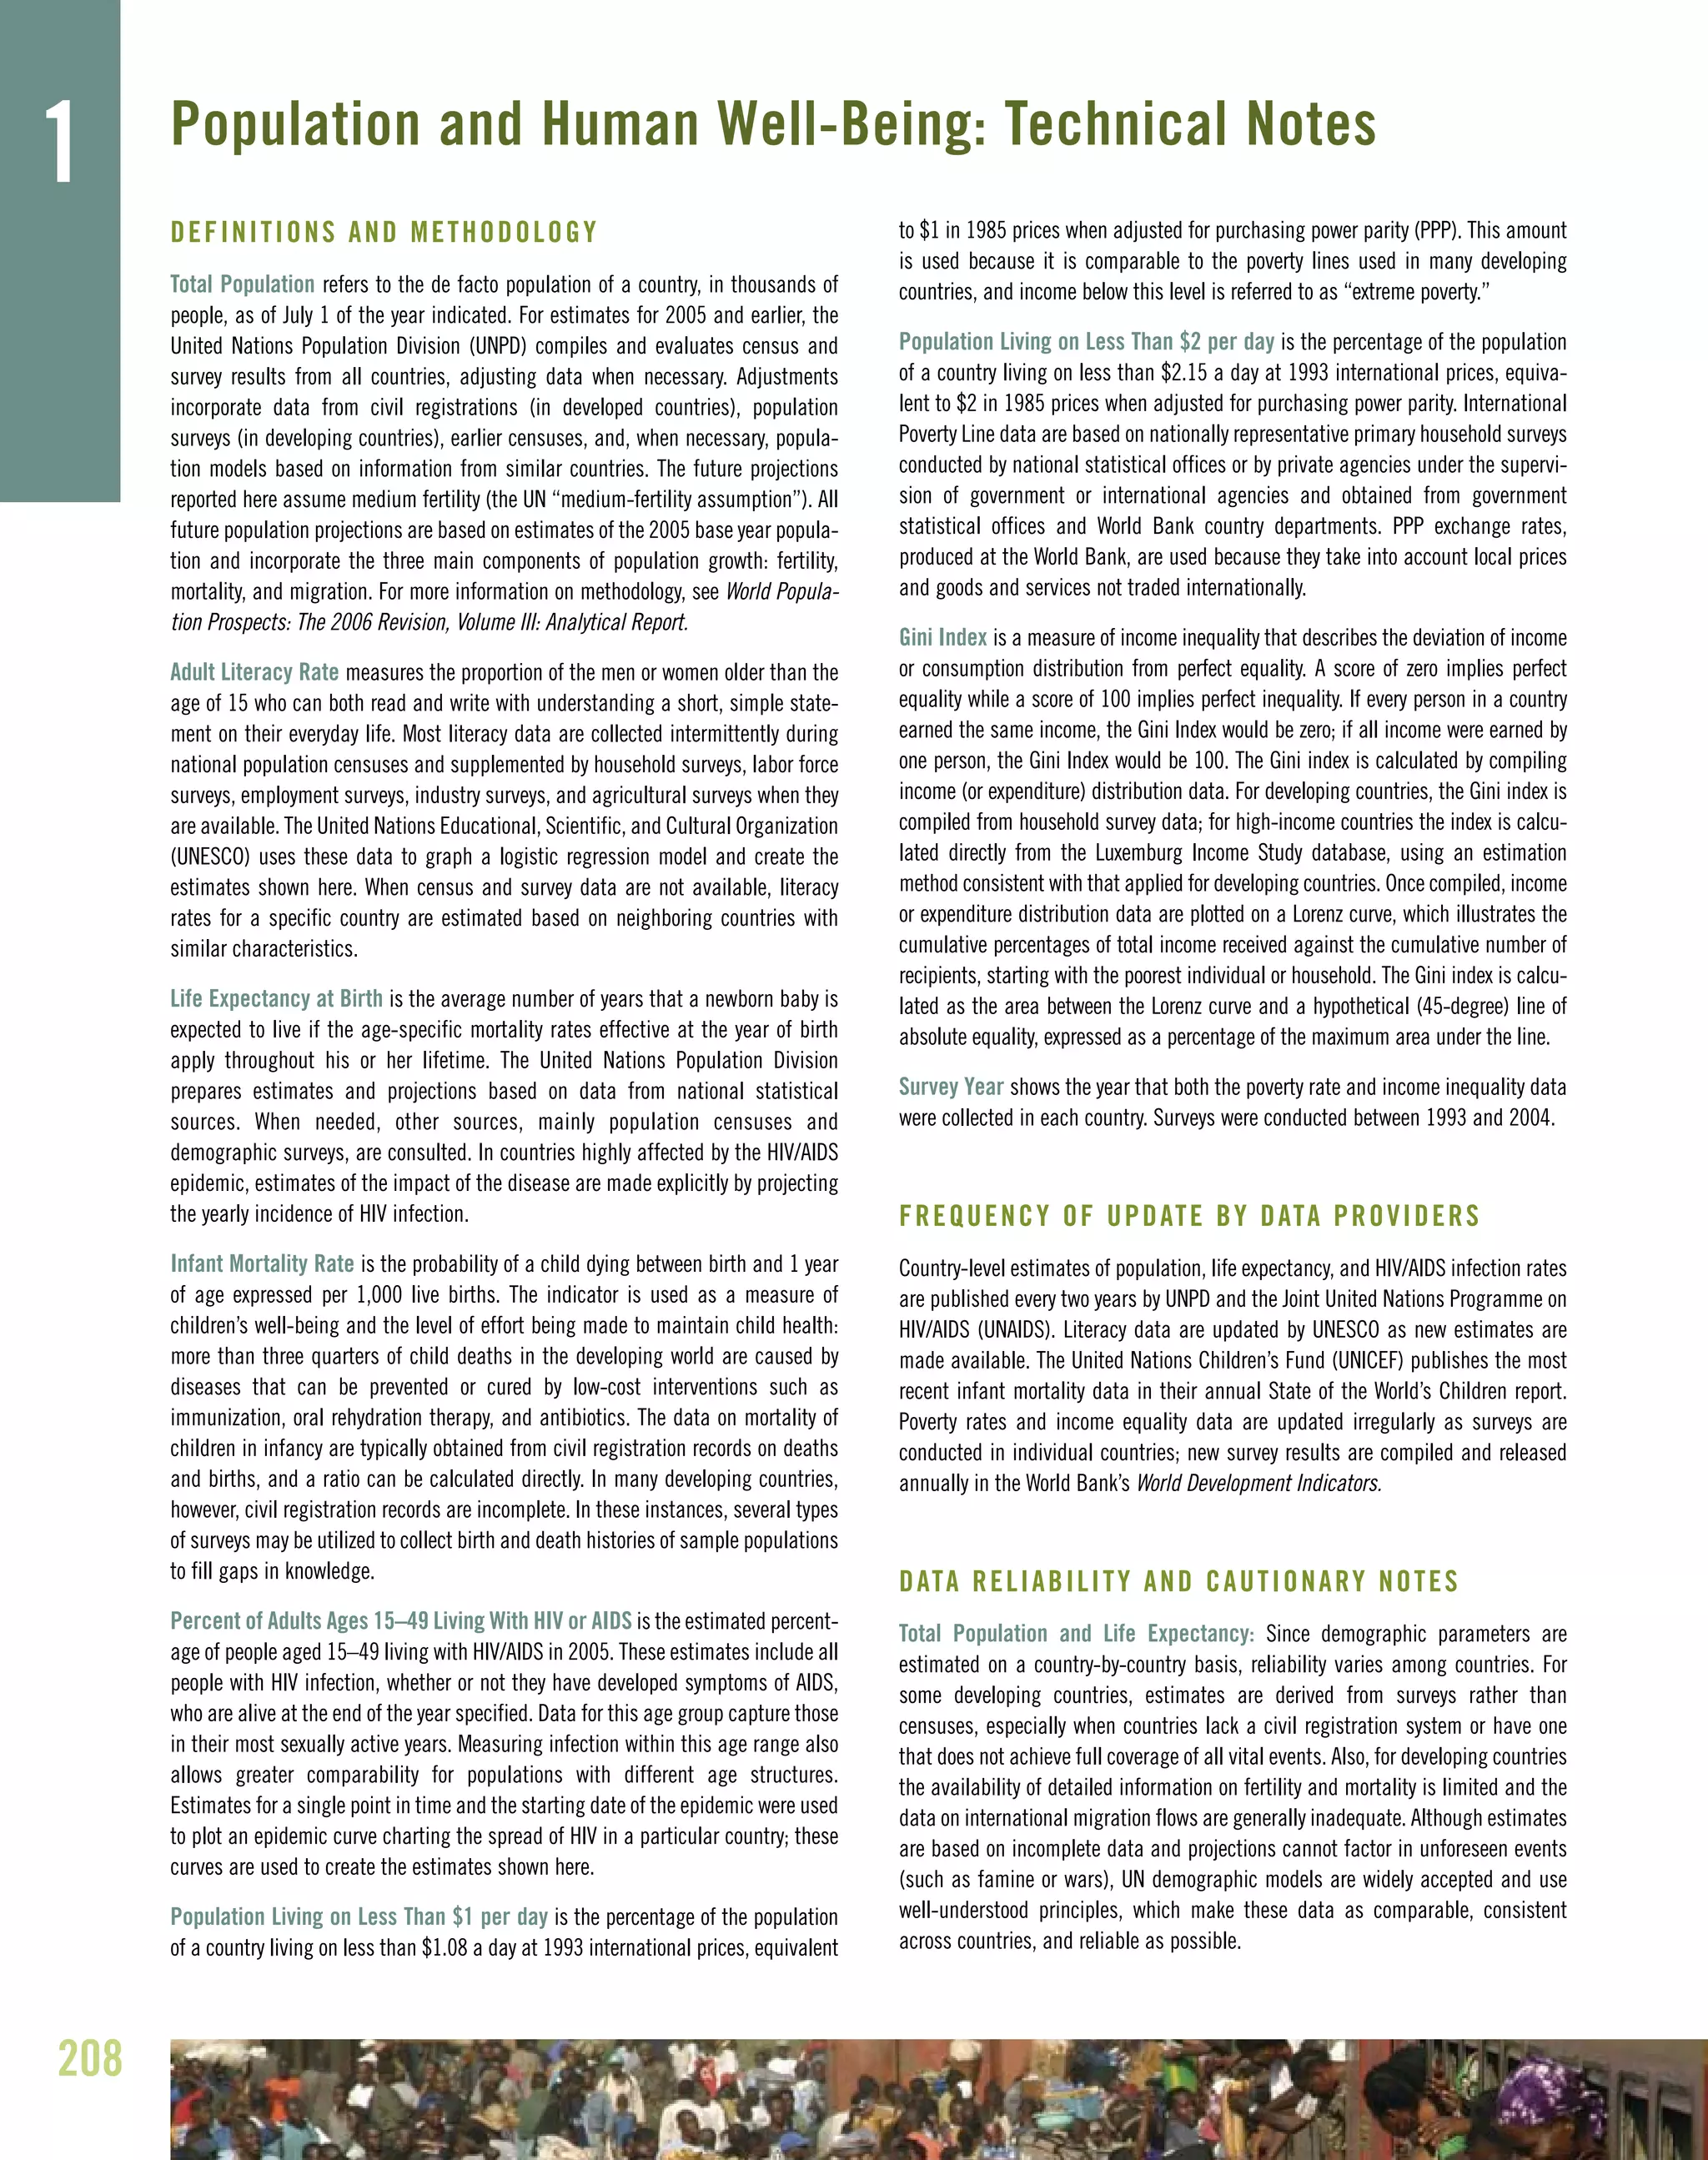
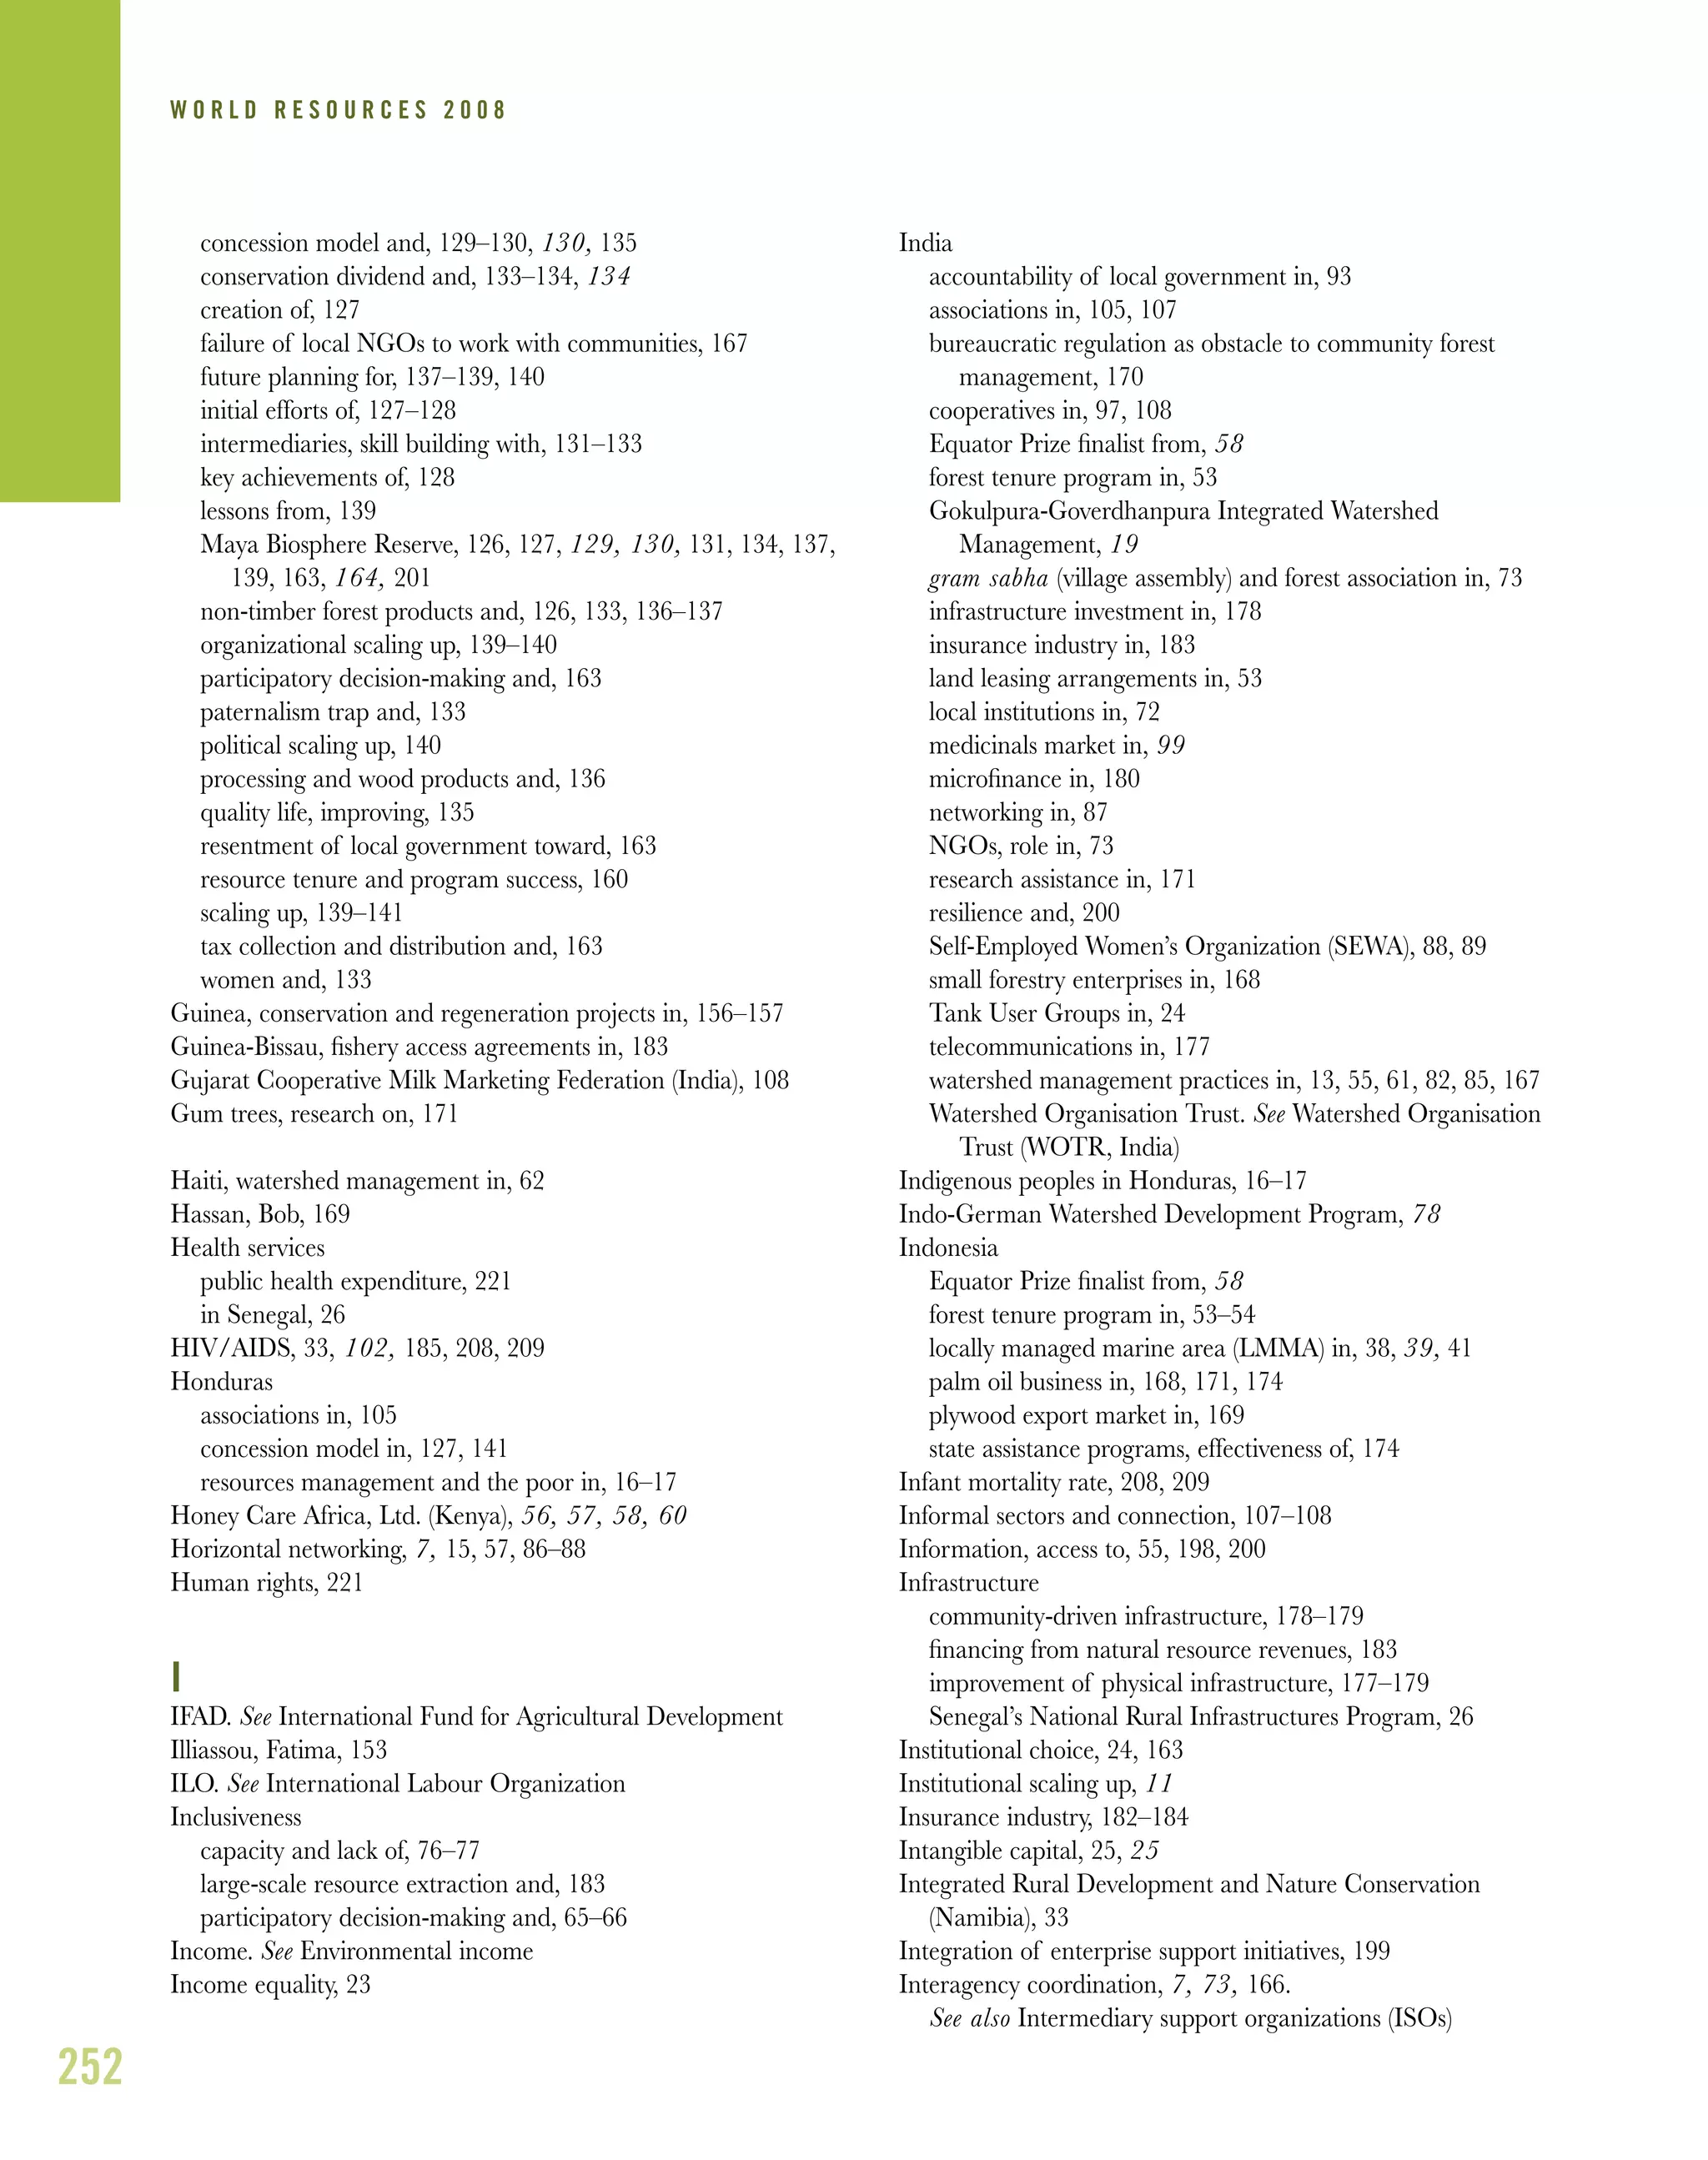
The slow project phase-
out has also helped community
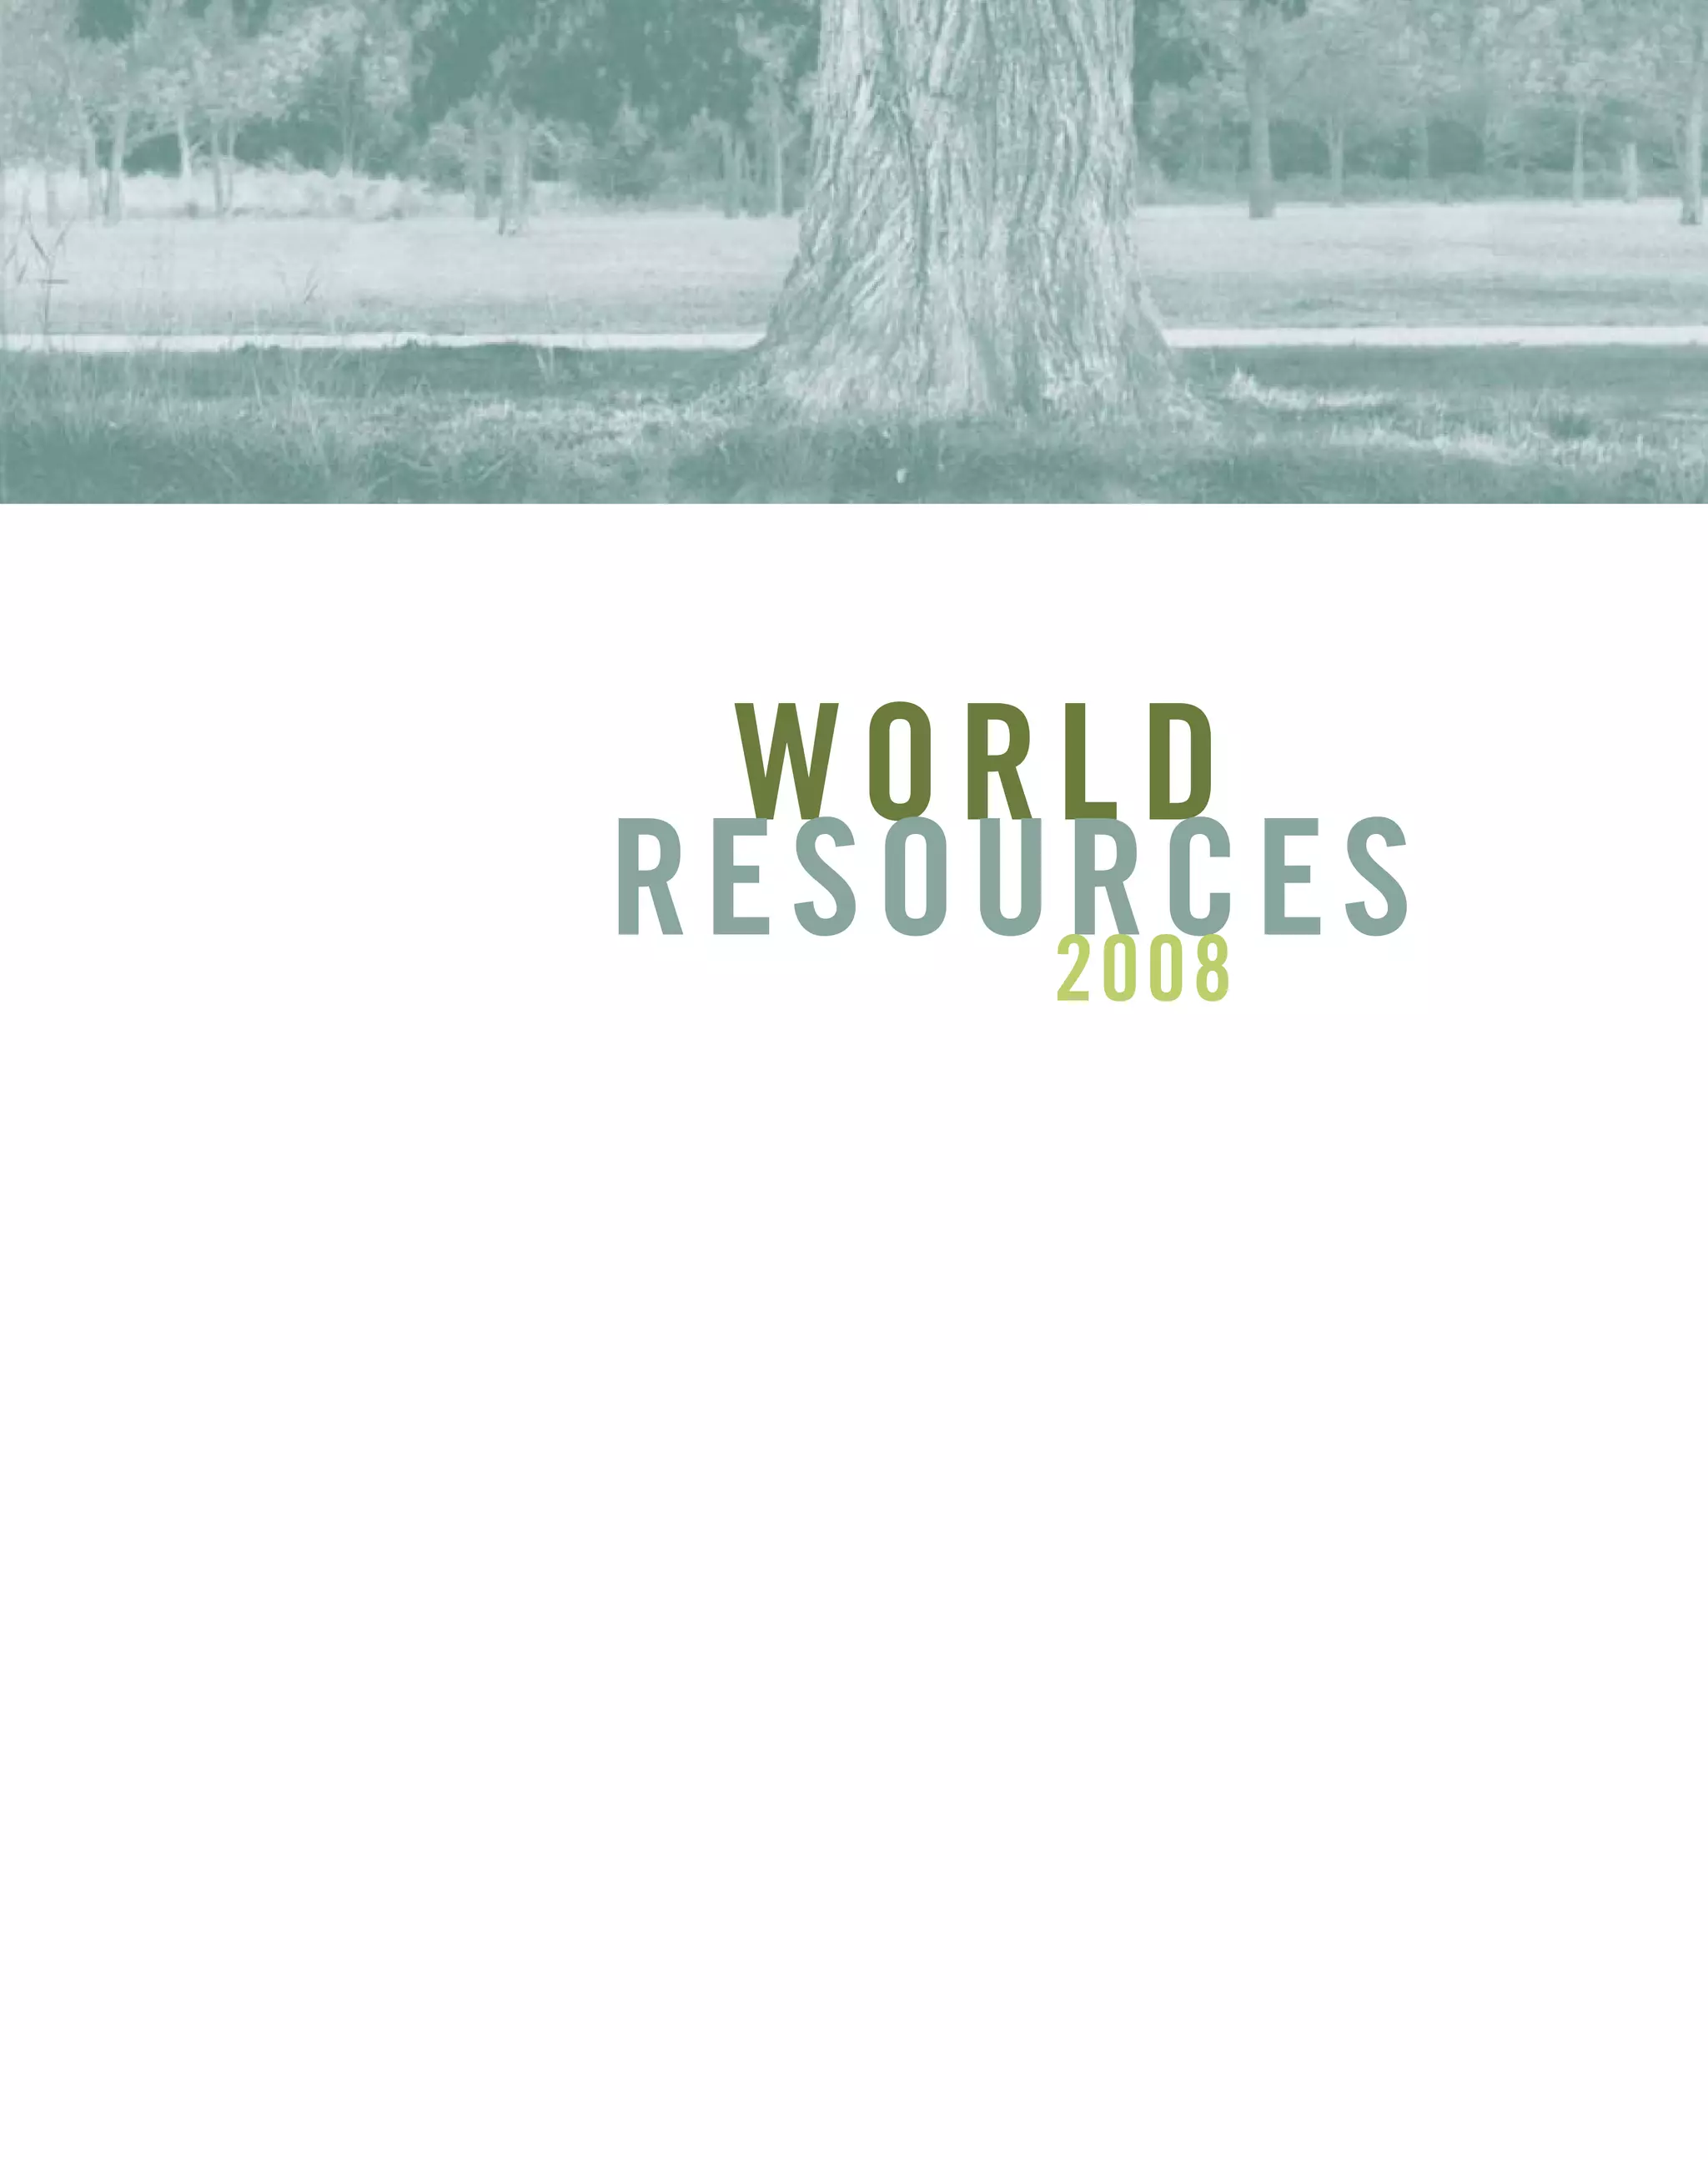
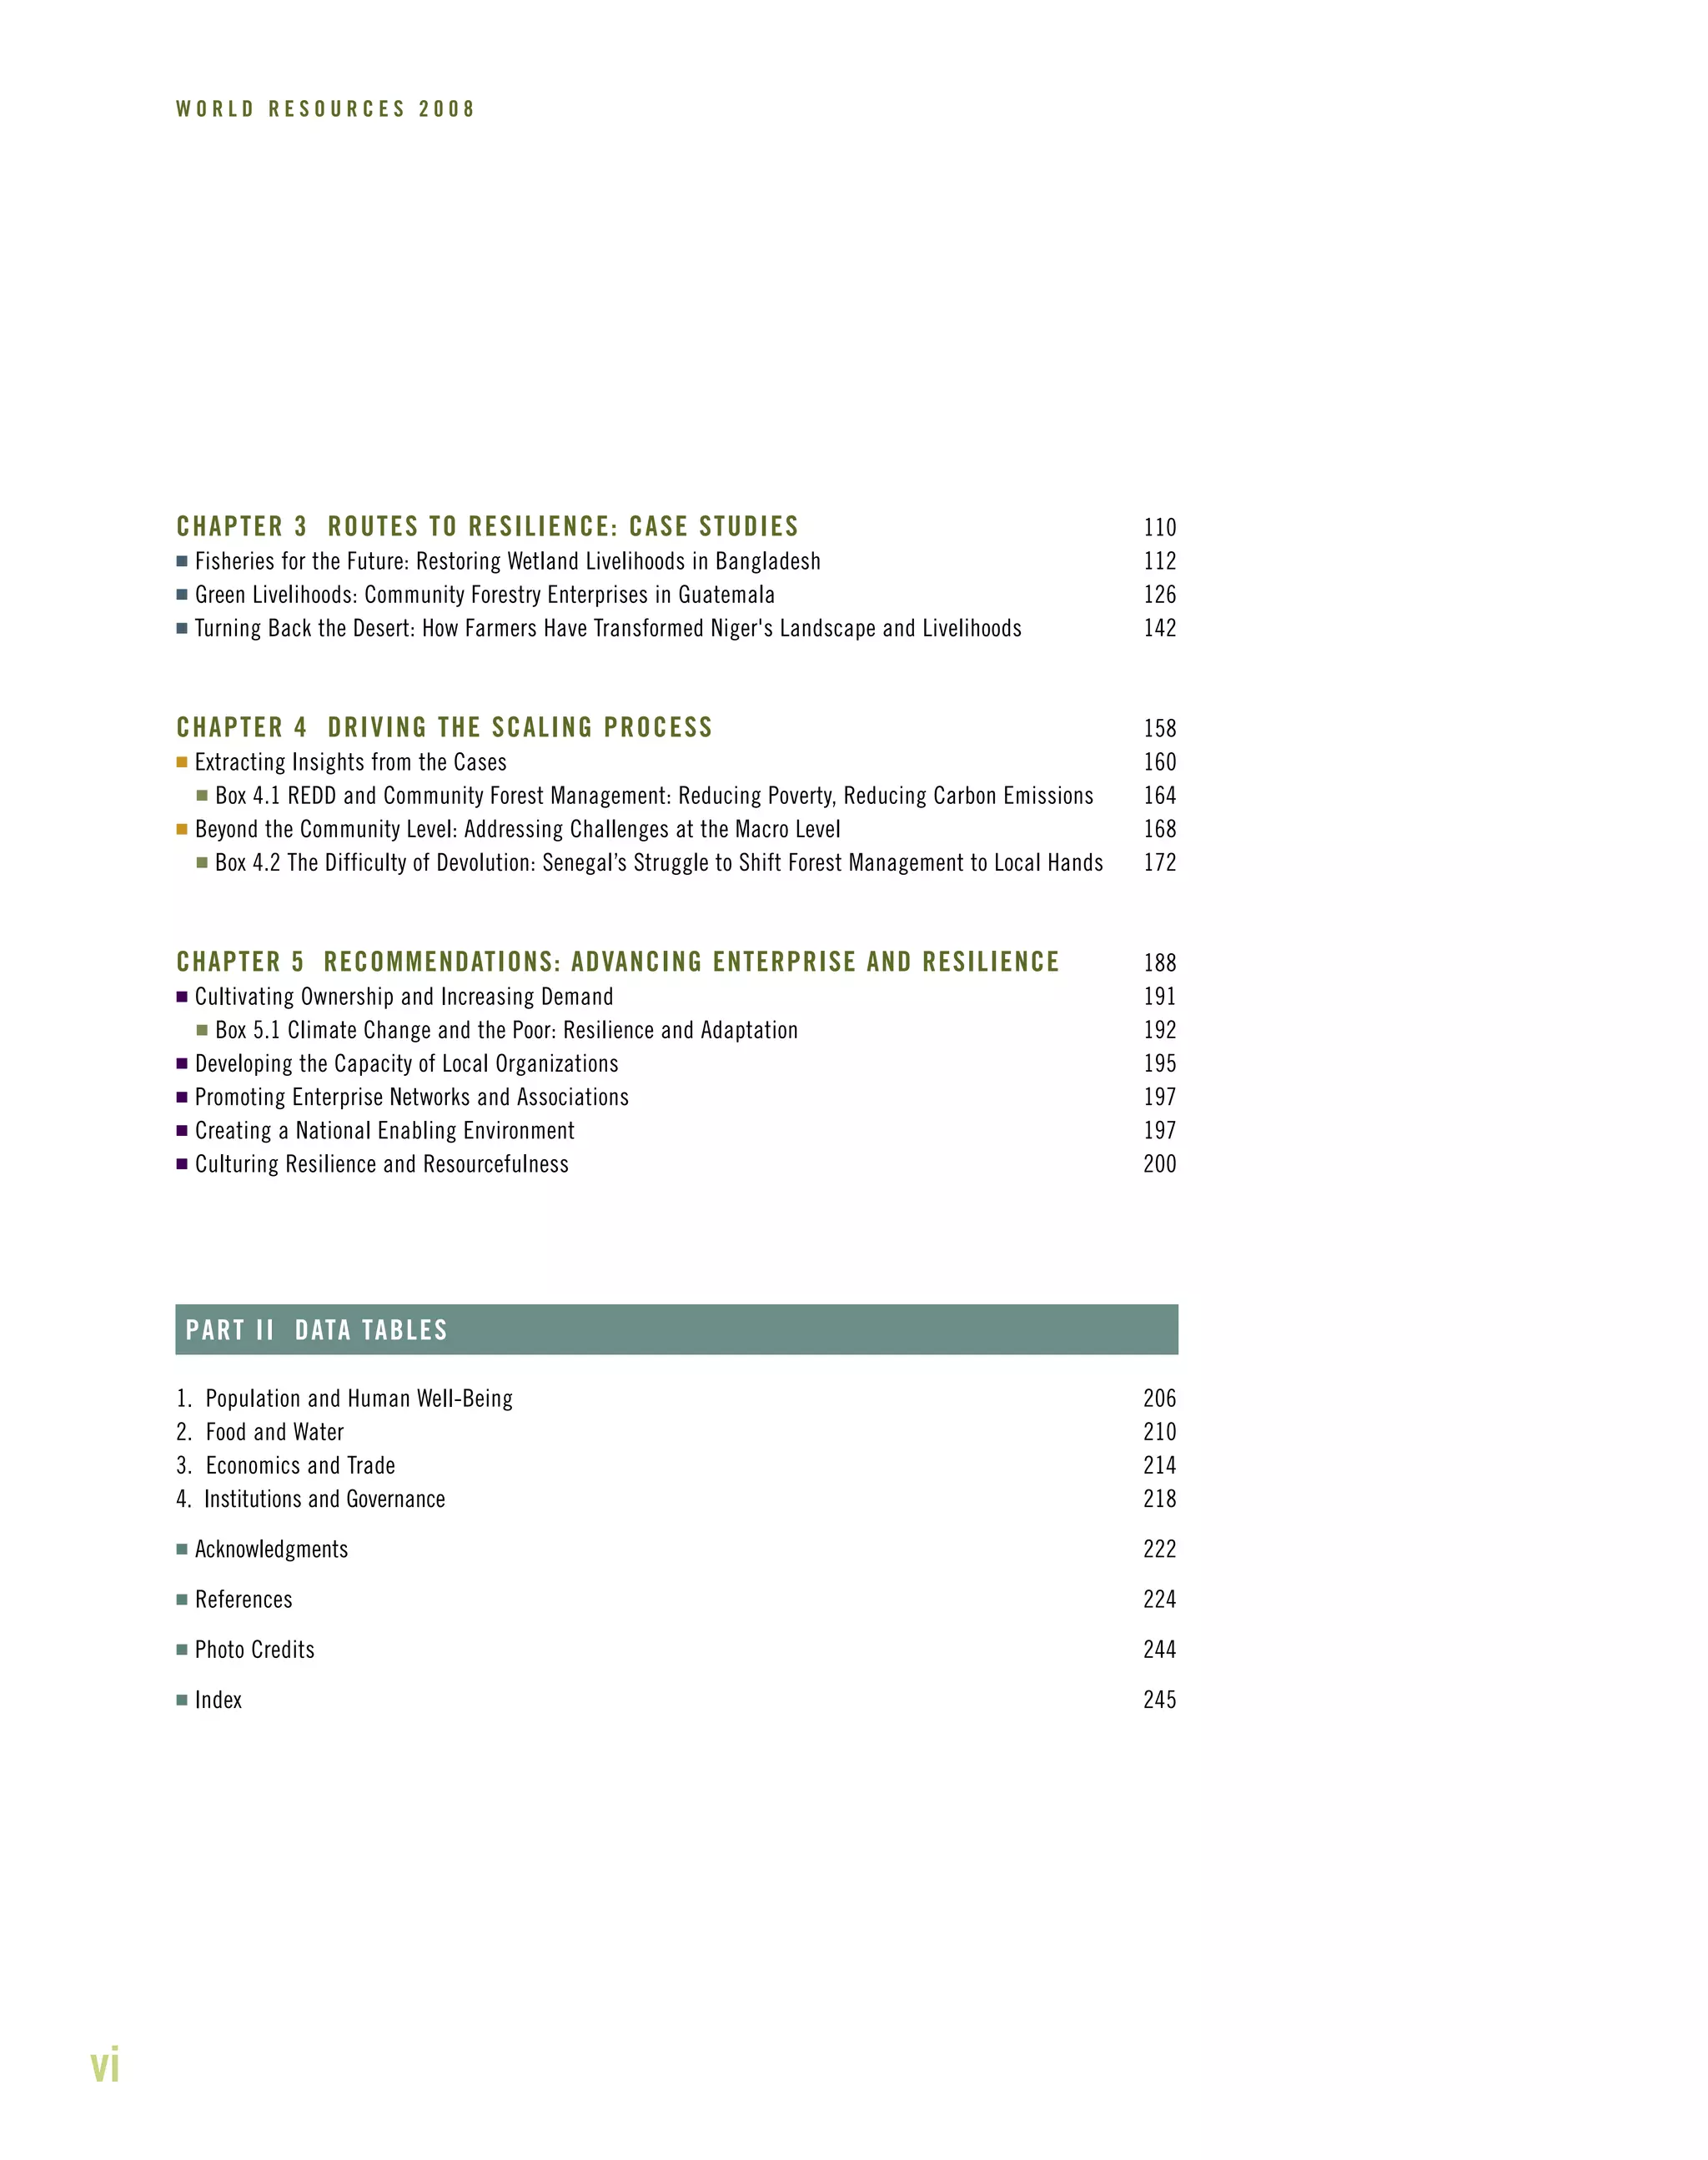
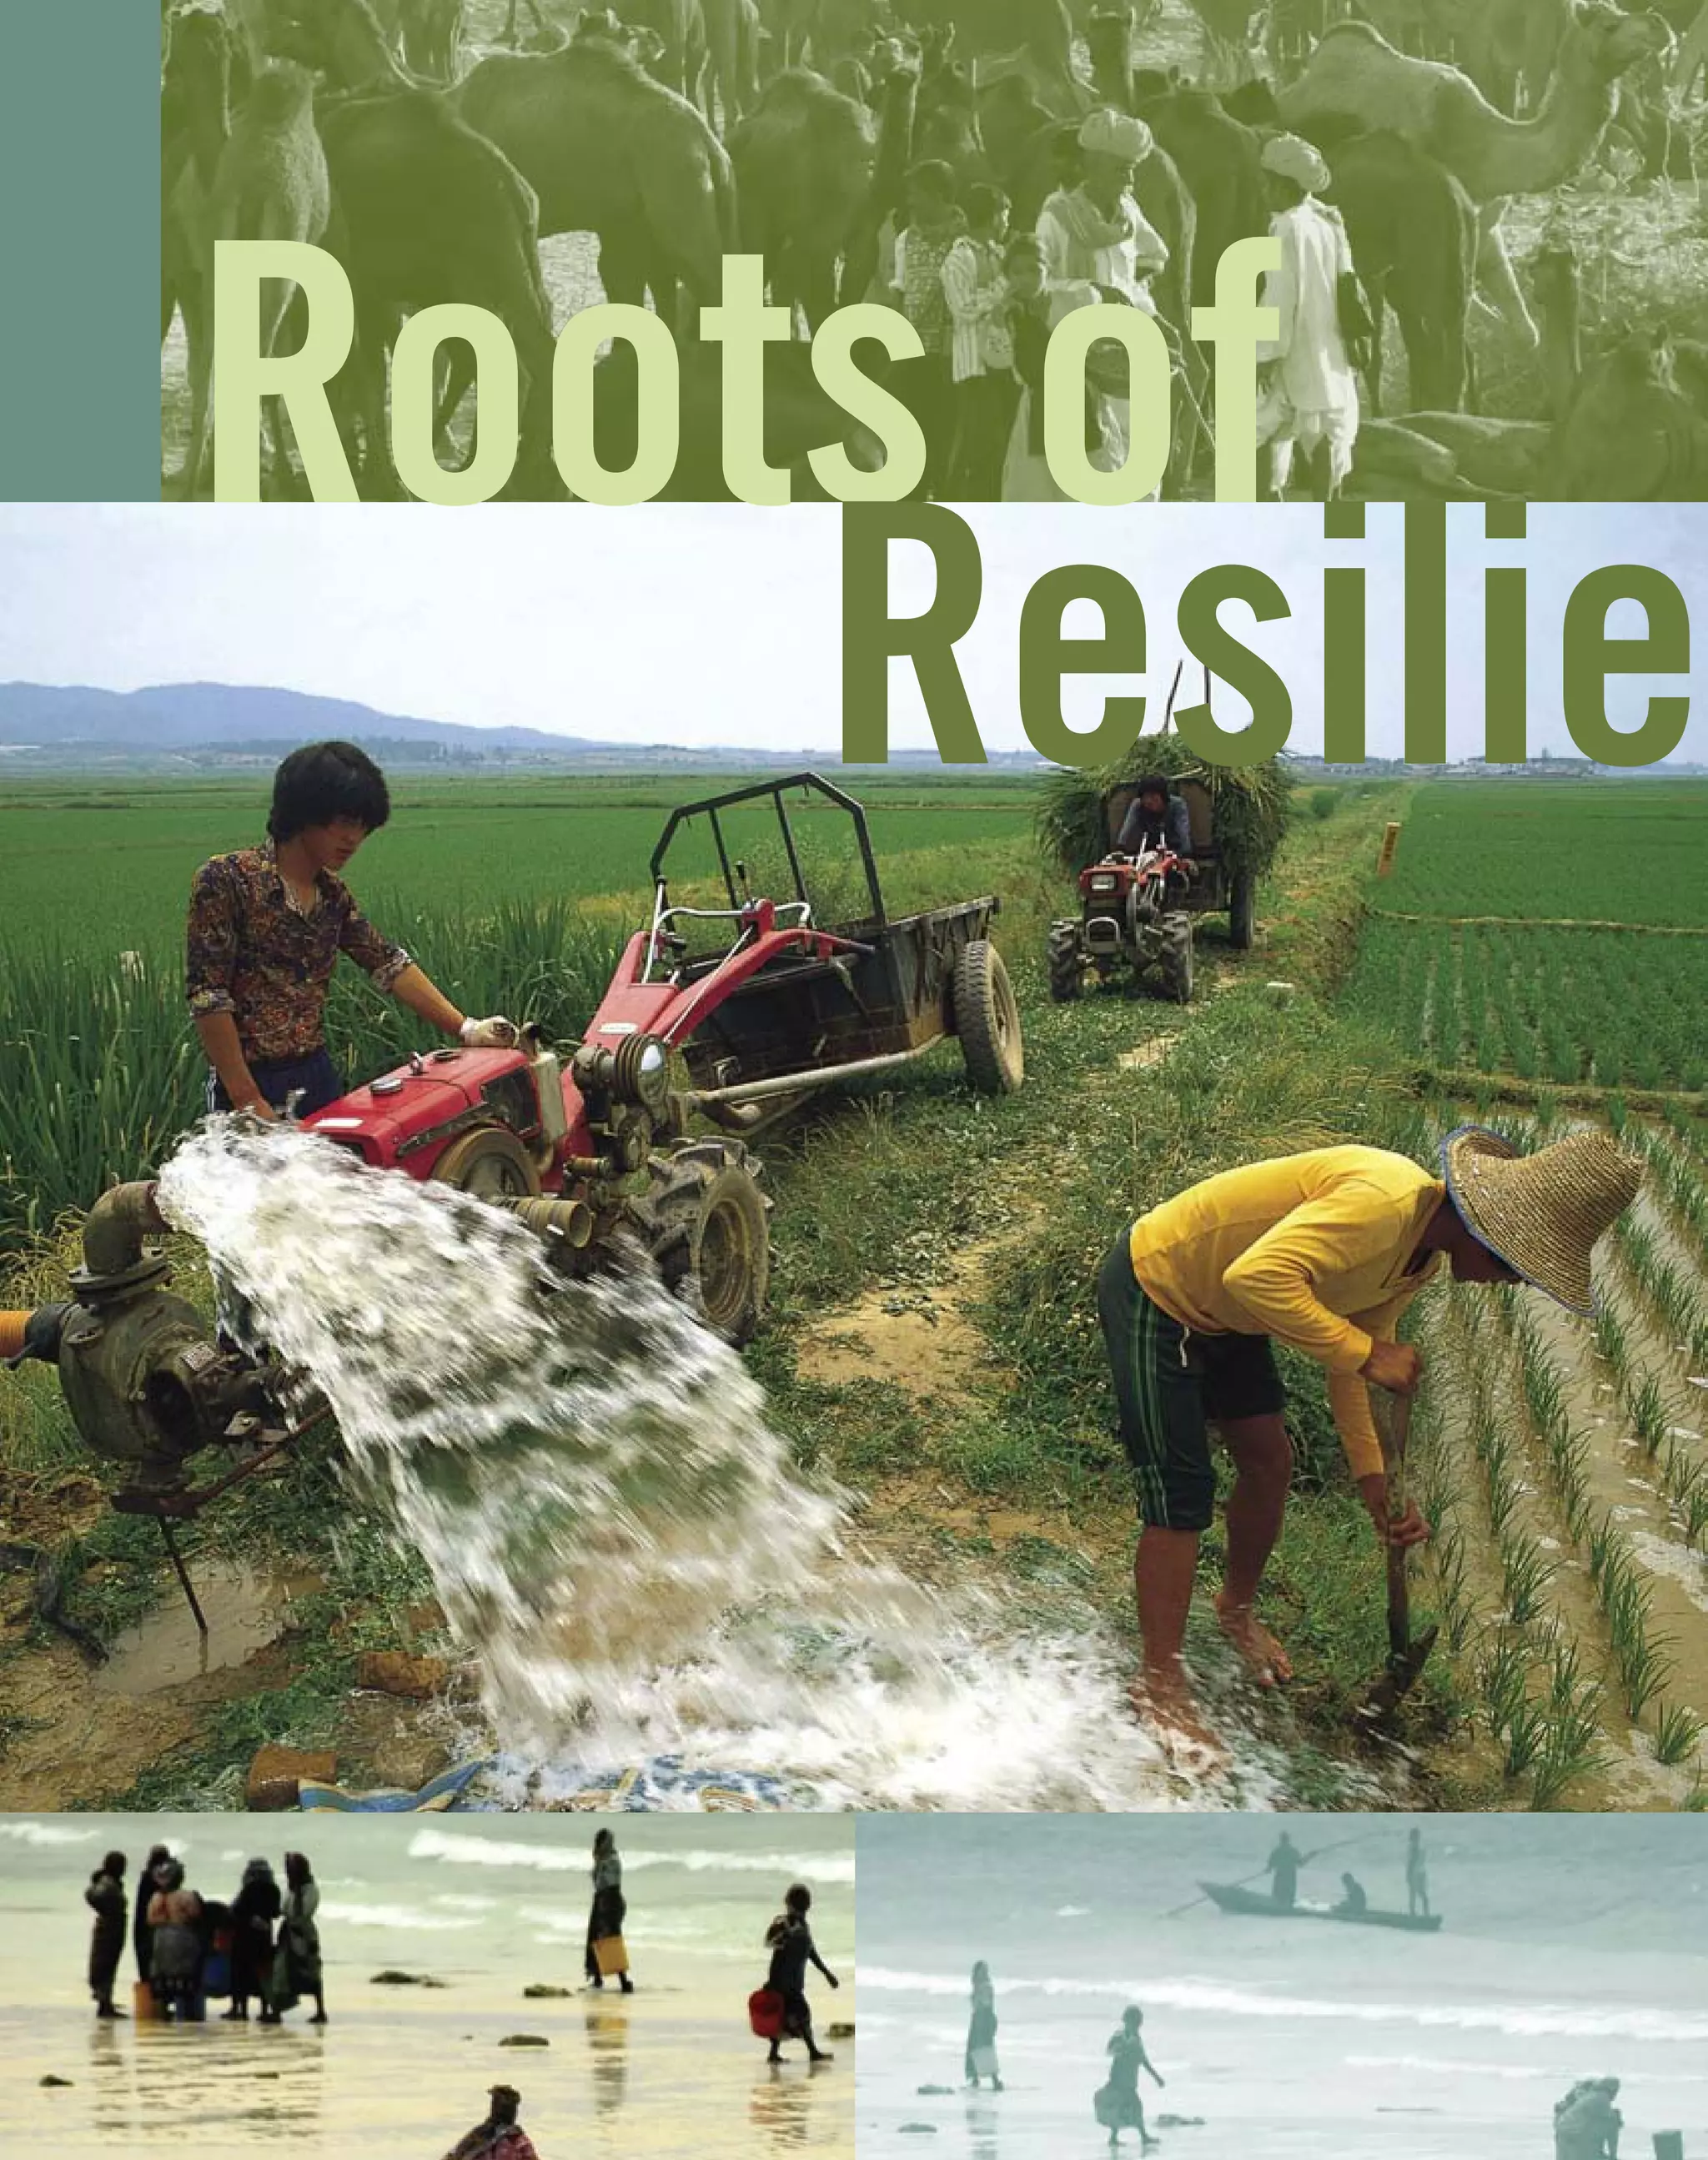
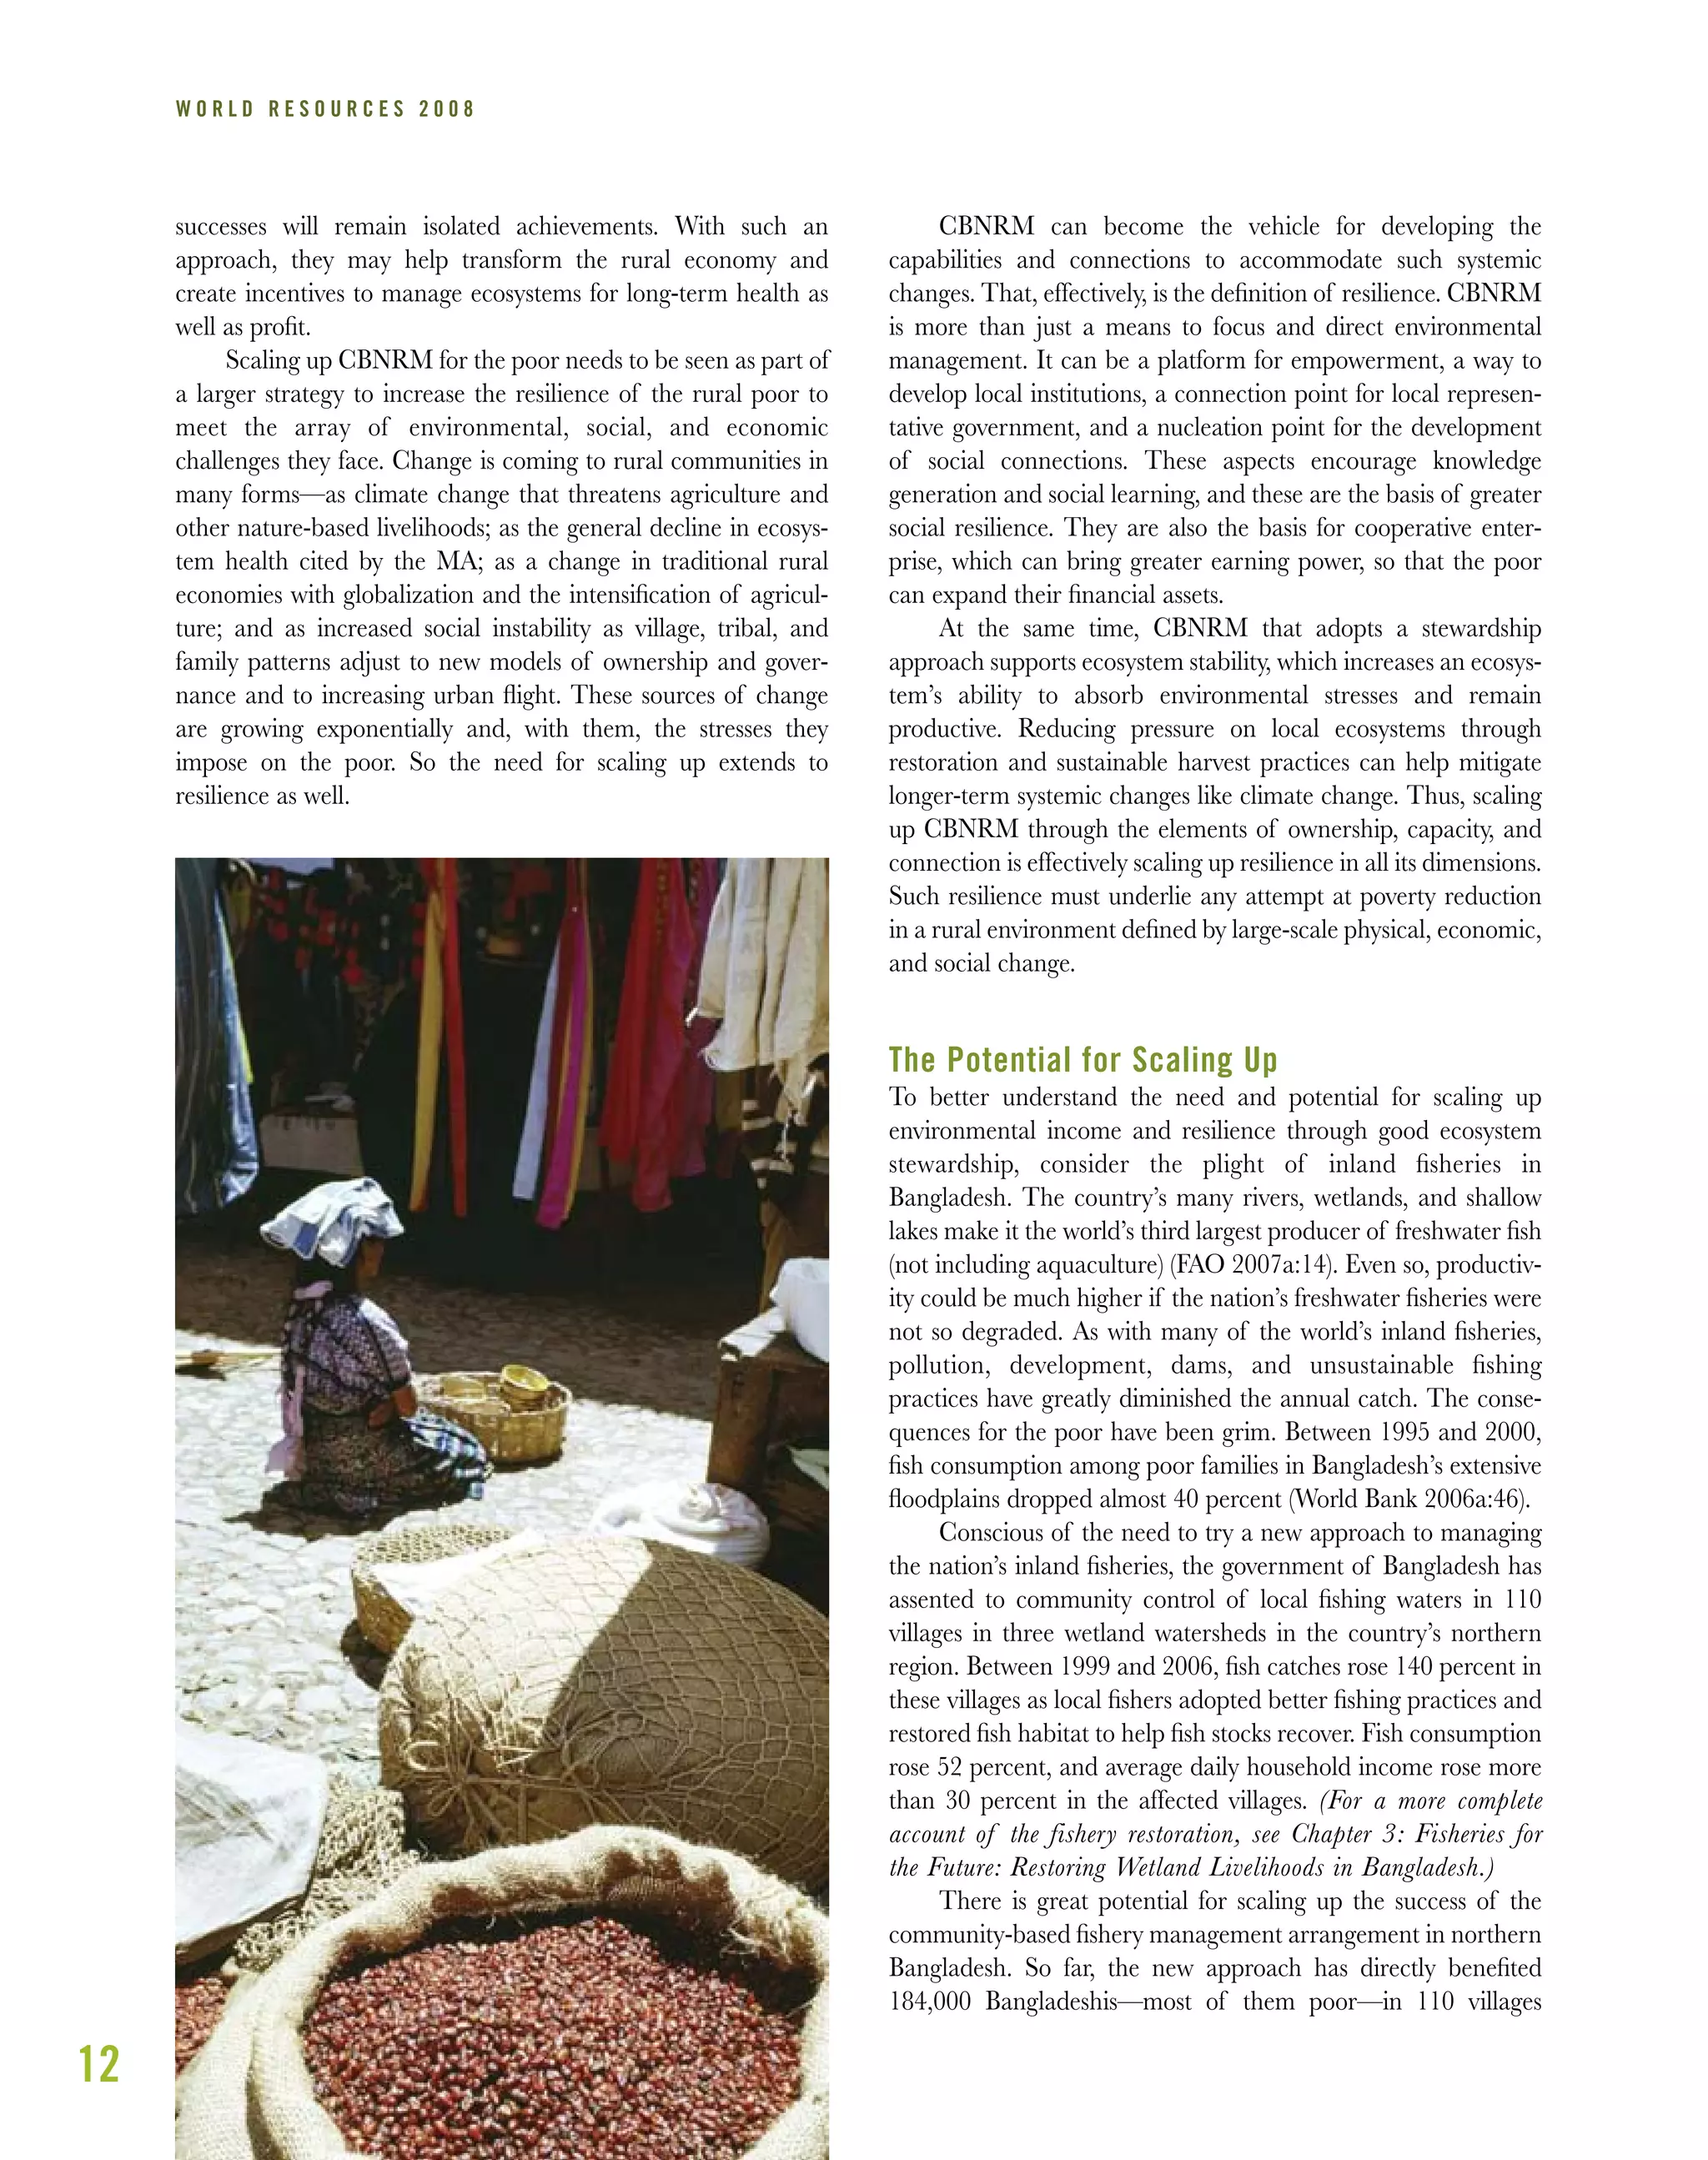
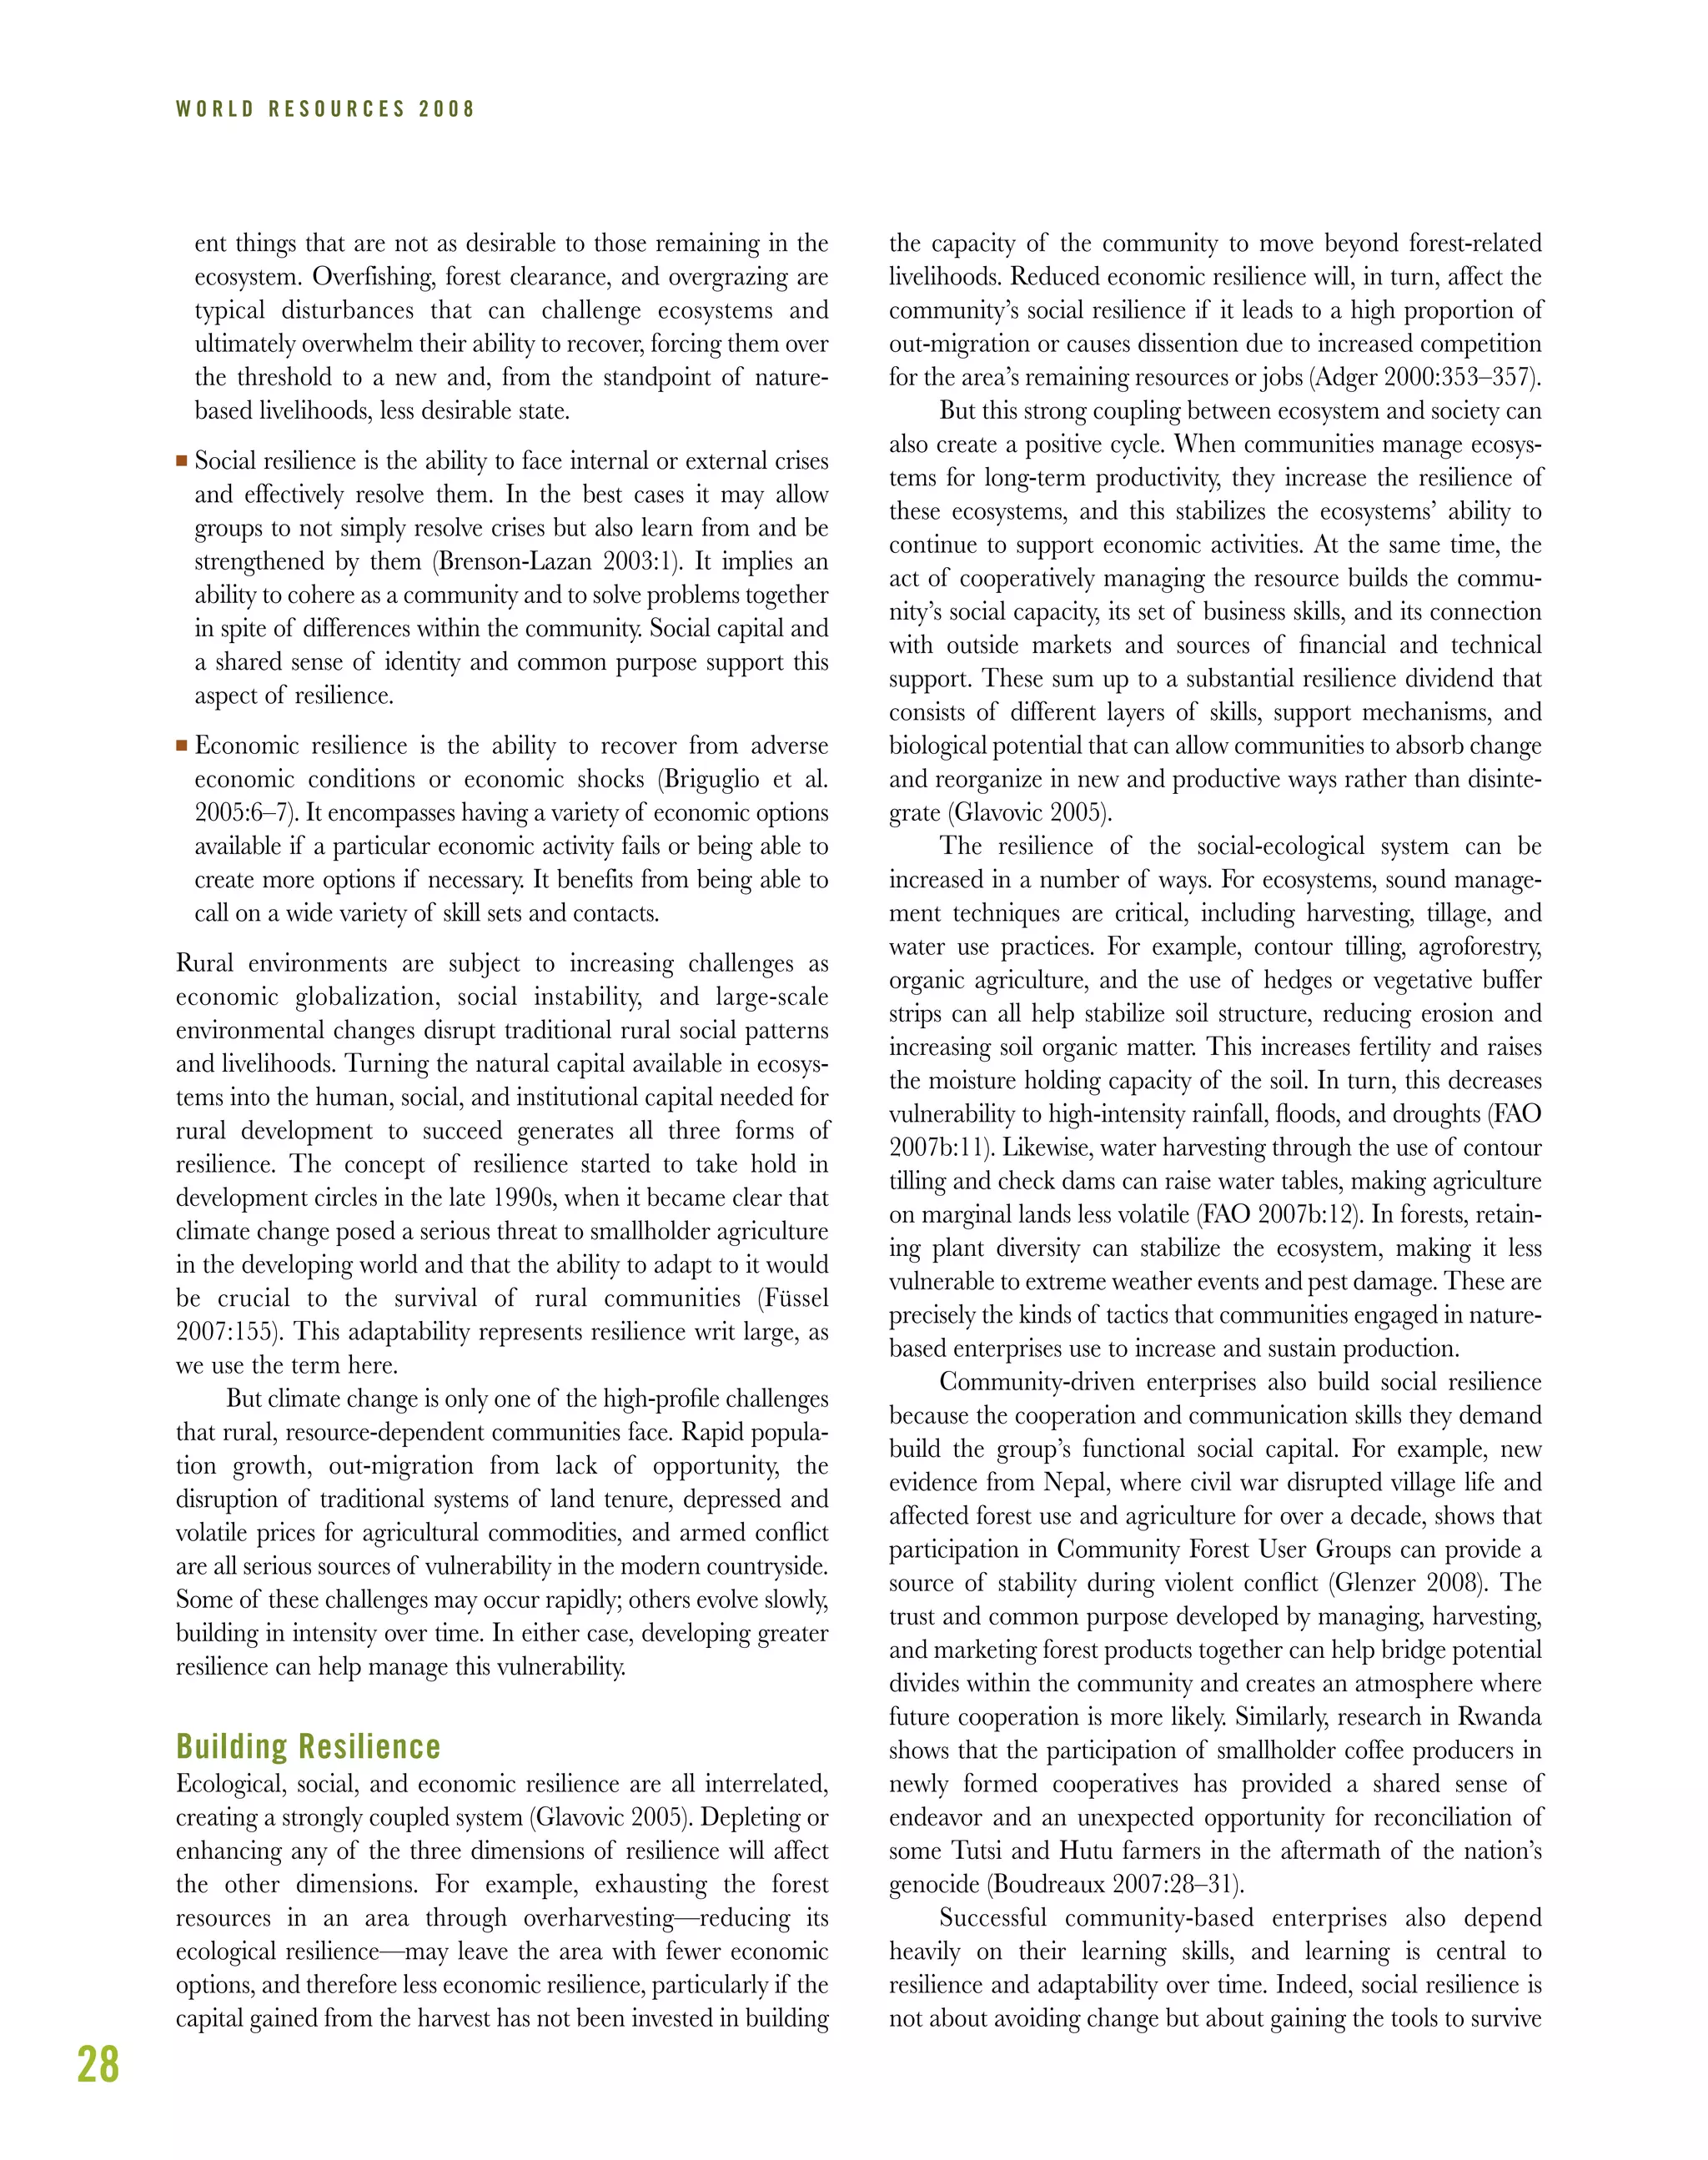
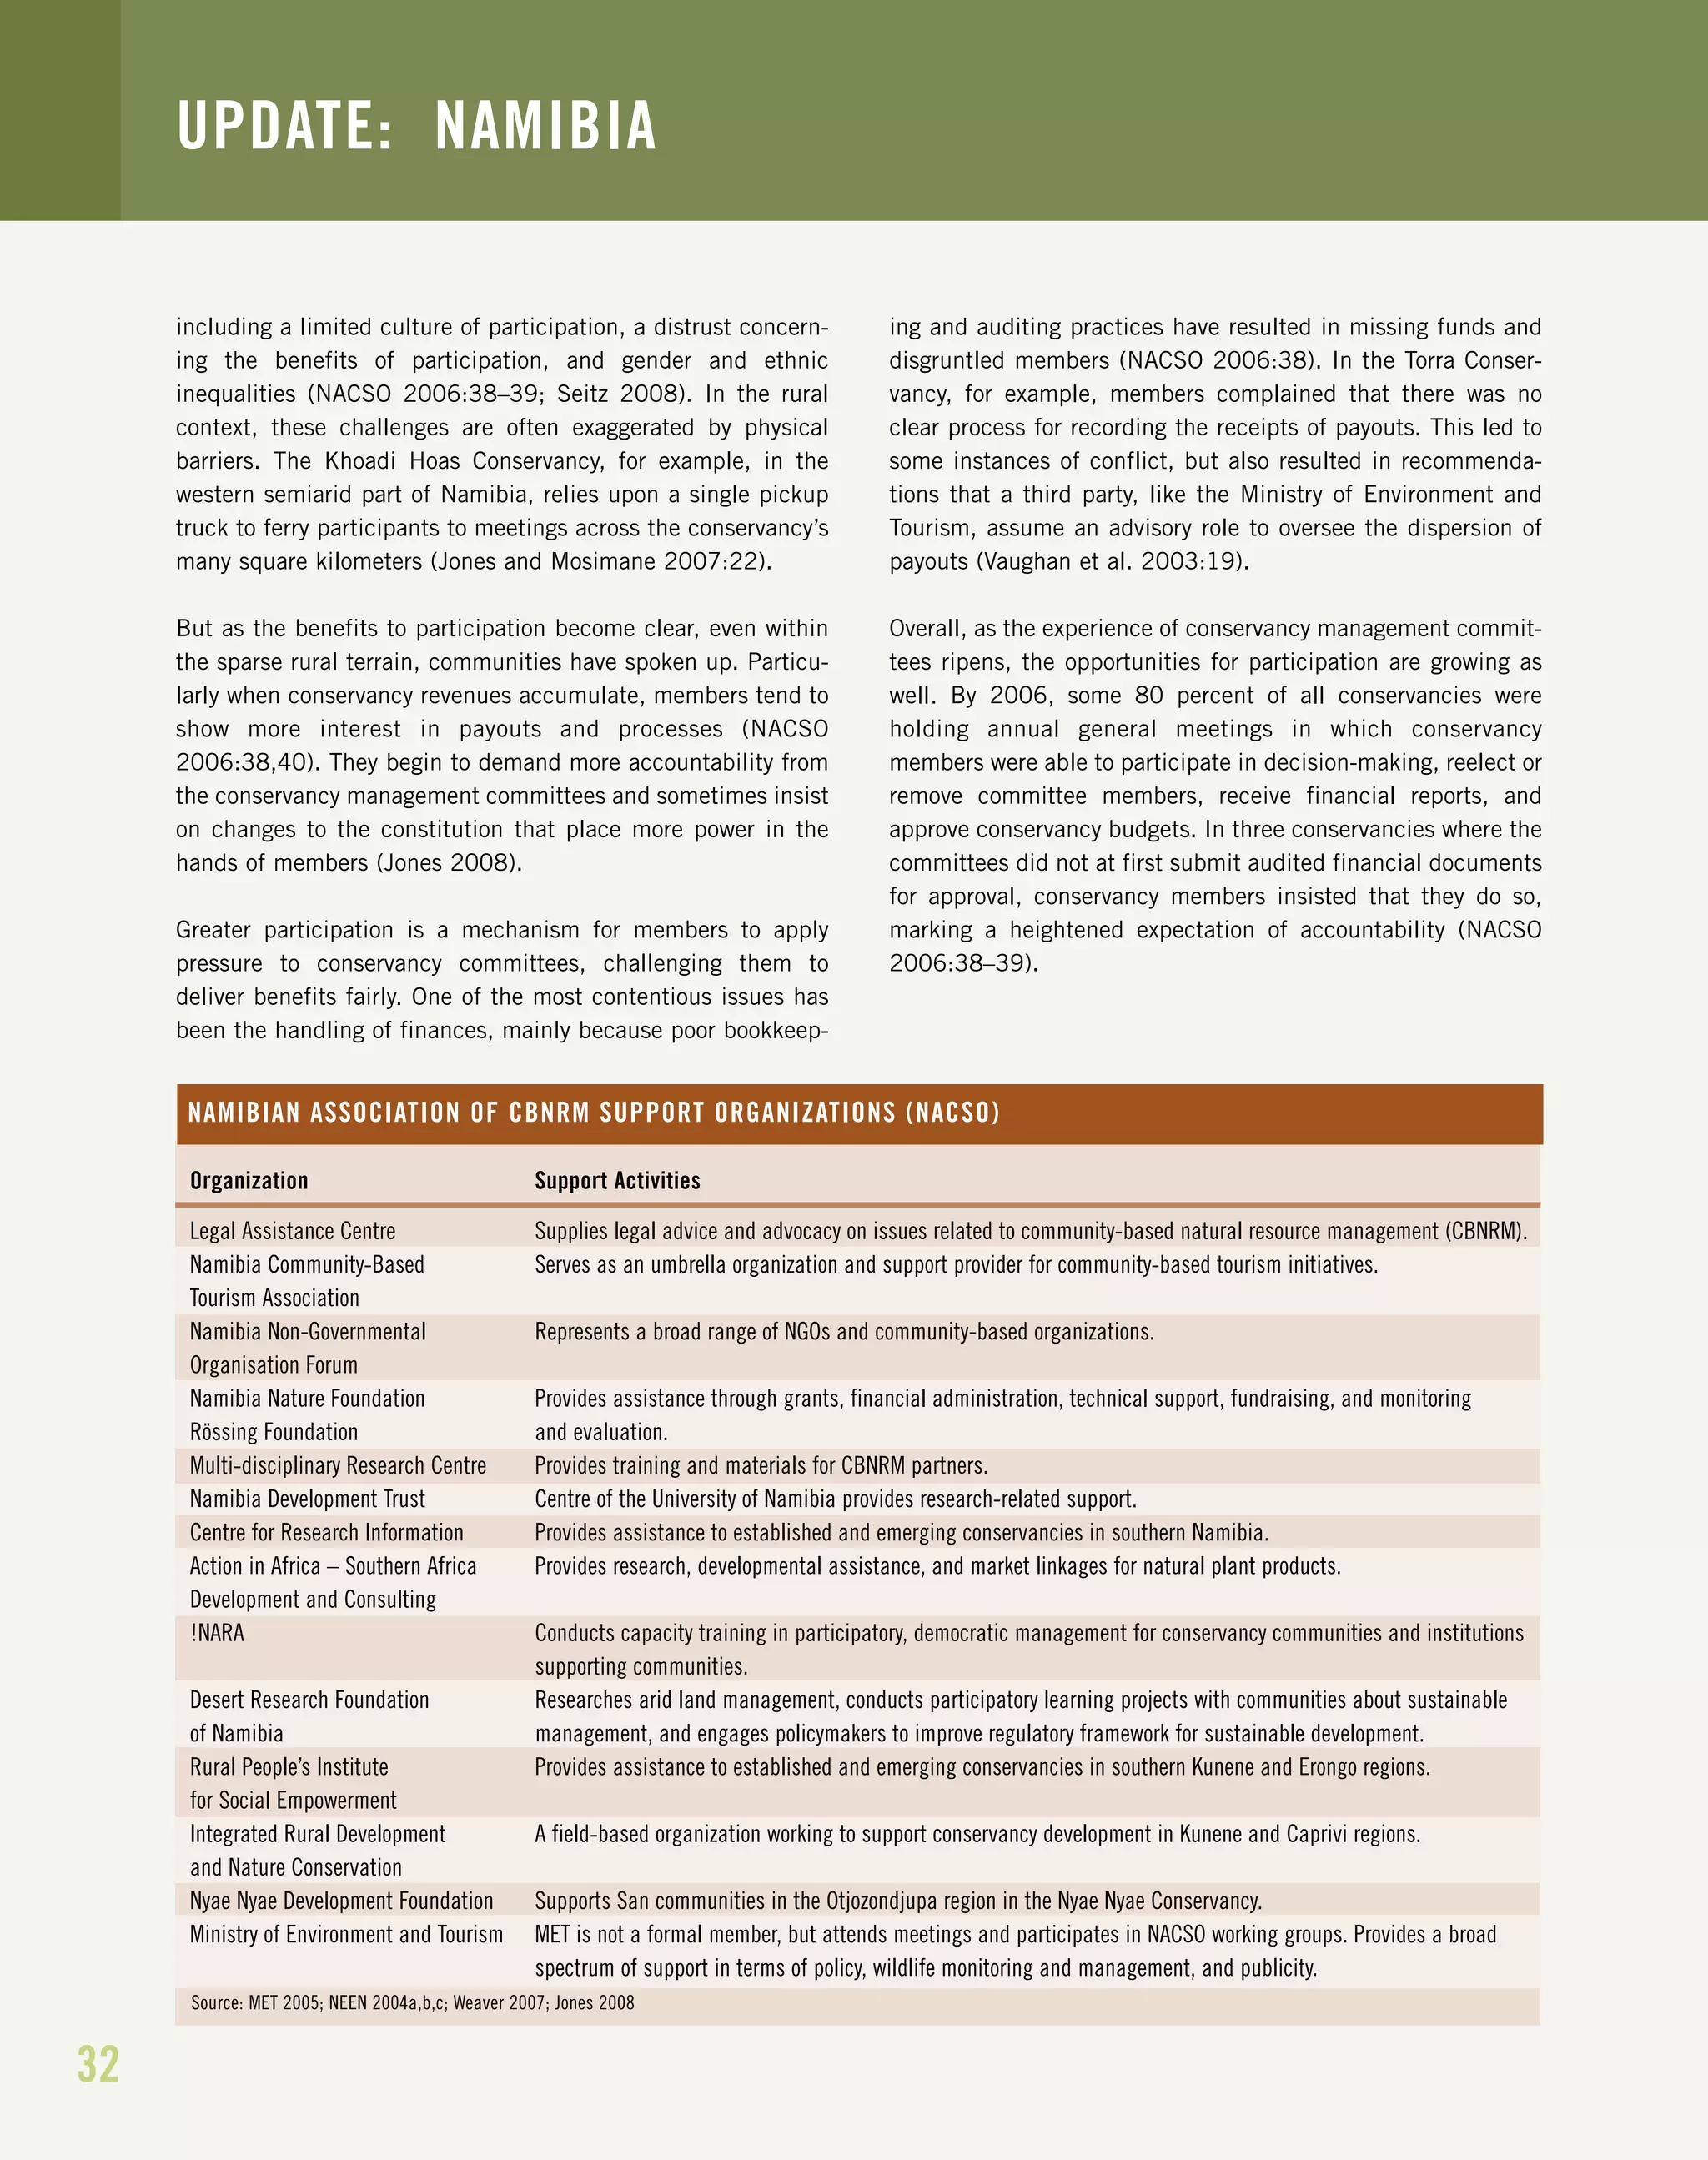
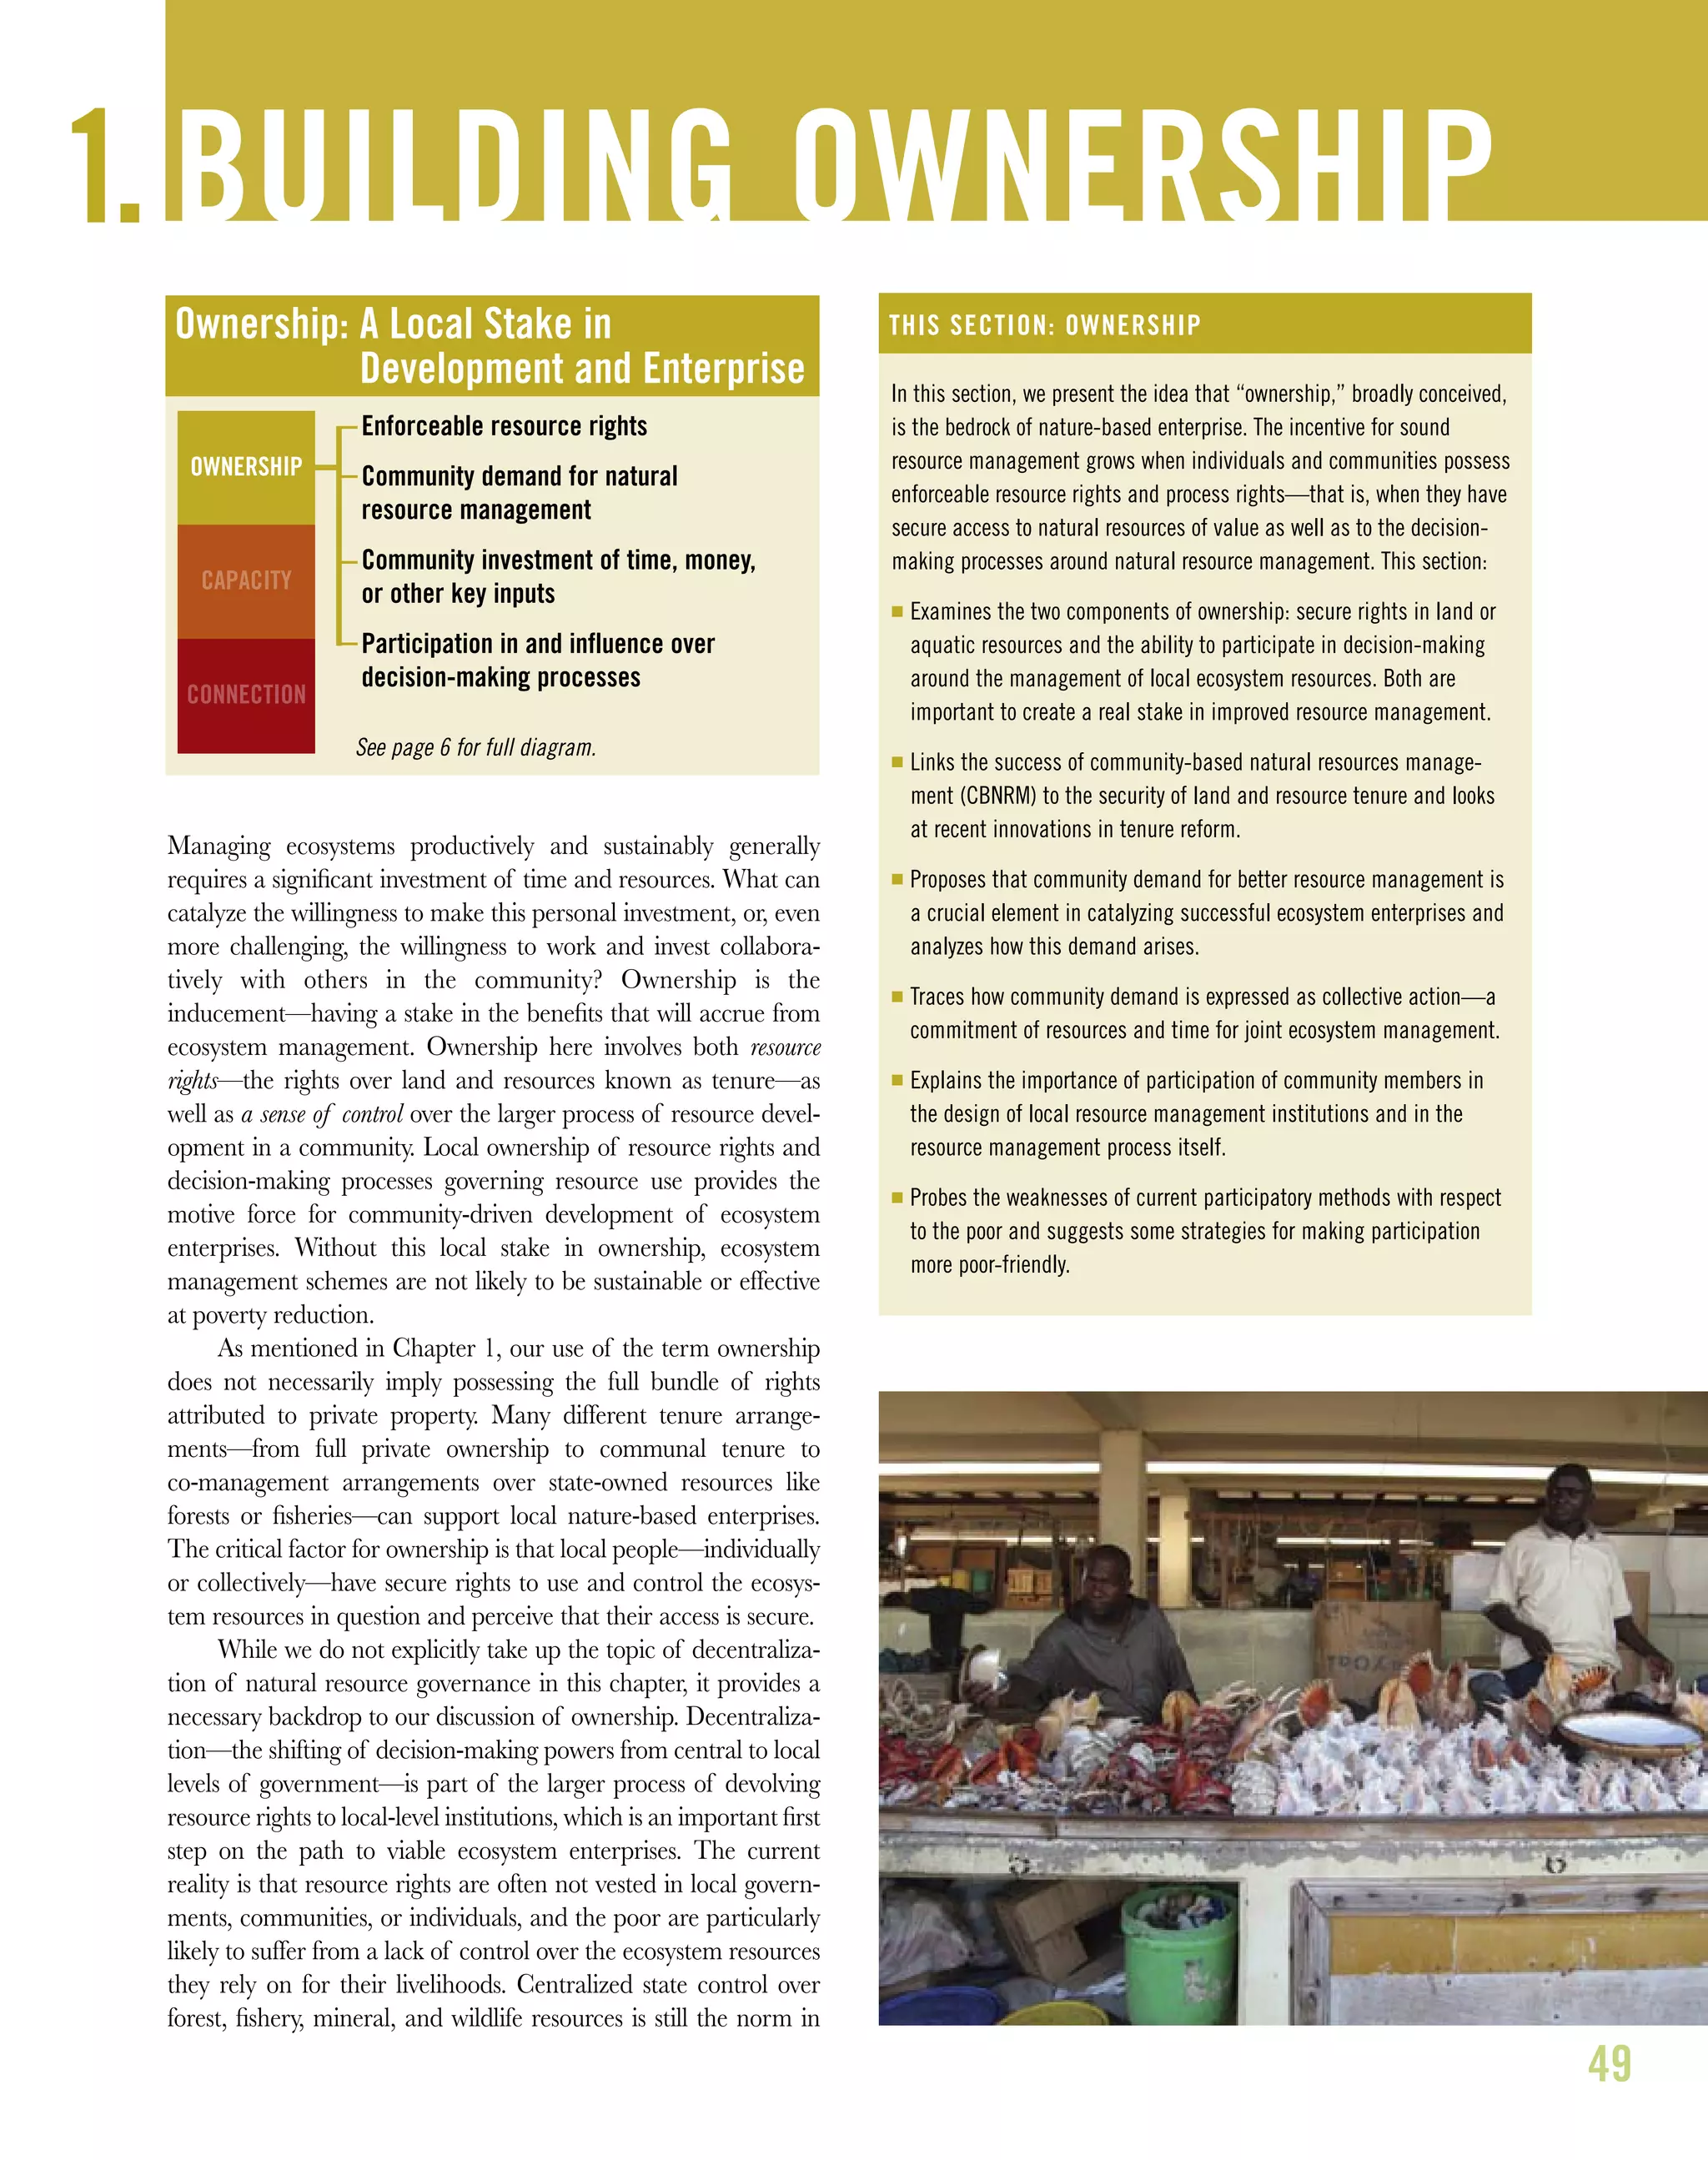
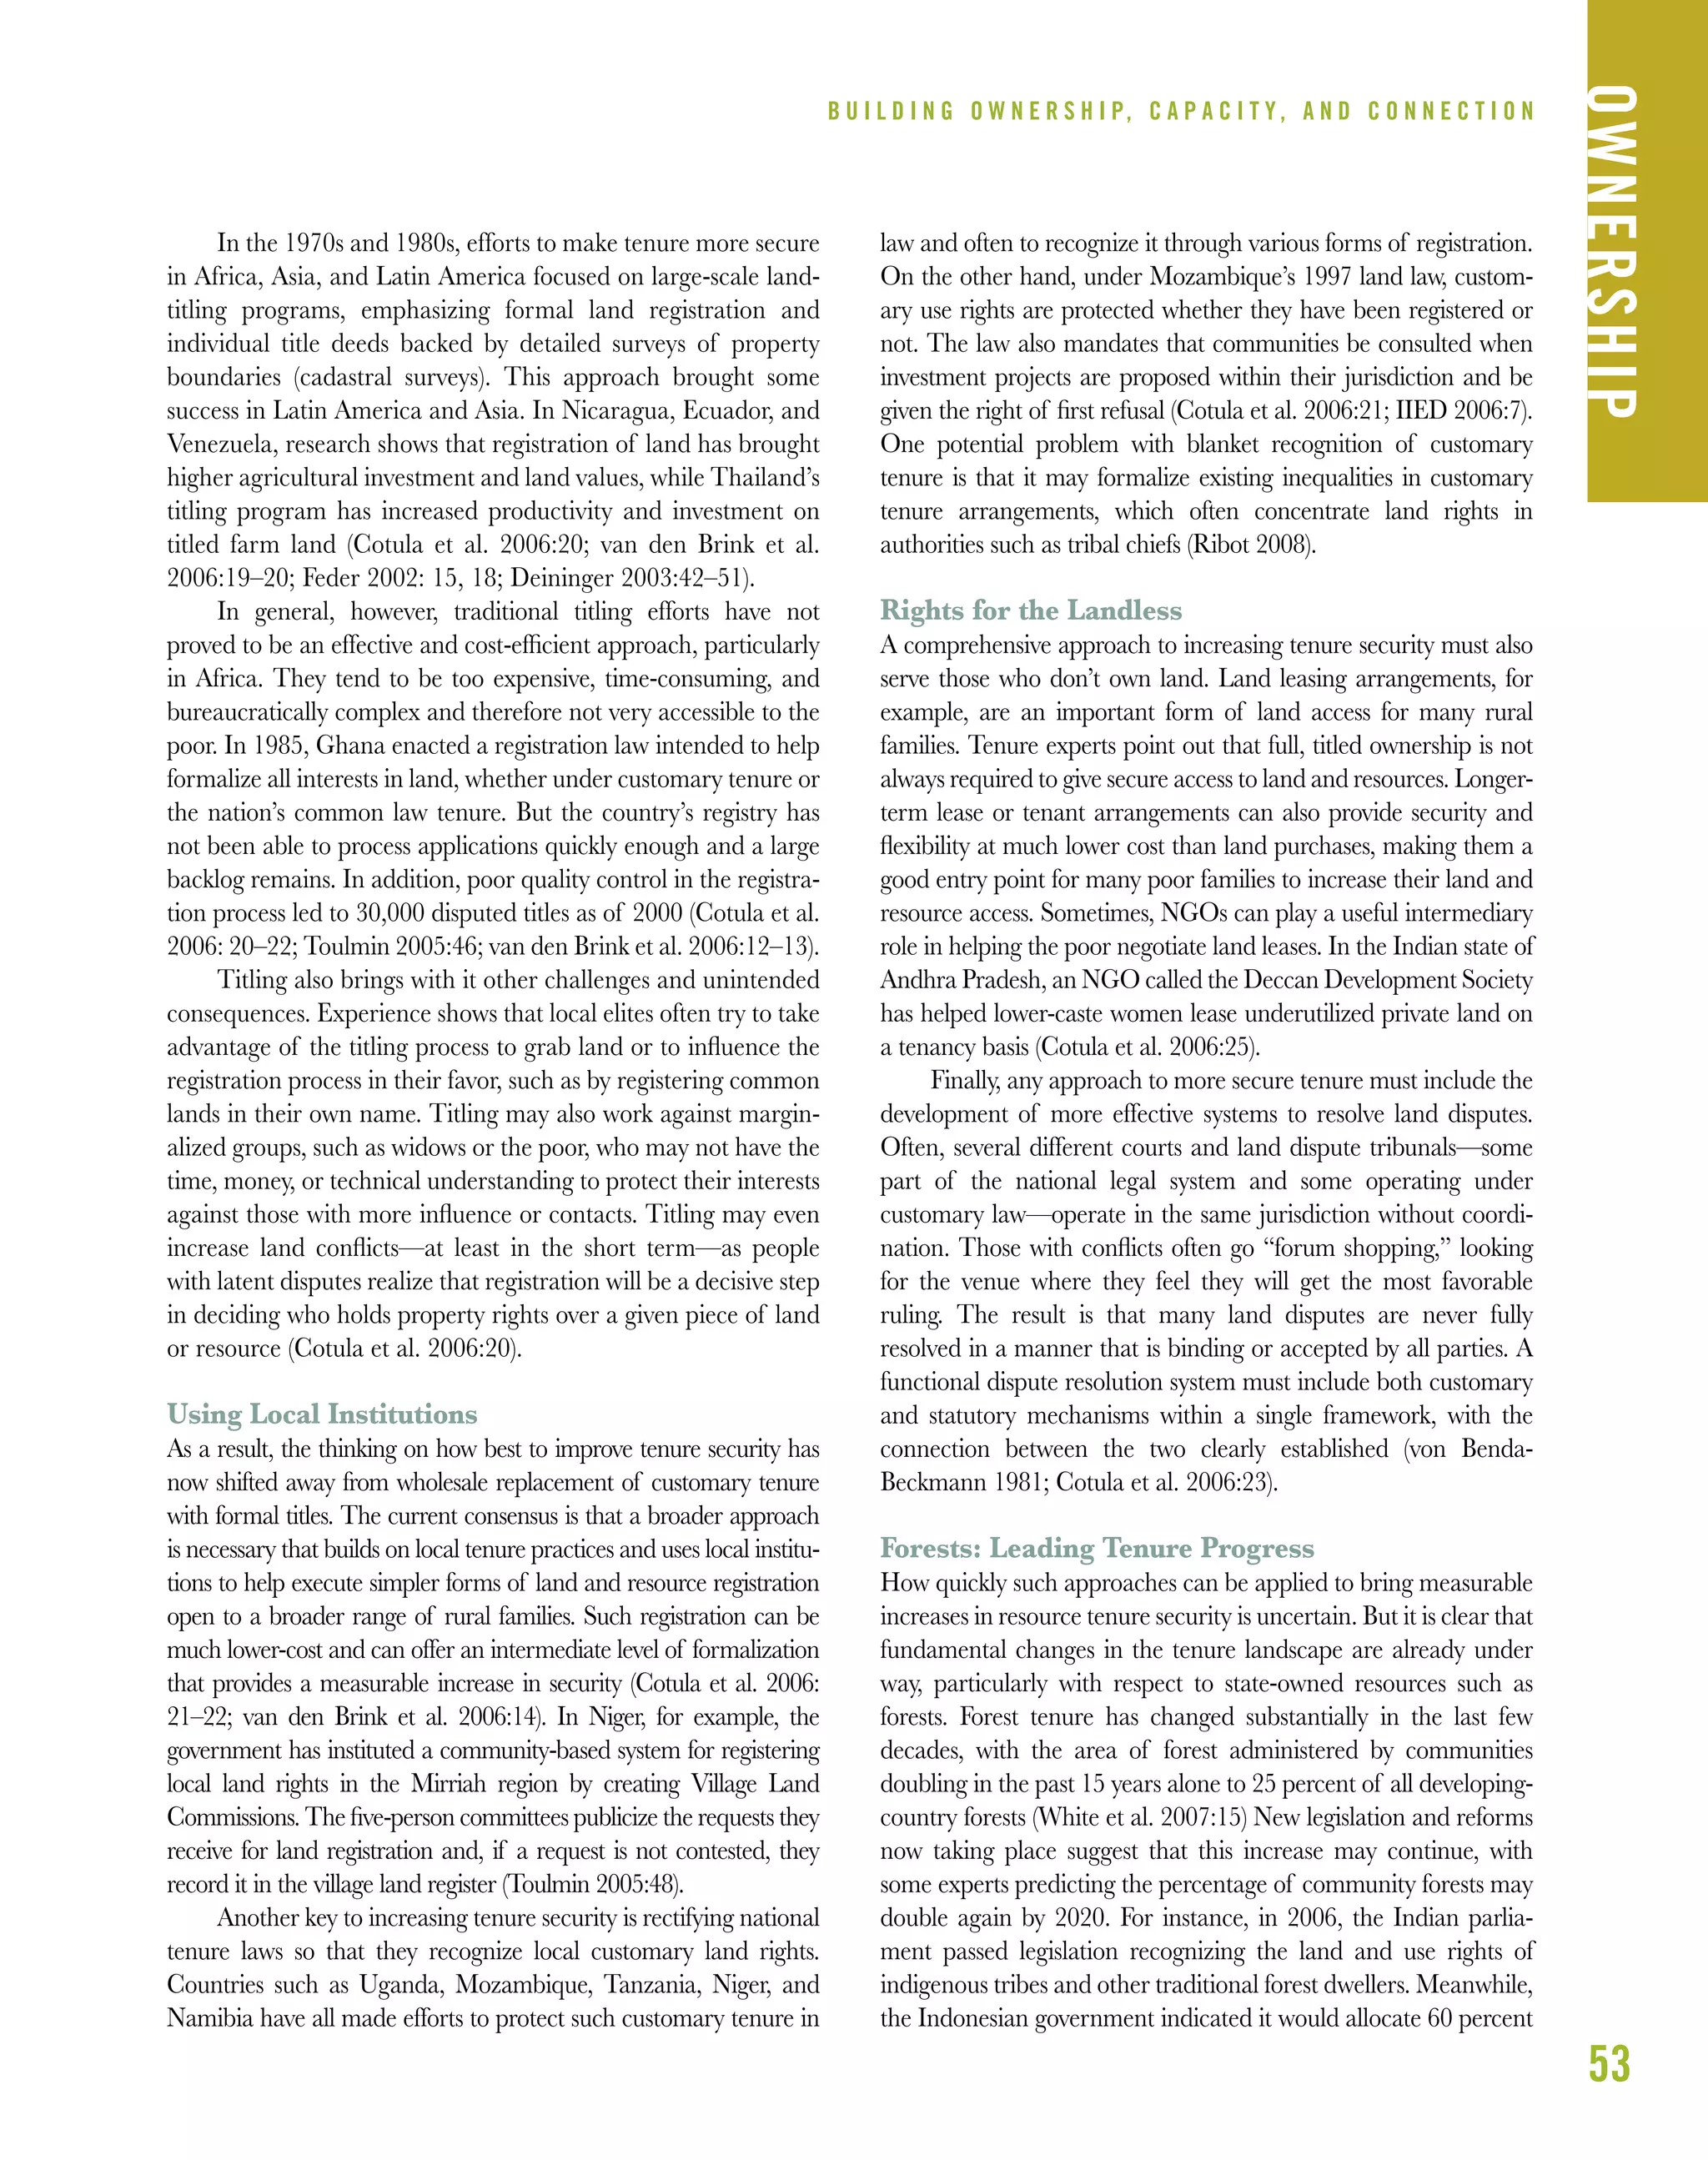
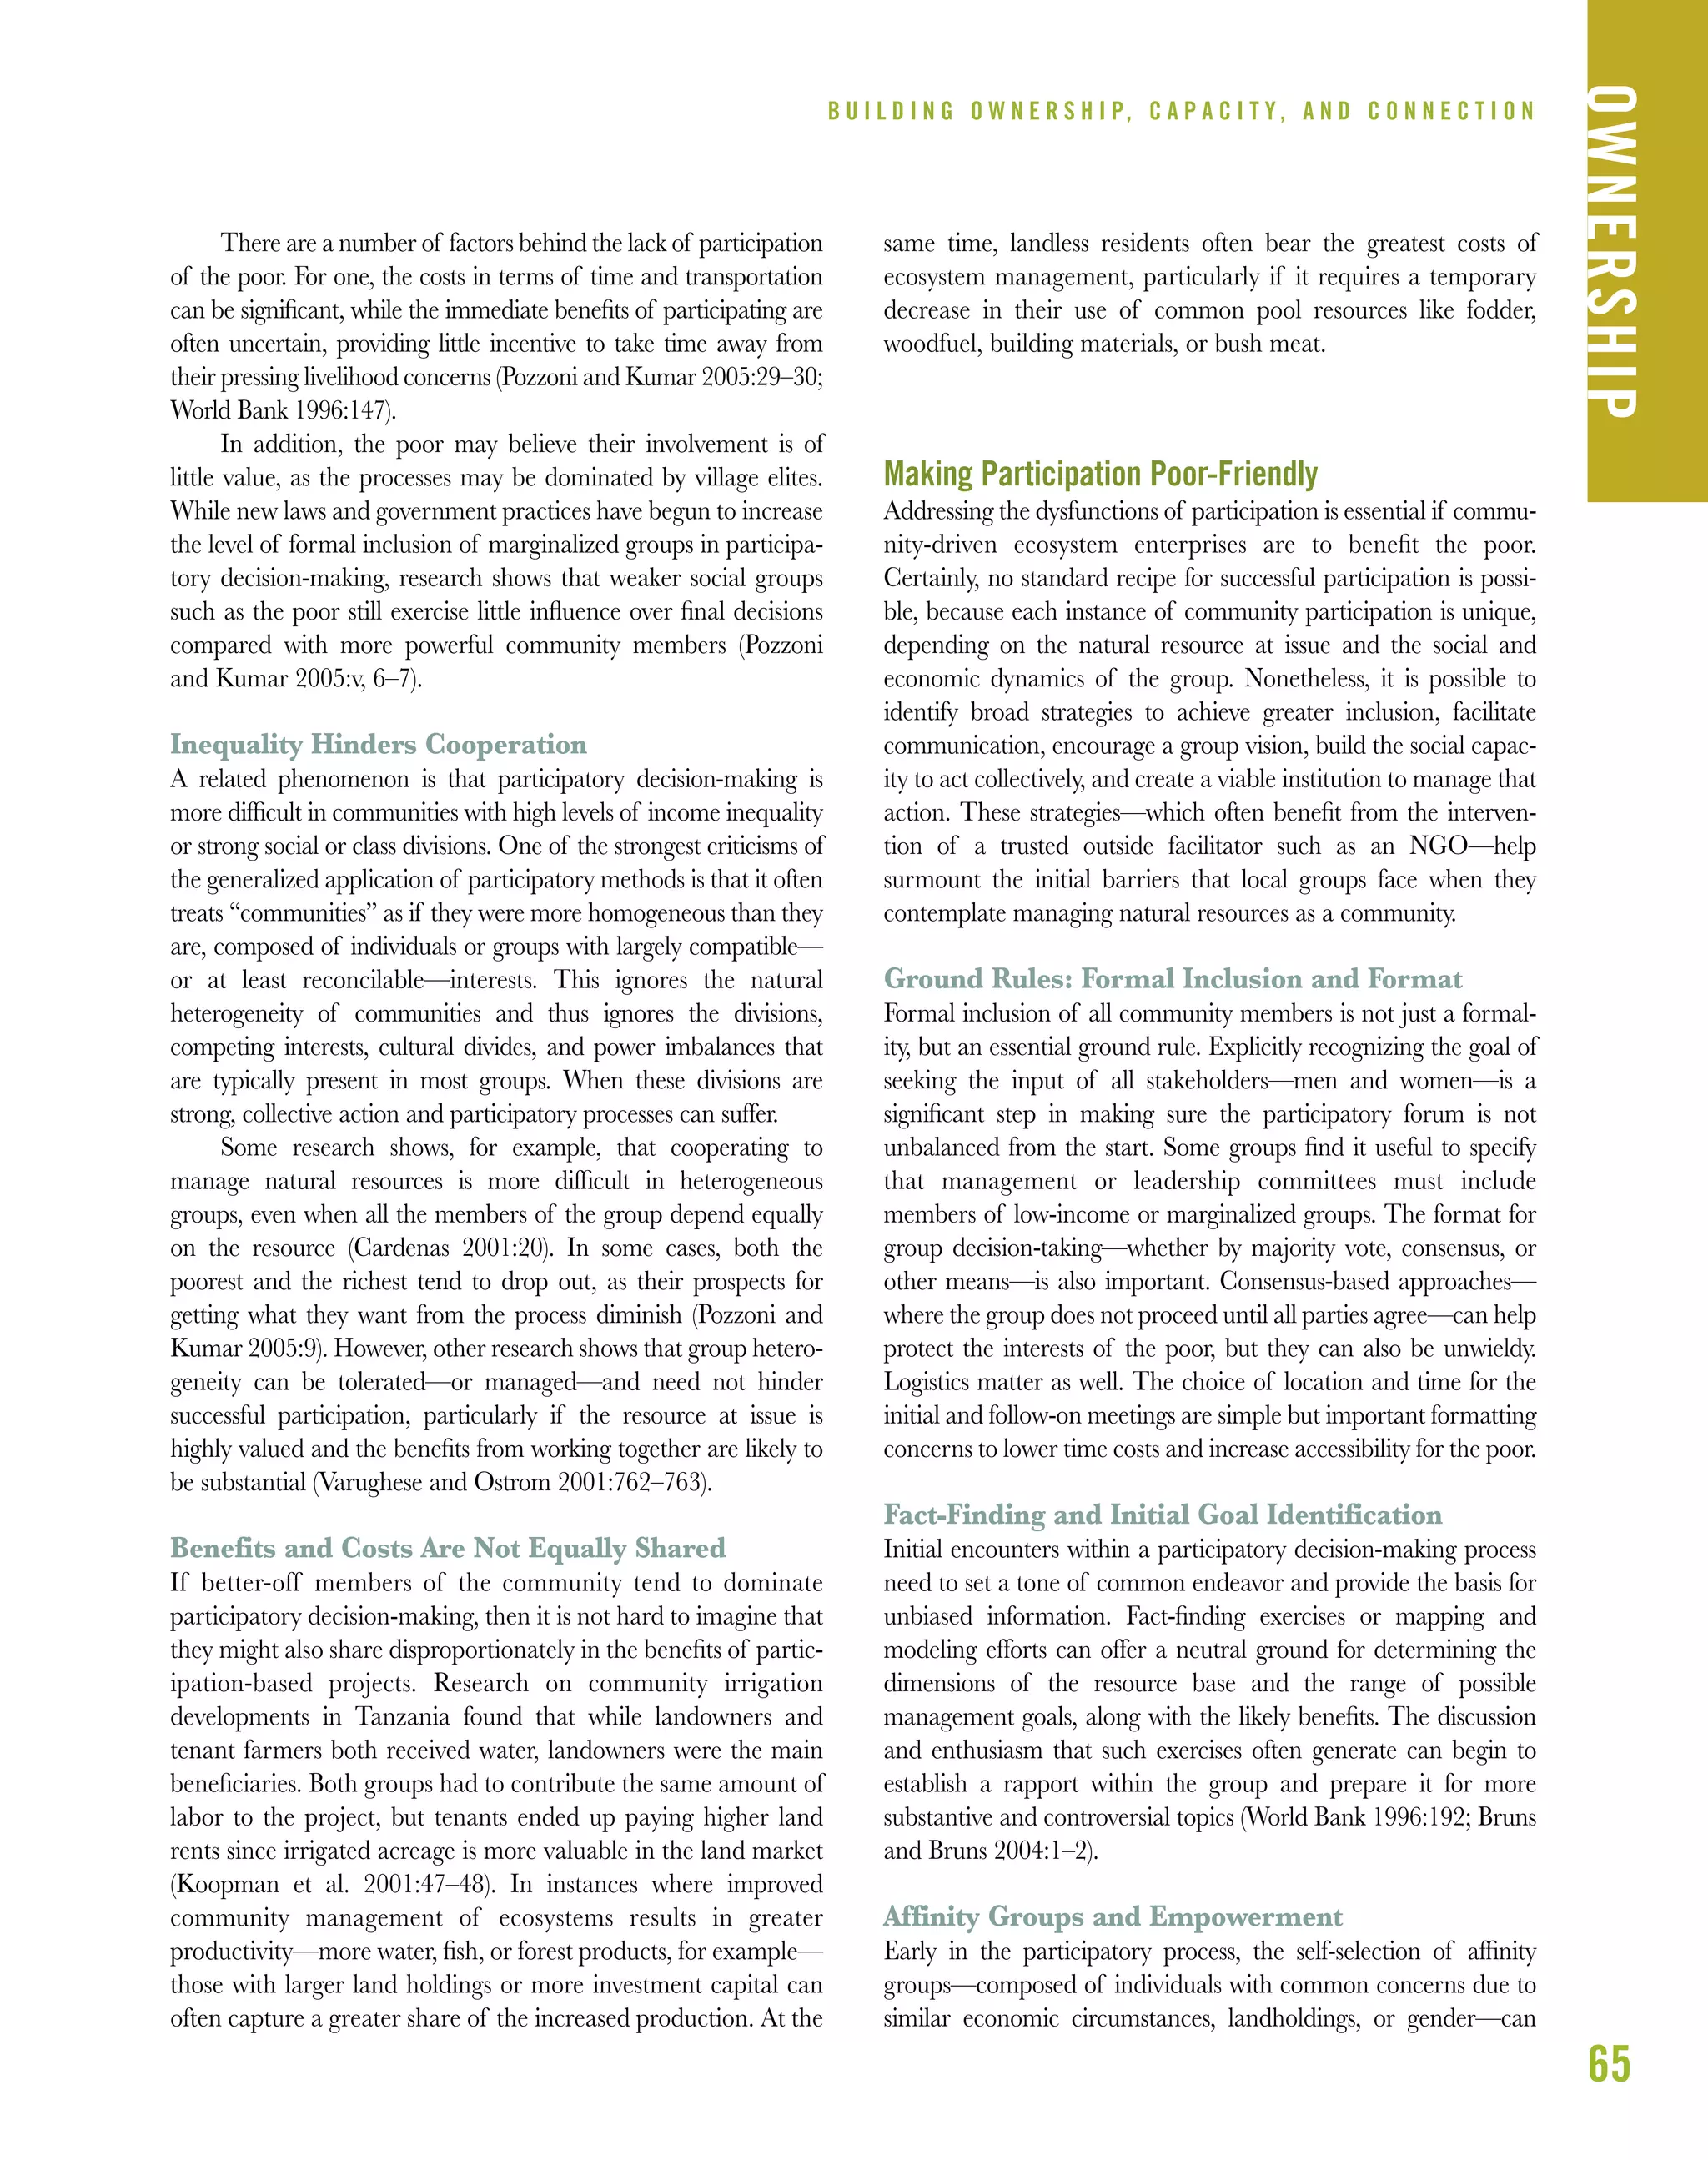
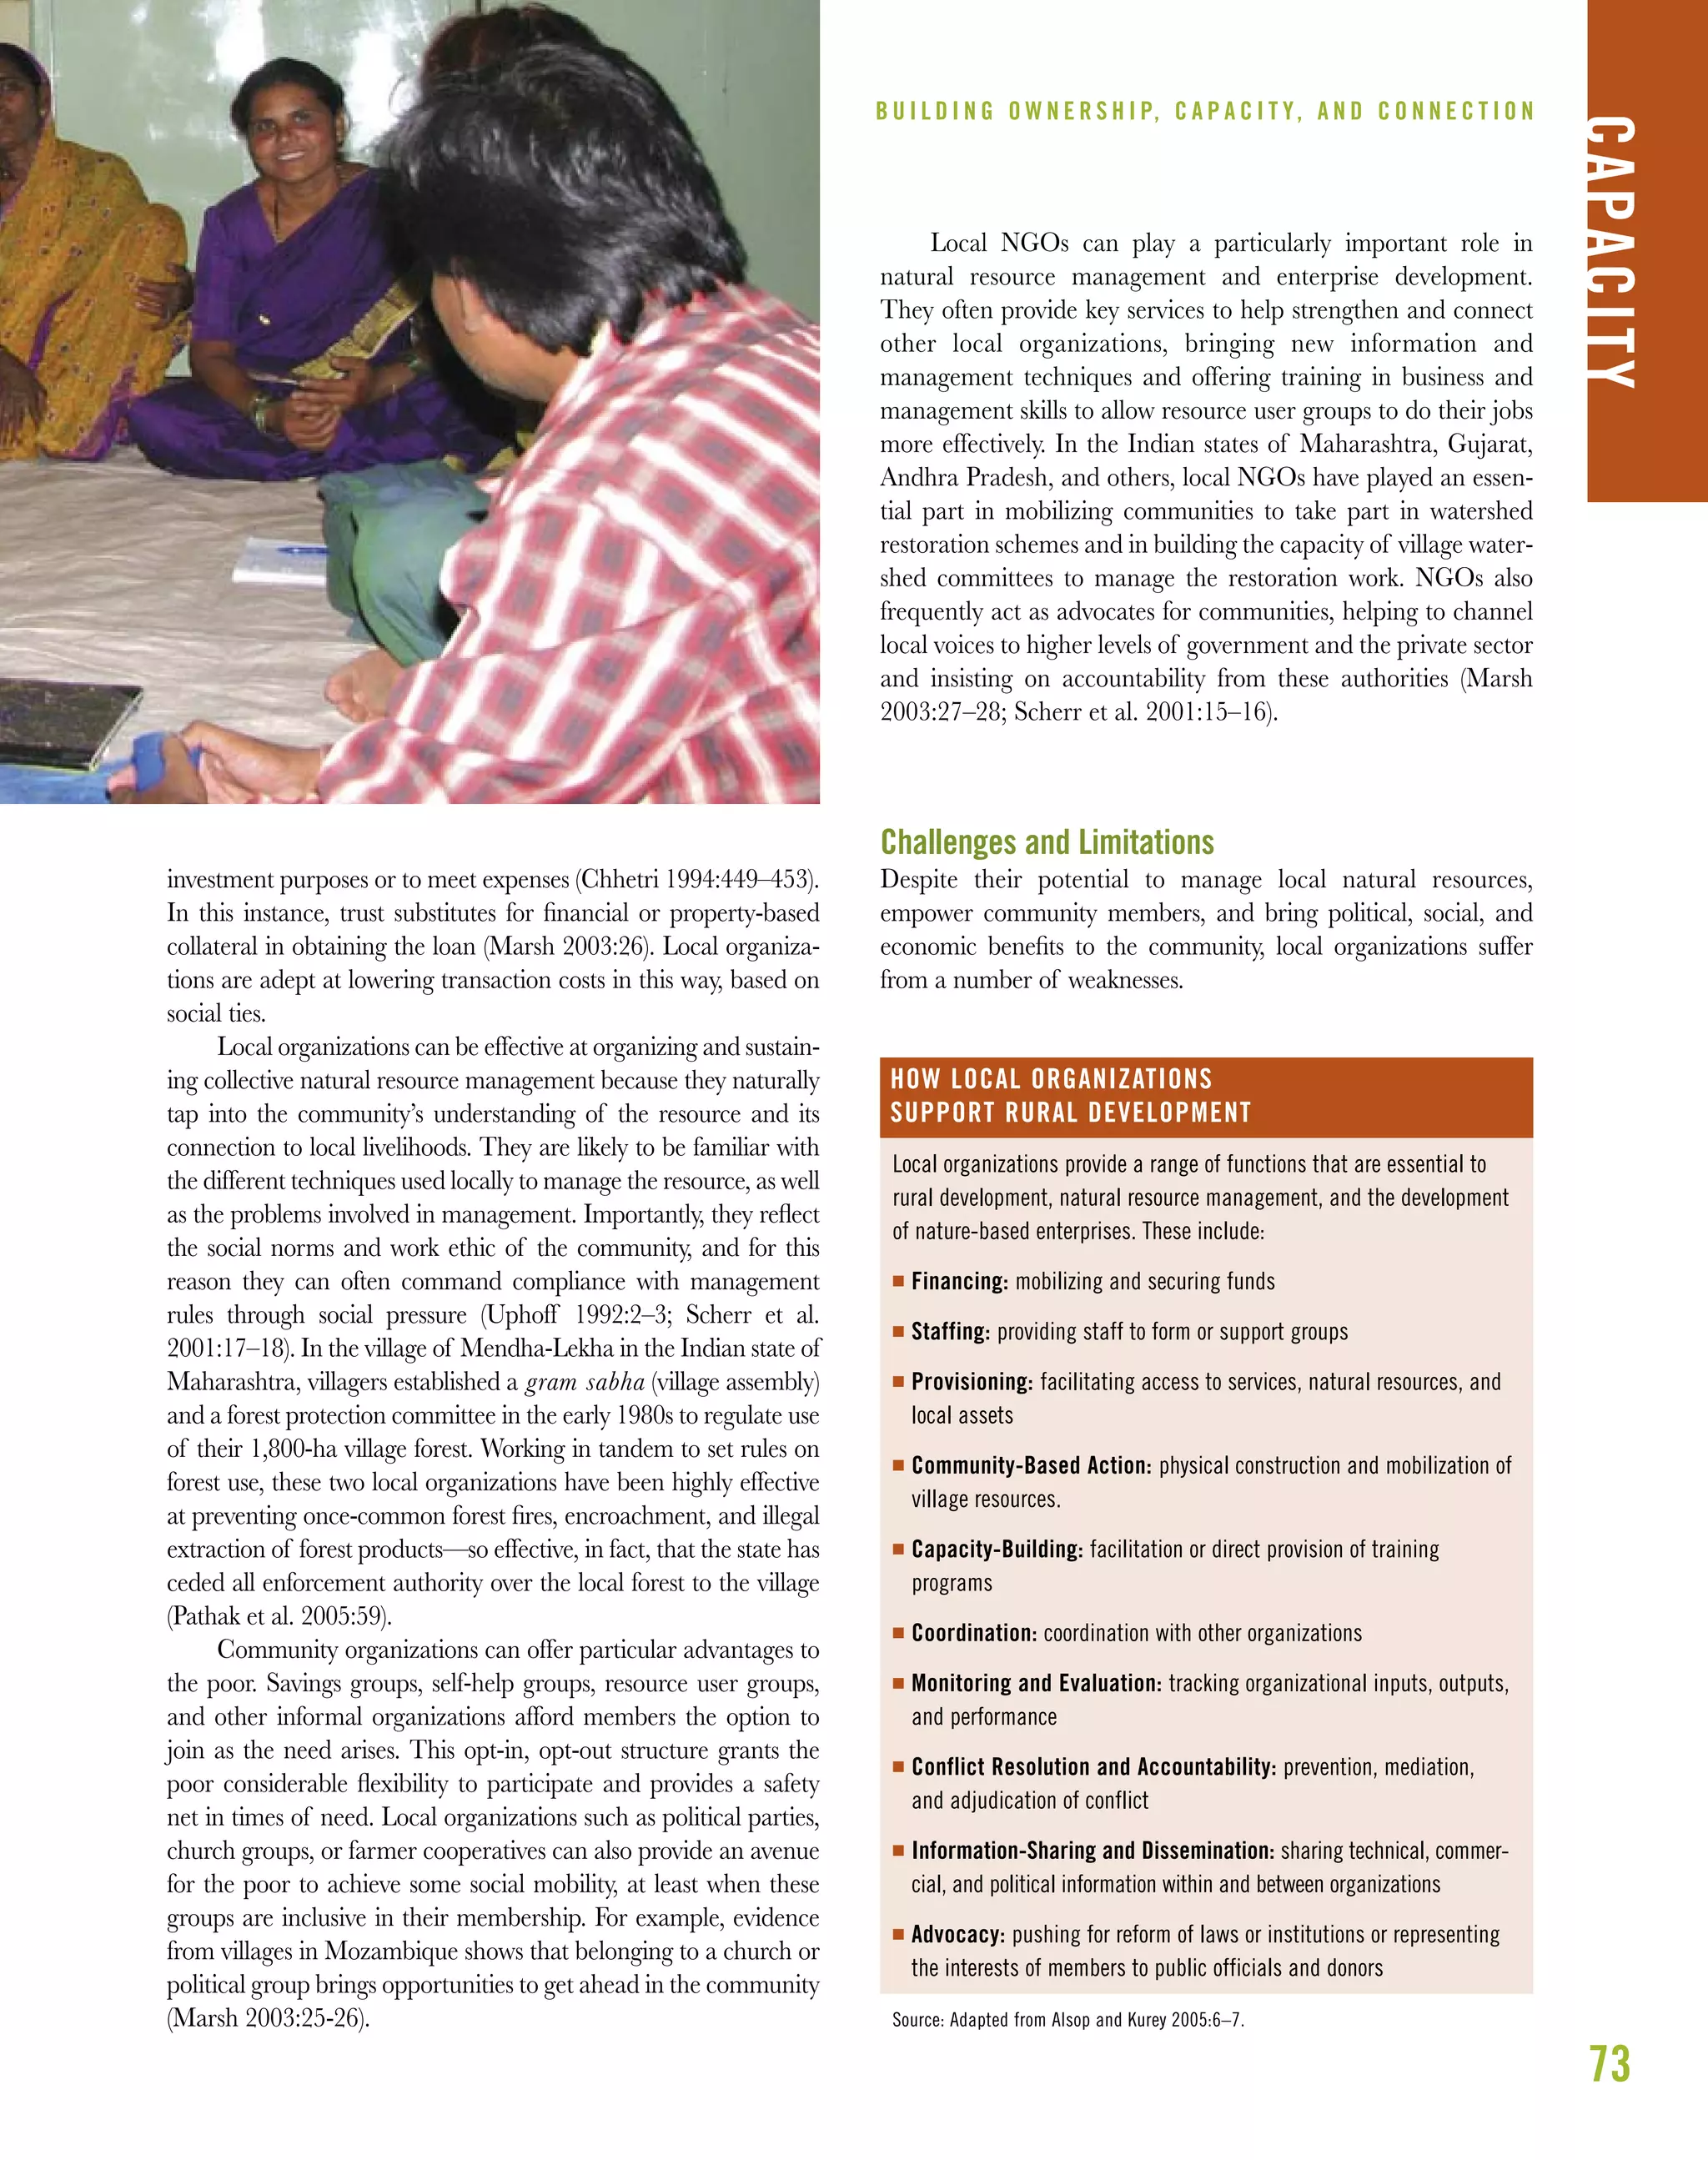
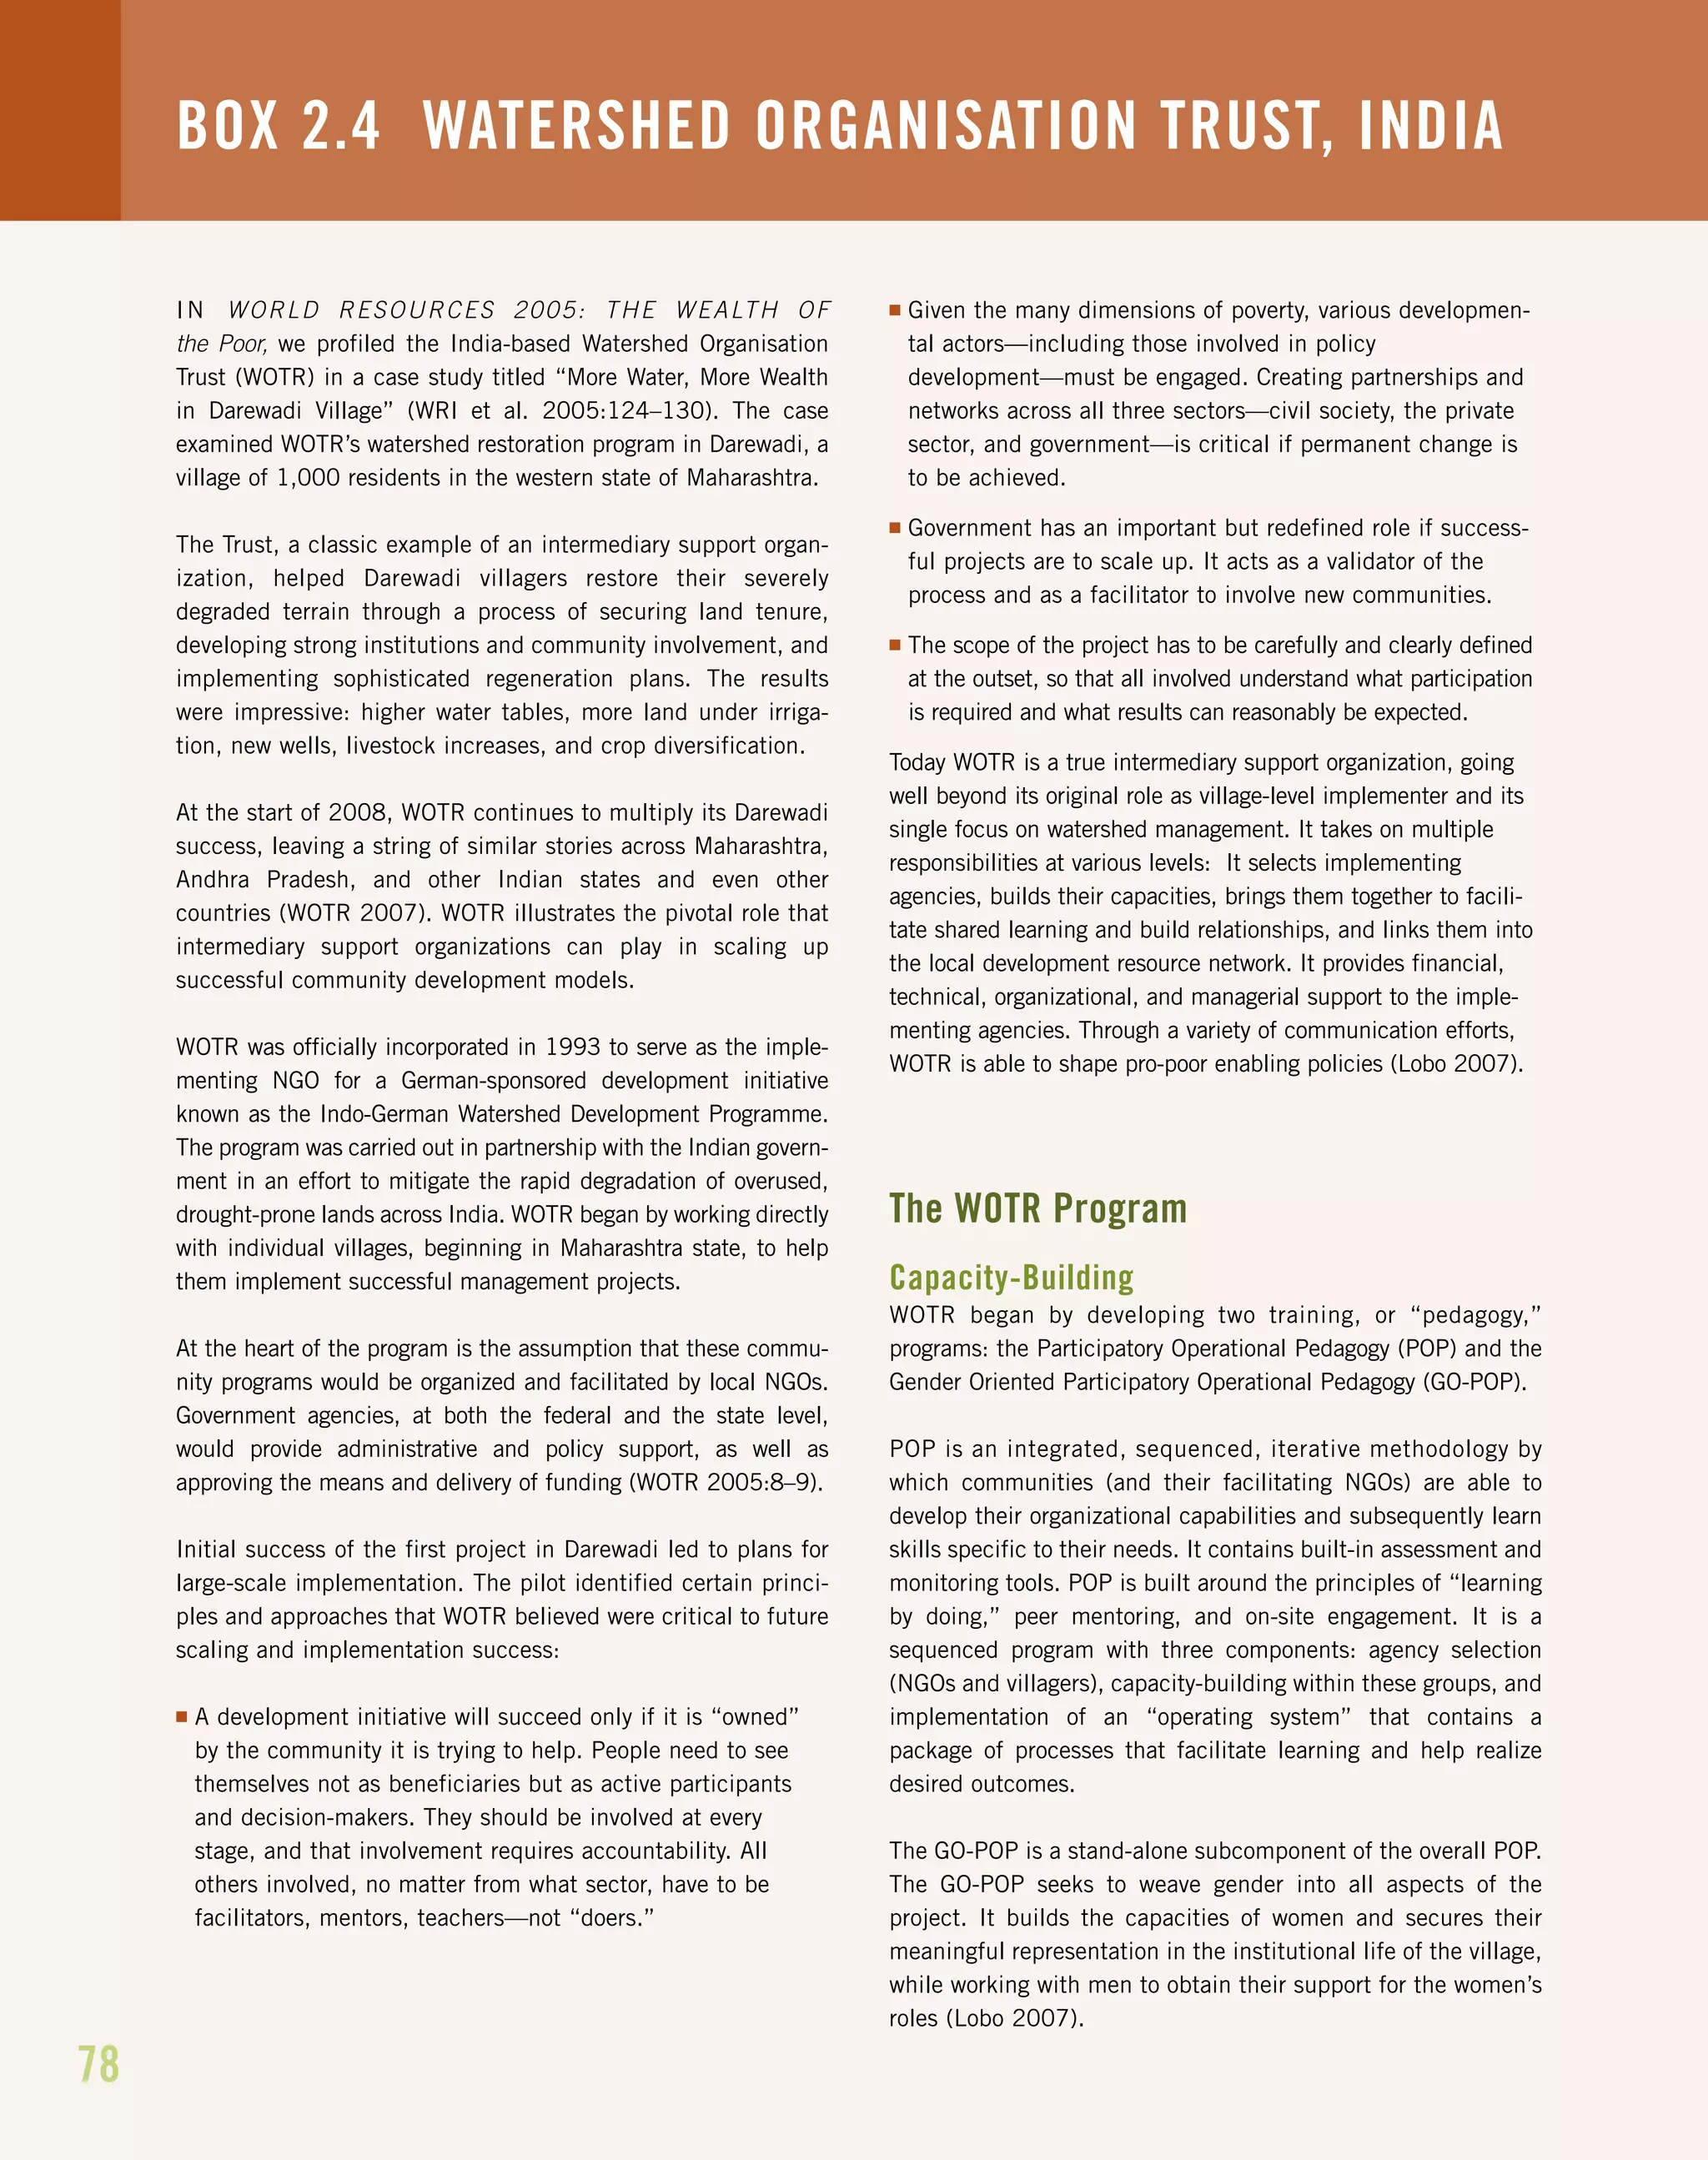
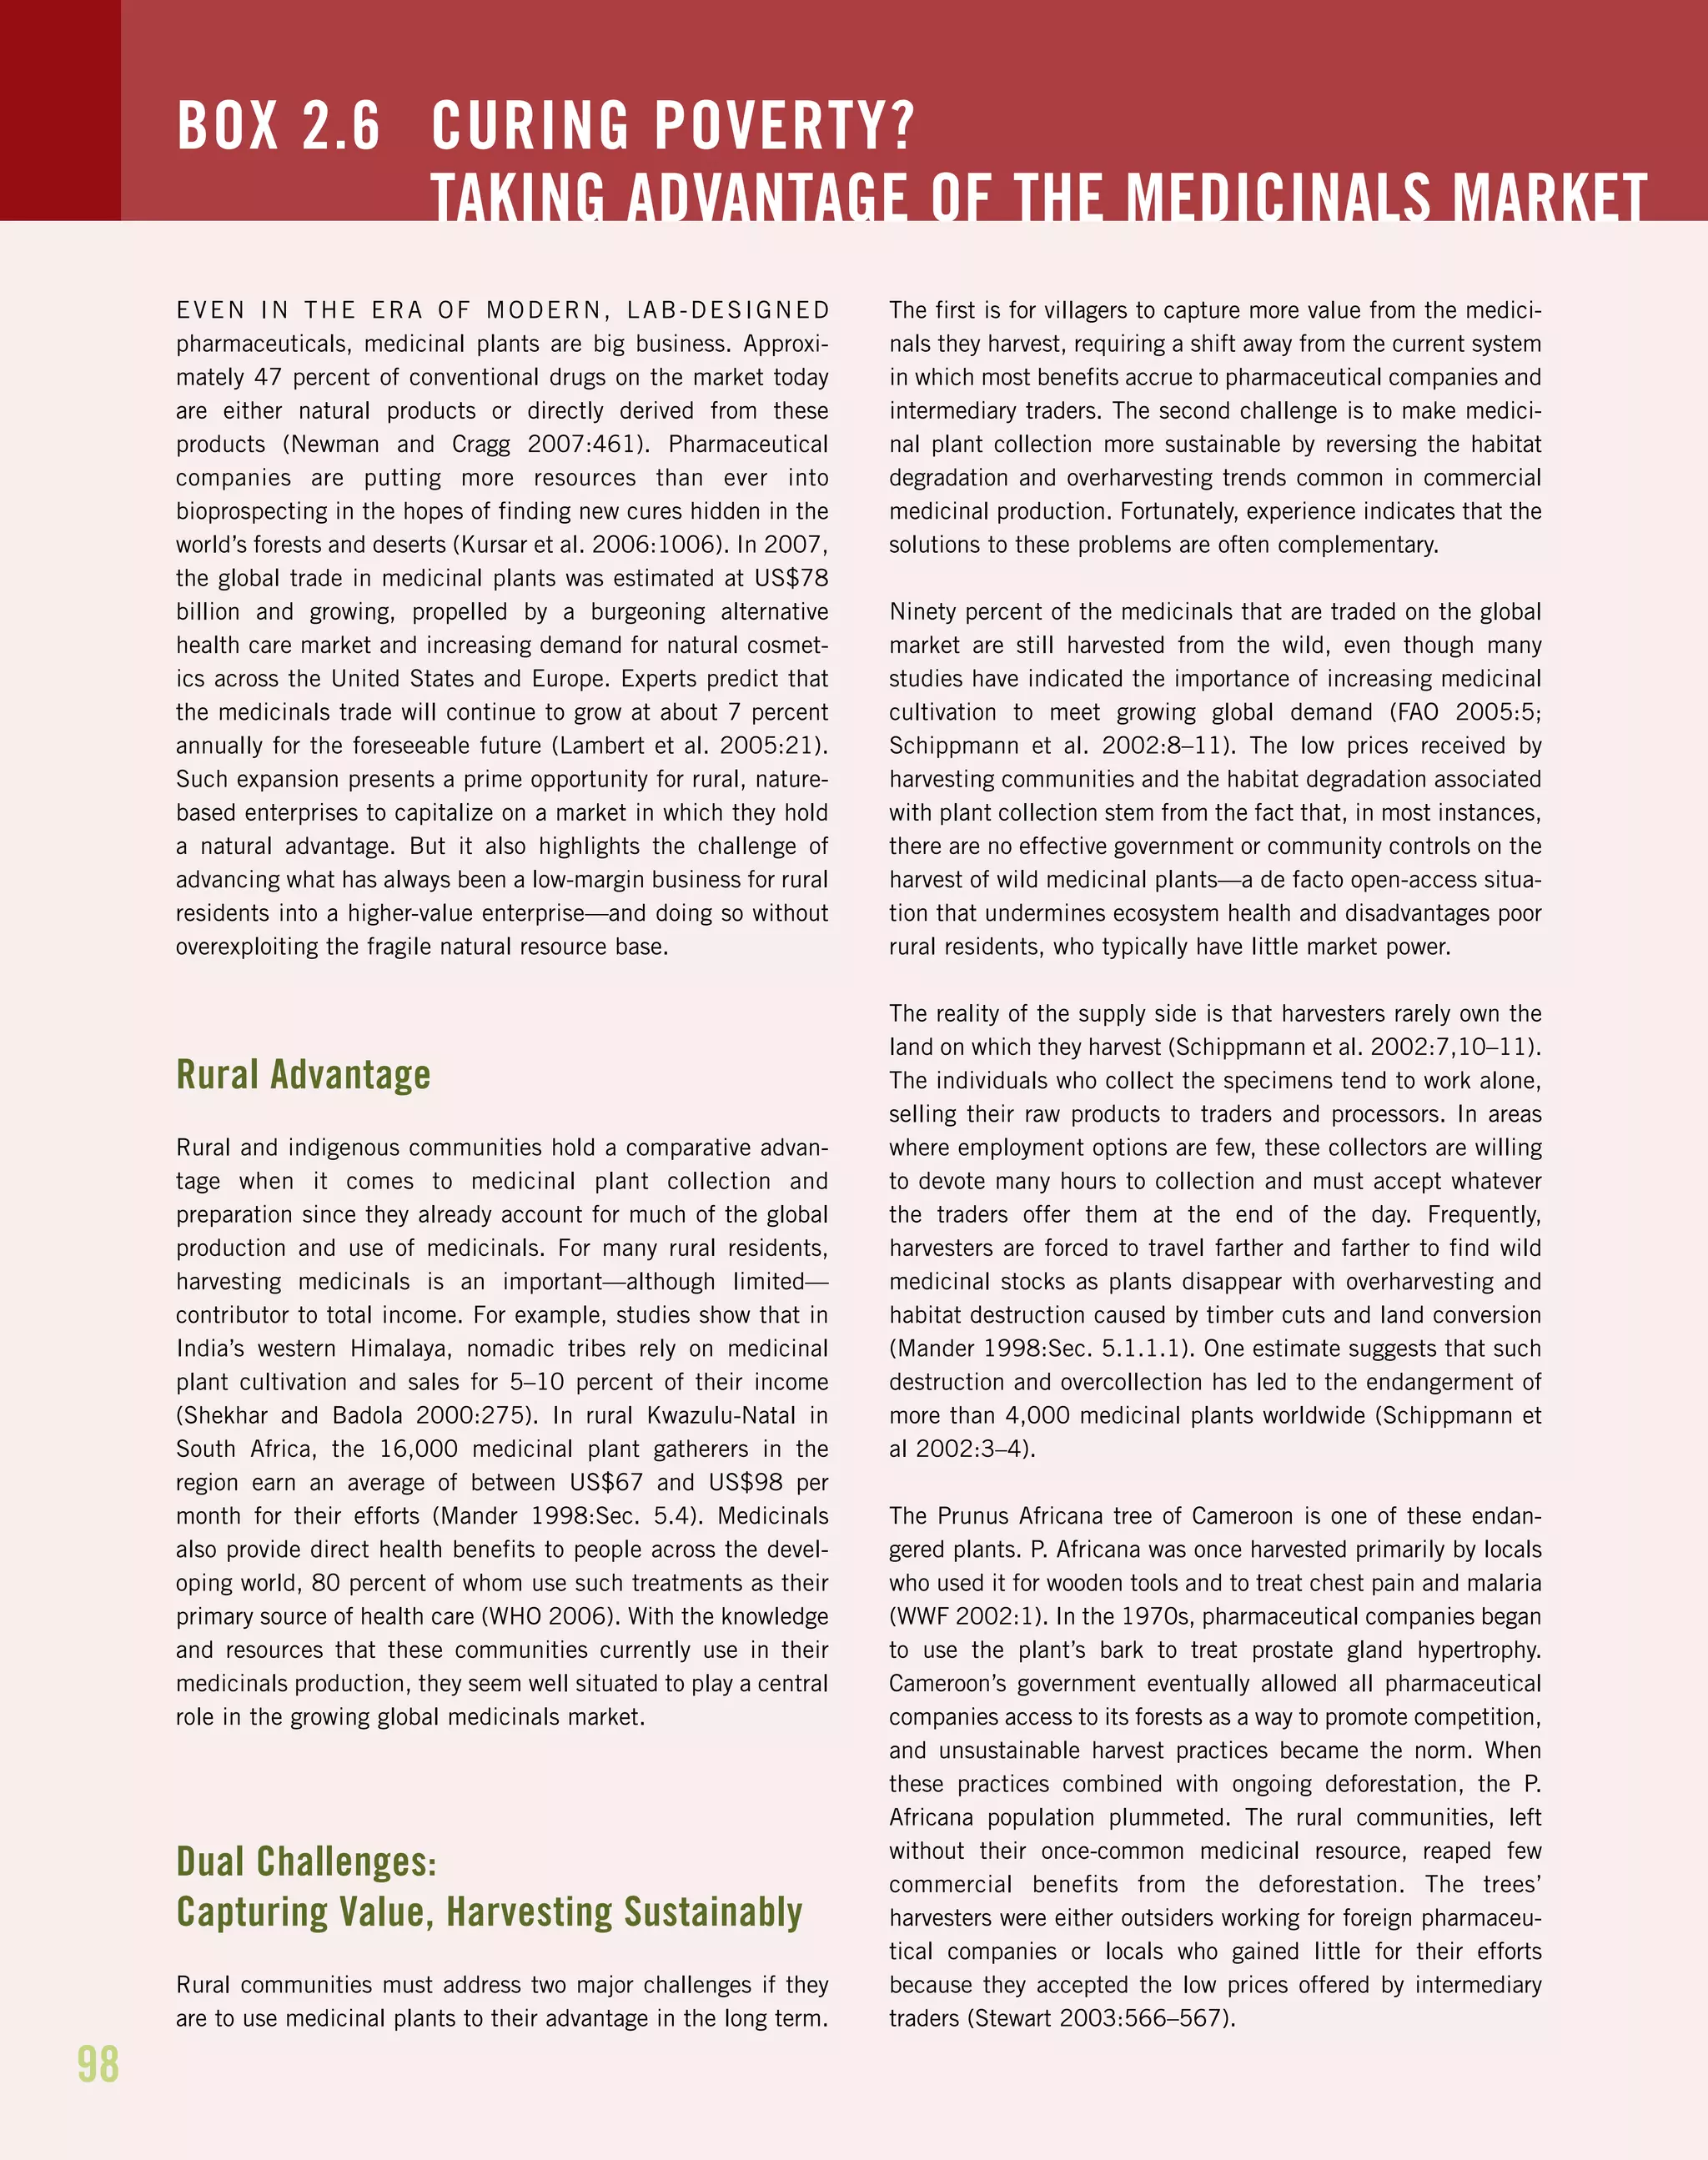
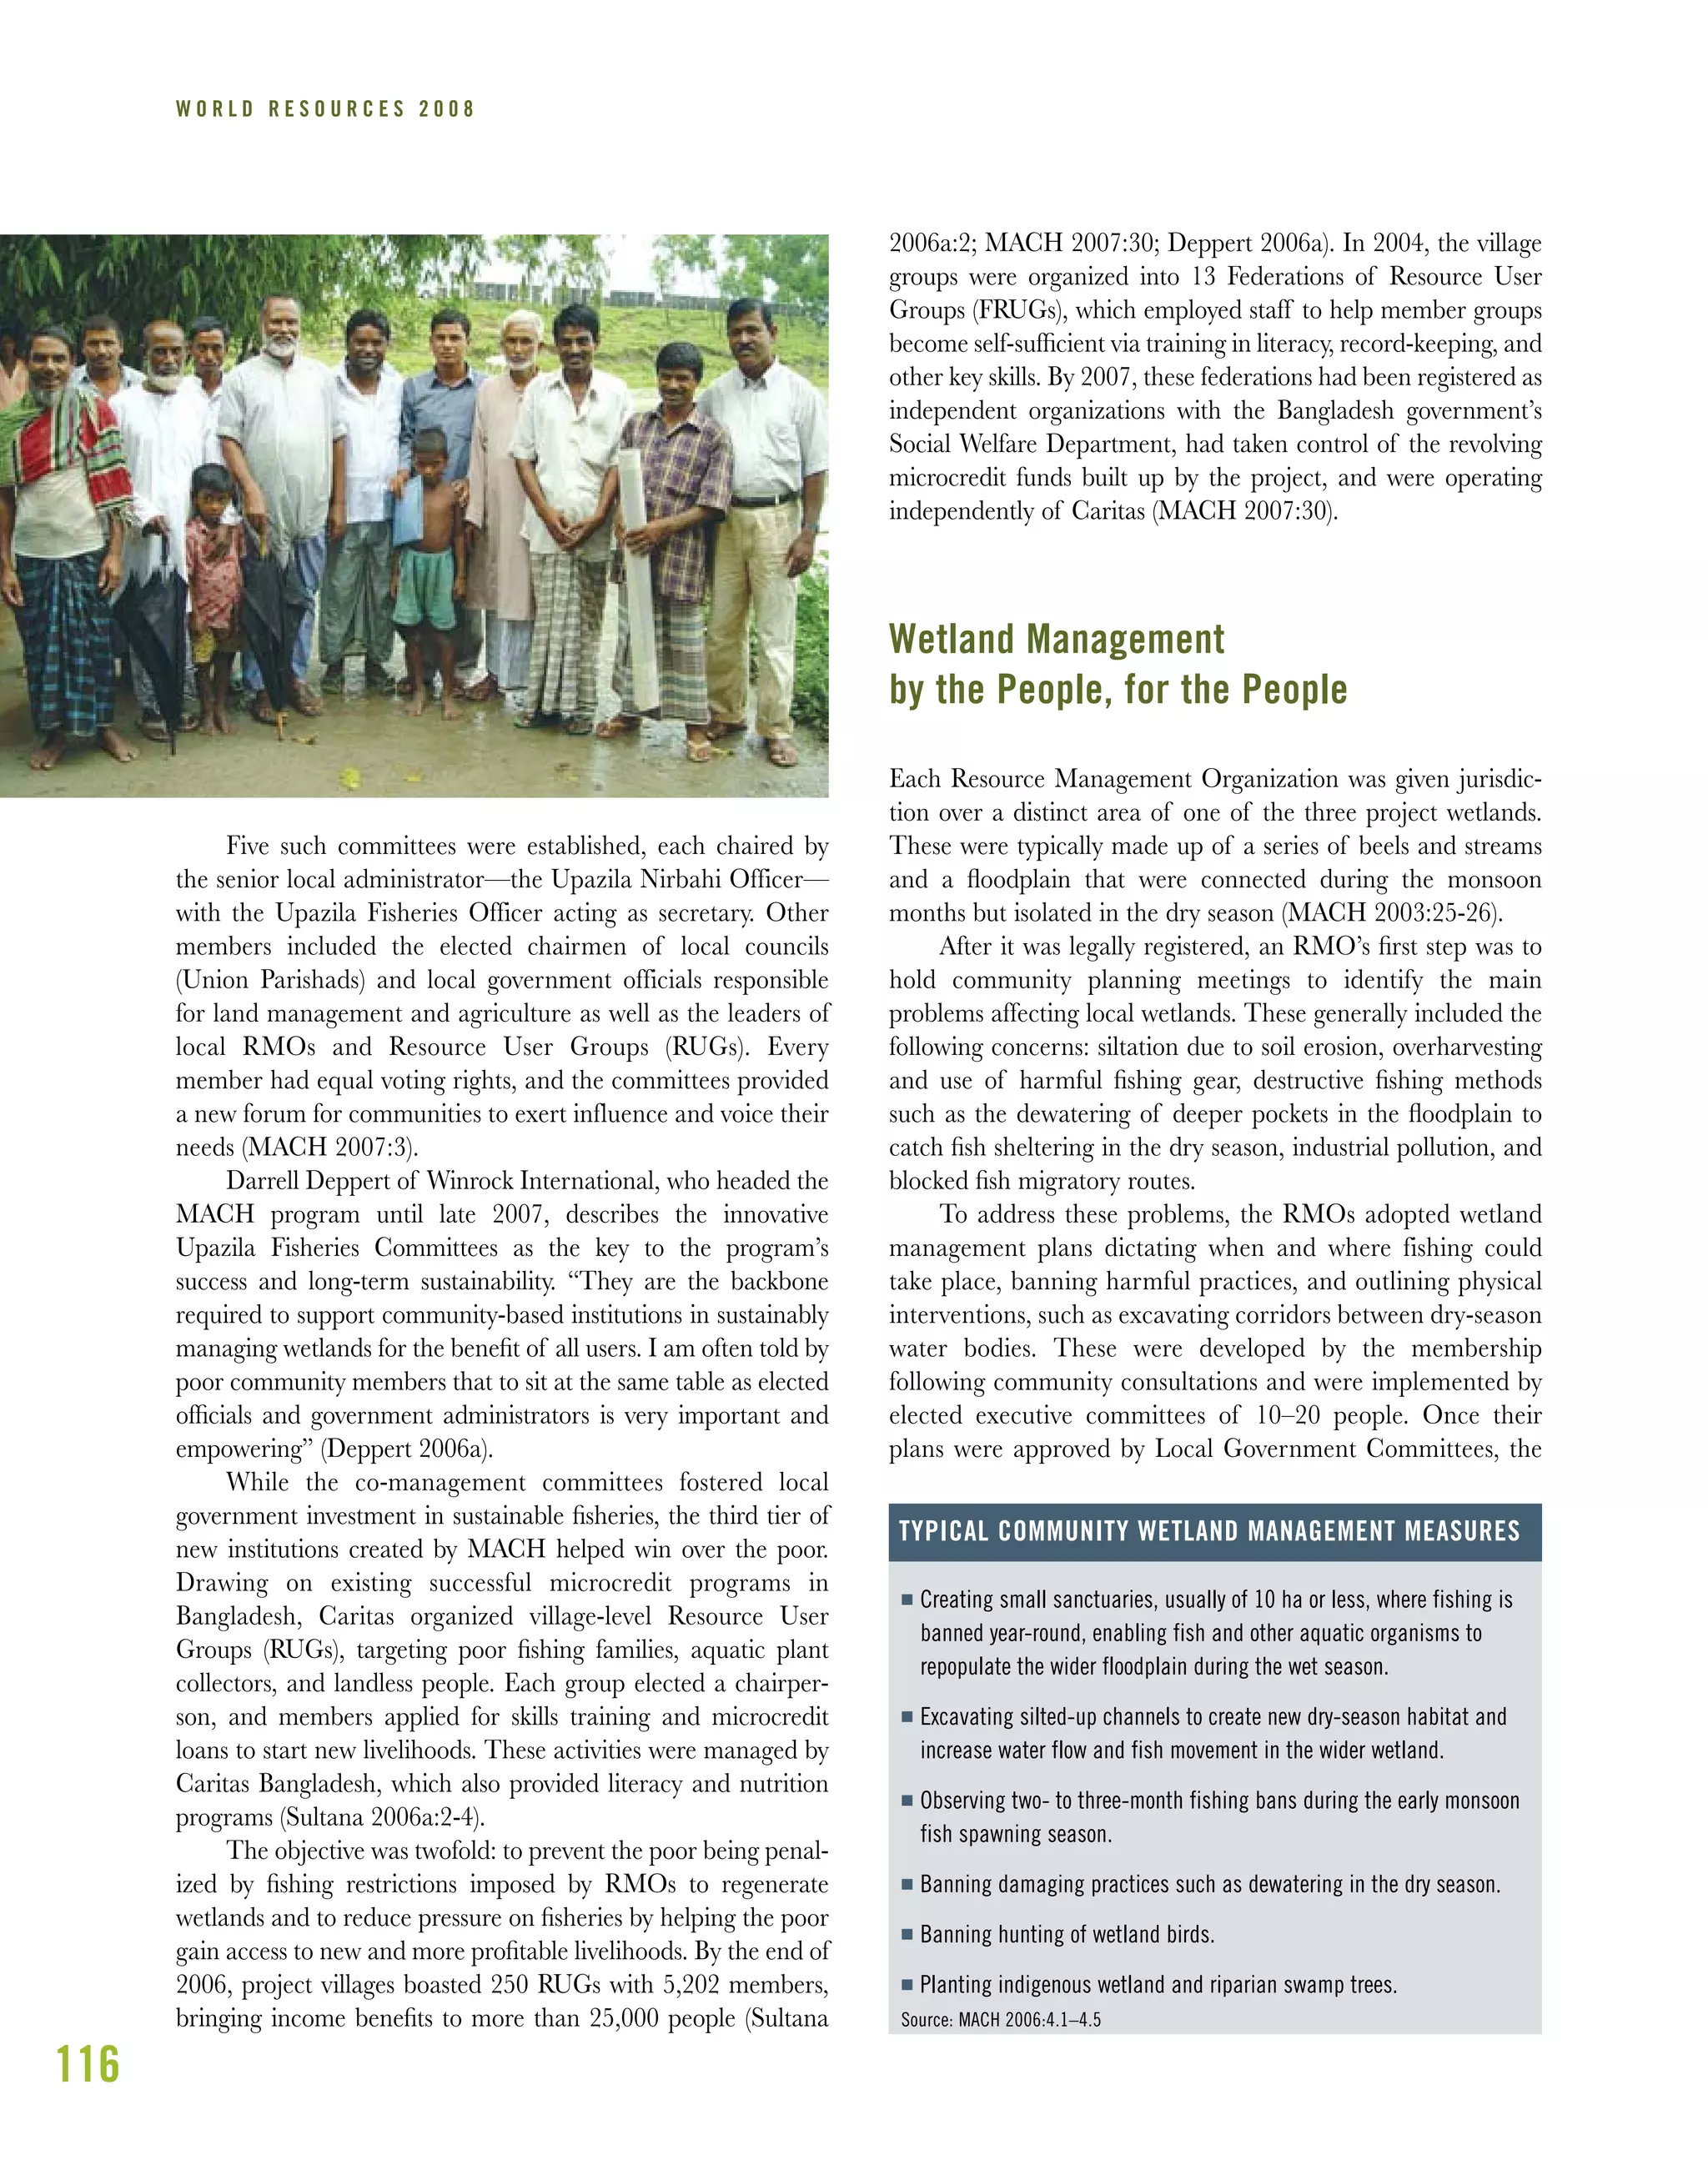
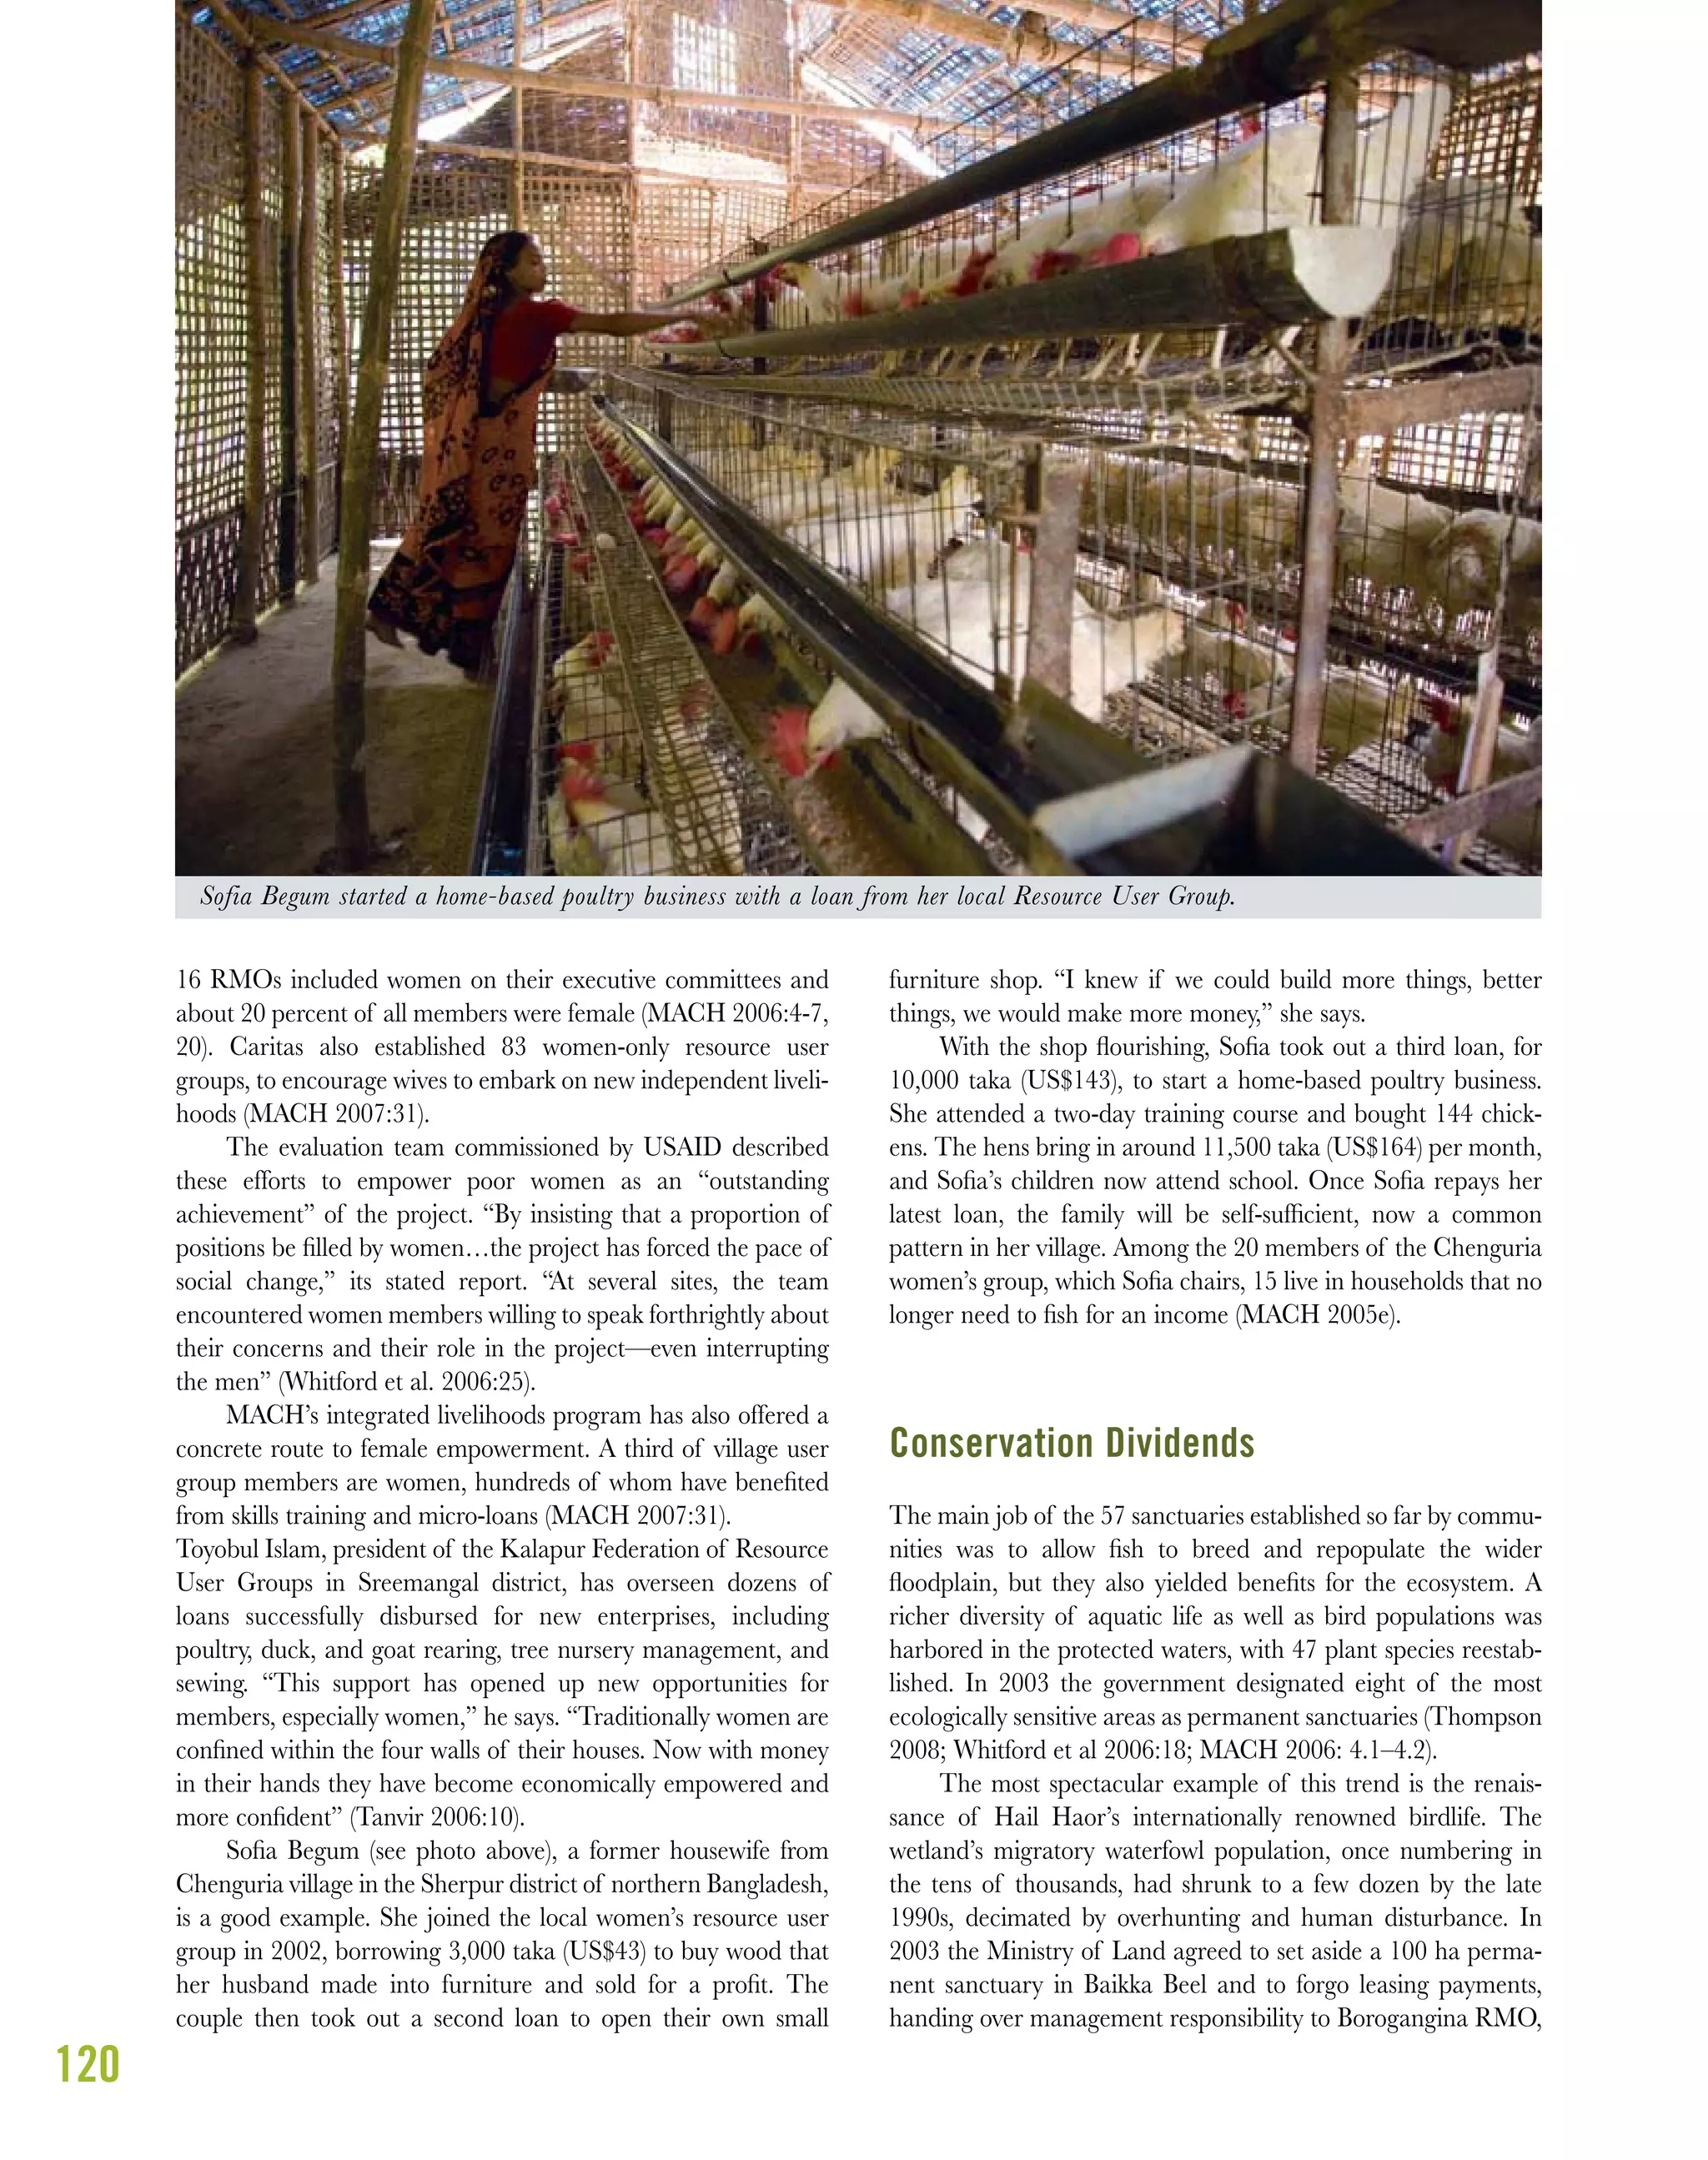
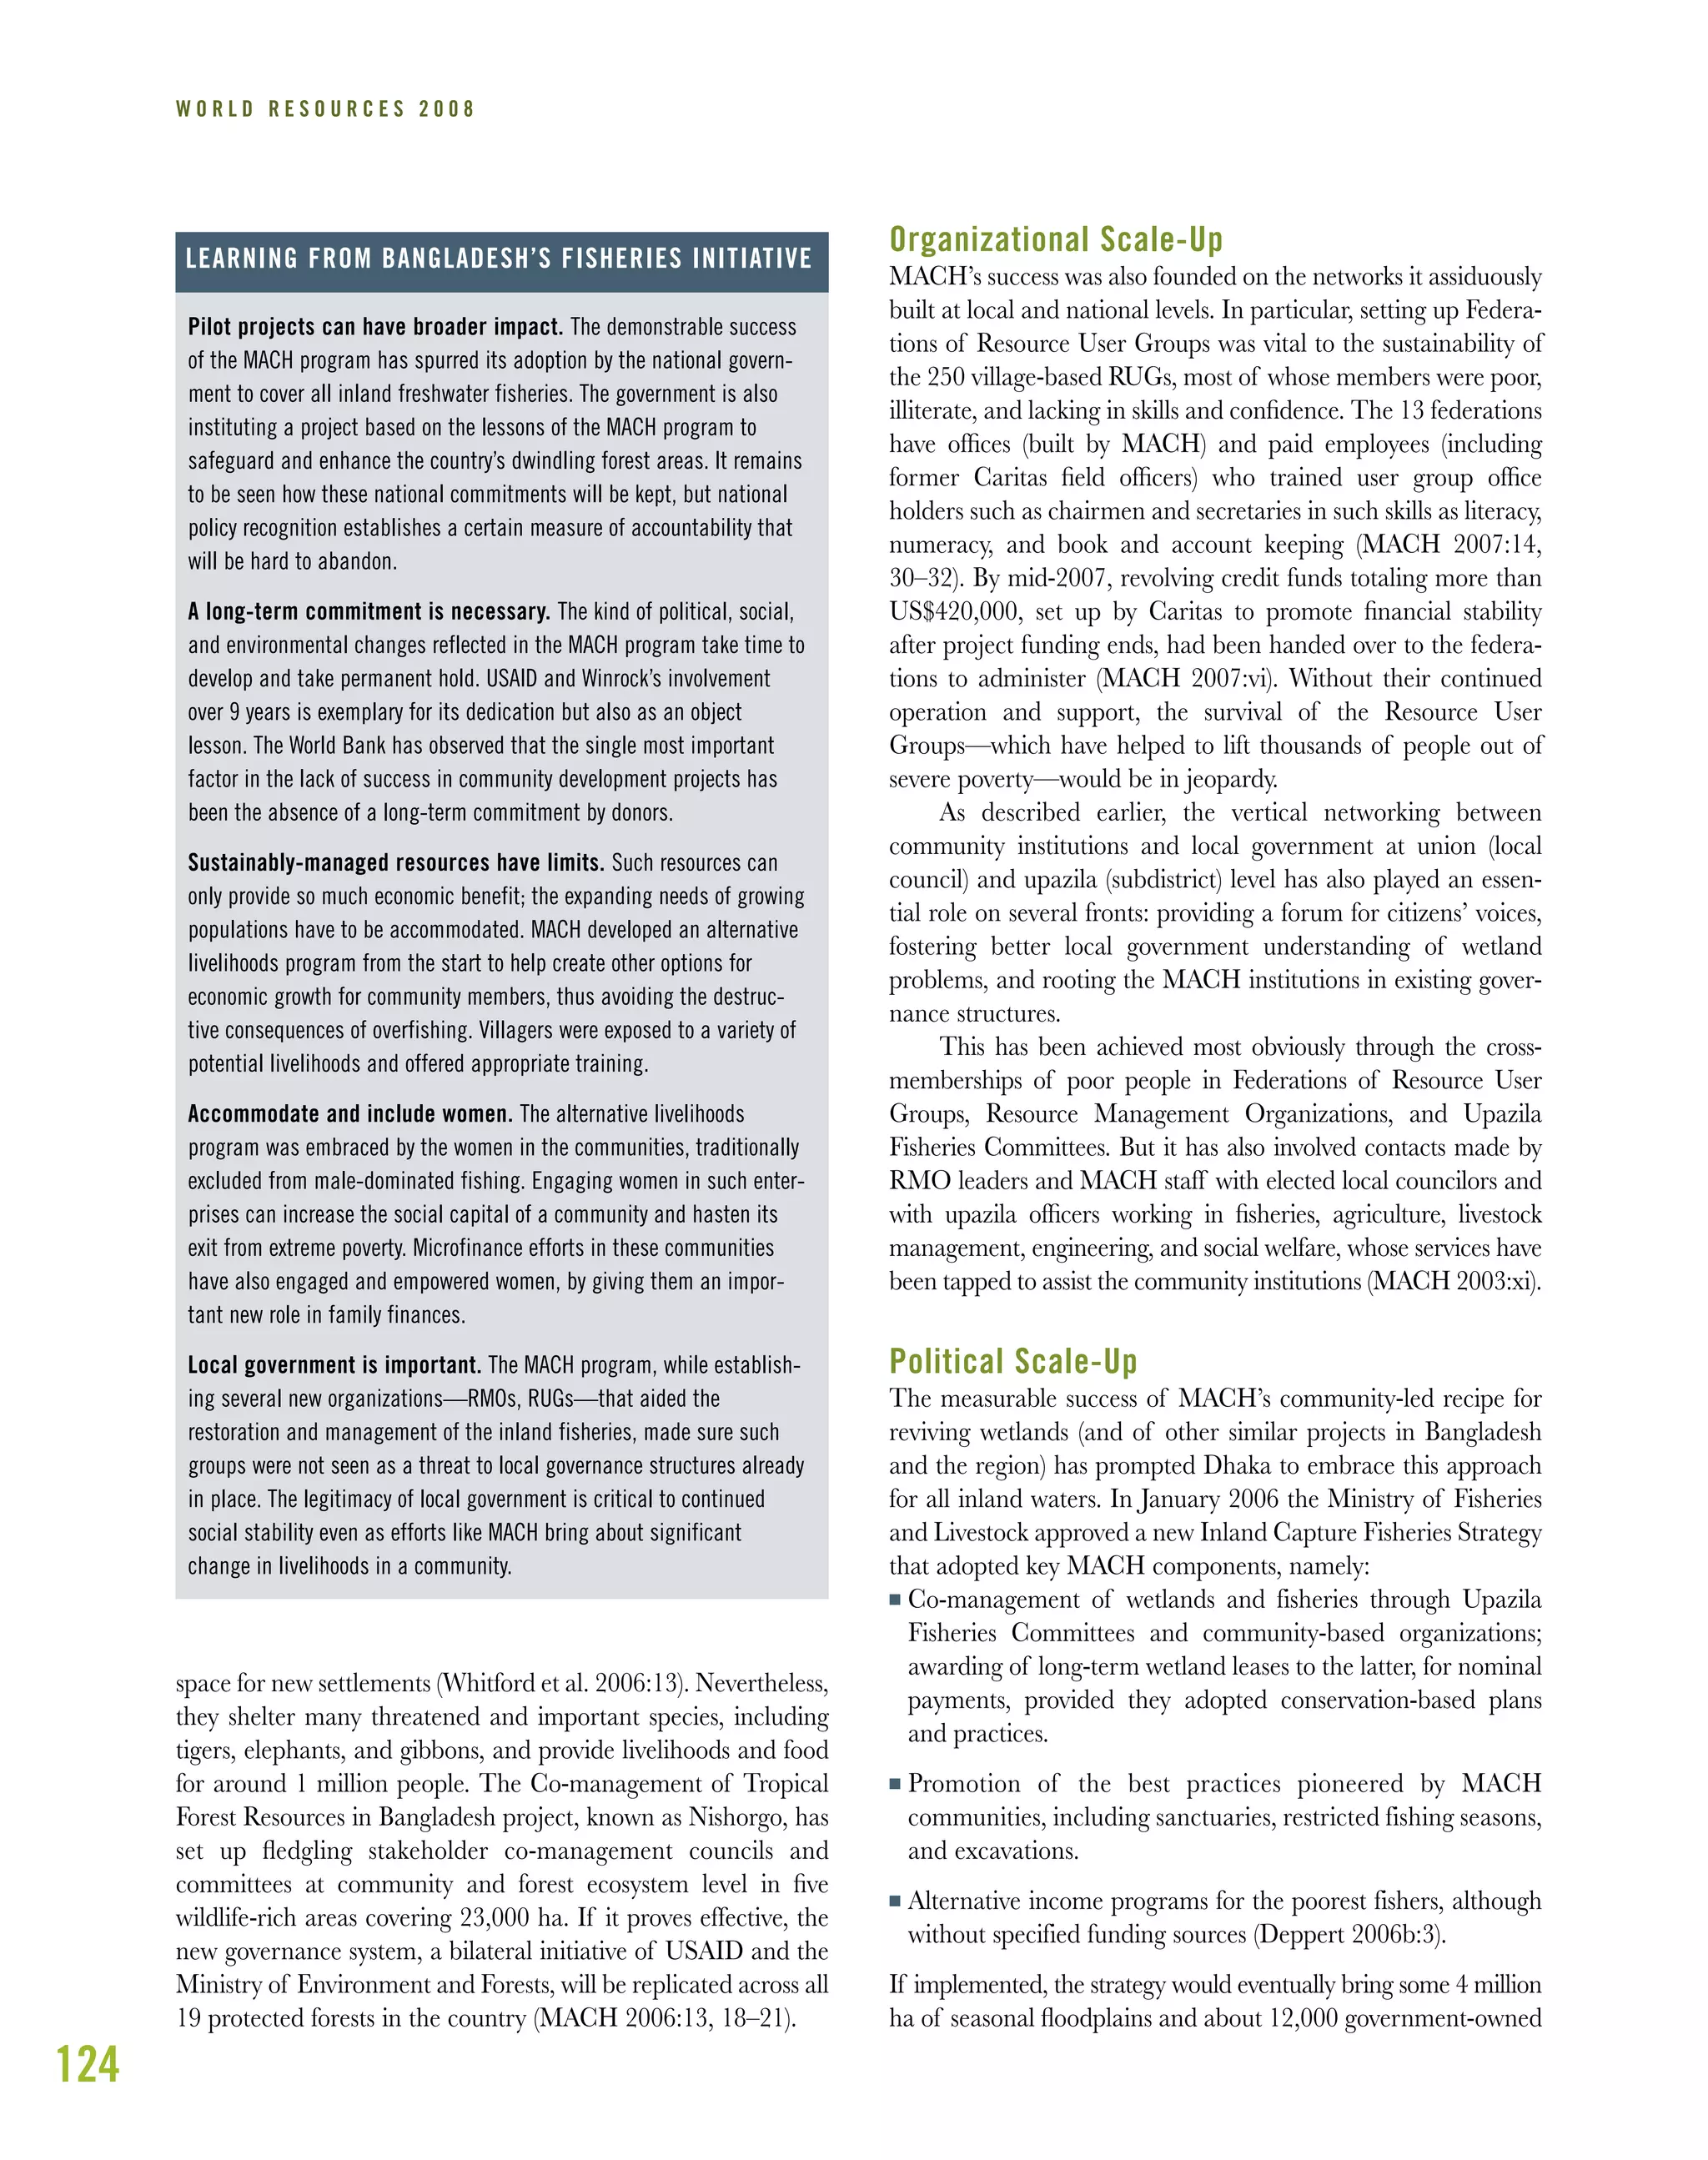
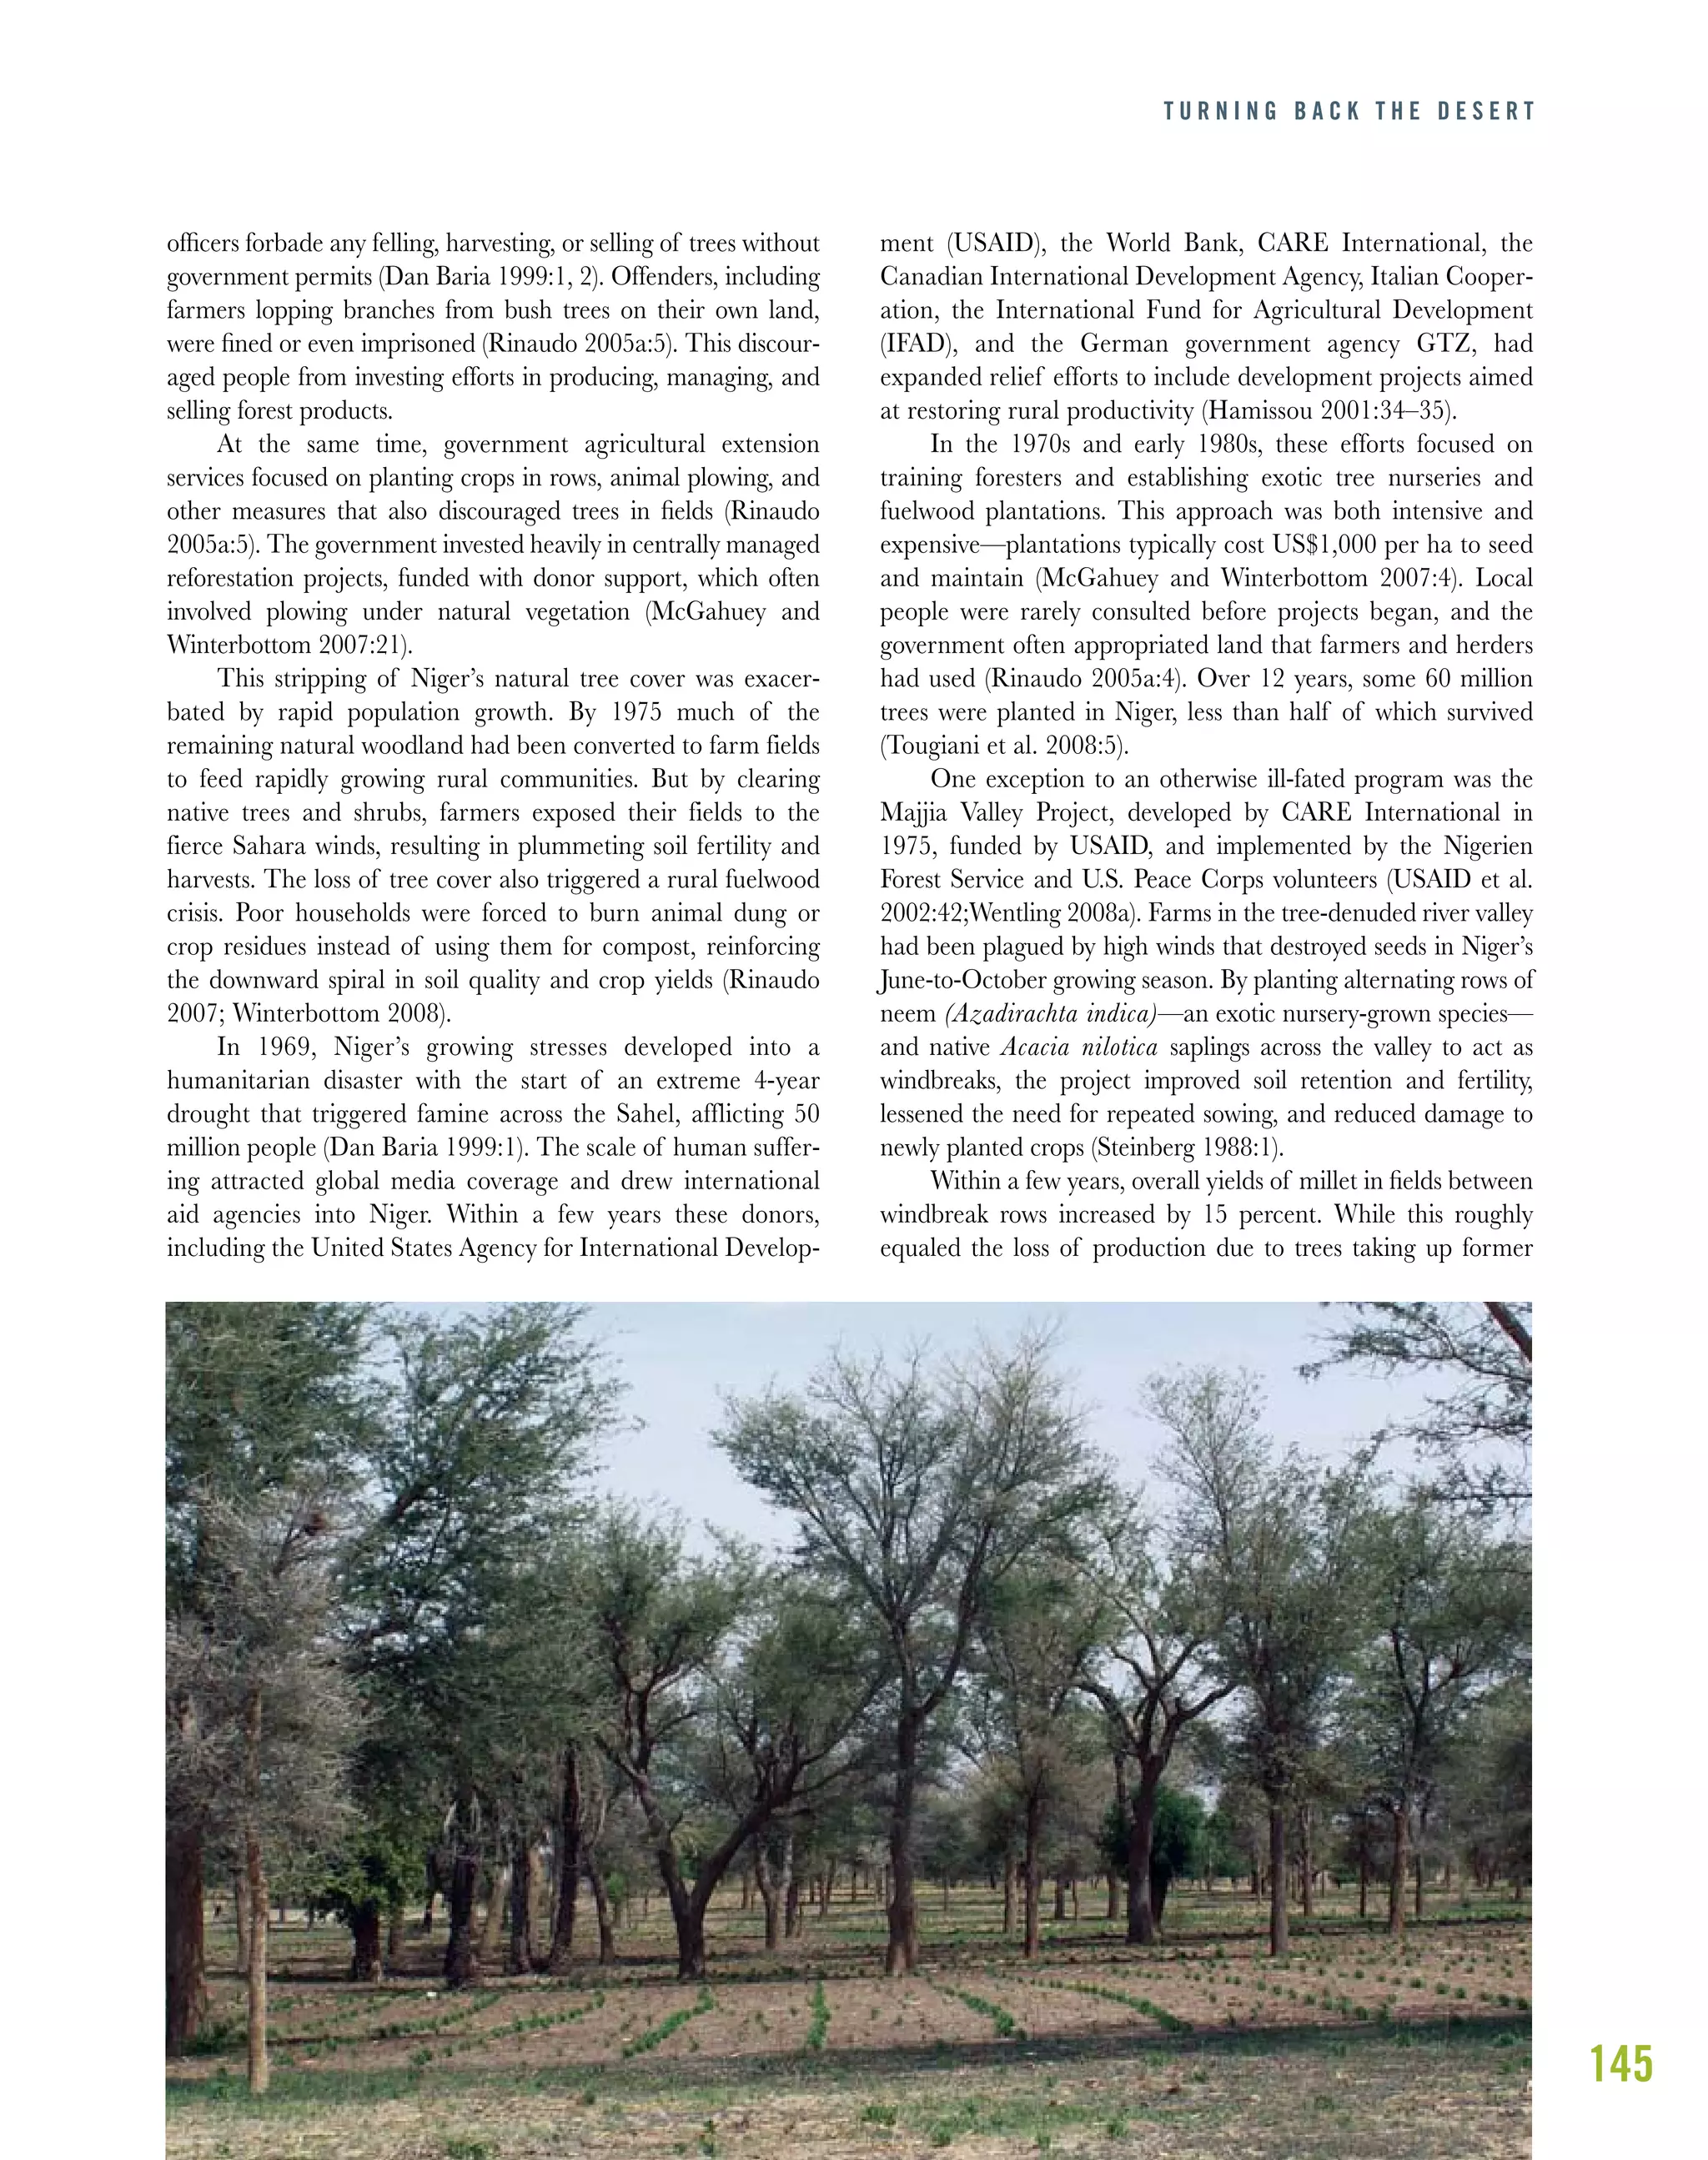
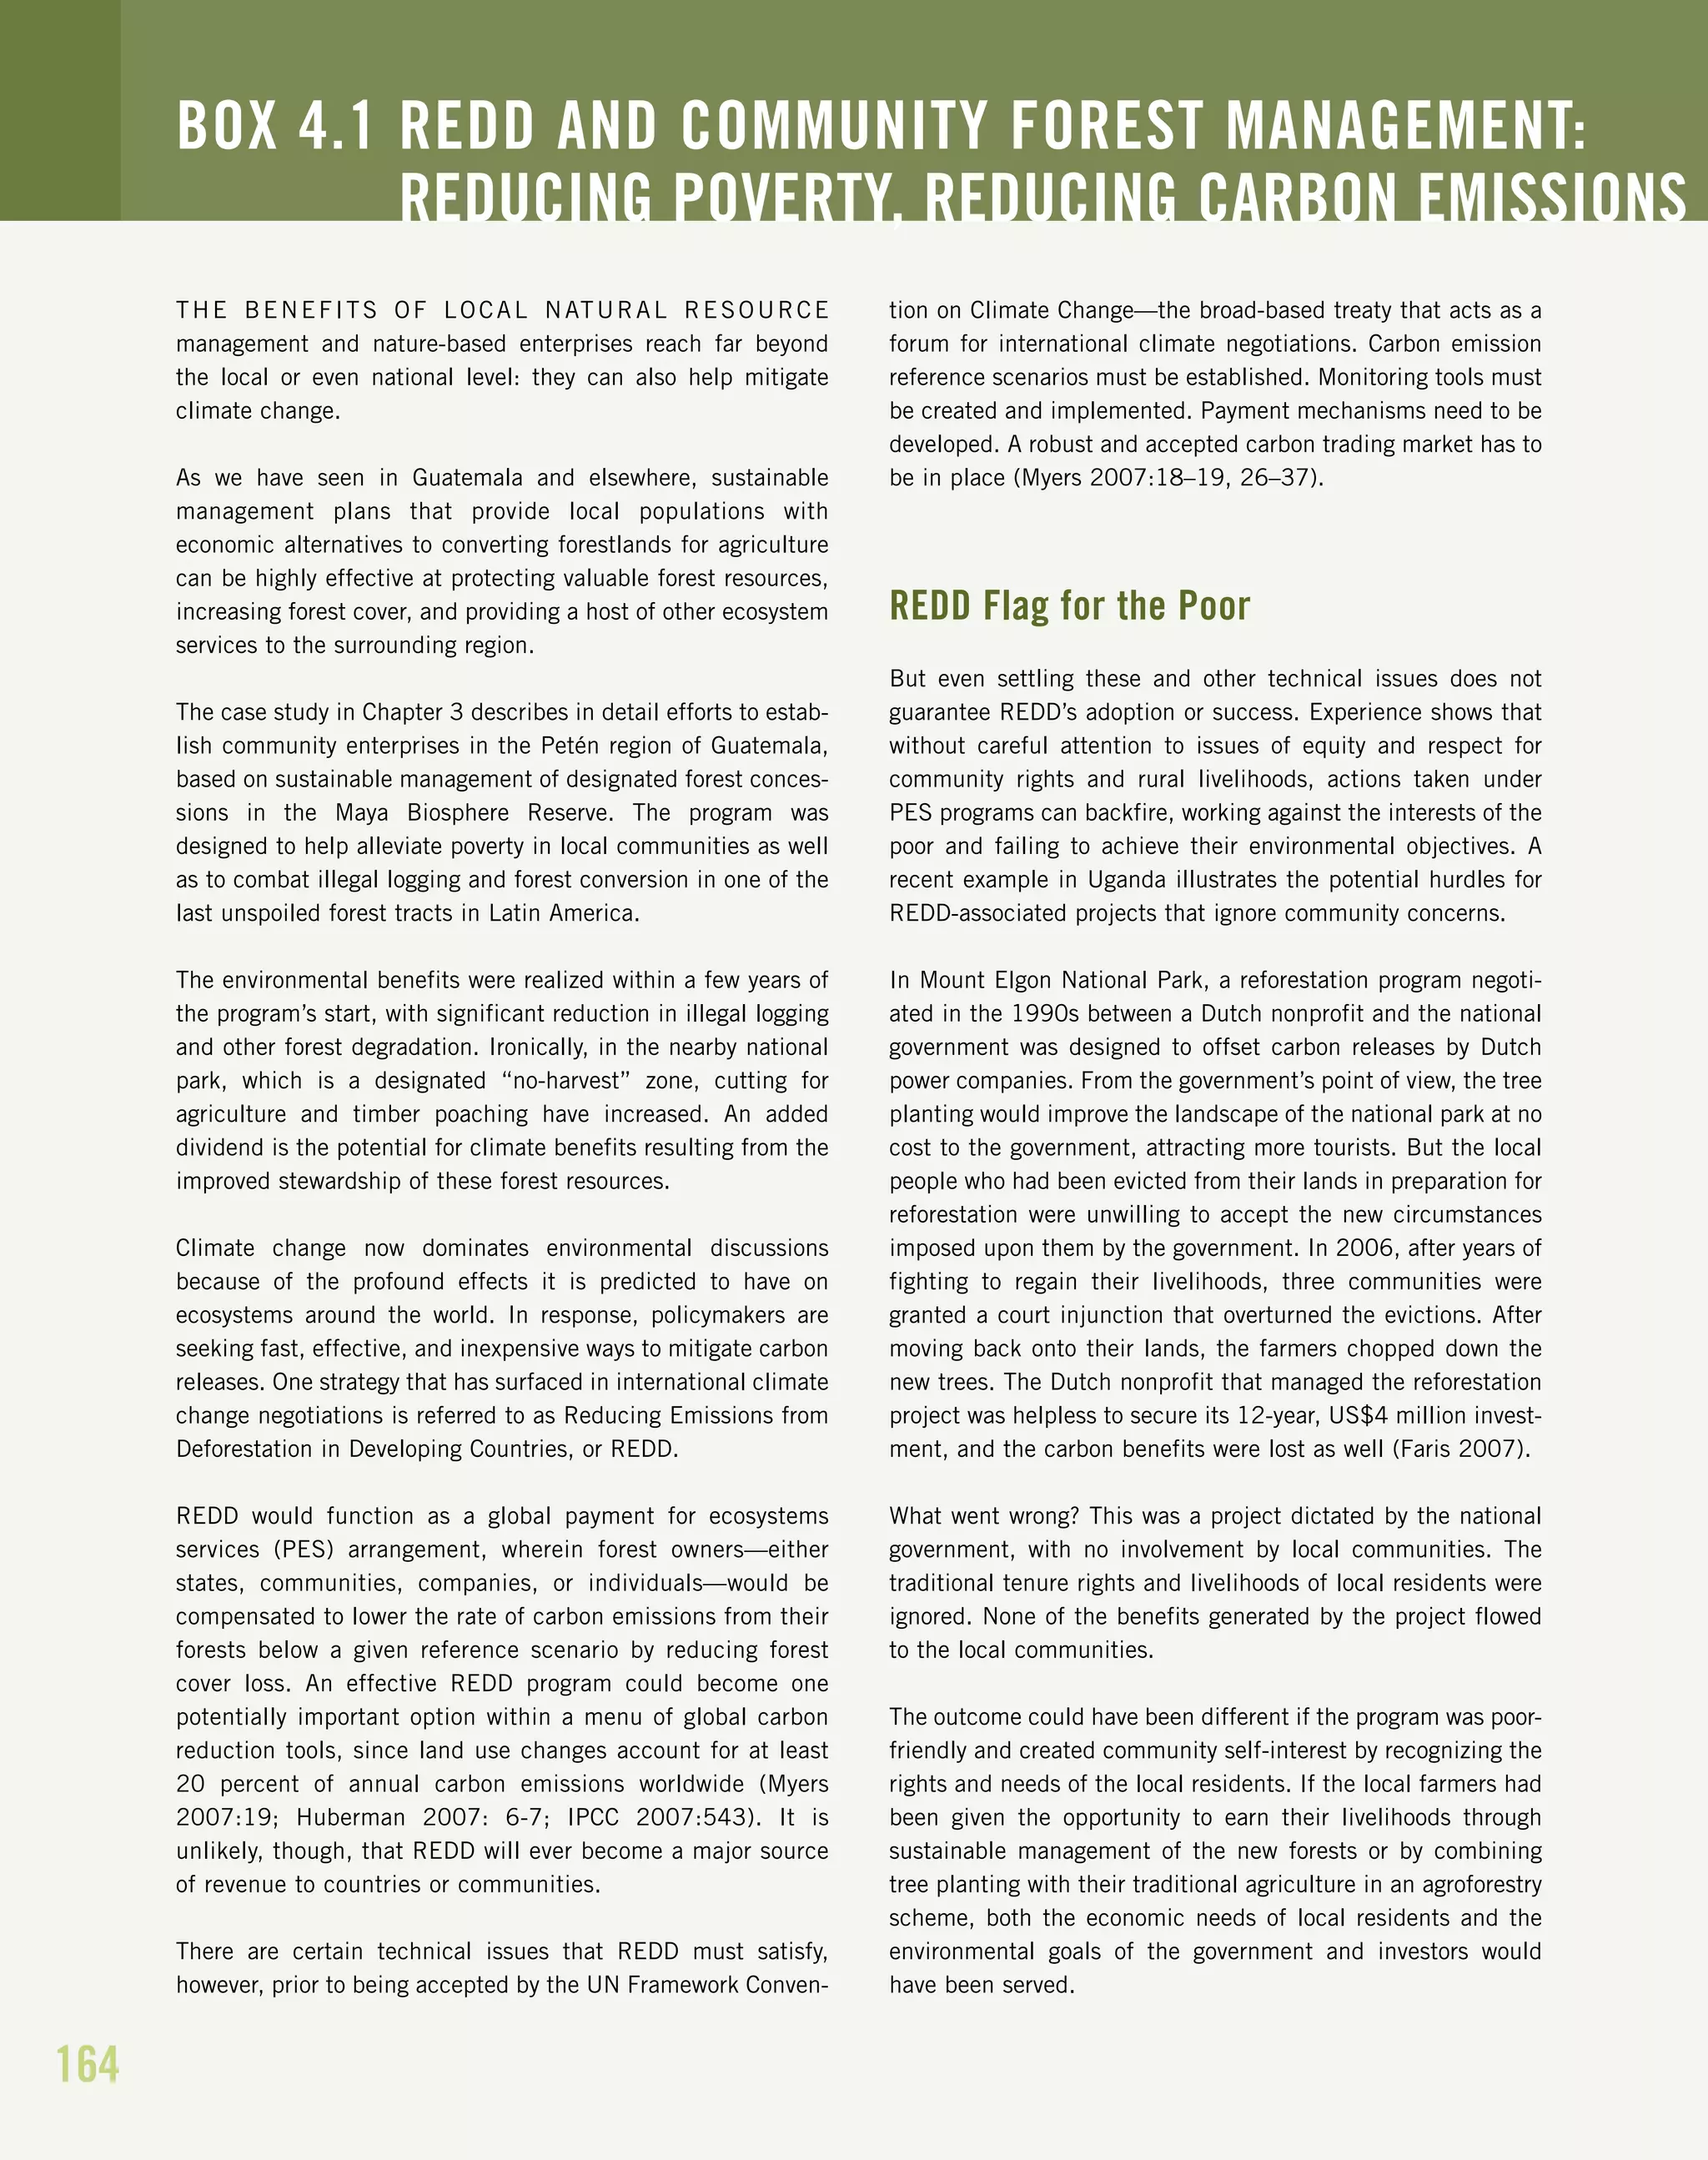
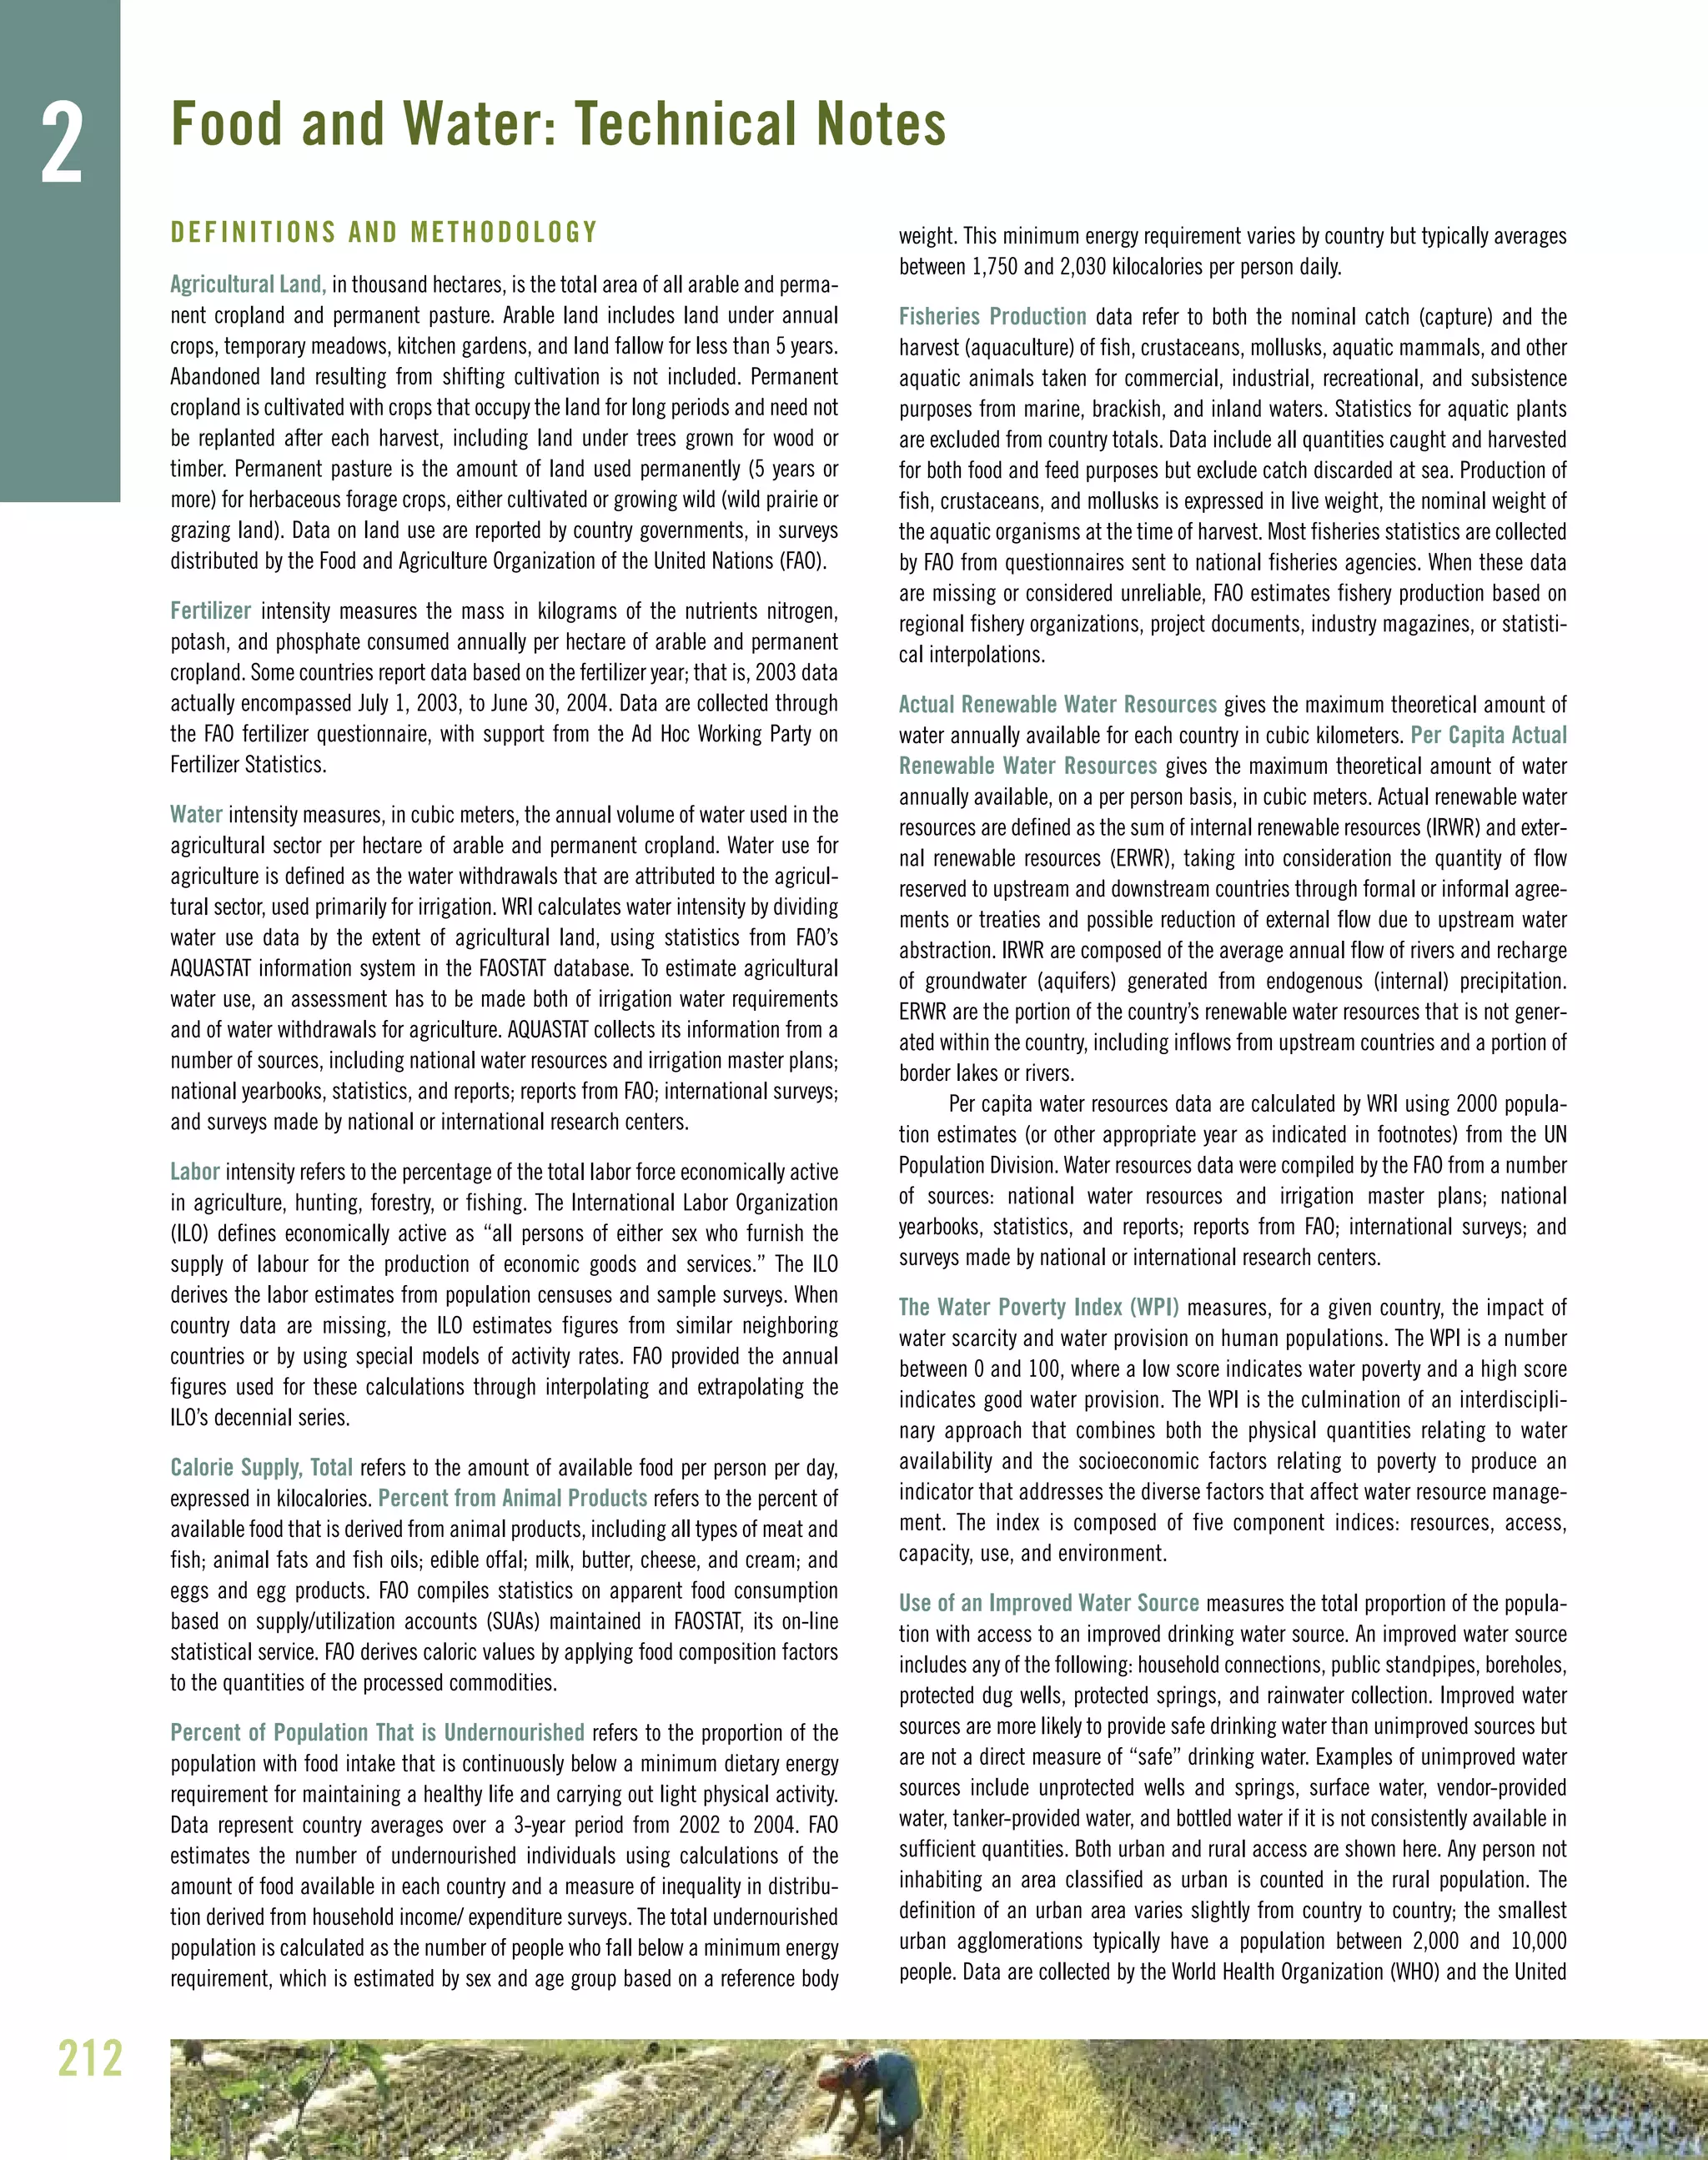
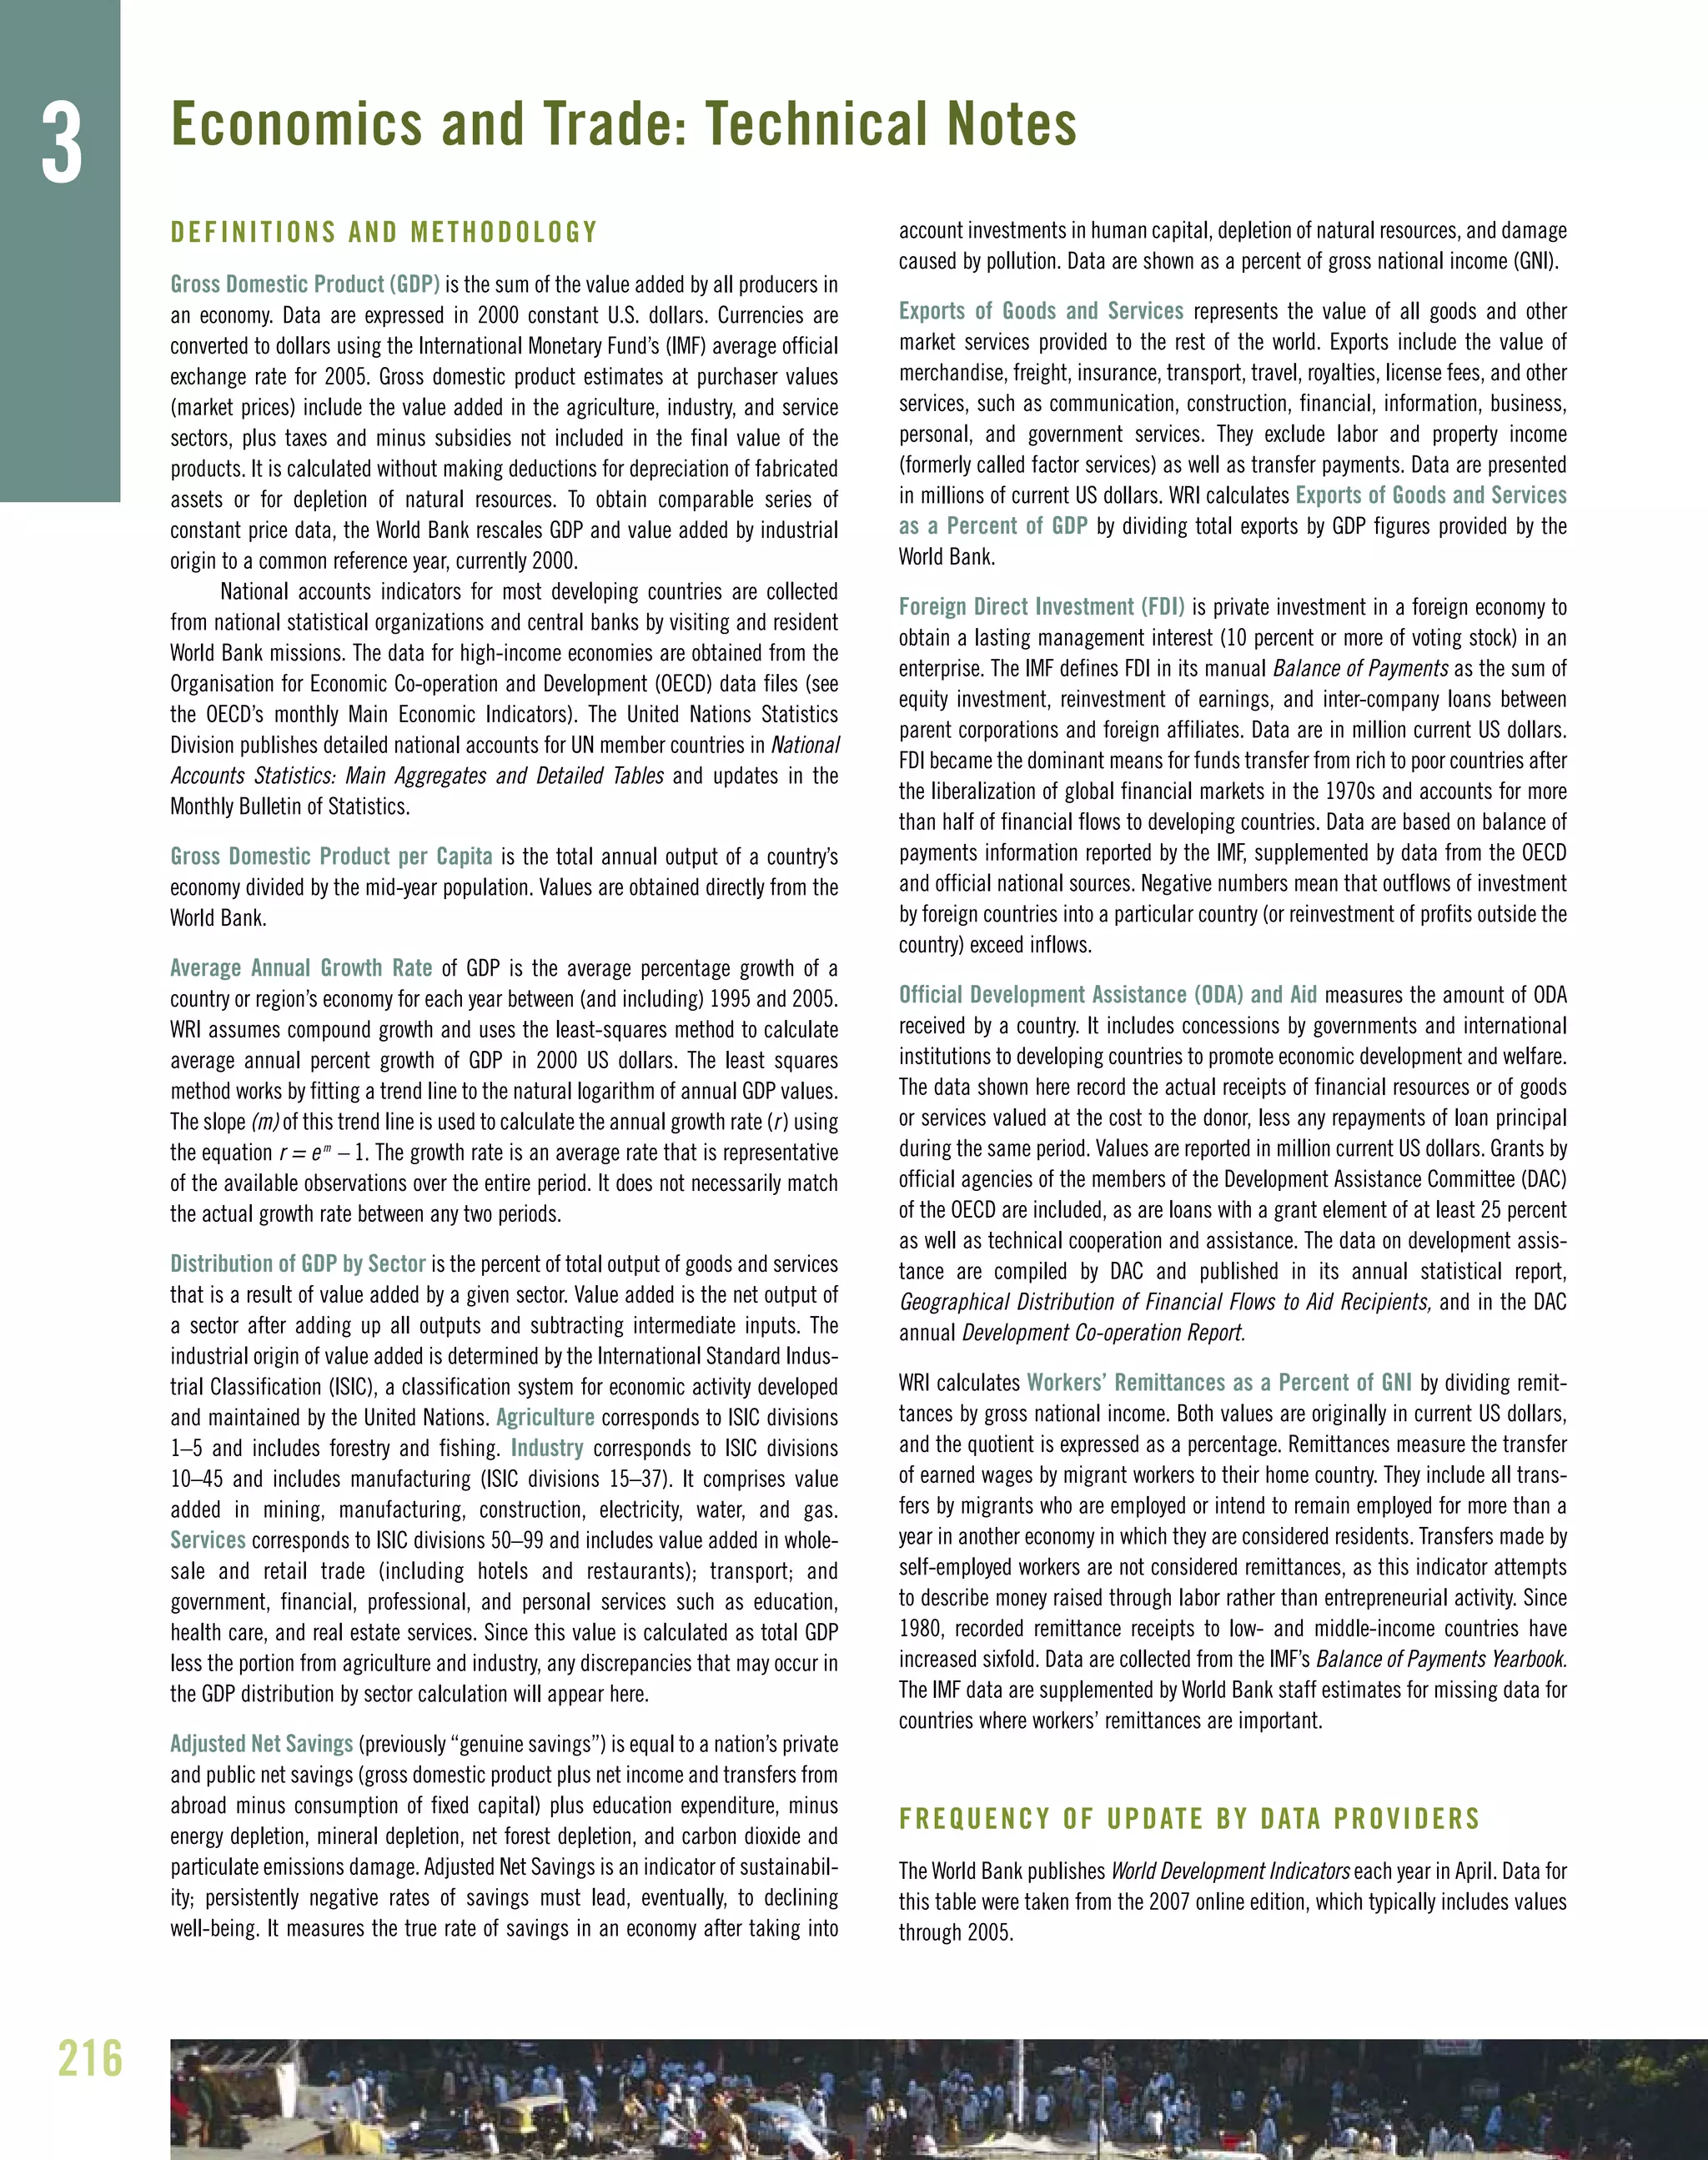
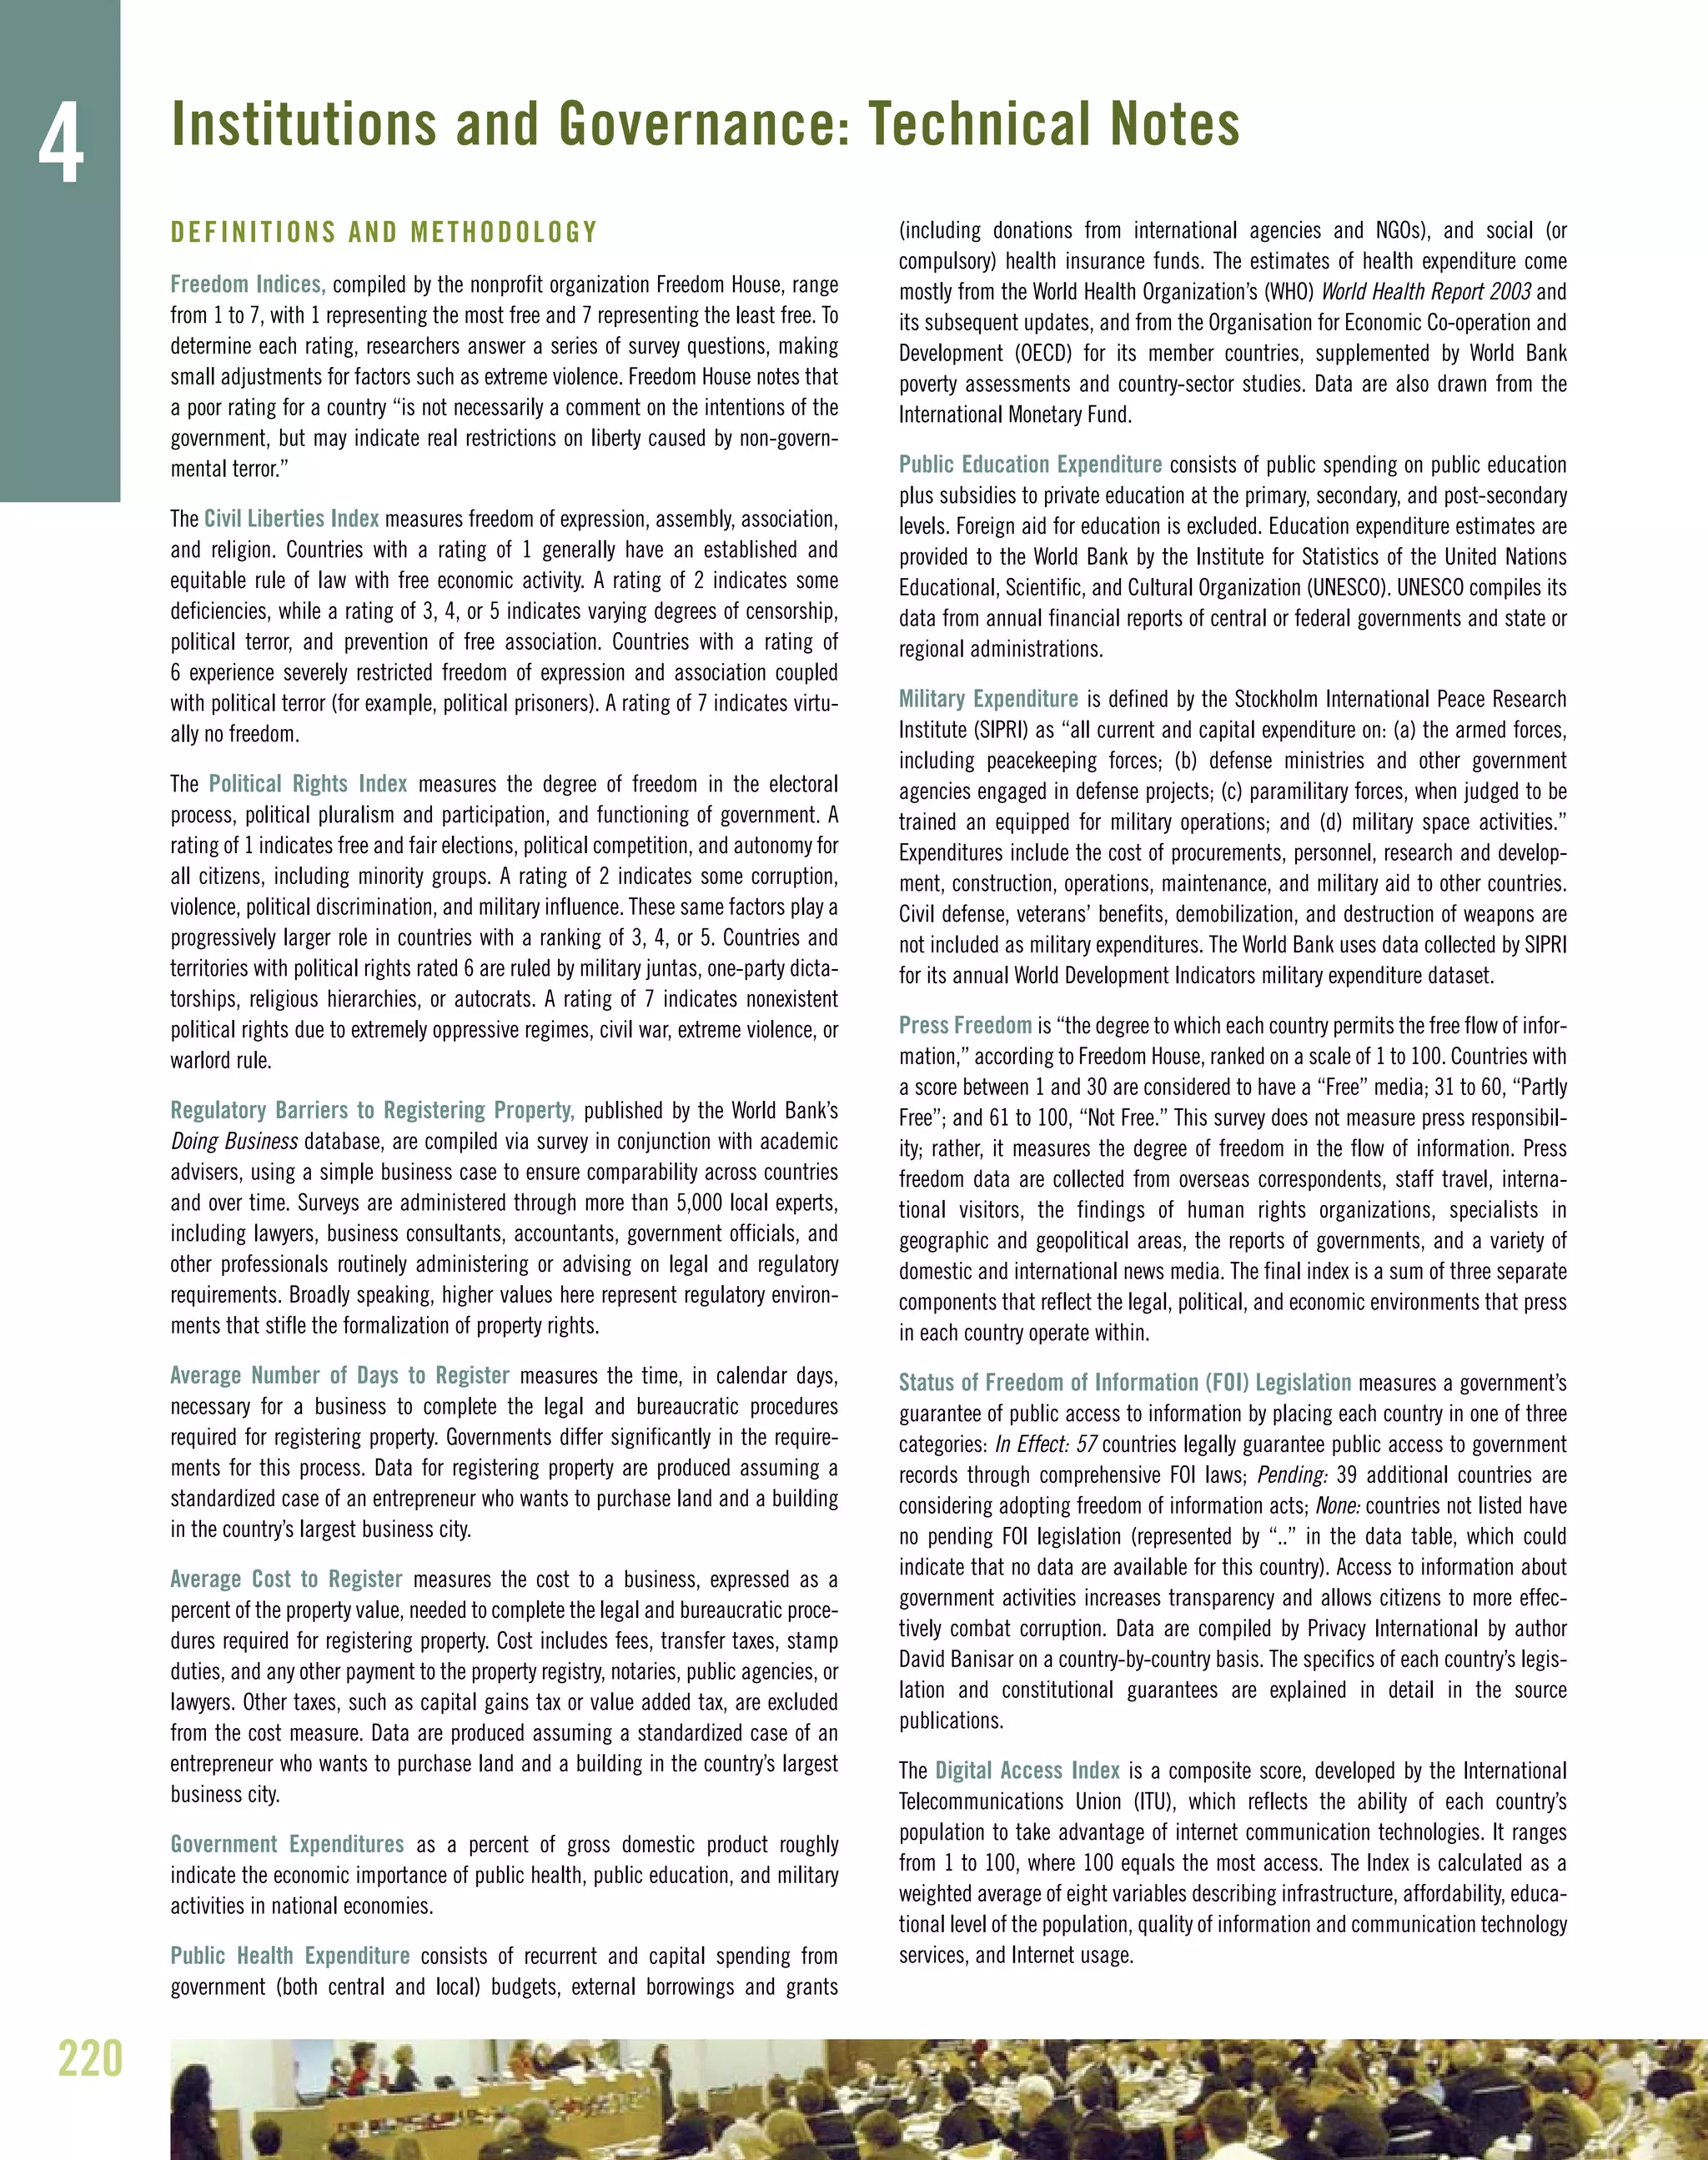
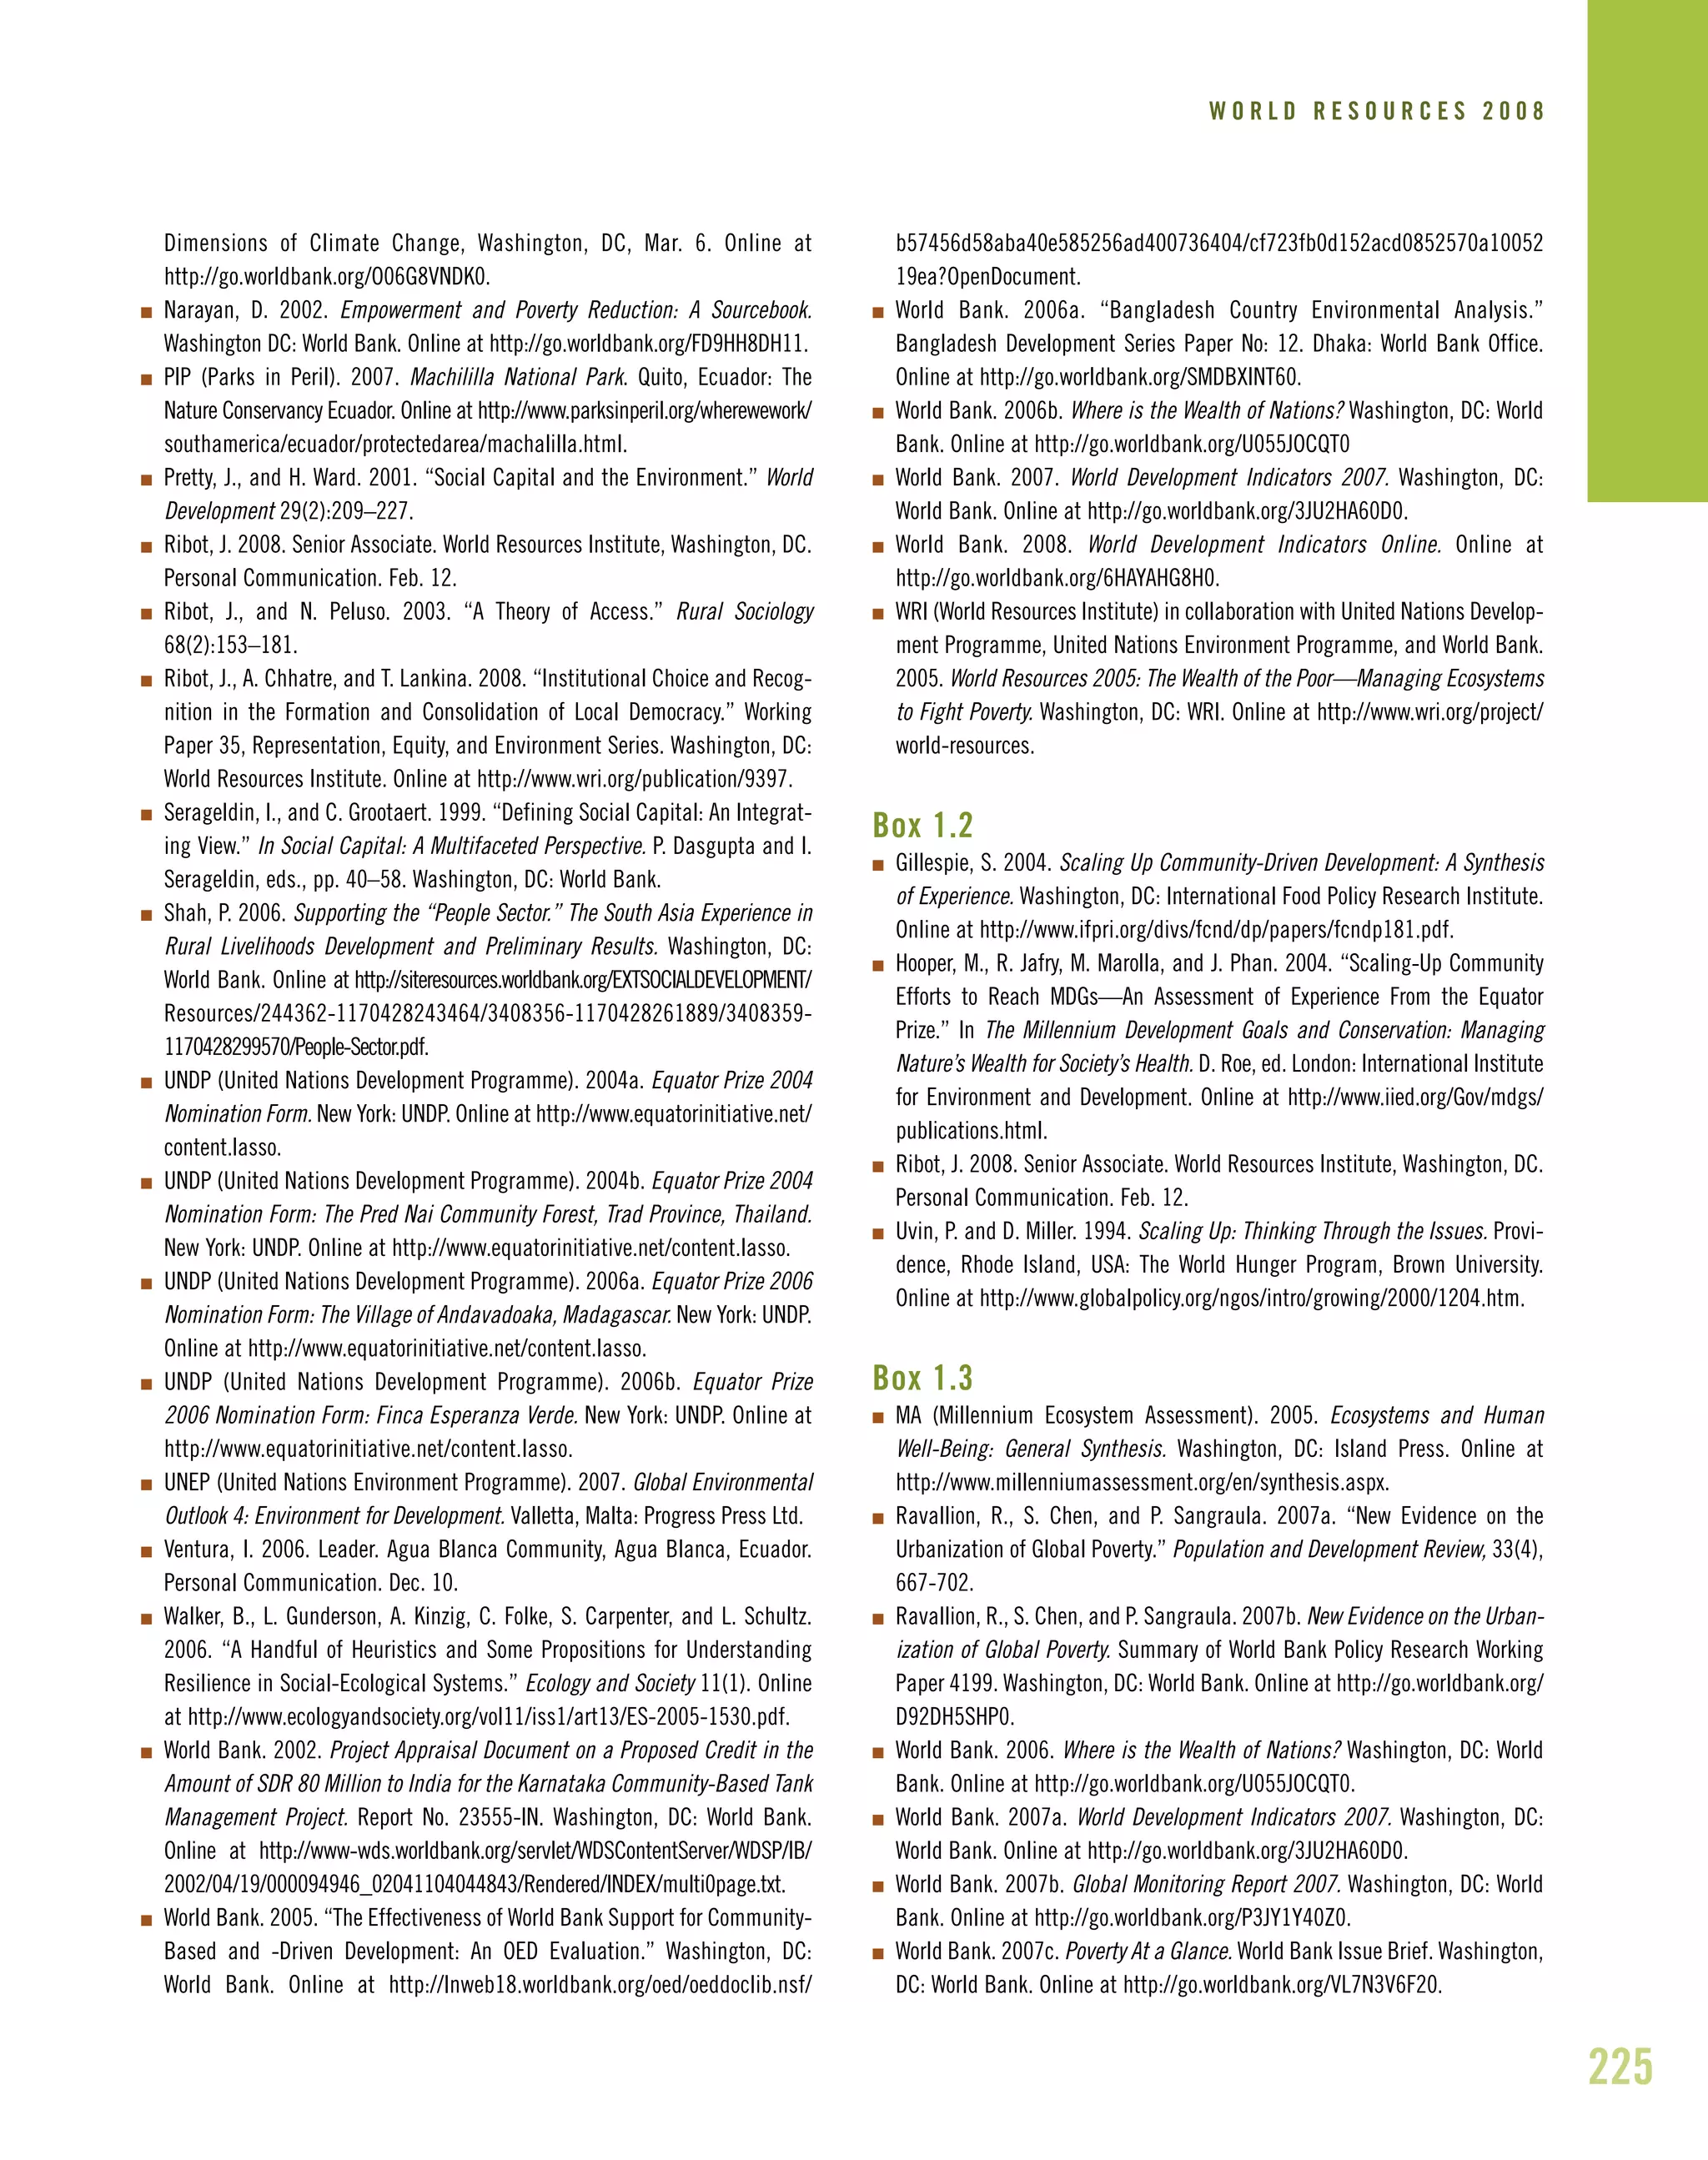
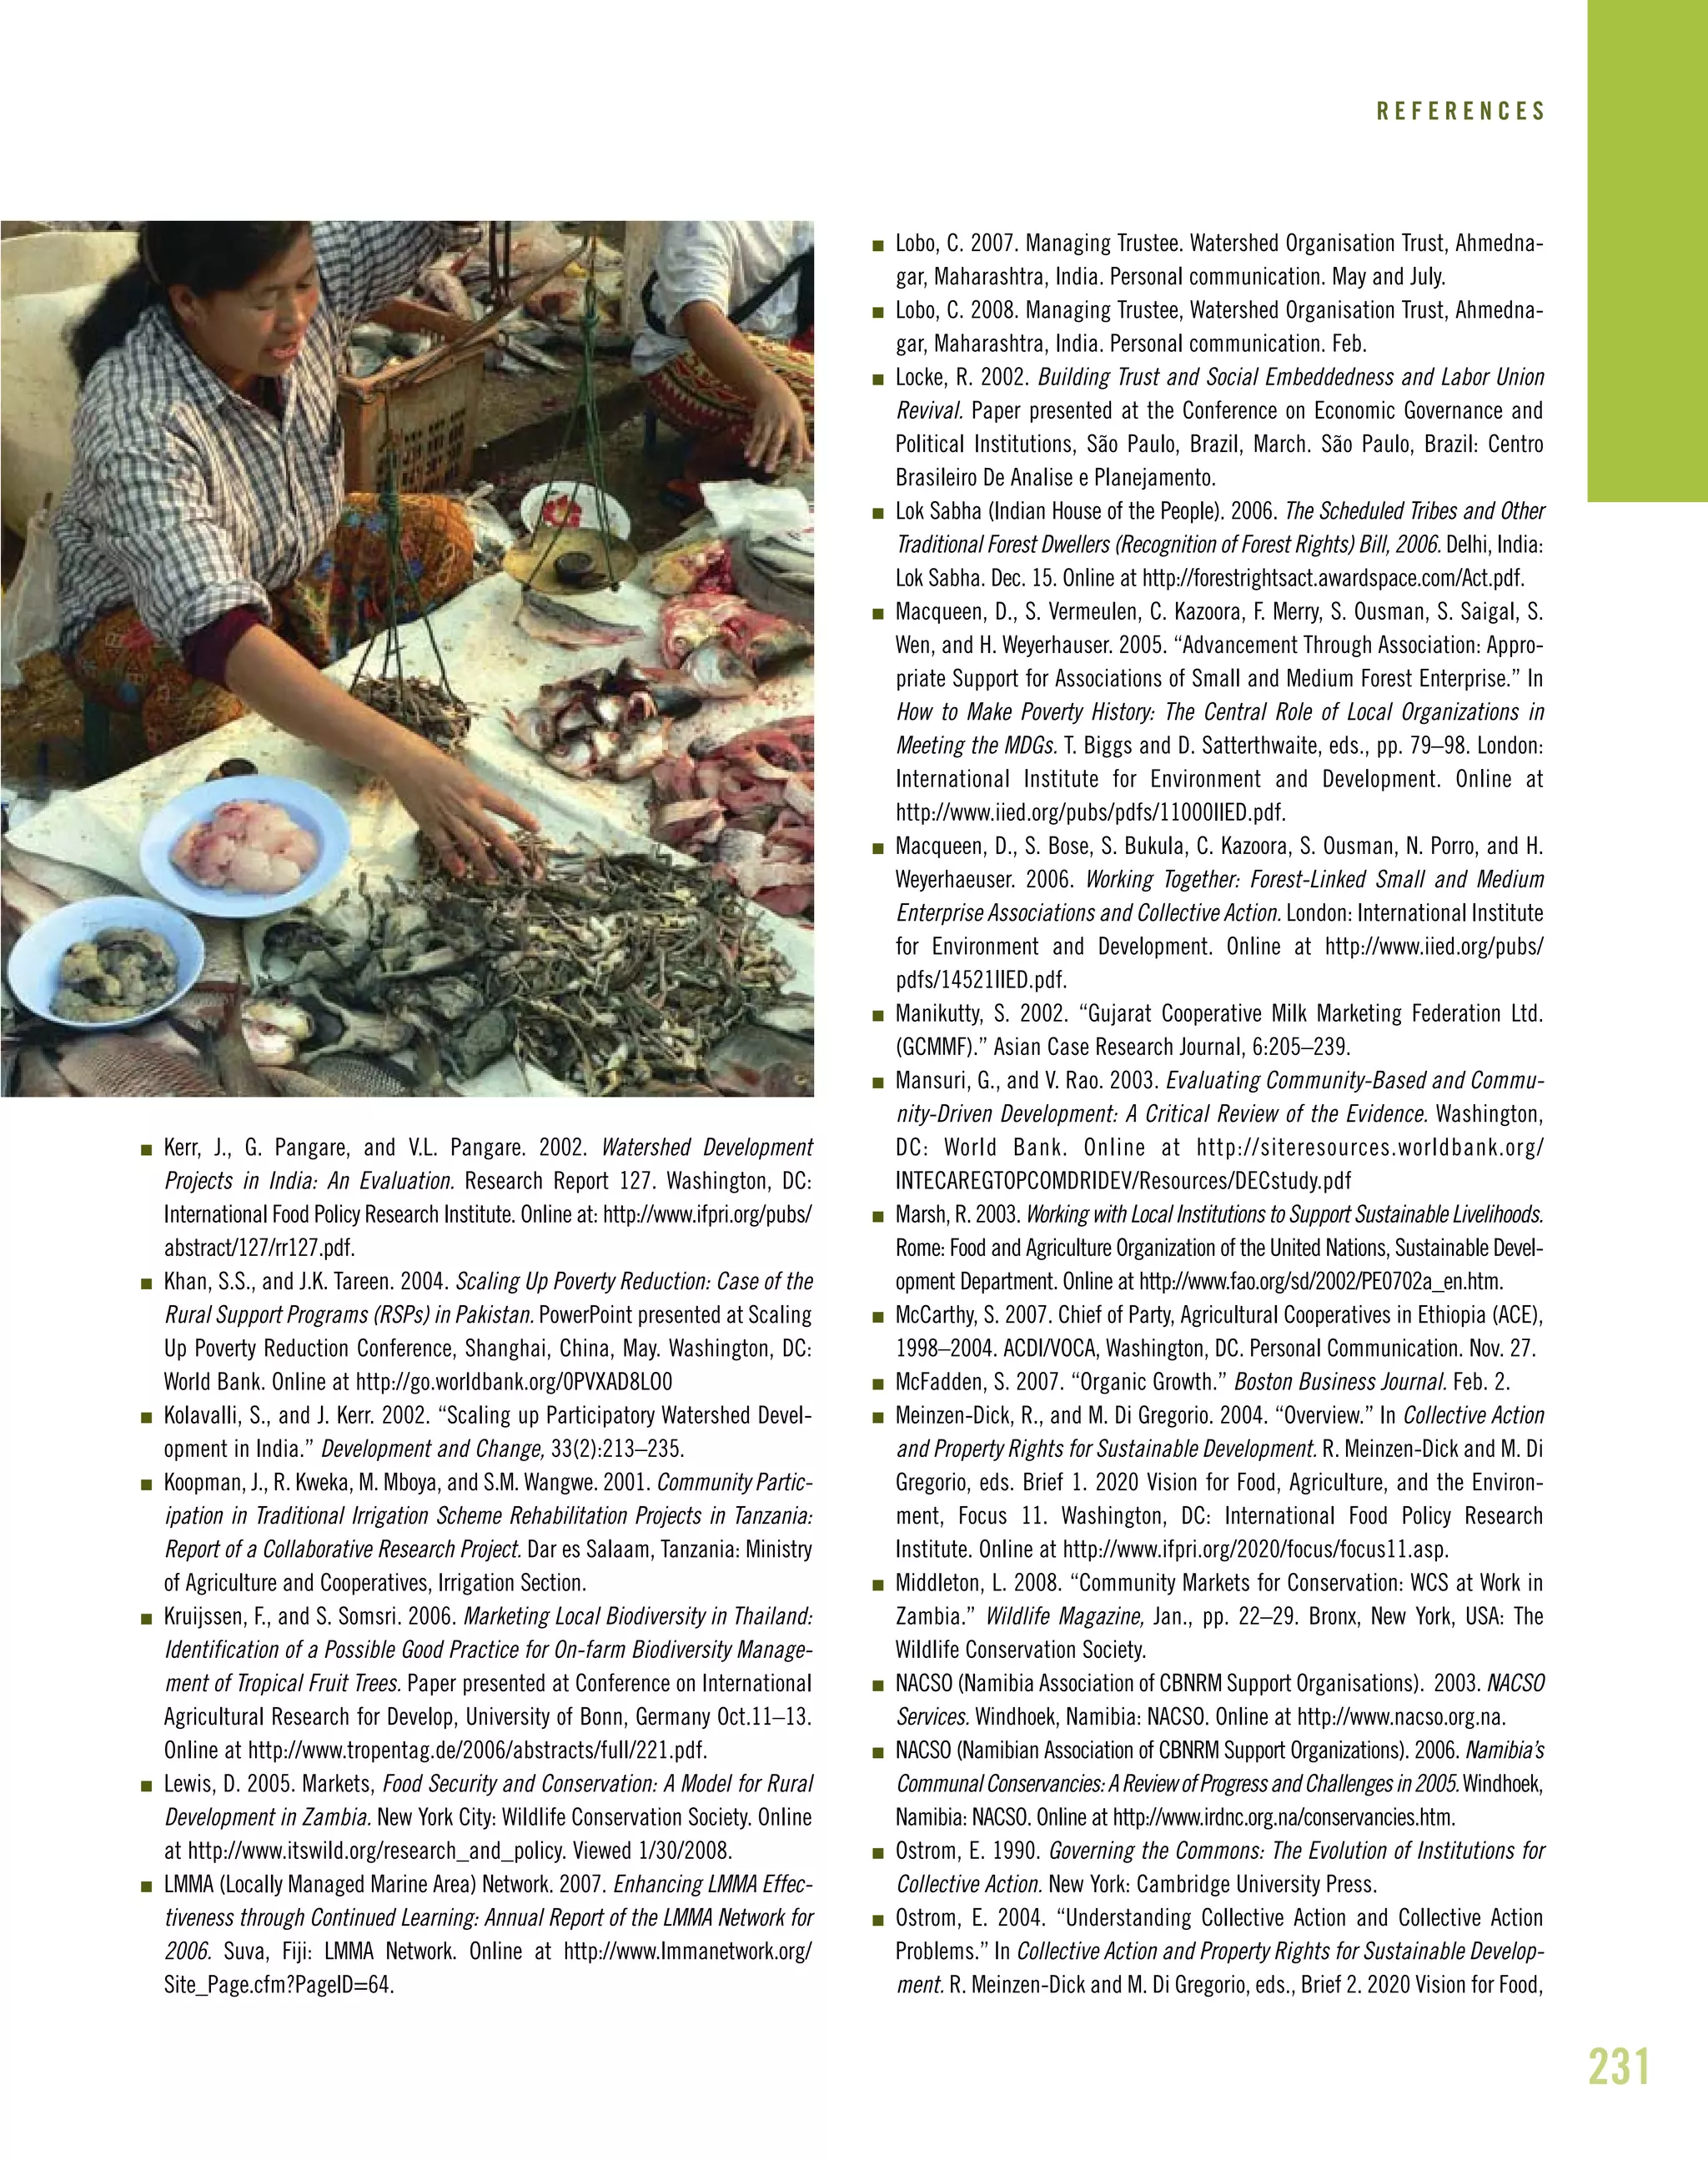
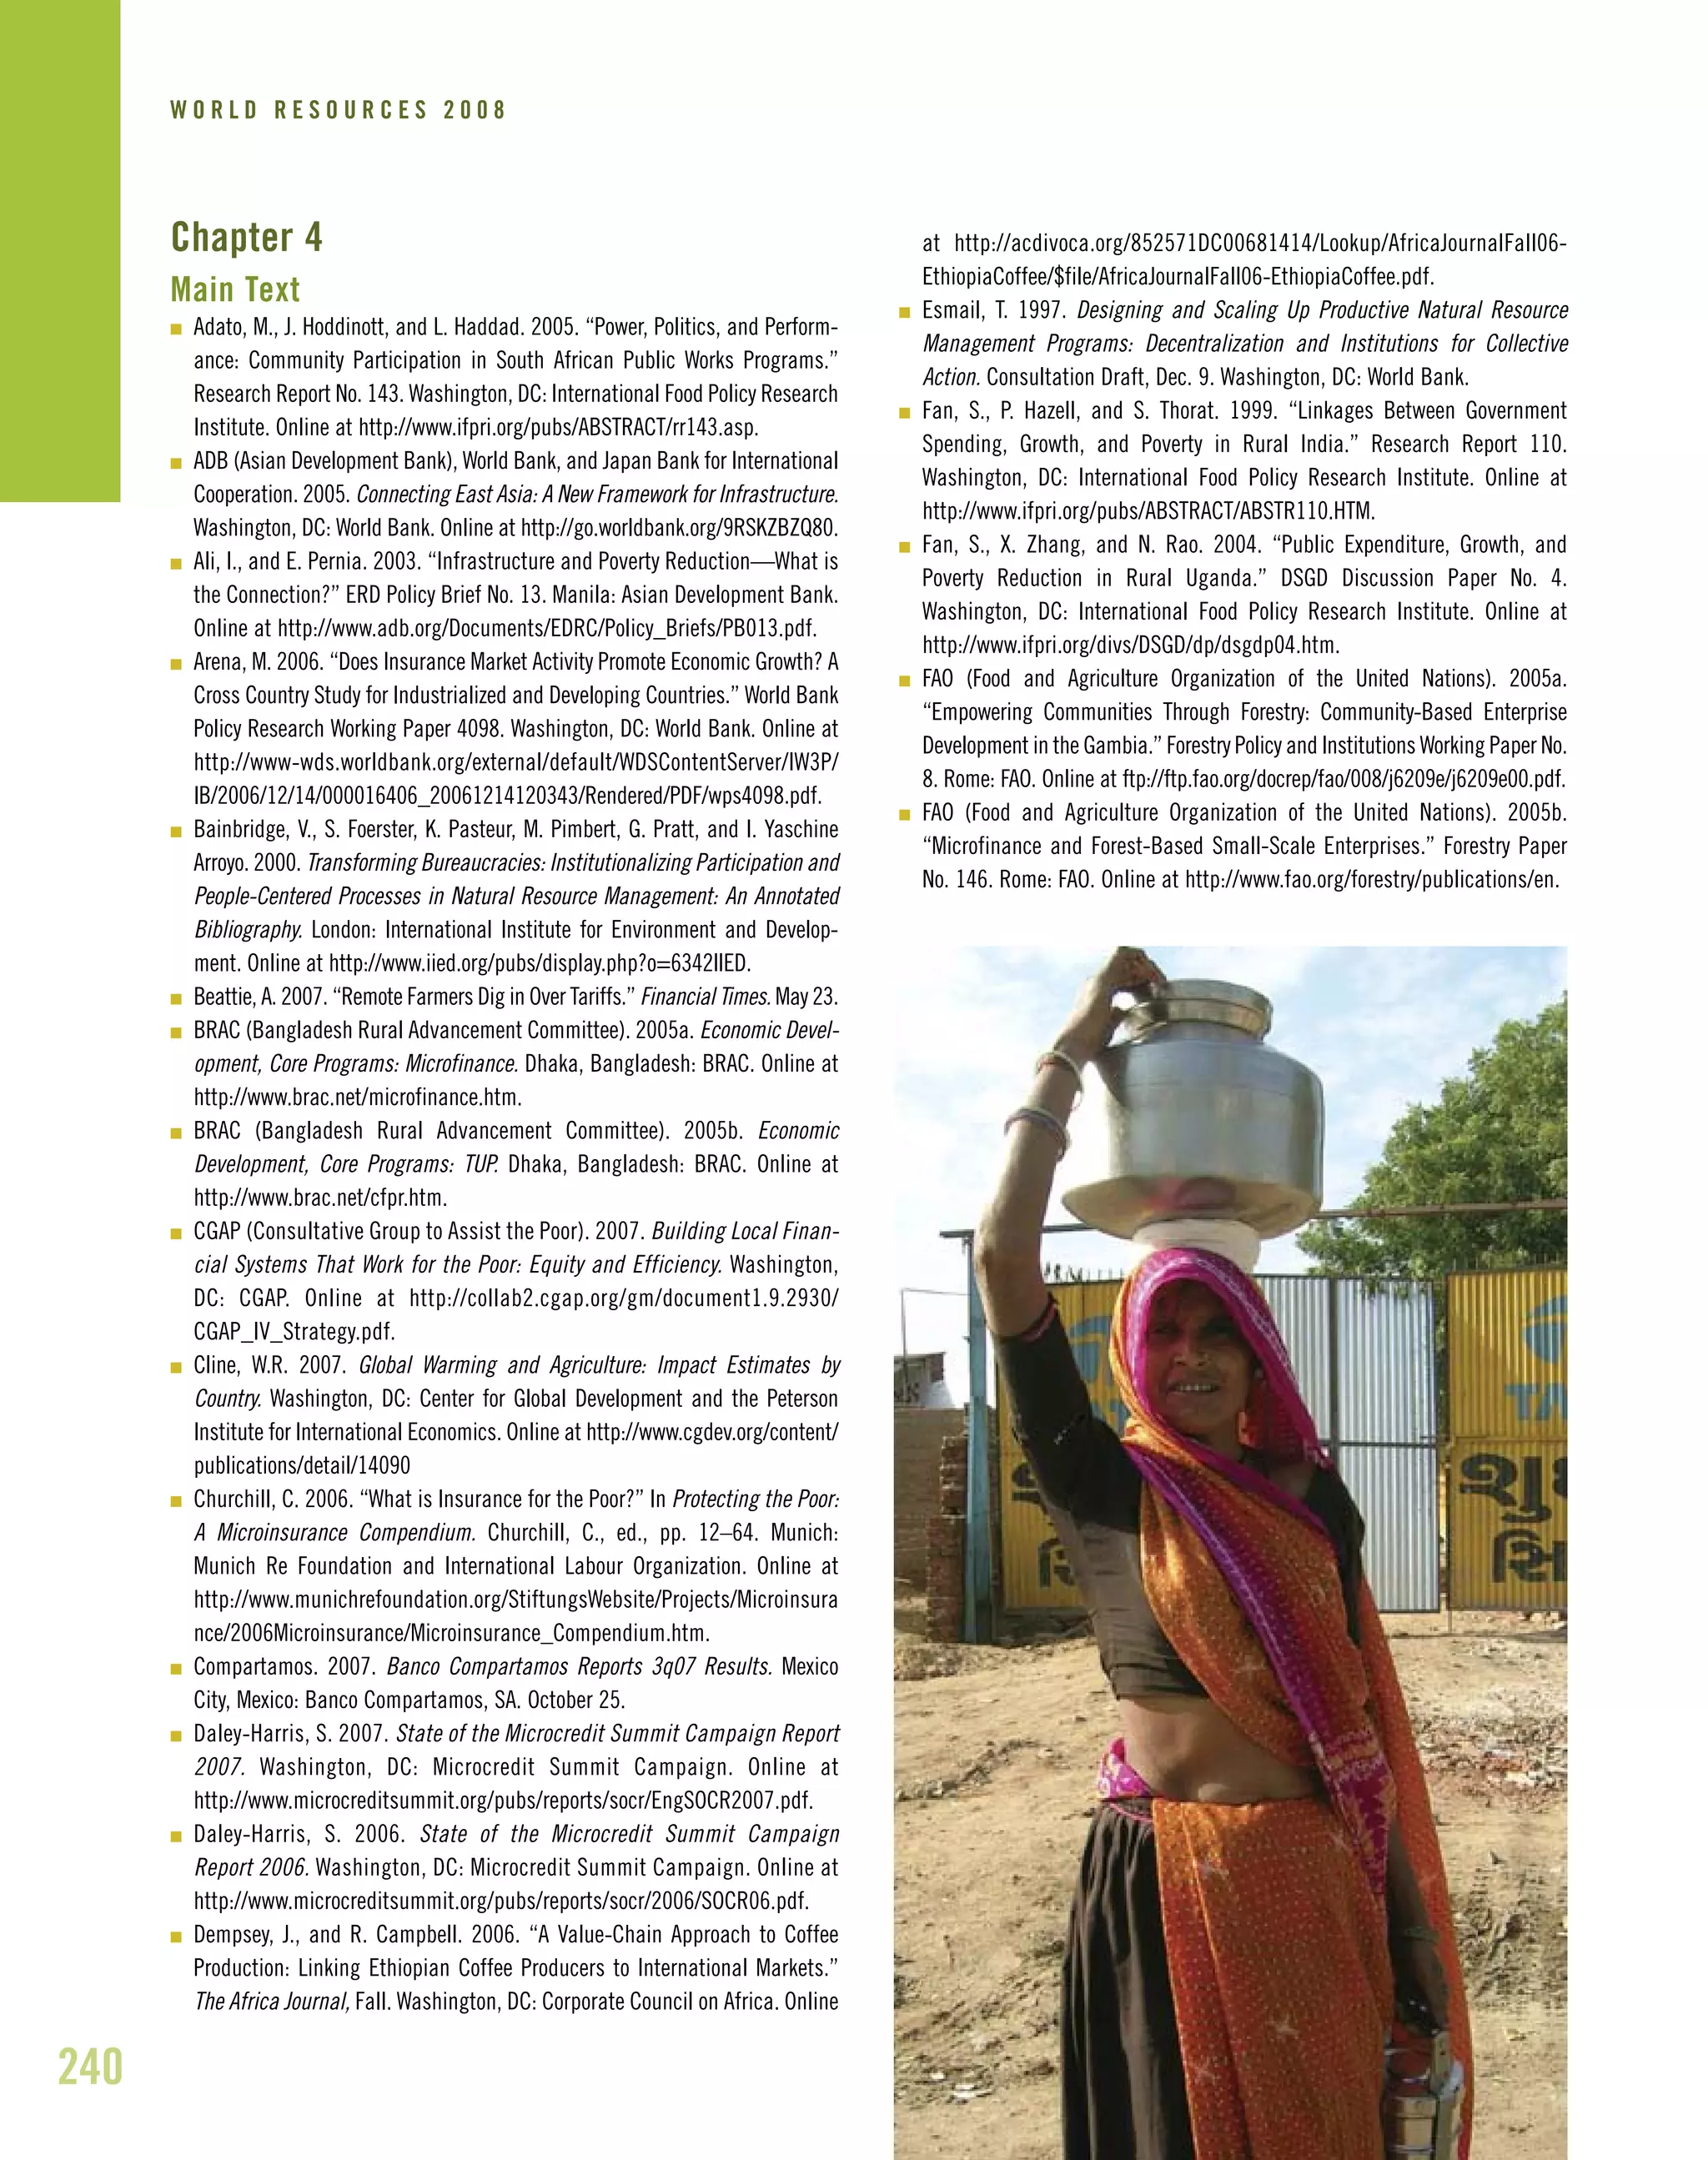
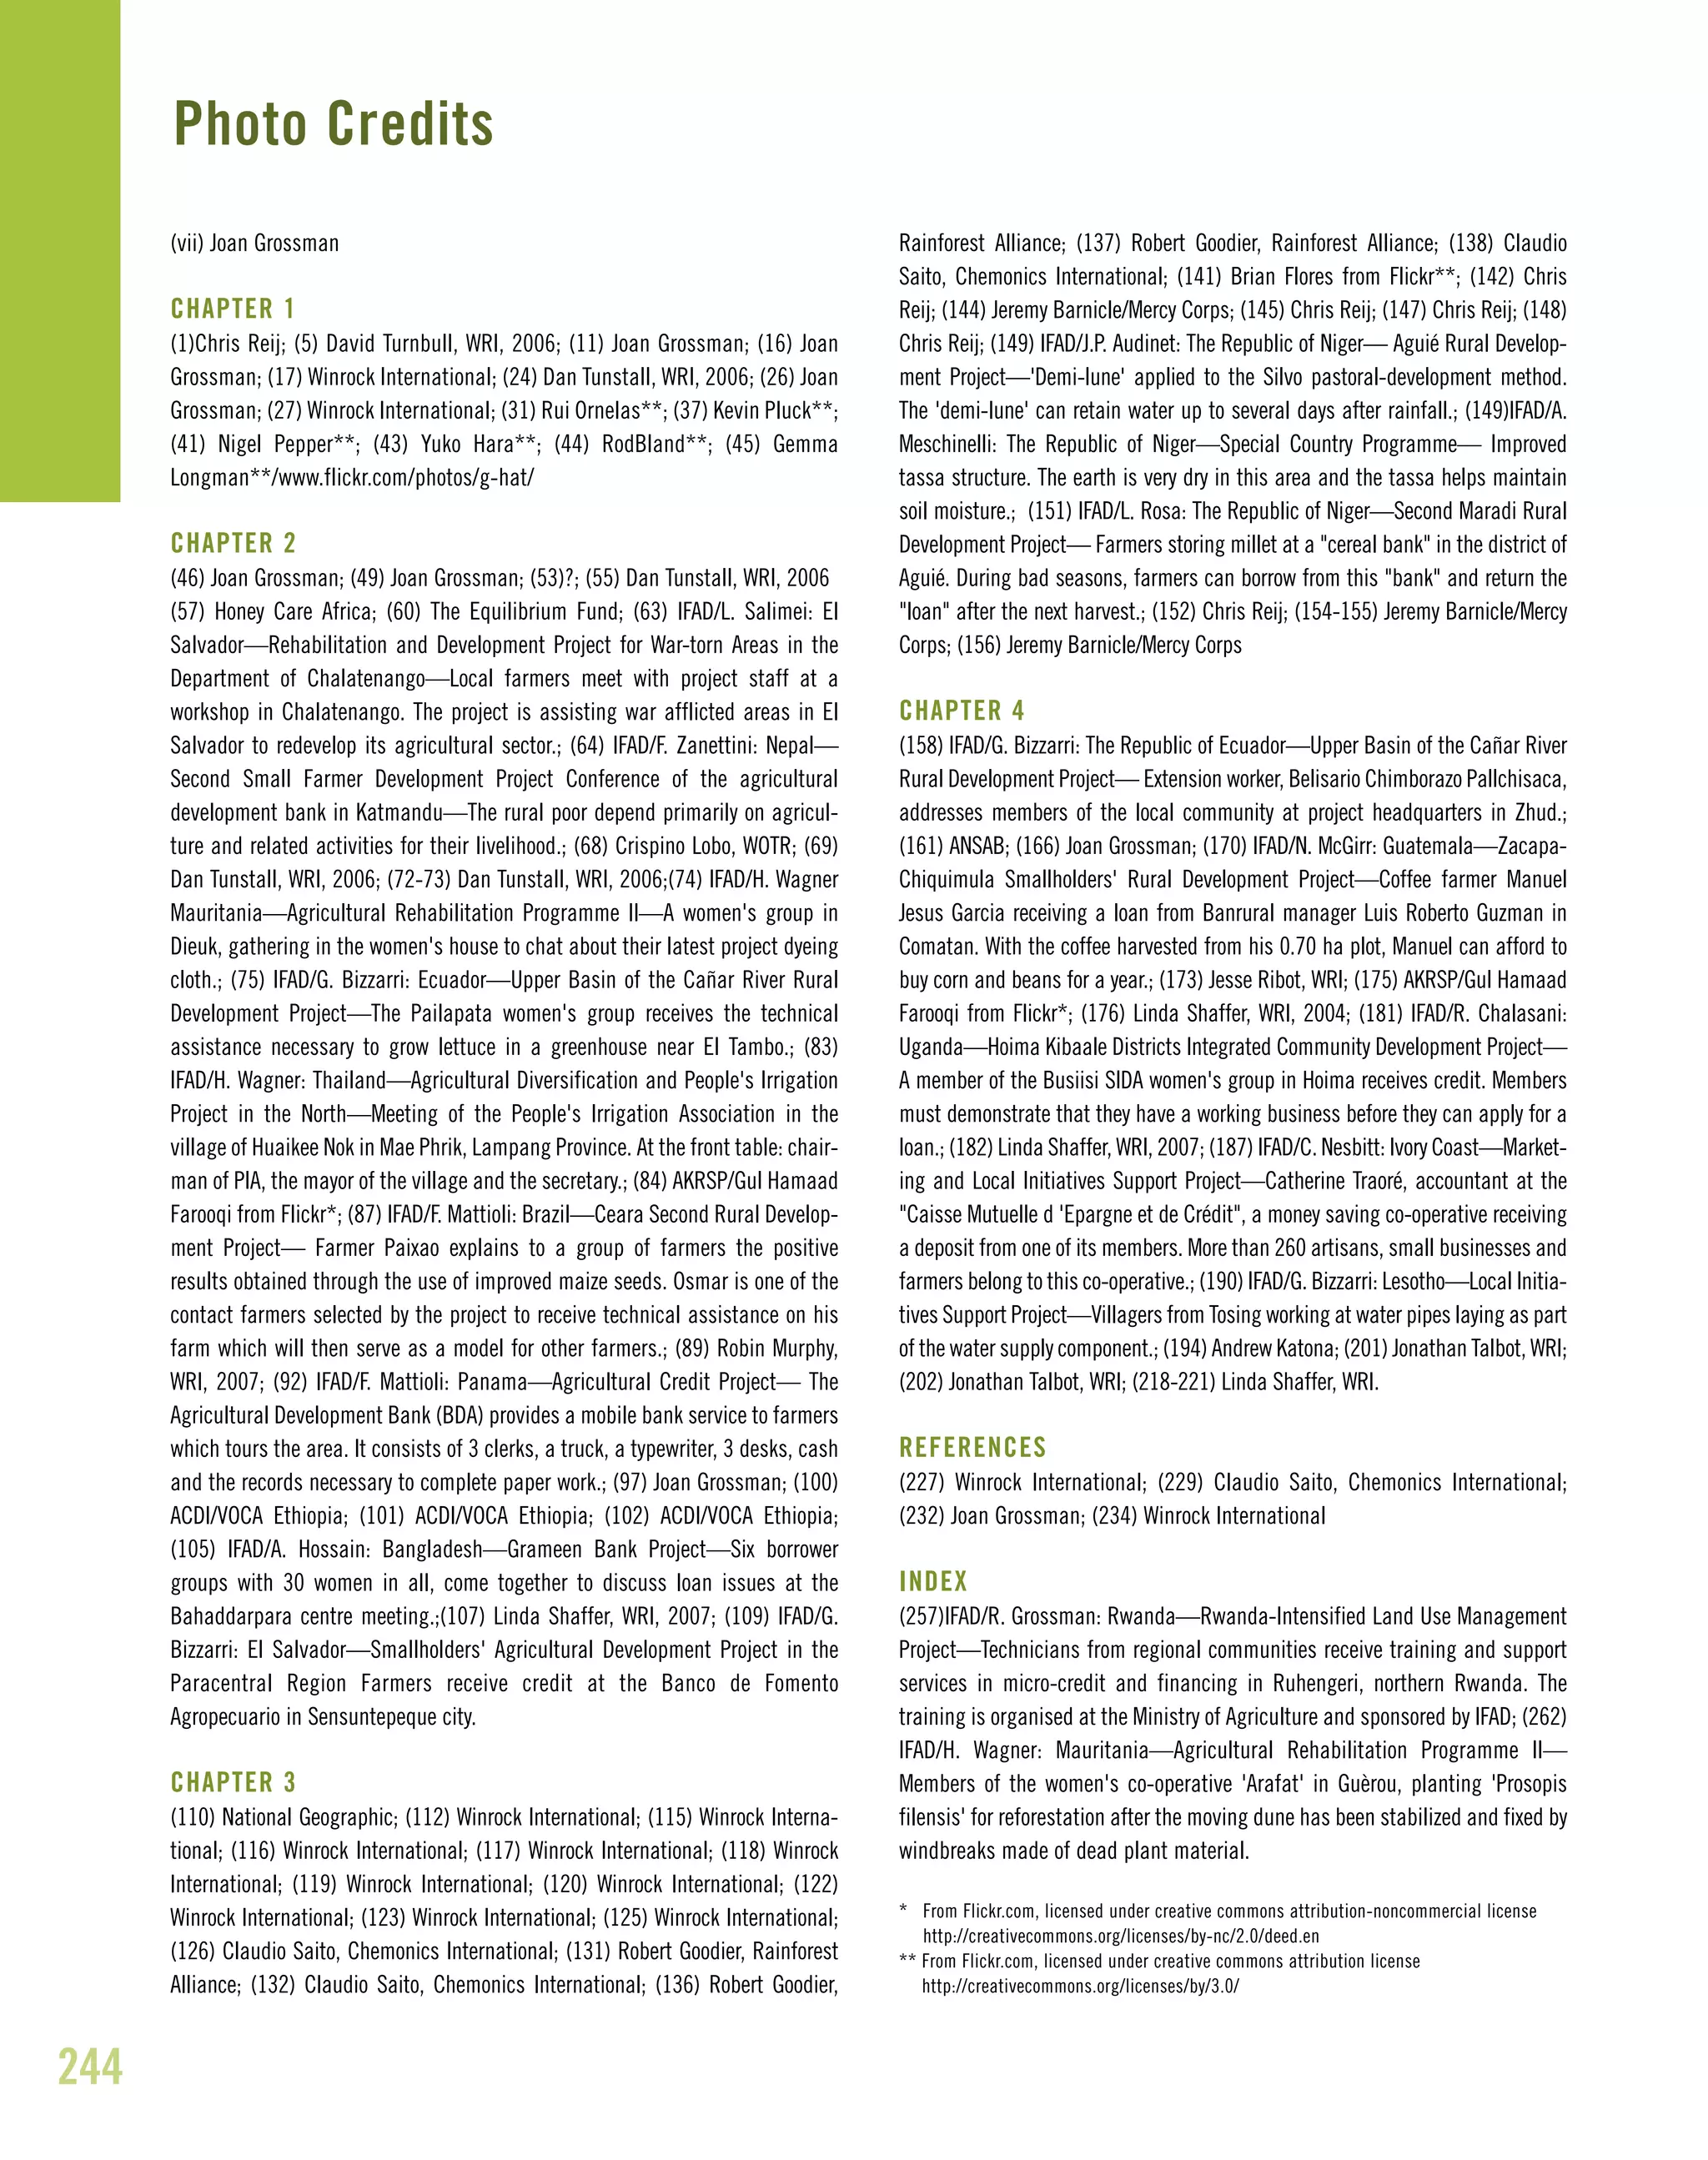
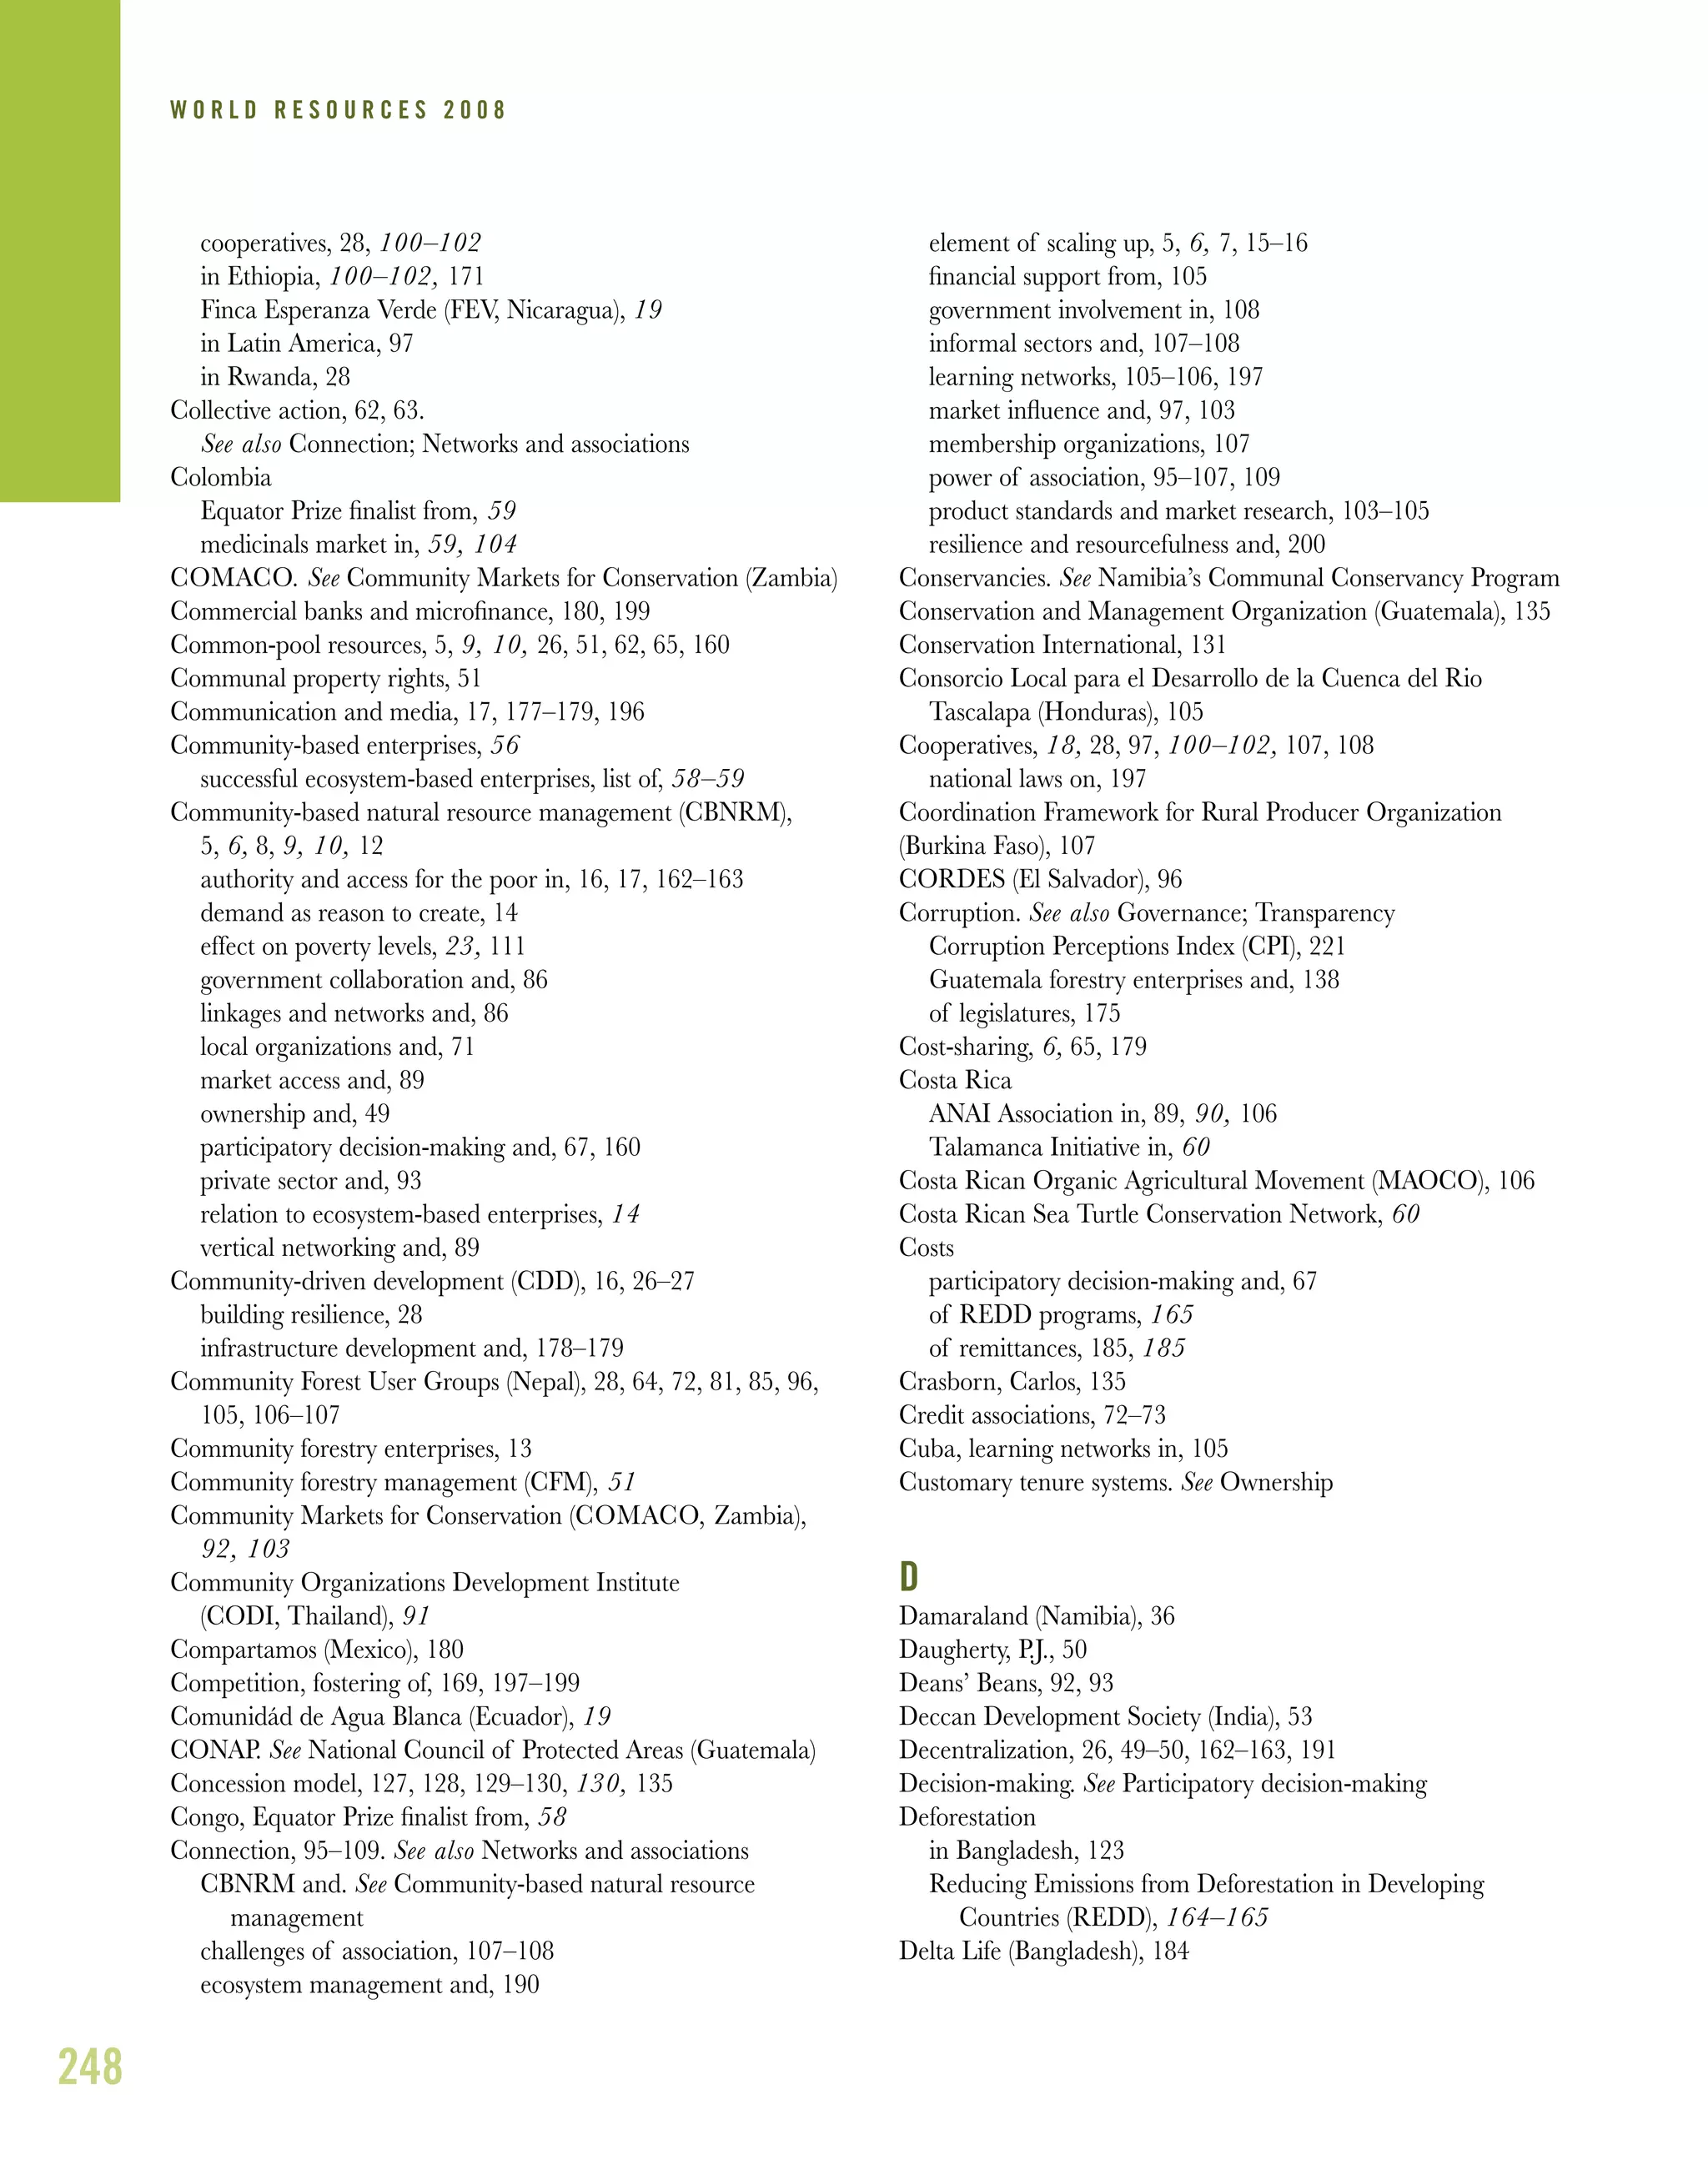
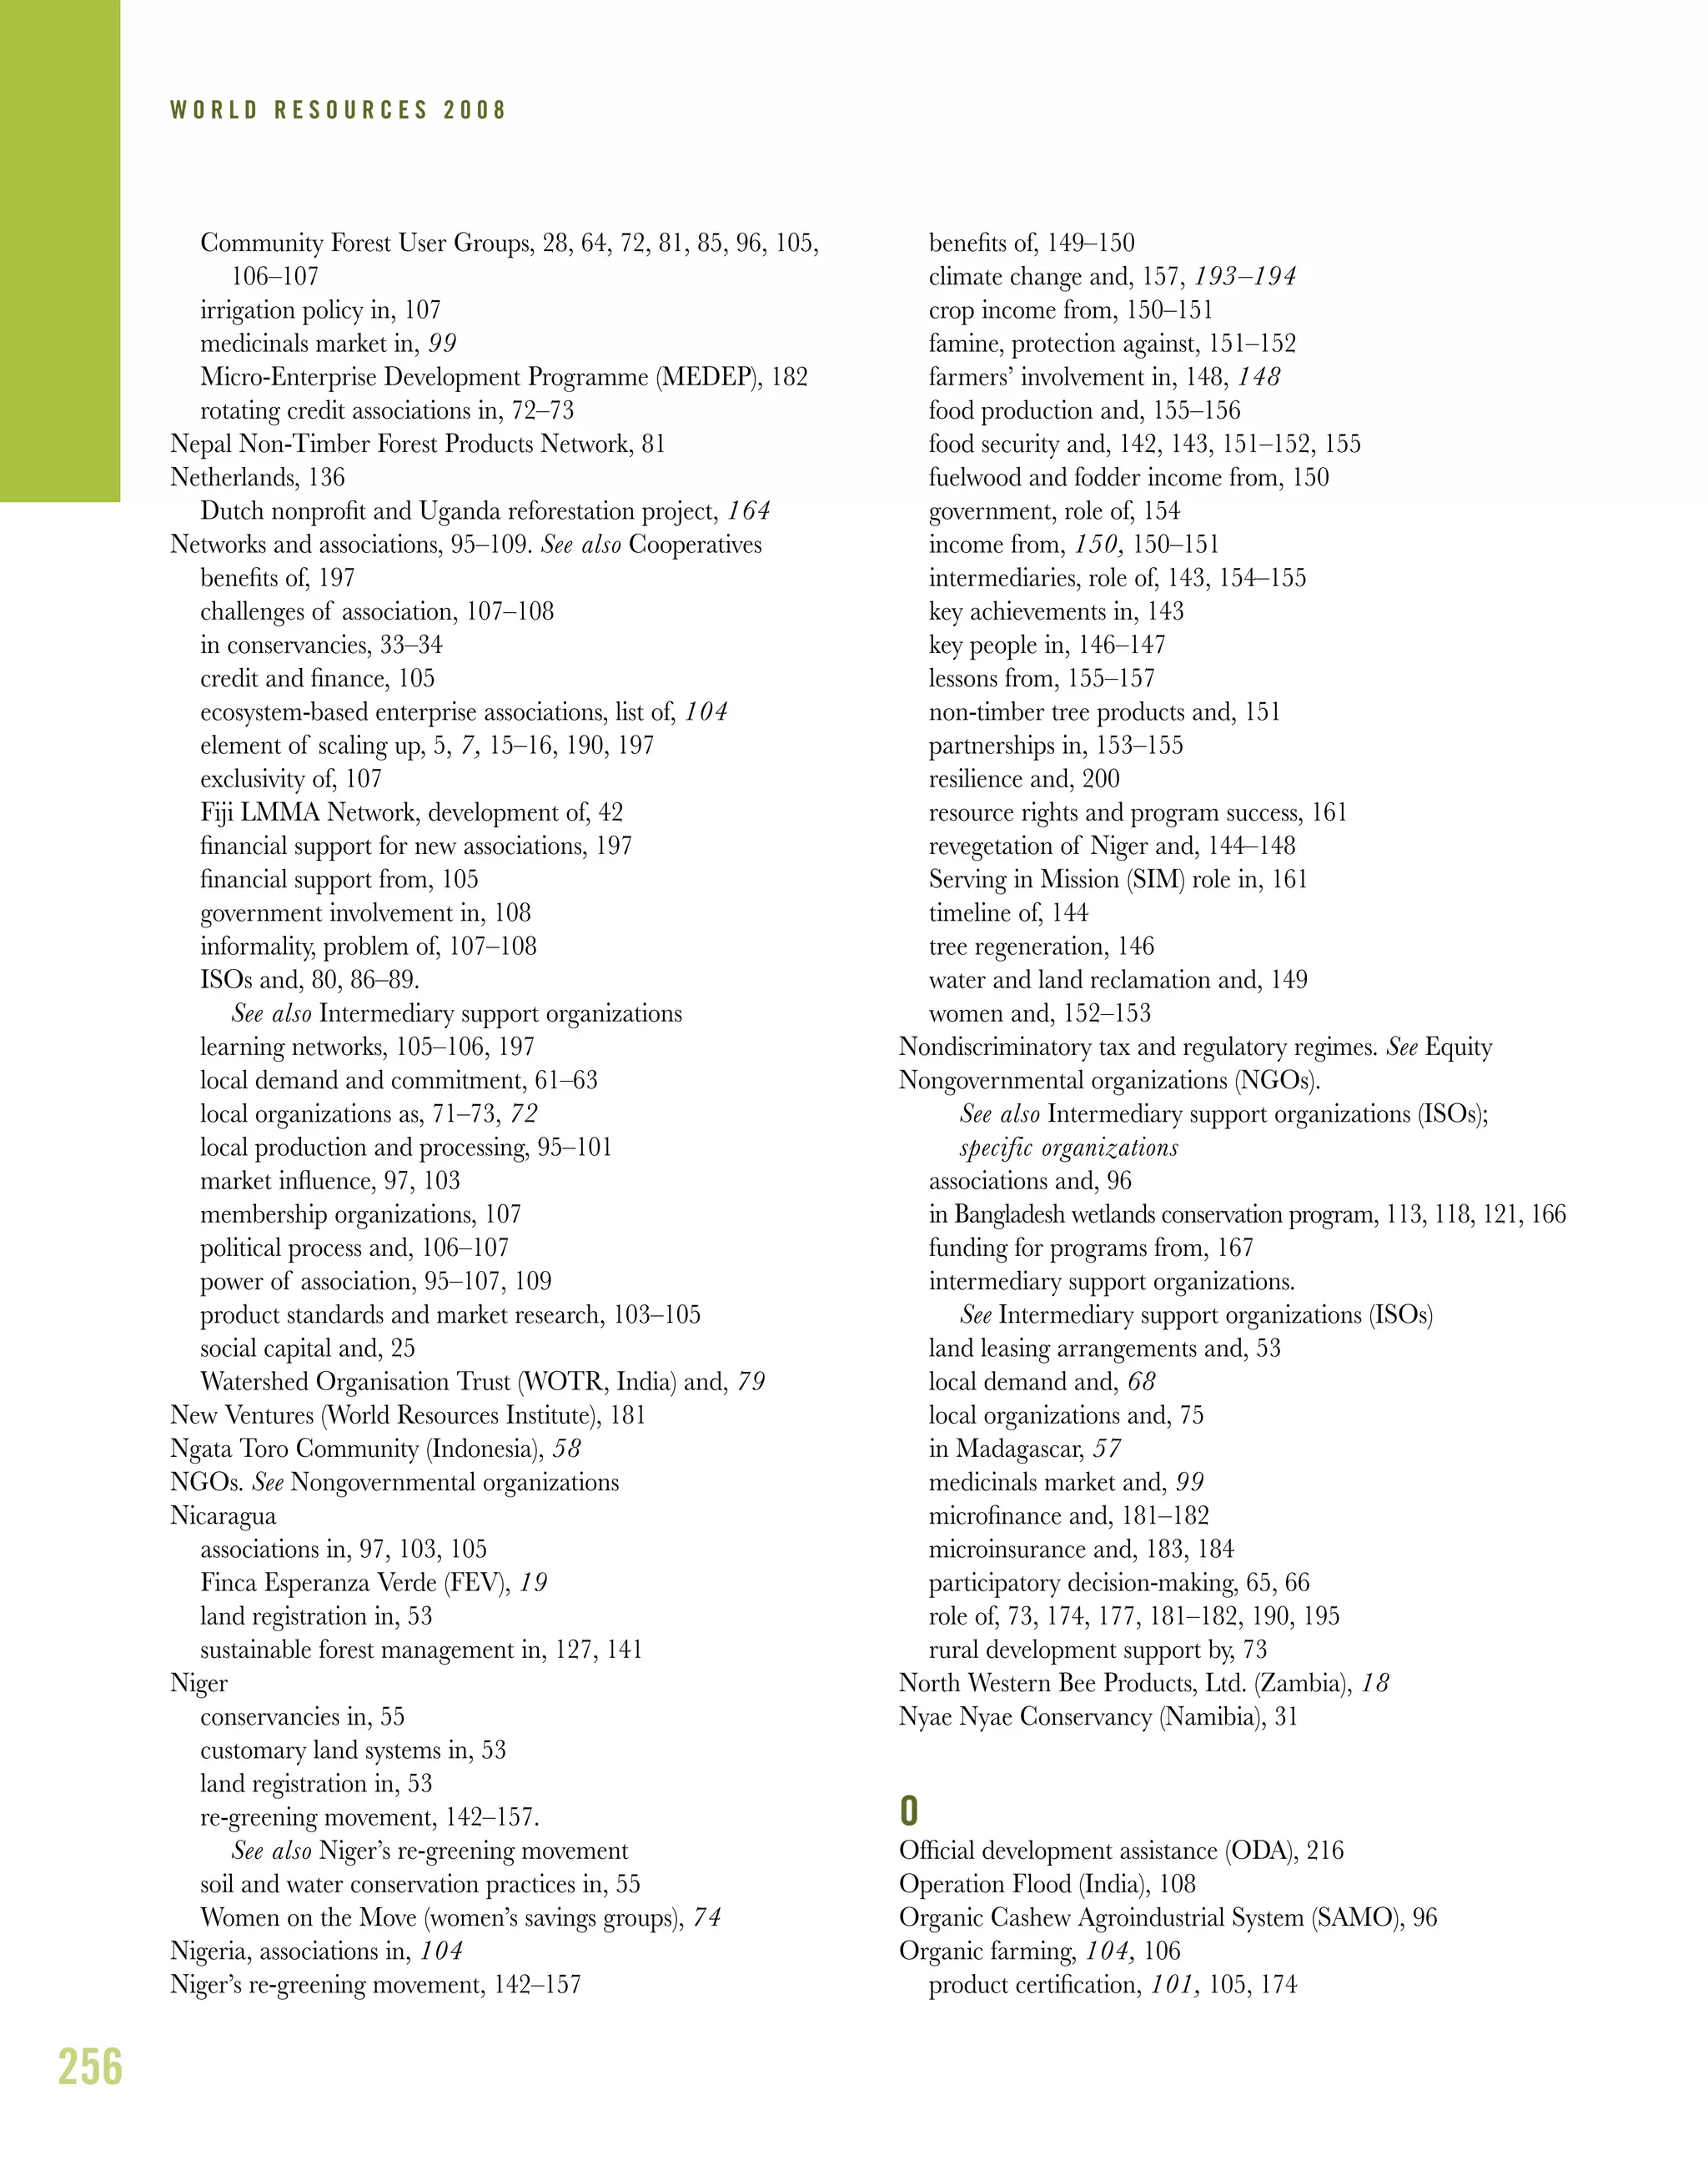
Career fisherman Jamir Uddin struggled to survive as once bountiful catches declined across
Sherpur wetland in the 1990s. To make extra money he began collecting and selling peanuts,
and in 2001 he took out a MACH micro-loan to start his own shop. Three loans later, his
expanding general goods store makes 30,000 taka (US$428) a year in profits, a sum he
describes as unimaginable in his former occupation: “I saw that if I quit fishing and devoted
myself to a shop full time I could make more money,” he says as he greets customers. “This
shop has changed my life.” (MACH 2005d)](https://image.slidesharecdn.com/worldresources2008rootsofresilience-150506081253-conversion-gate02/75/World-resources-2008_roots_of_resilience-134-2048.jpg)

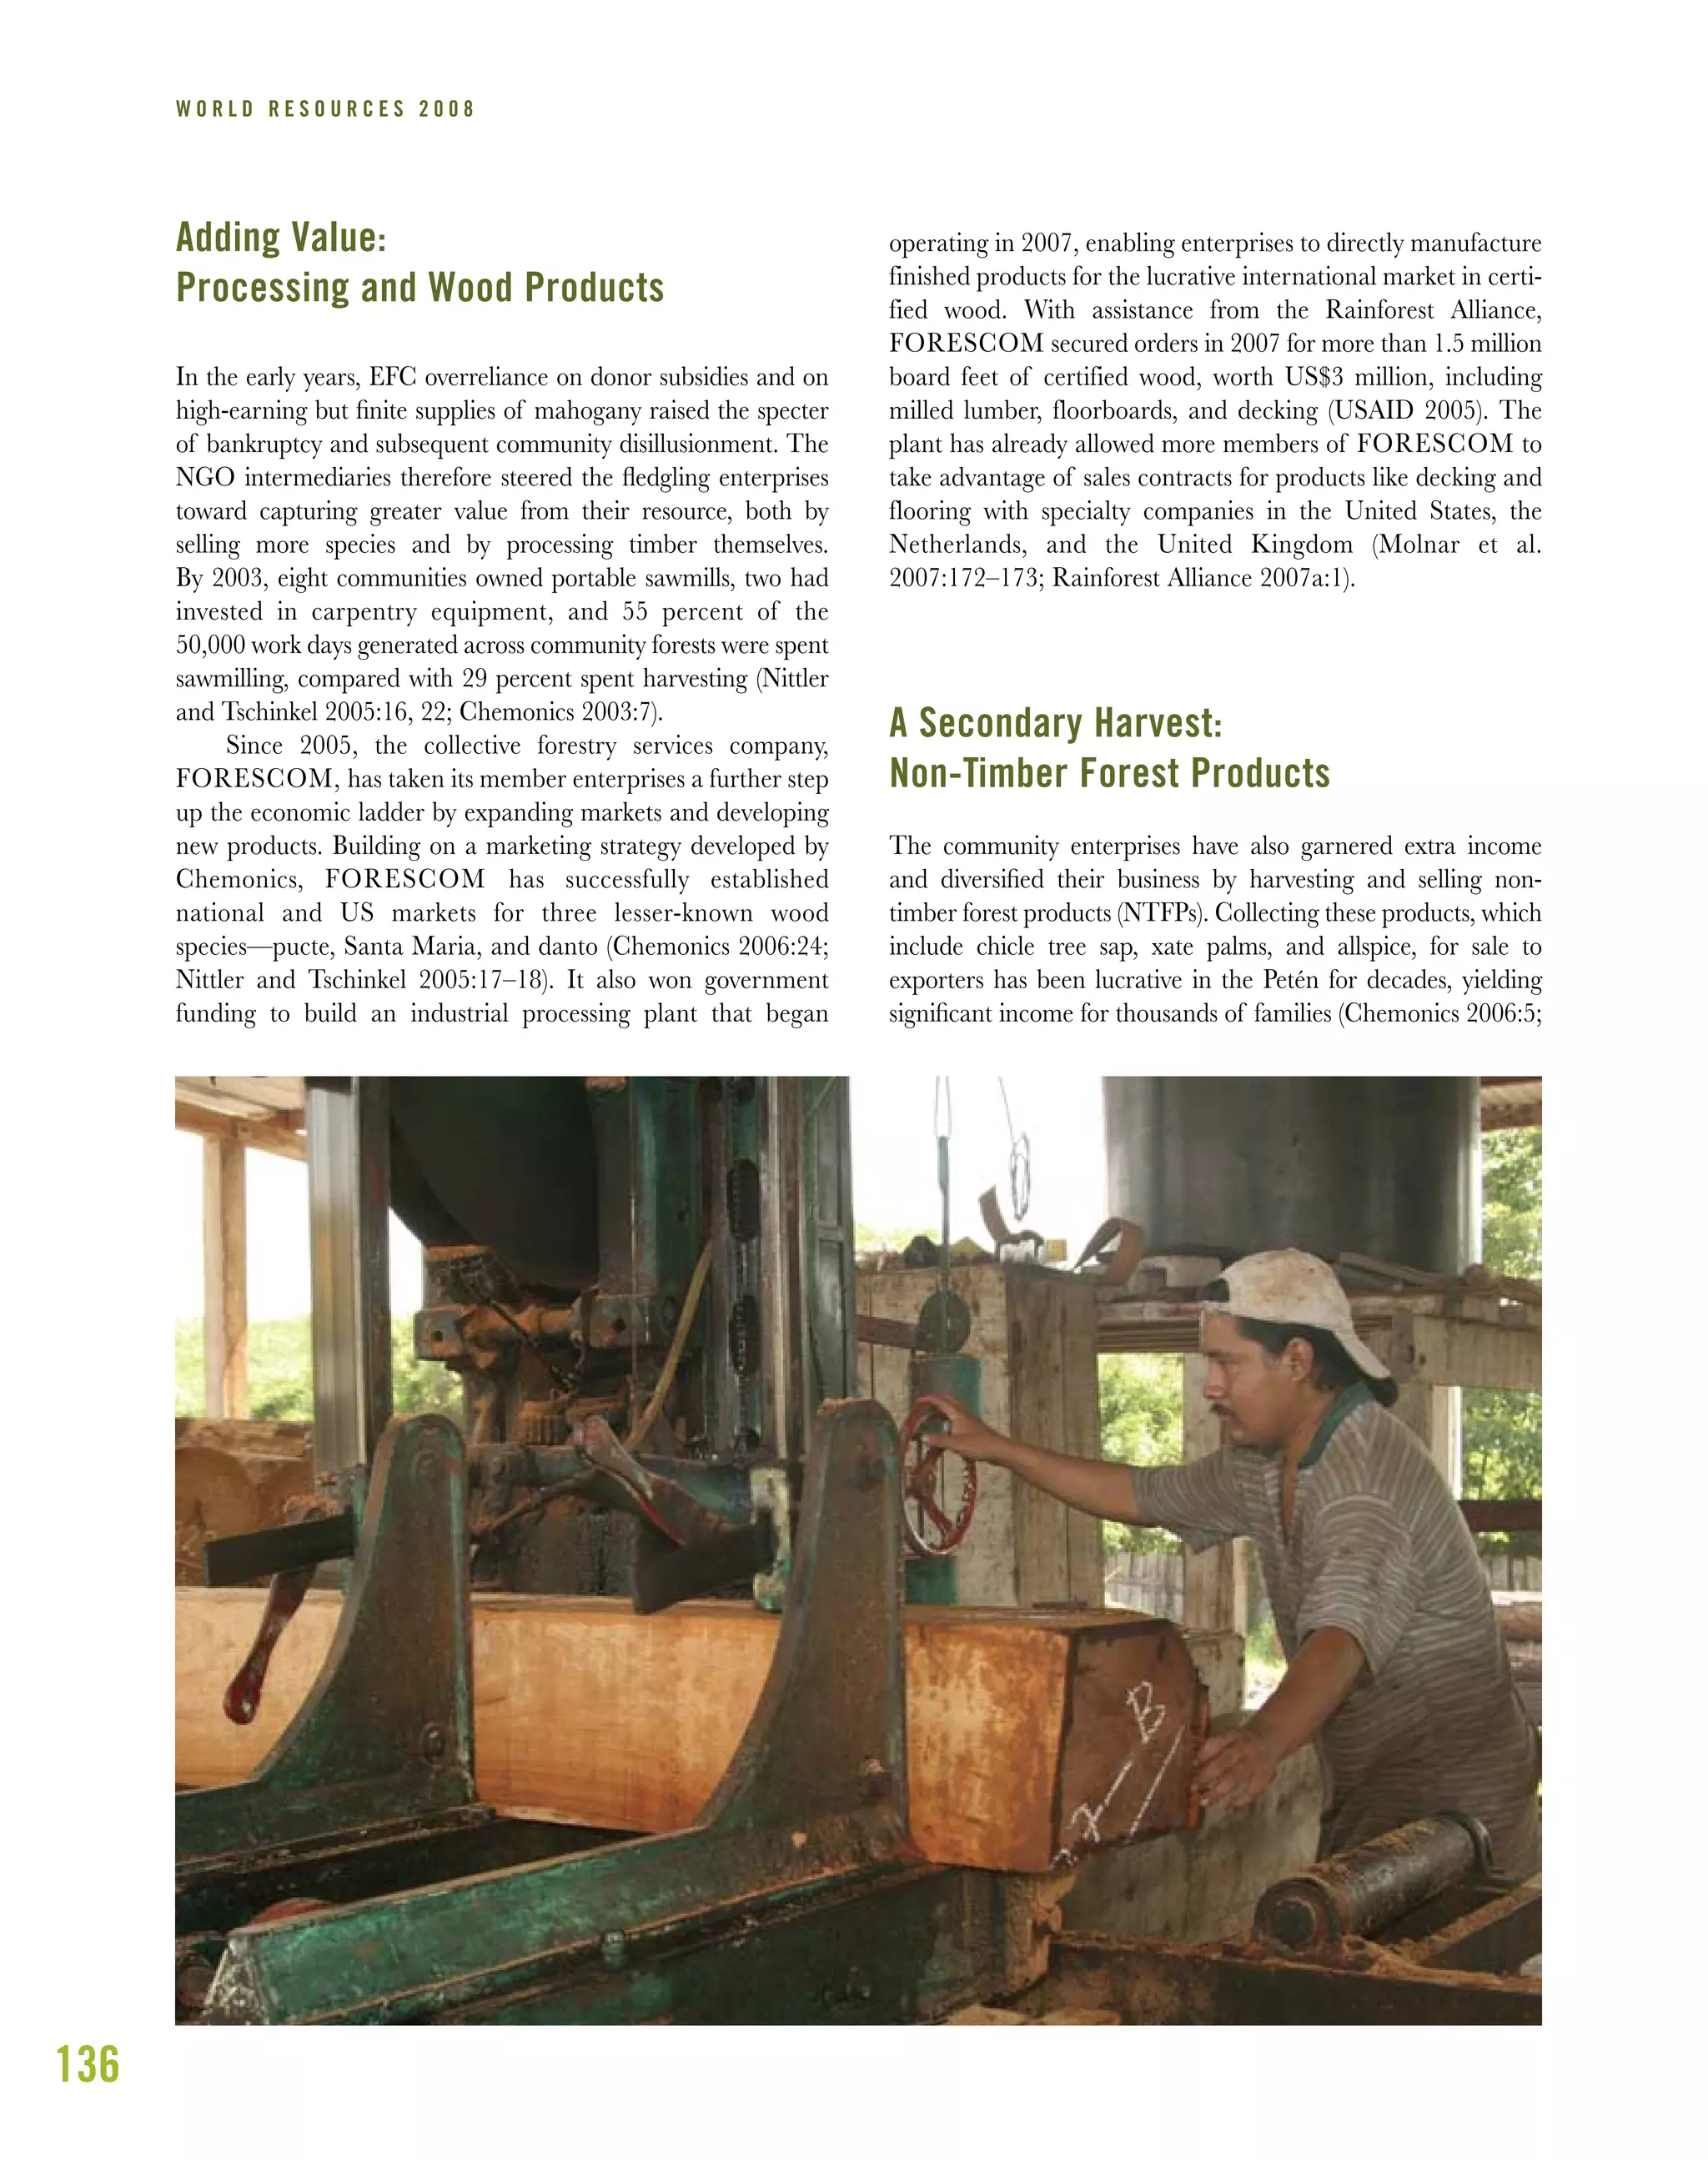
![137
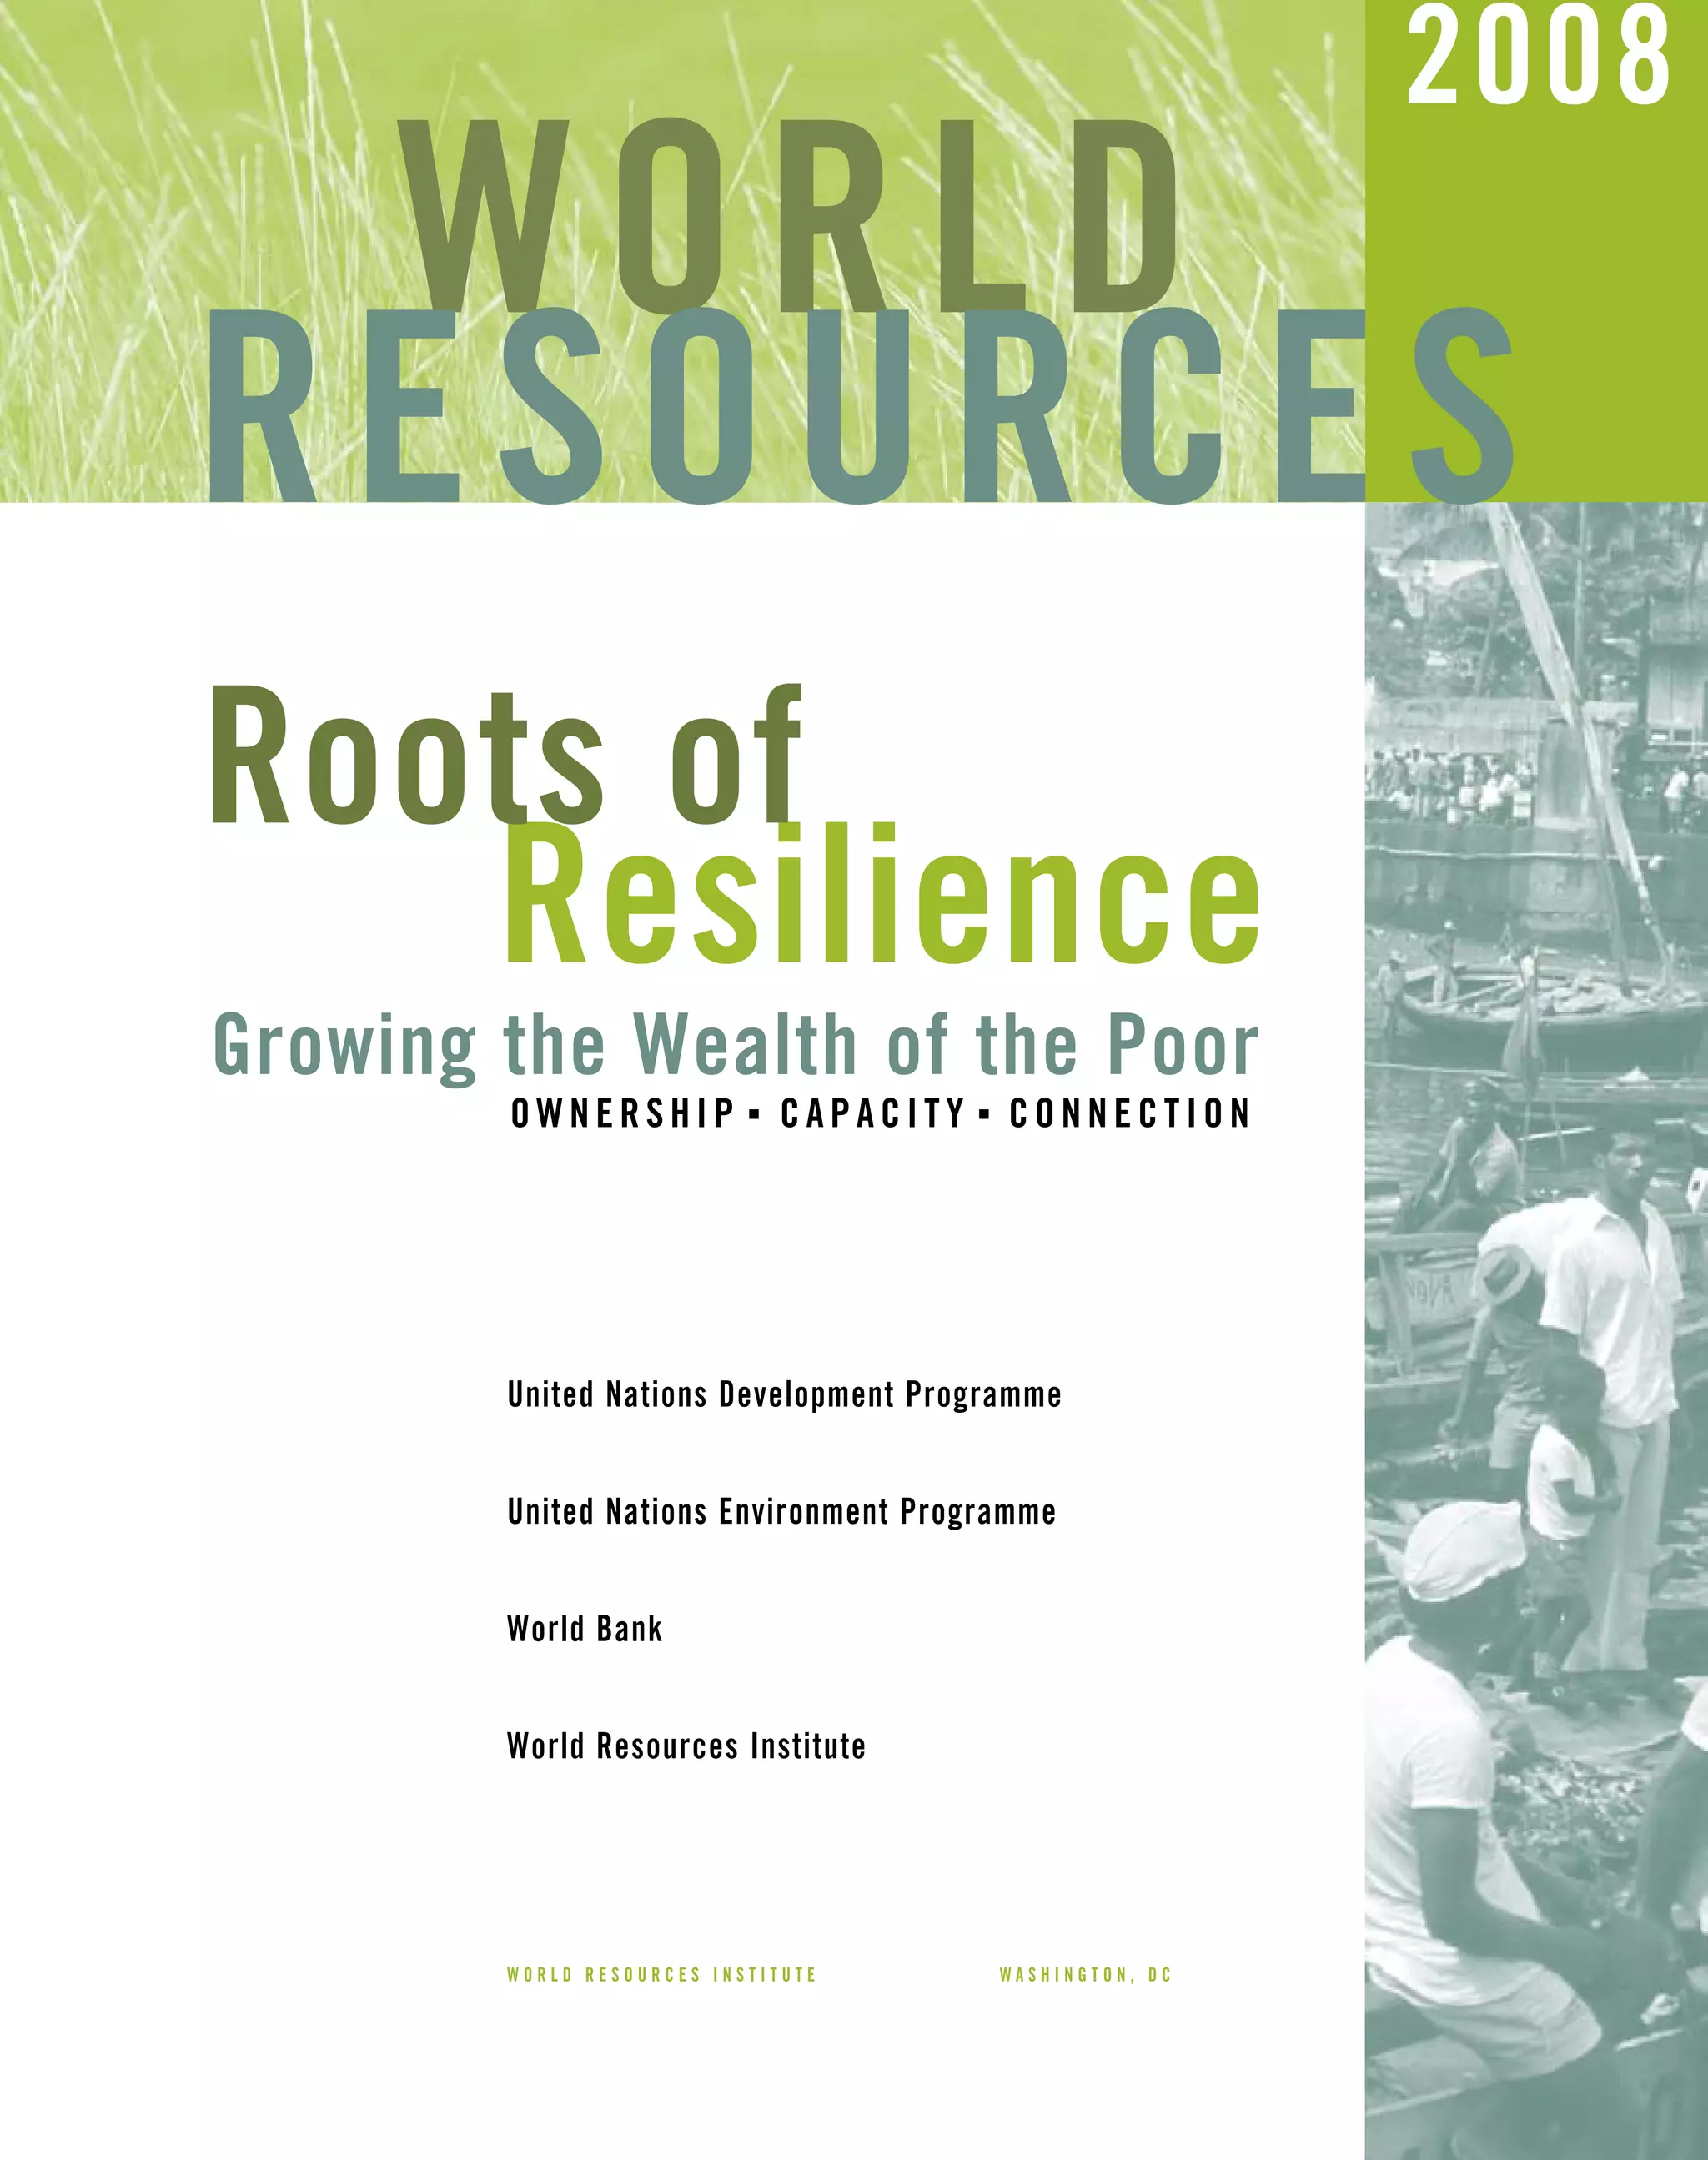
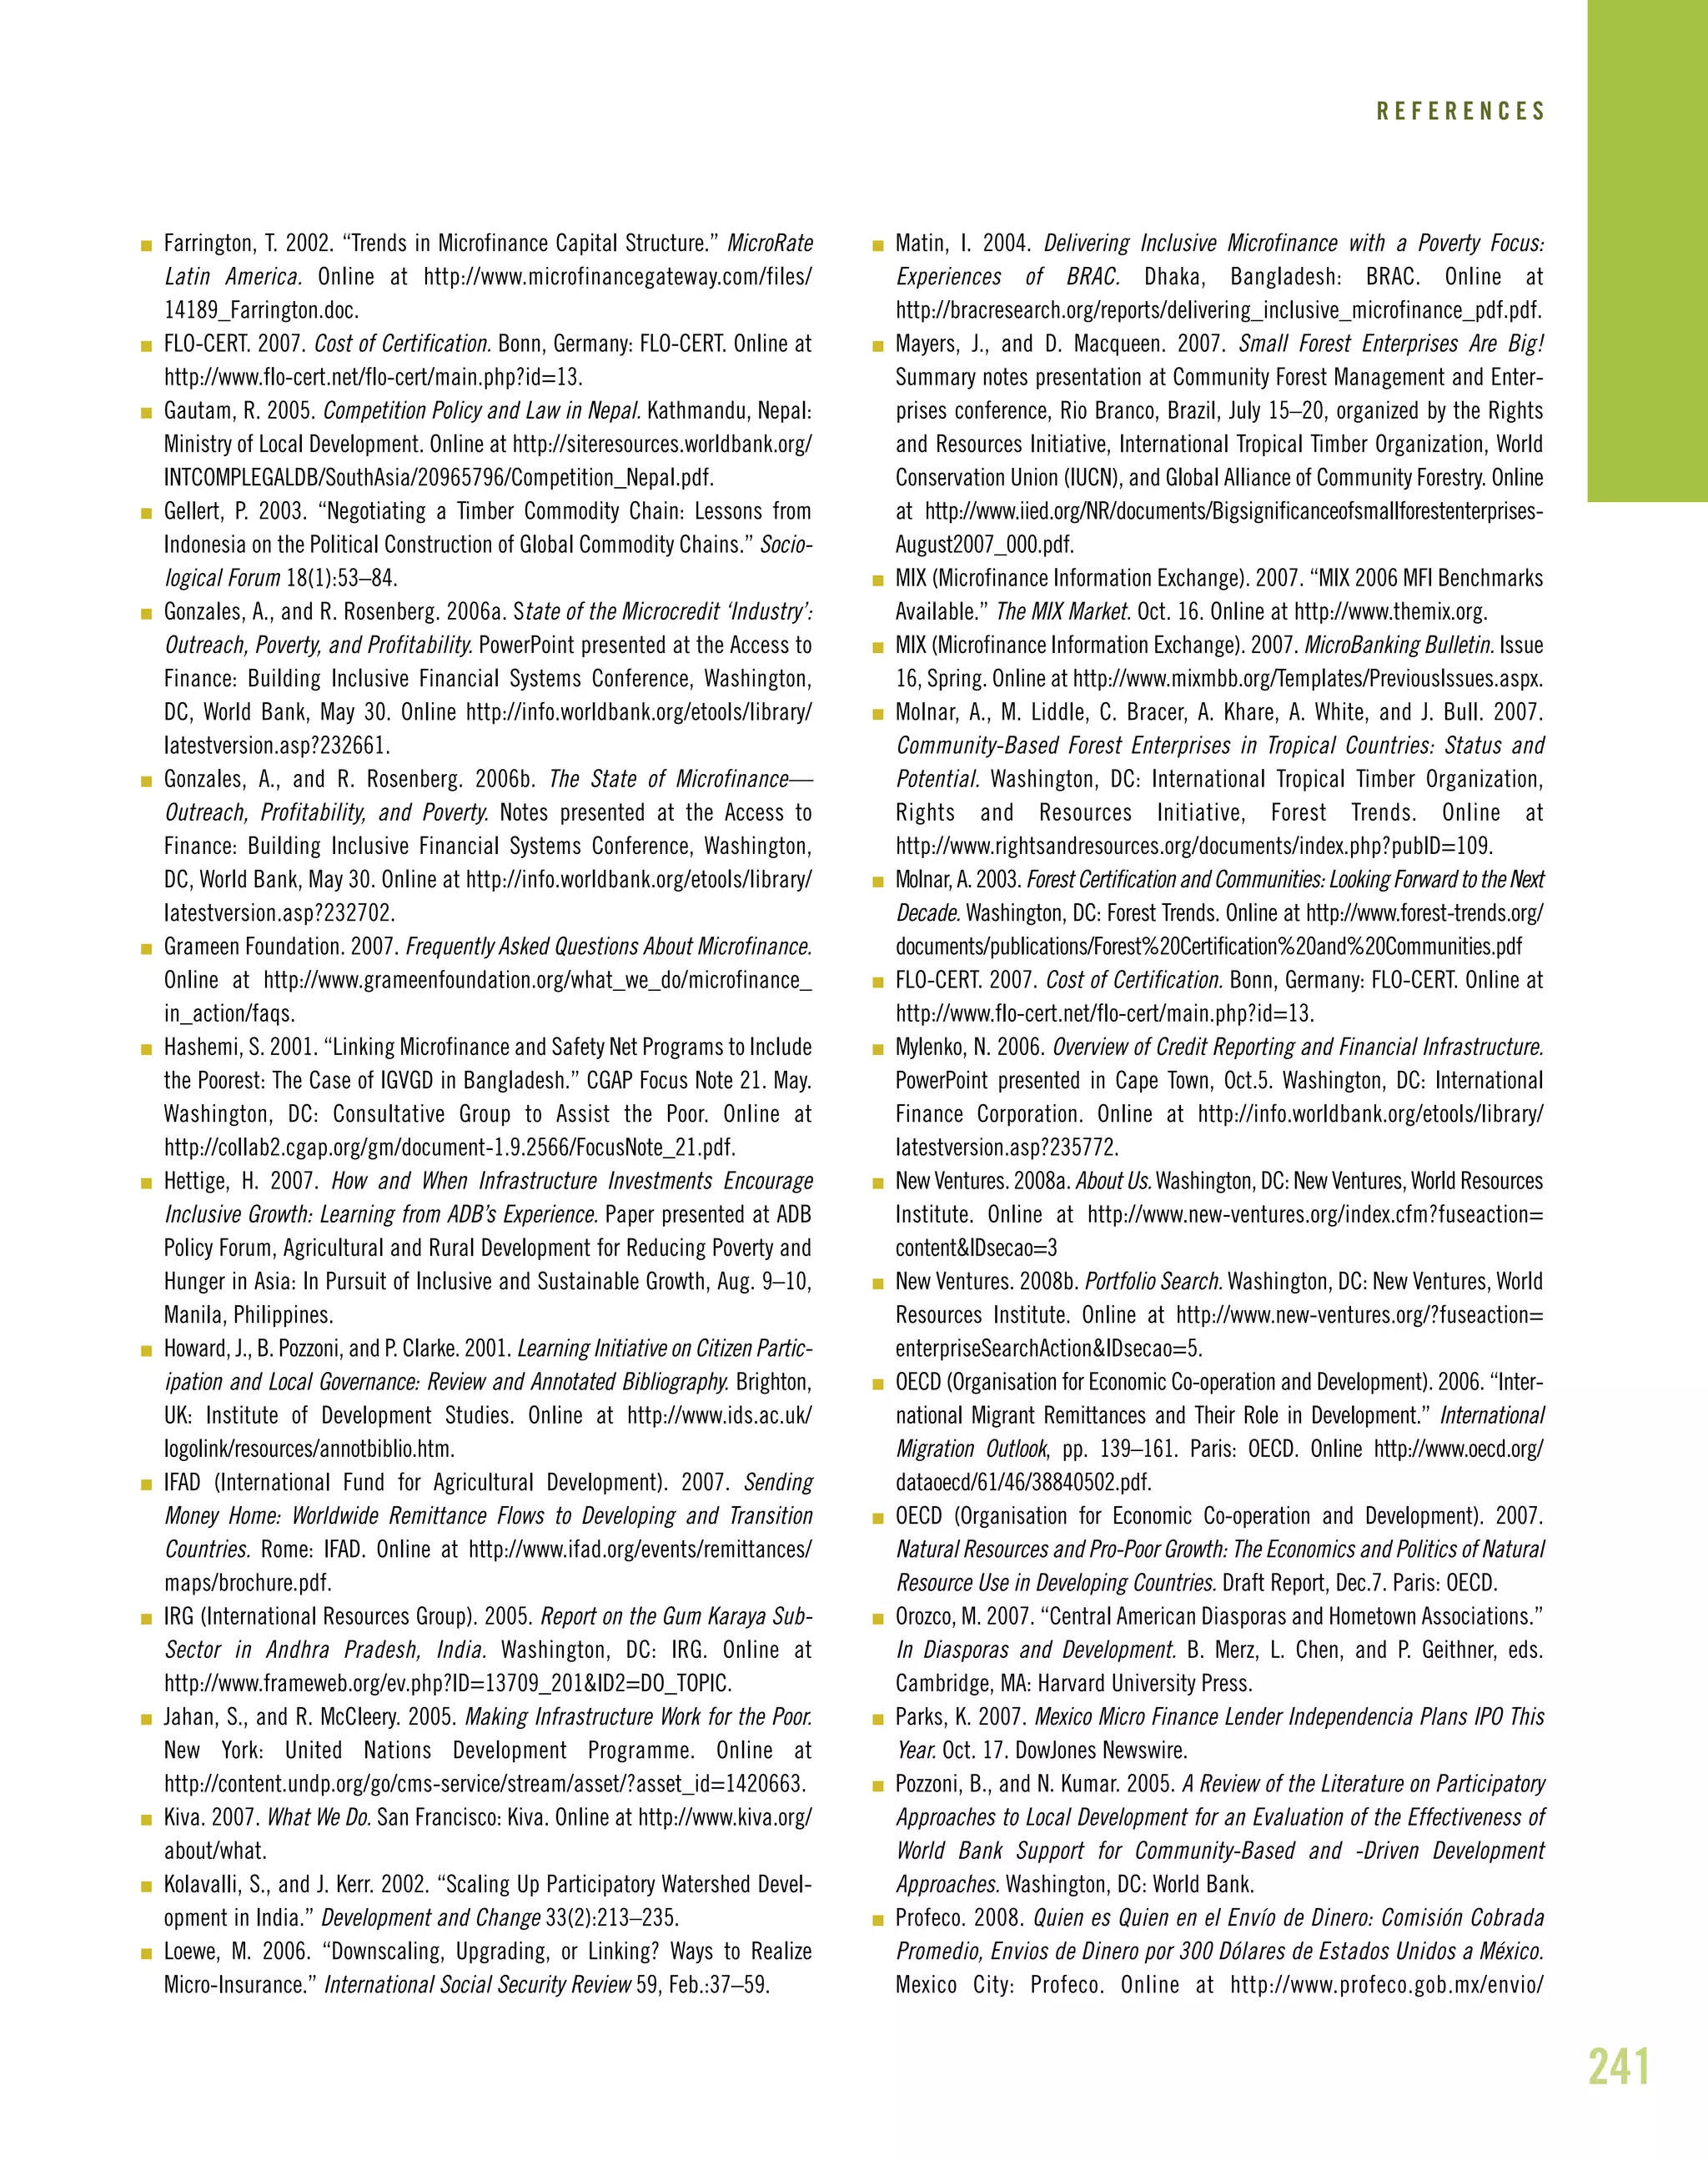
Chemonics and IRG 2000:A-V-2). Historically, NTFP collection
has been an individual venture, resulting in little awareness of
harvest sustainability and limited marketing power for the
producers (IRG 2006:1). A few years after the concessions were
awarded, however, NGOs began encouraging sustainable and
collective harvesting of these products as a supplement to timber
cutting (Pool et al. 2002:15). CONAP was subsequently charged
with regulating NTFPs’ harvesting and transport (IRG 2006:1-2;
Chemonics and IRG 2000:A-V-4).
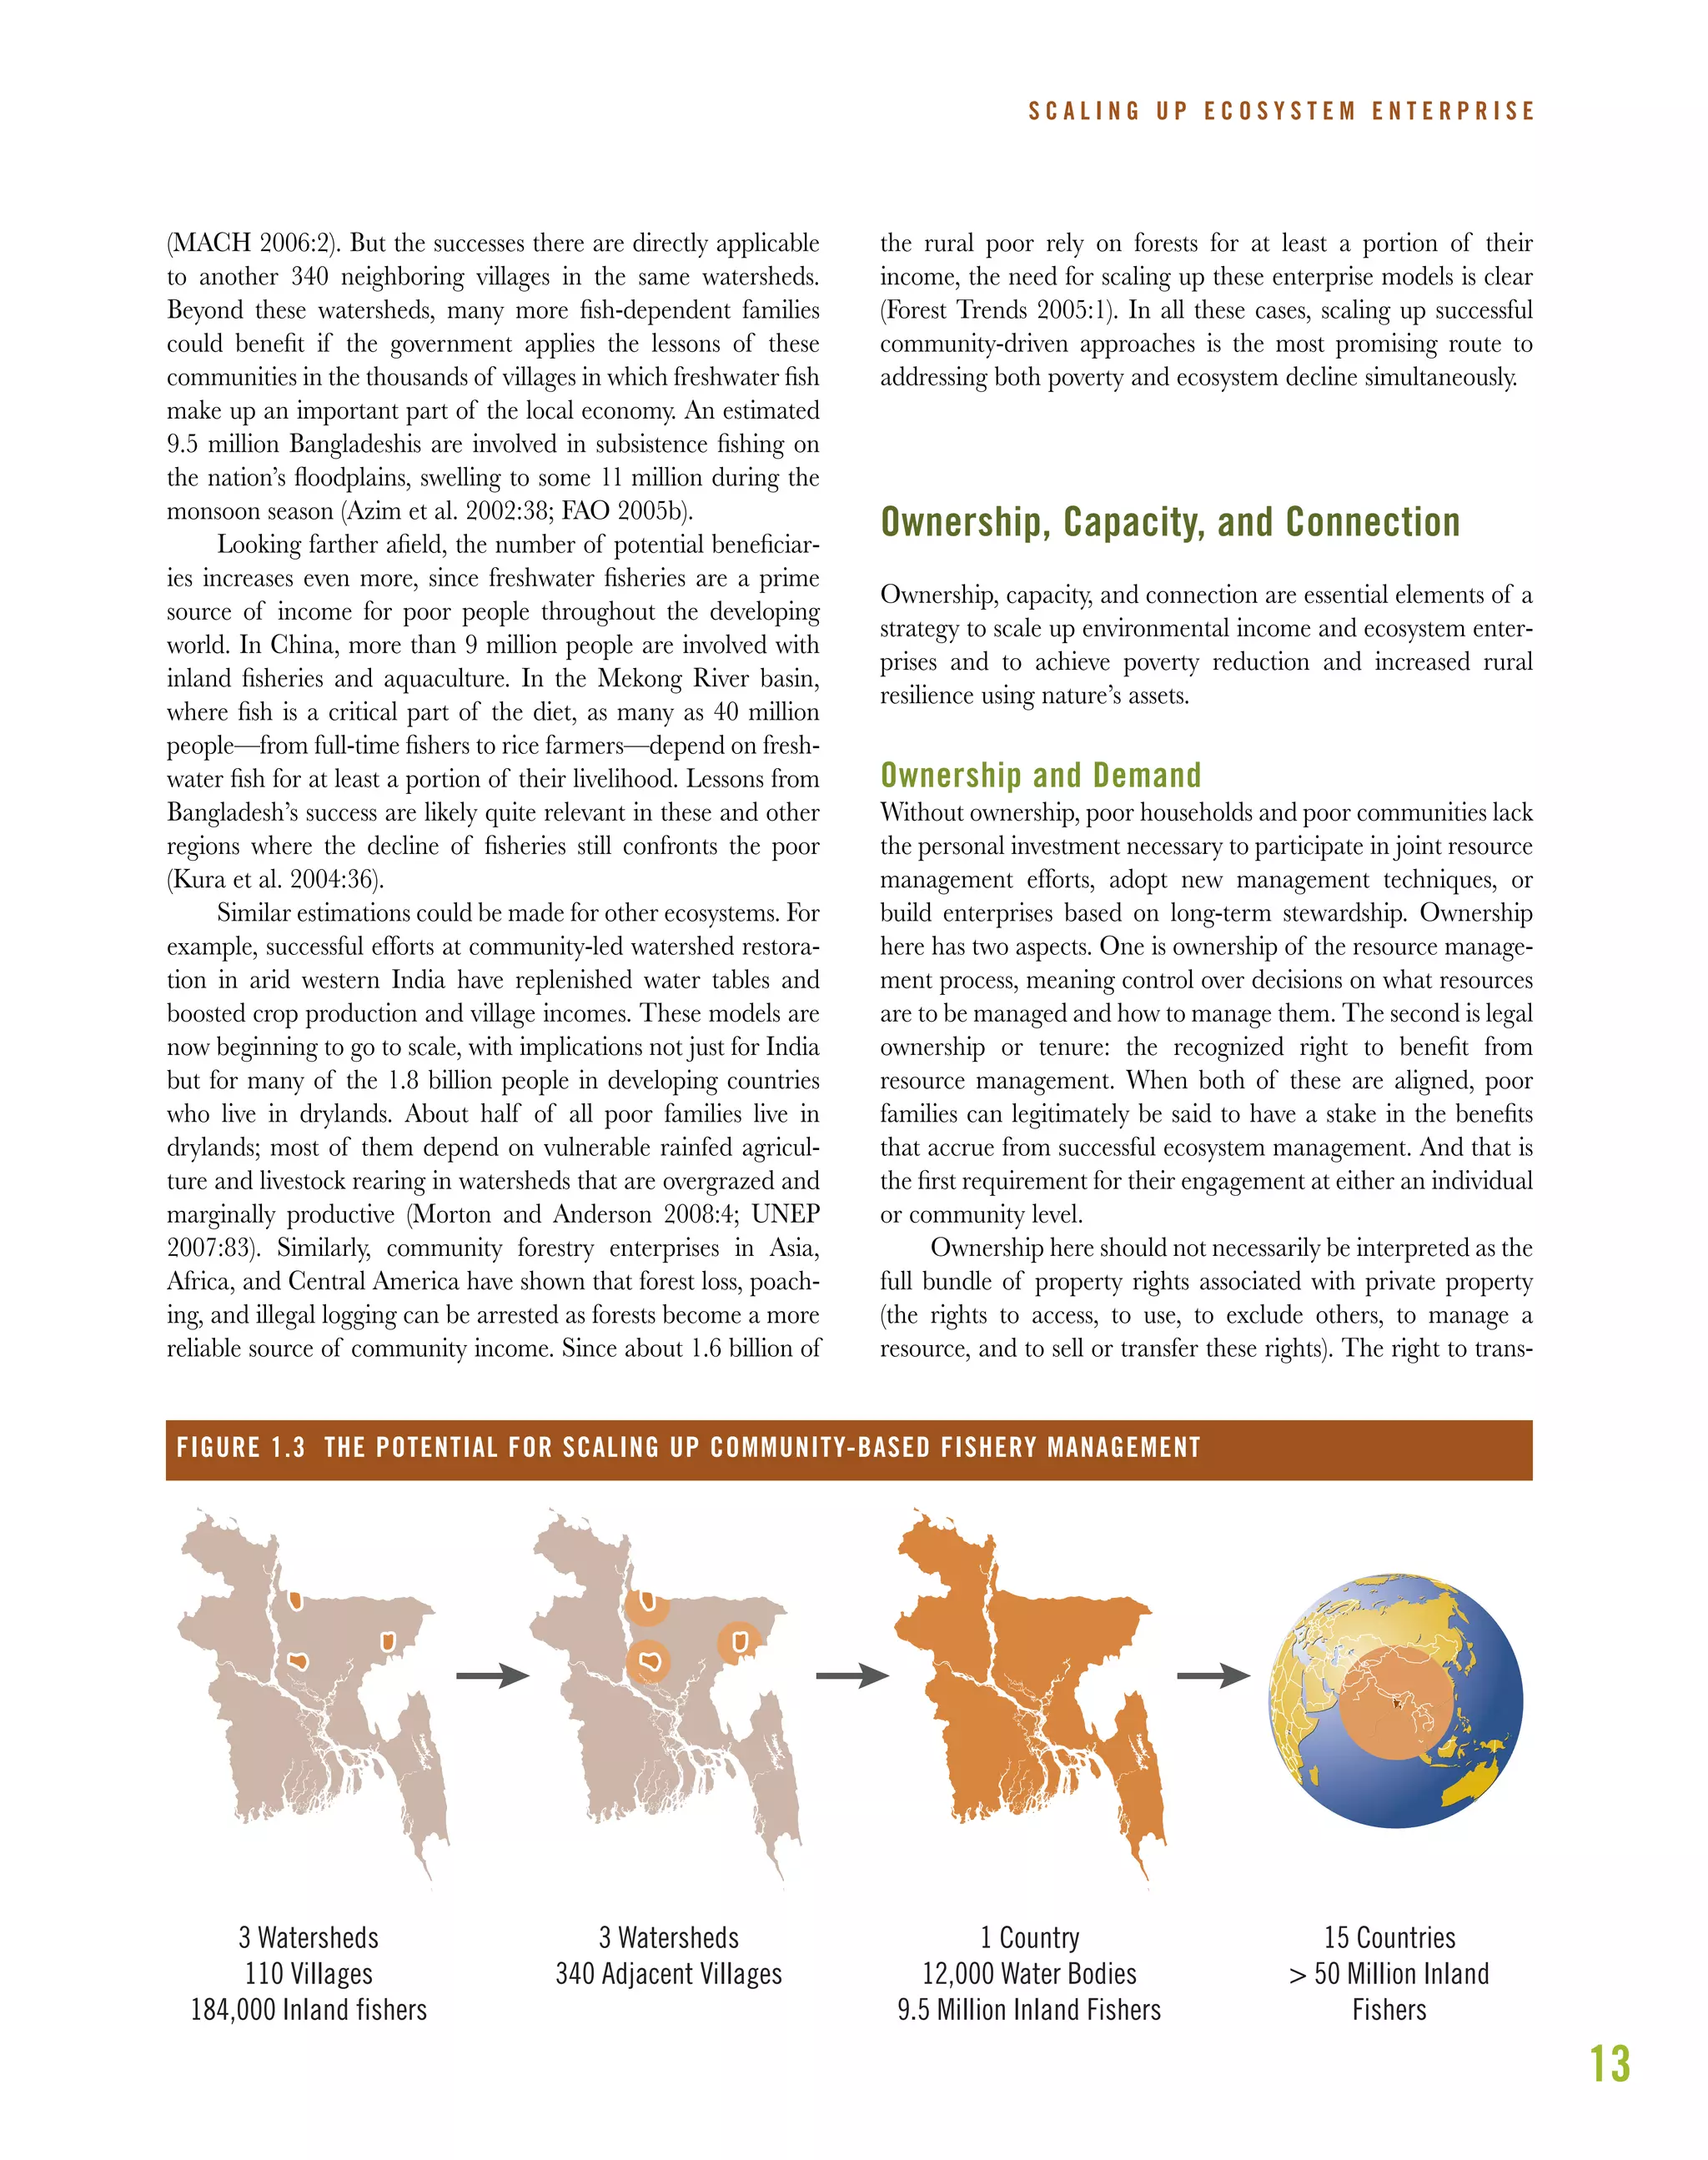
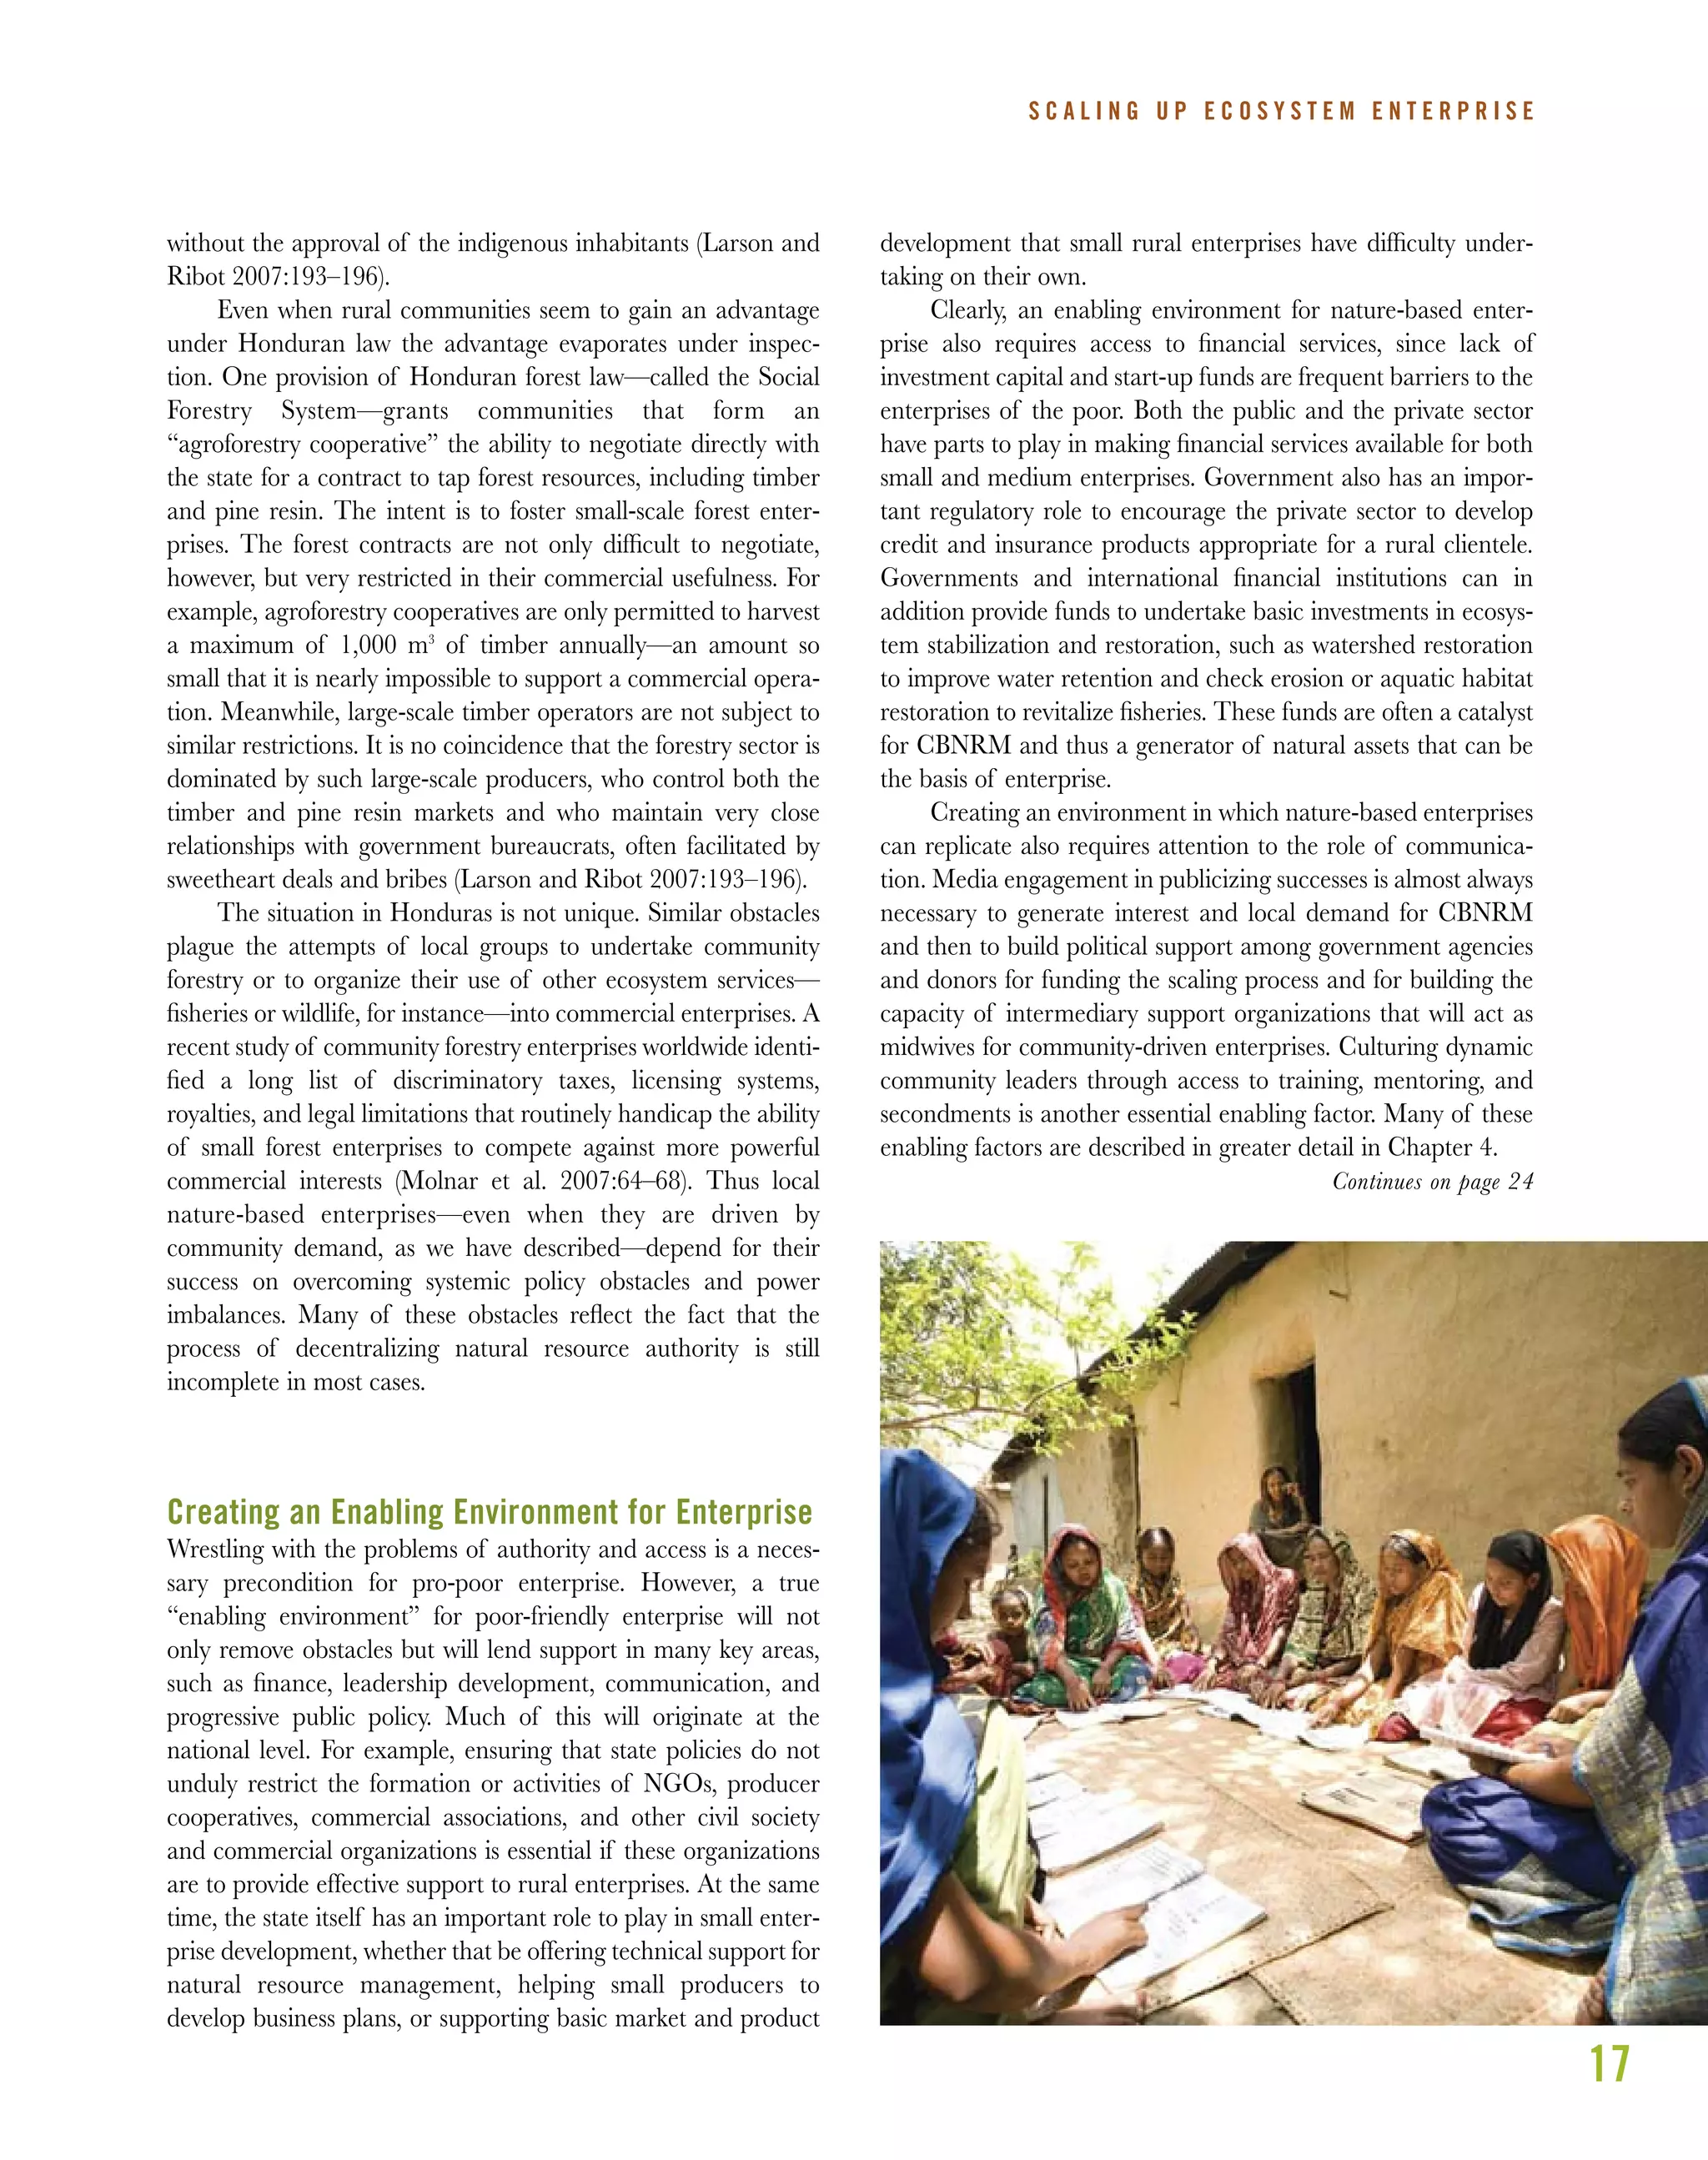
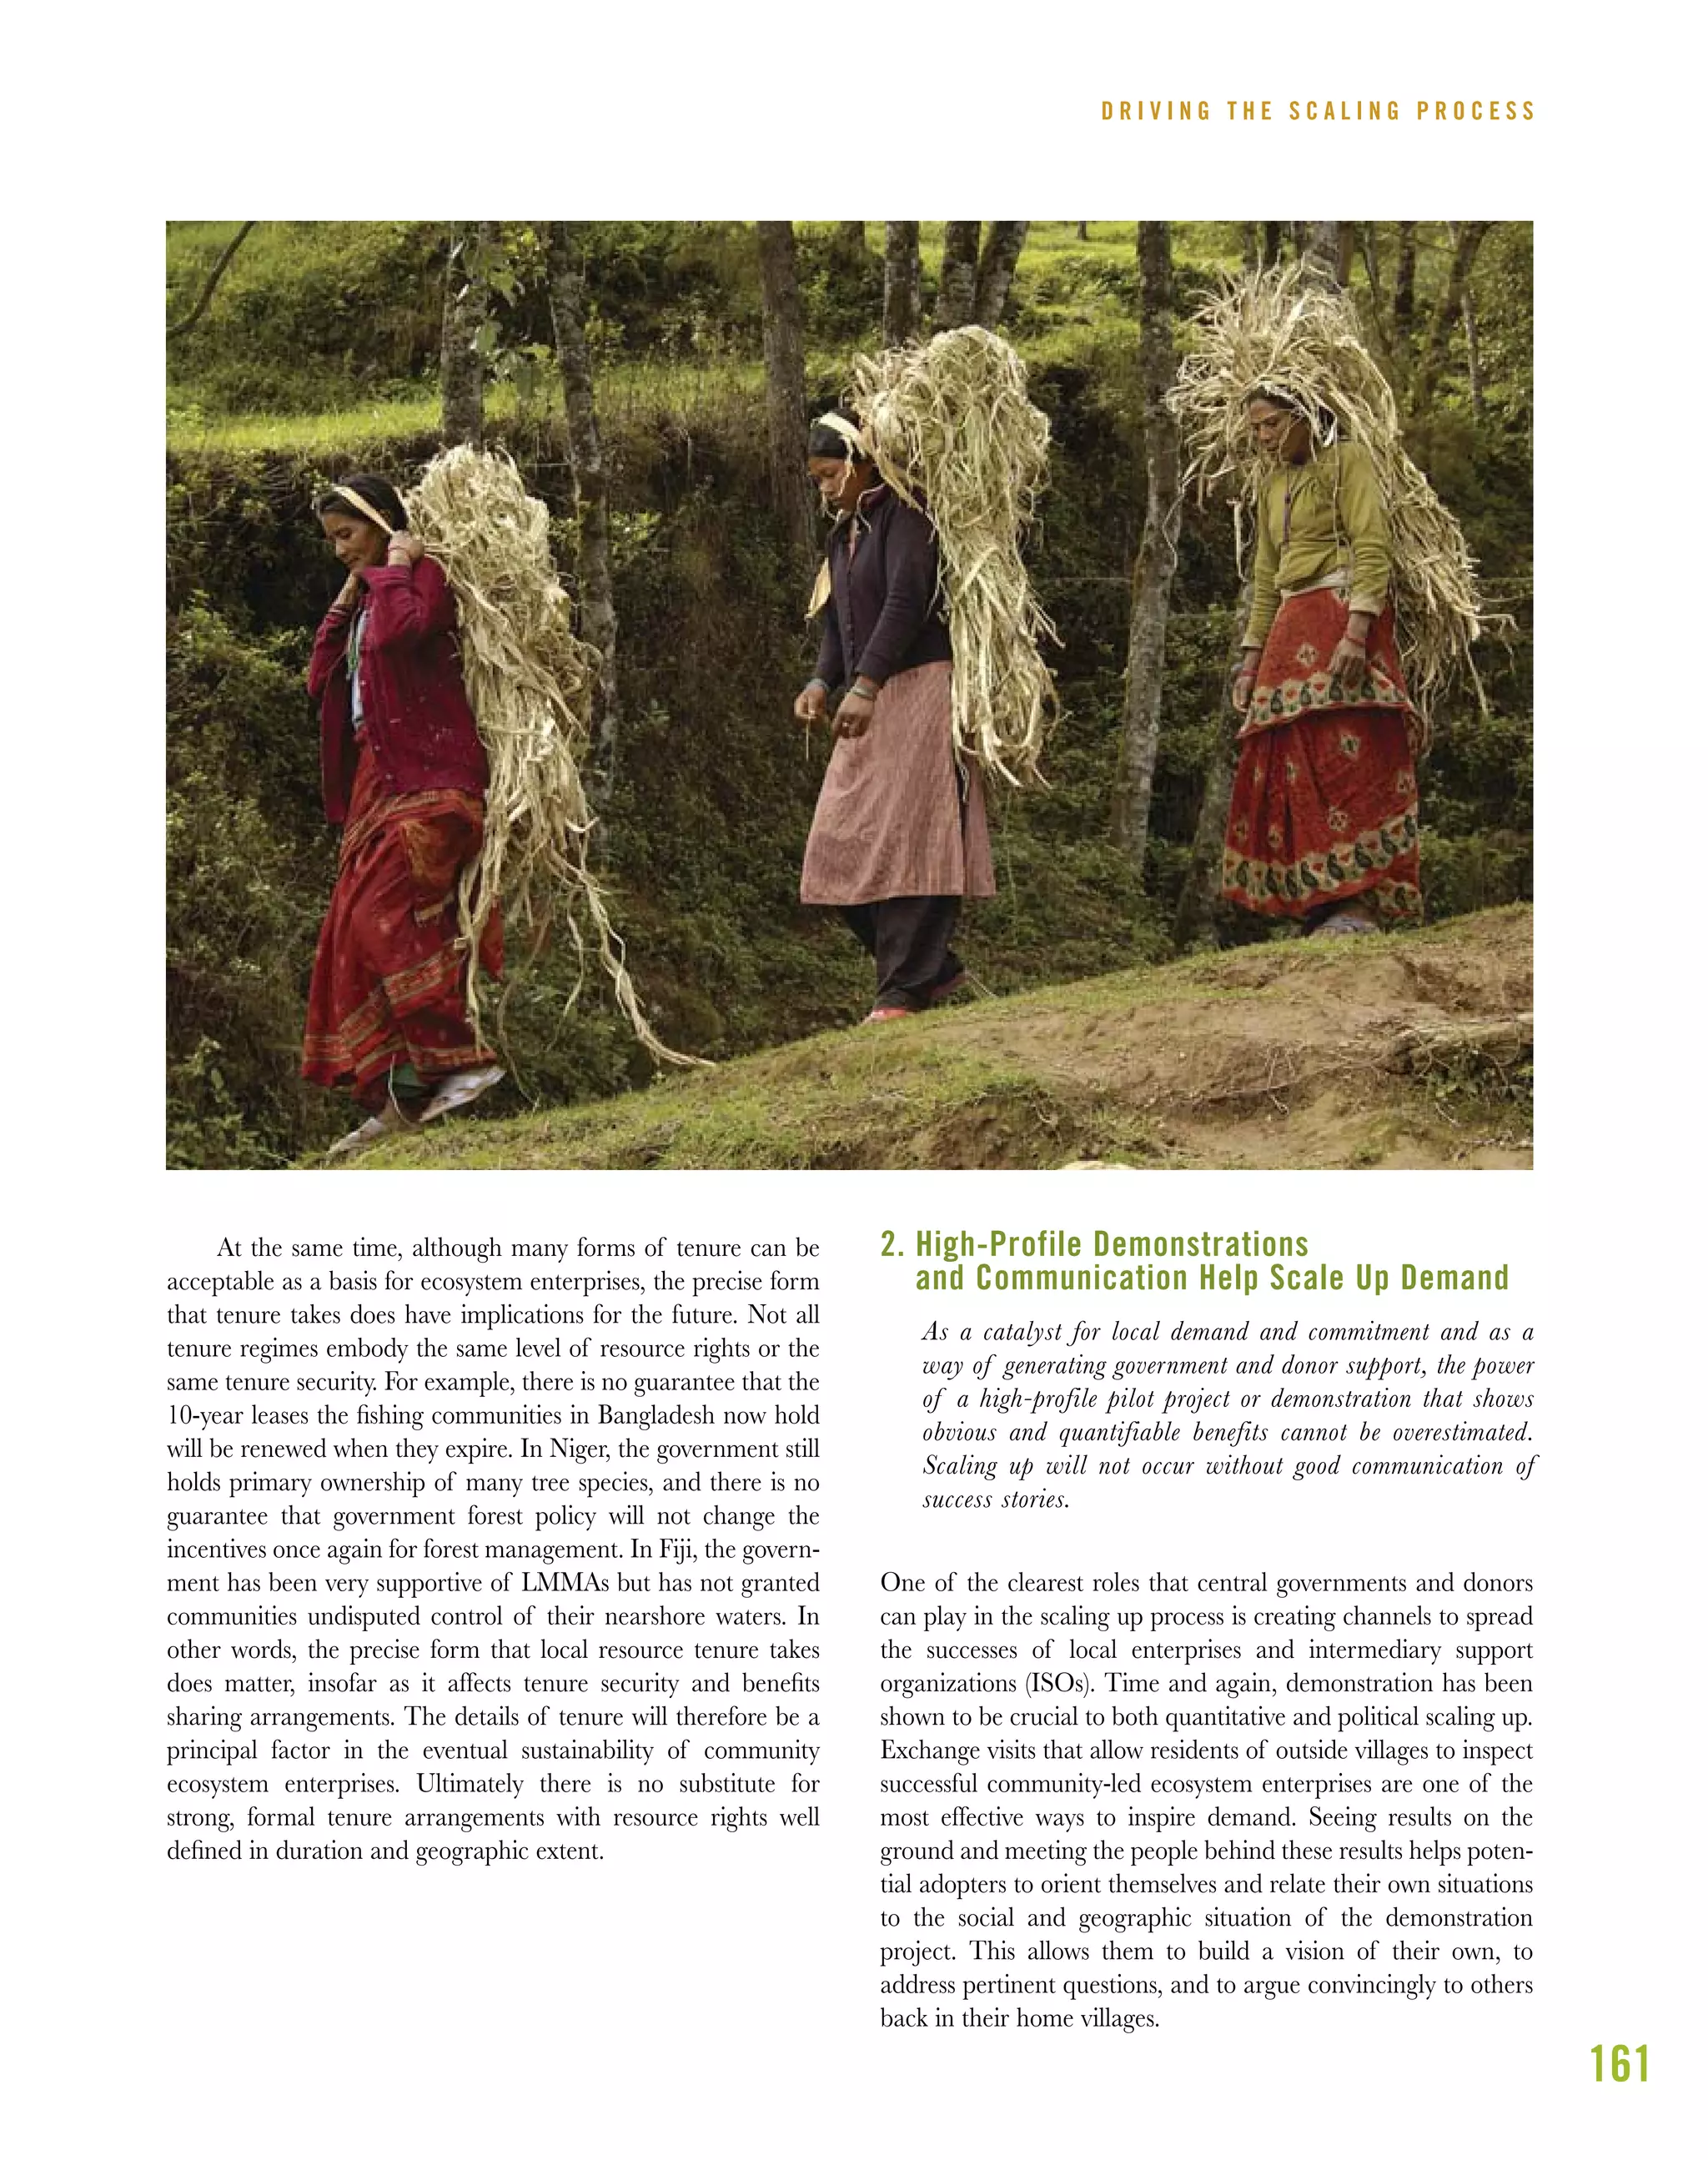
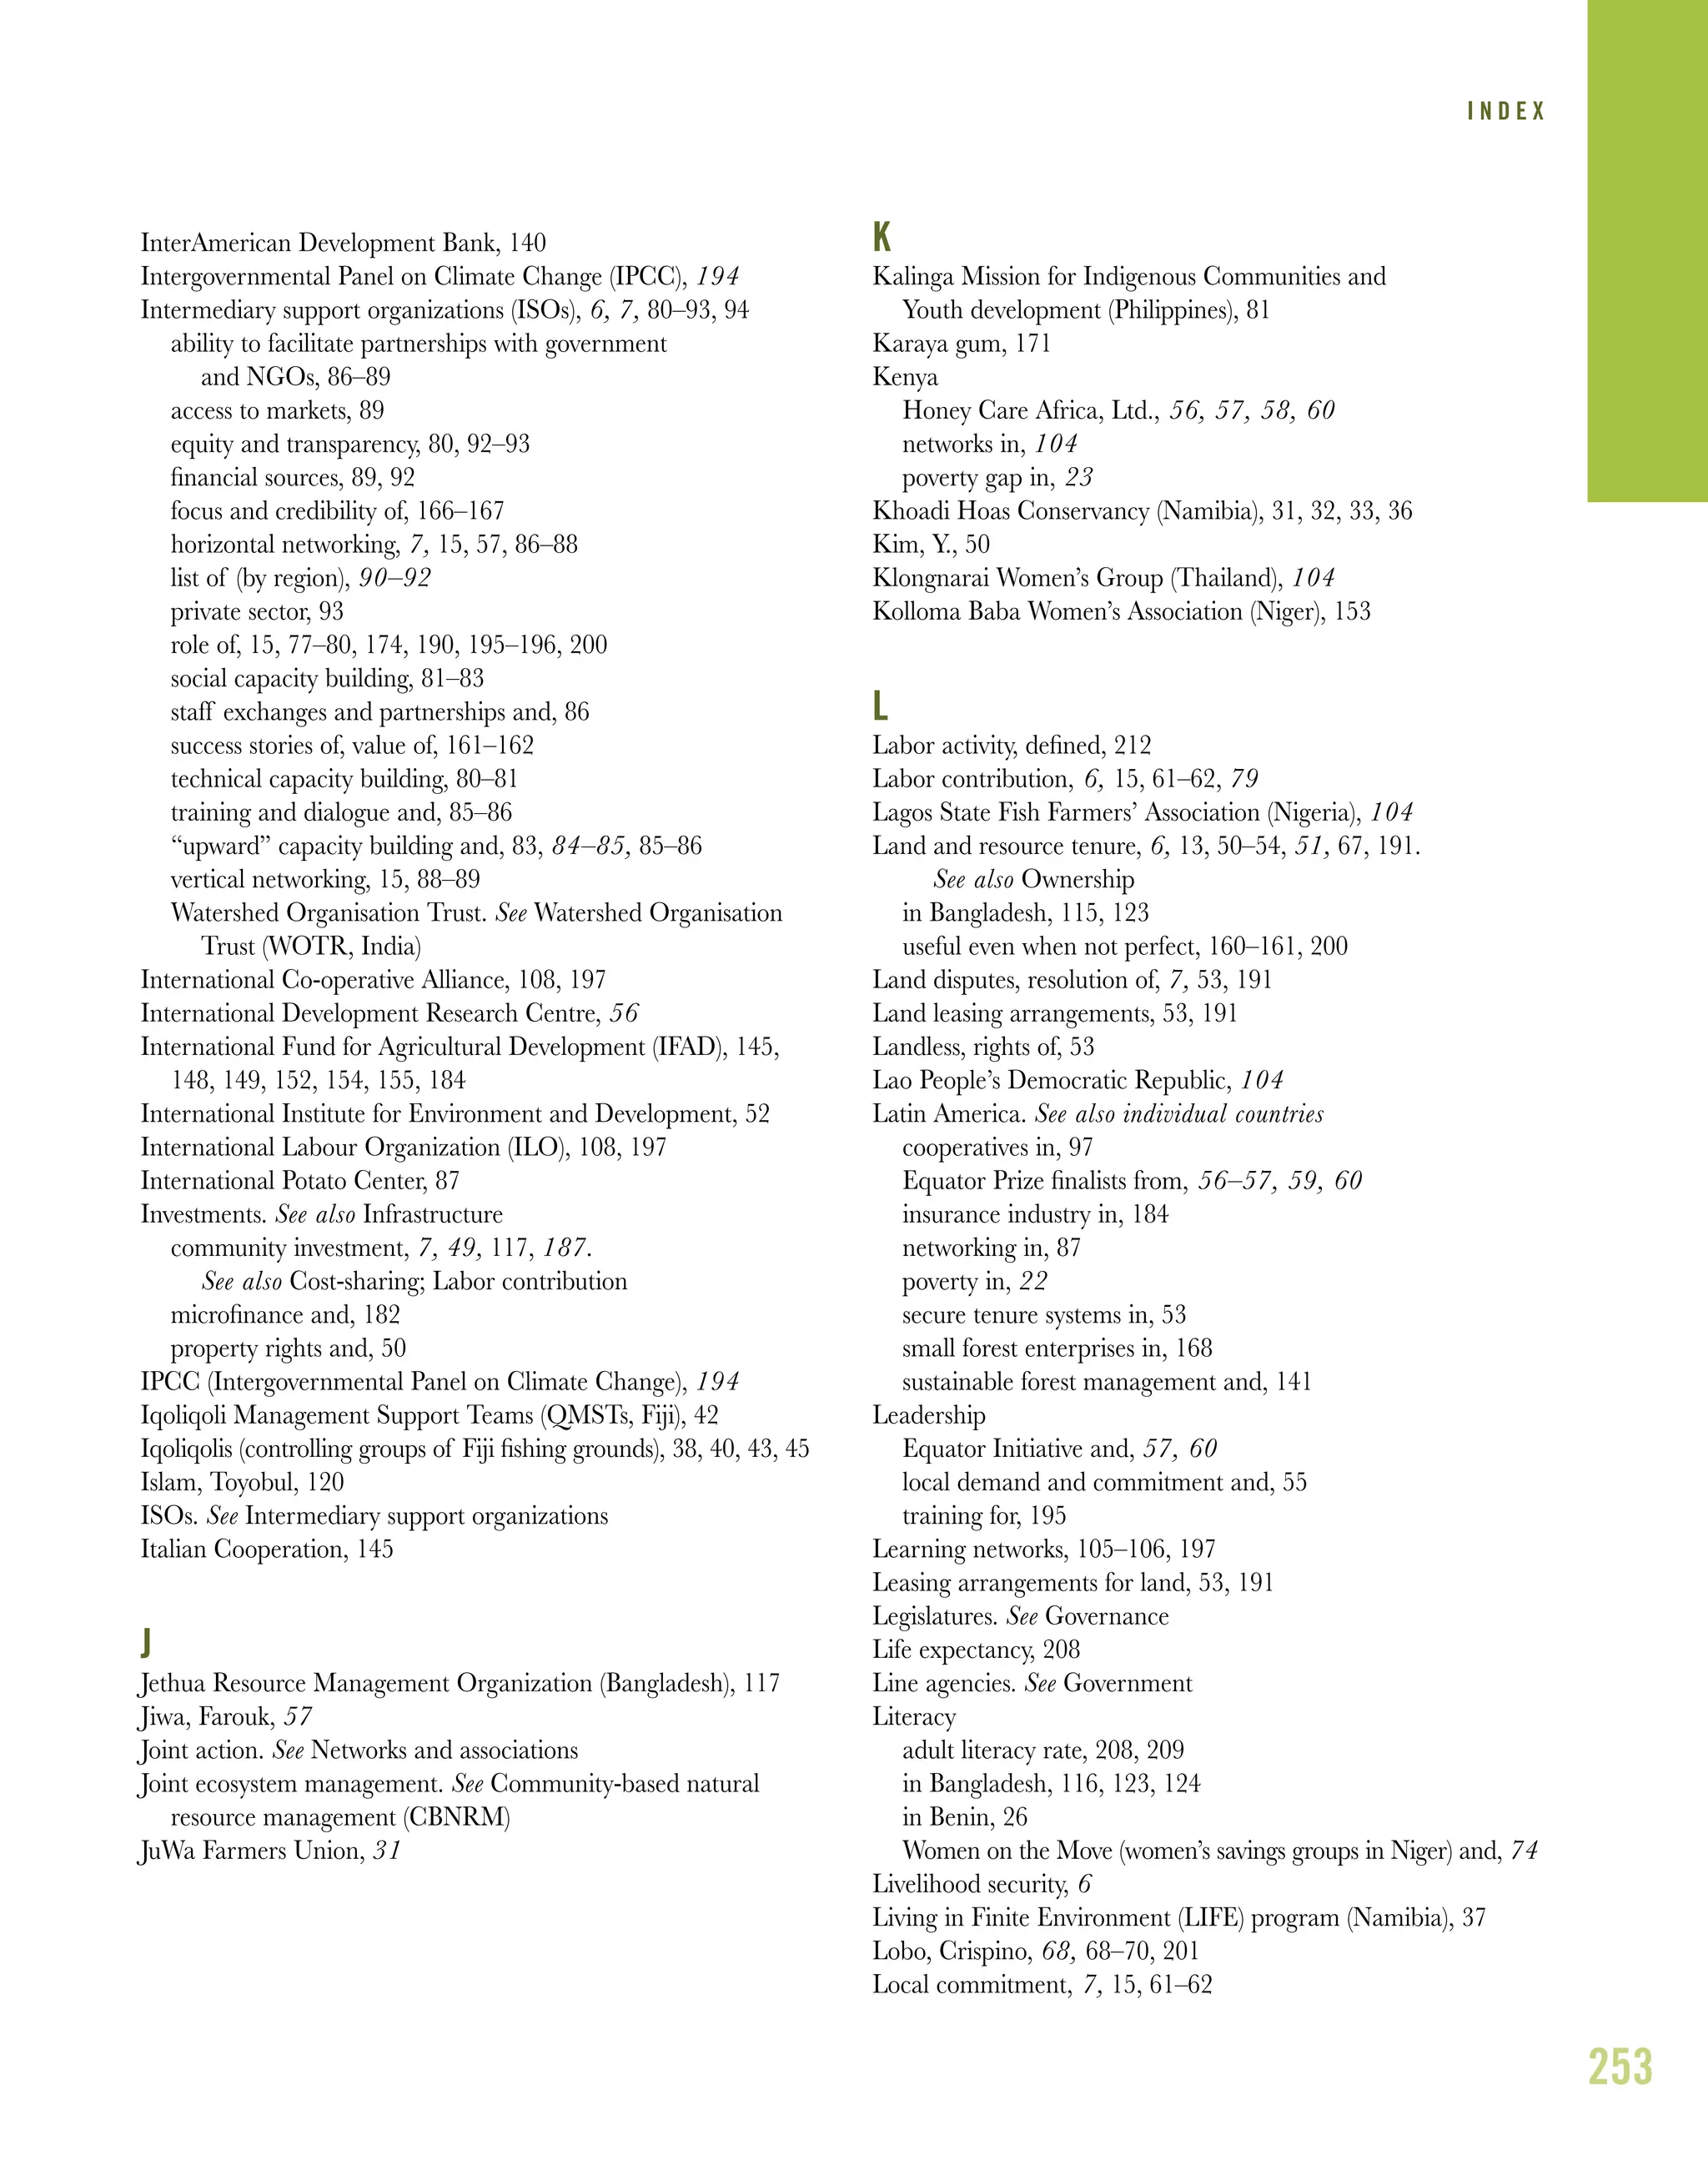
The new focus on NTFPs has paid off for the concession
communities. With the assistance of the Rainforest Alliance, more
enterprises have improved the management and professional
harvesting of wild plants and are exploiting their commercial
potential. They are dealing directly with overseas buyers, cutting
out the export middlemen, boosting profits, and building relation-
ships with customers (Rainforest Alliance 2007c:2).
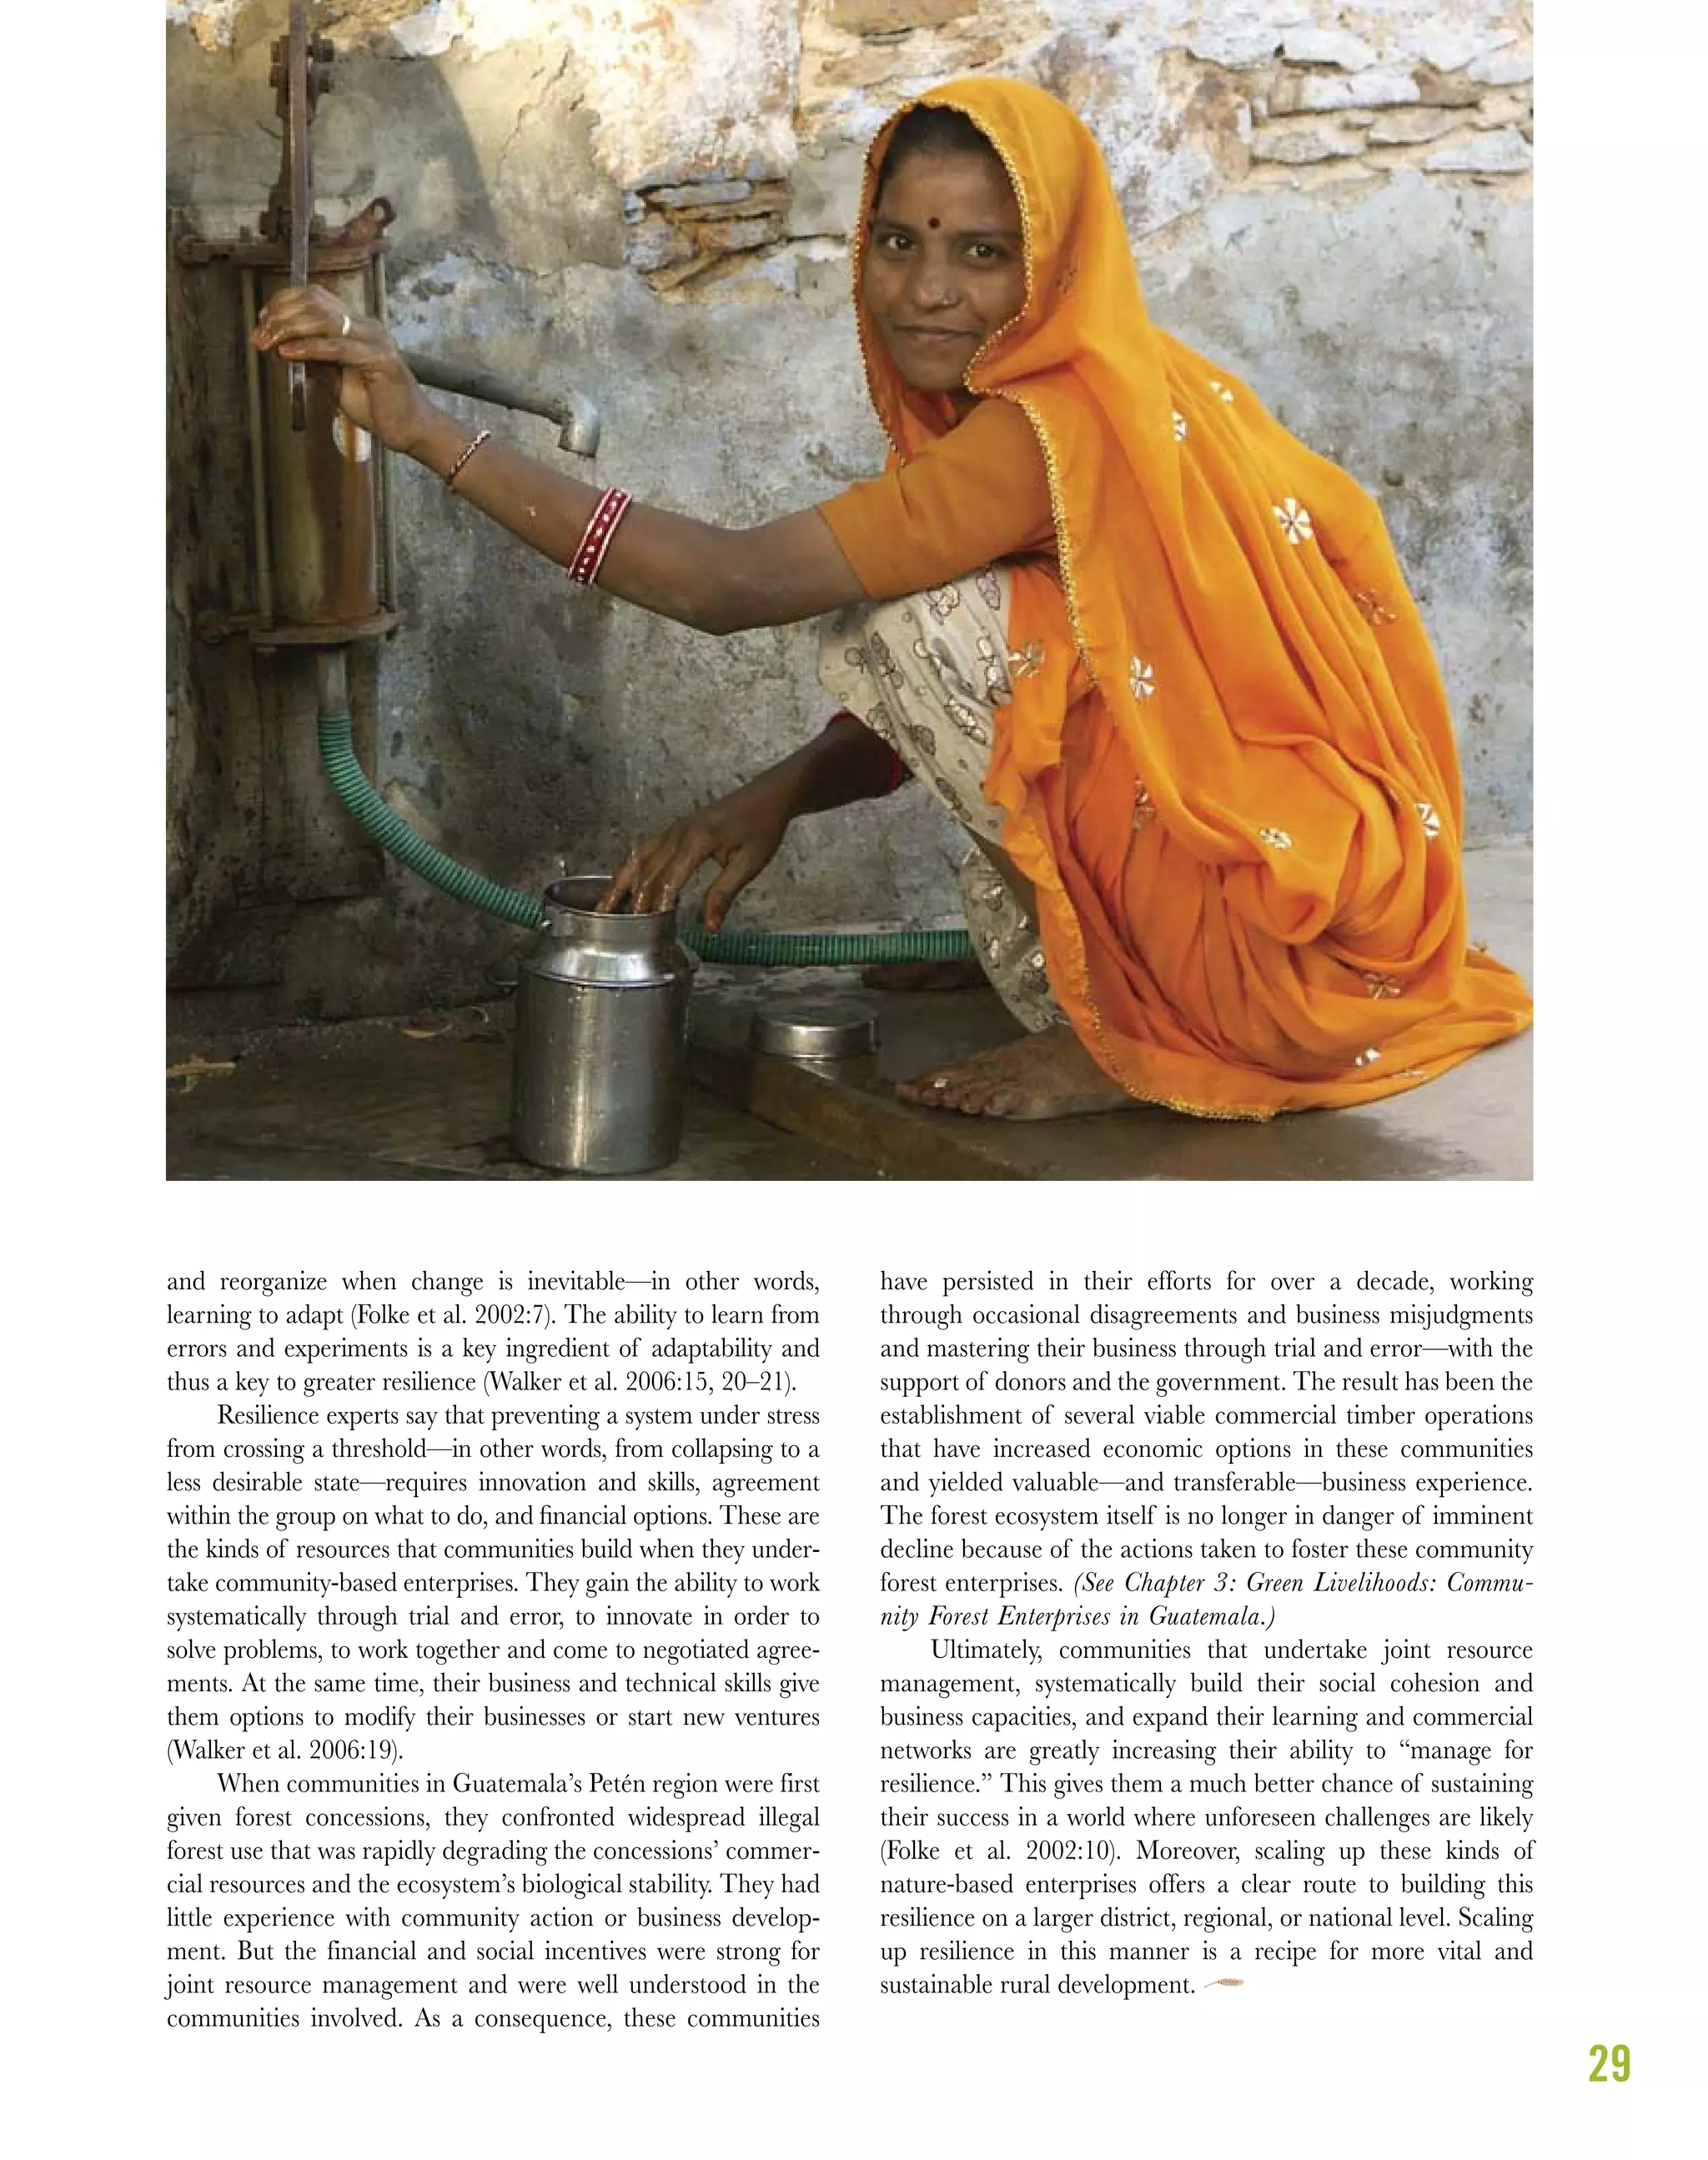
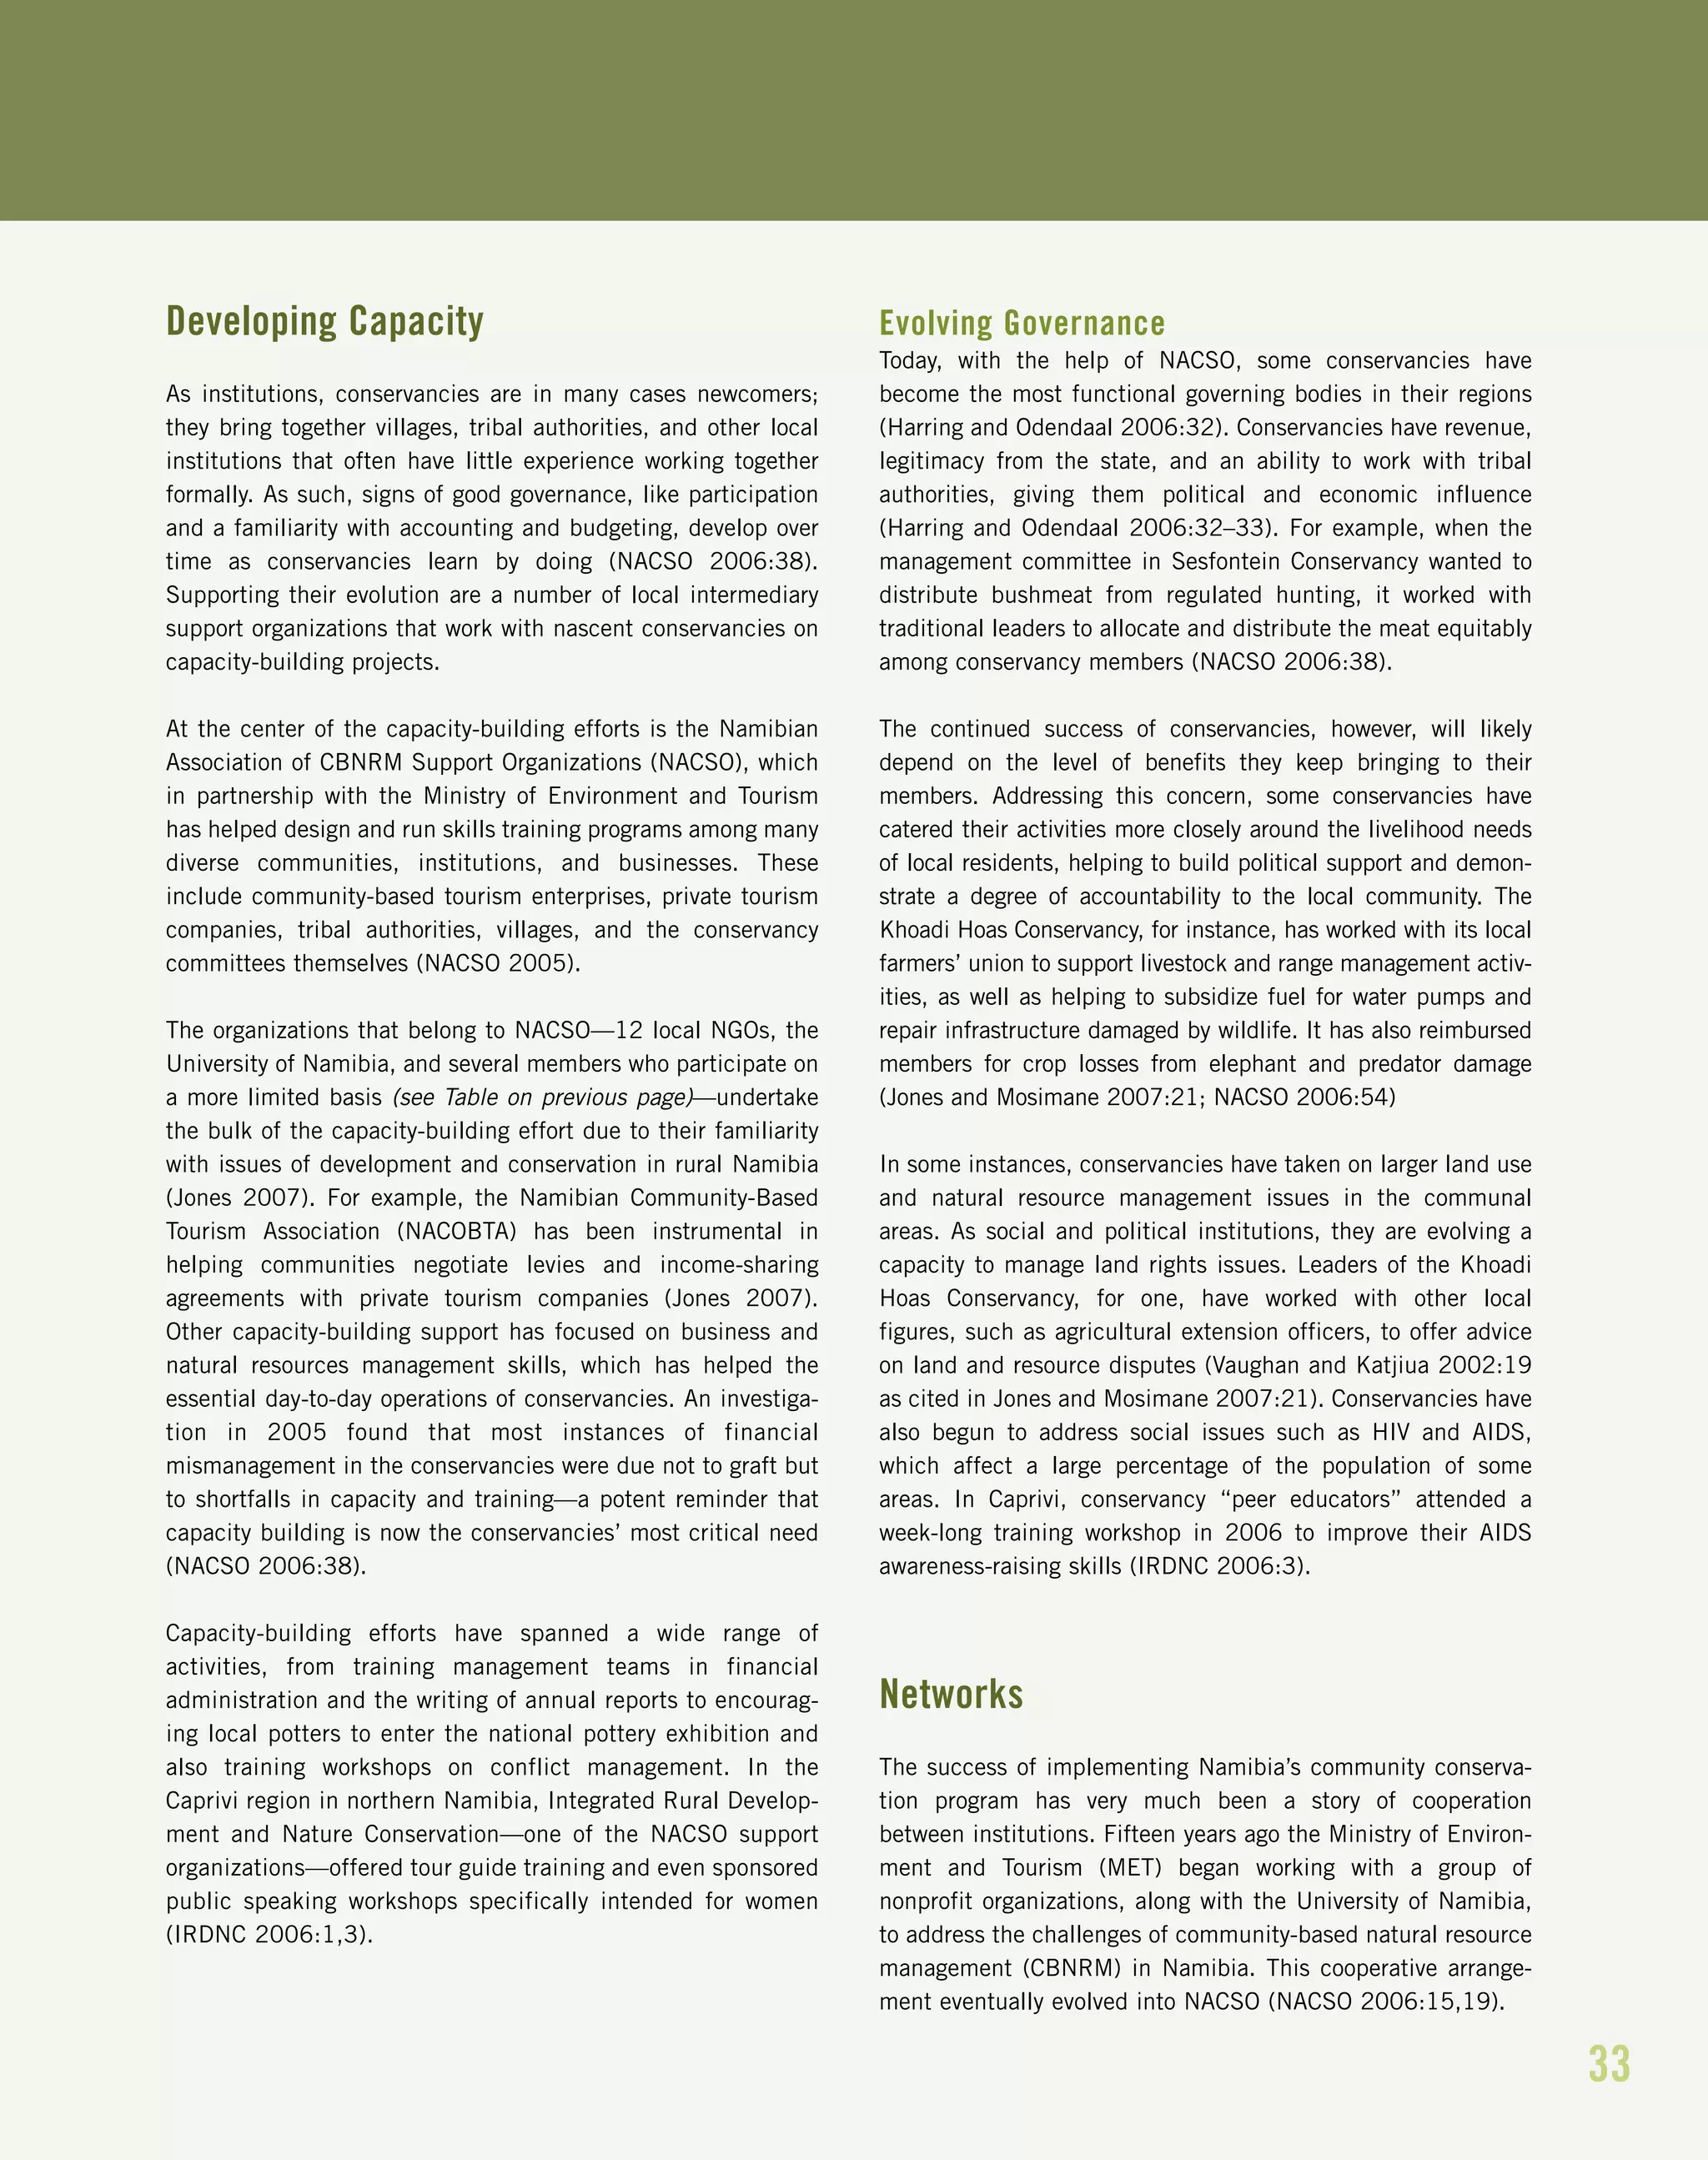
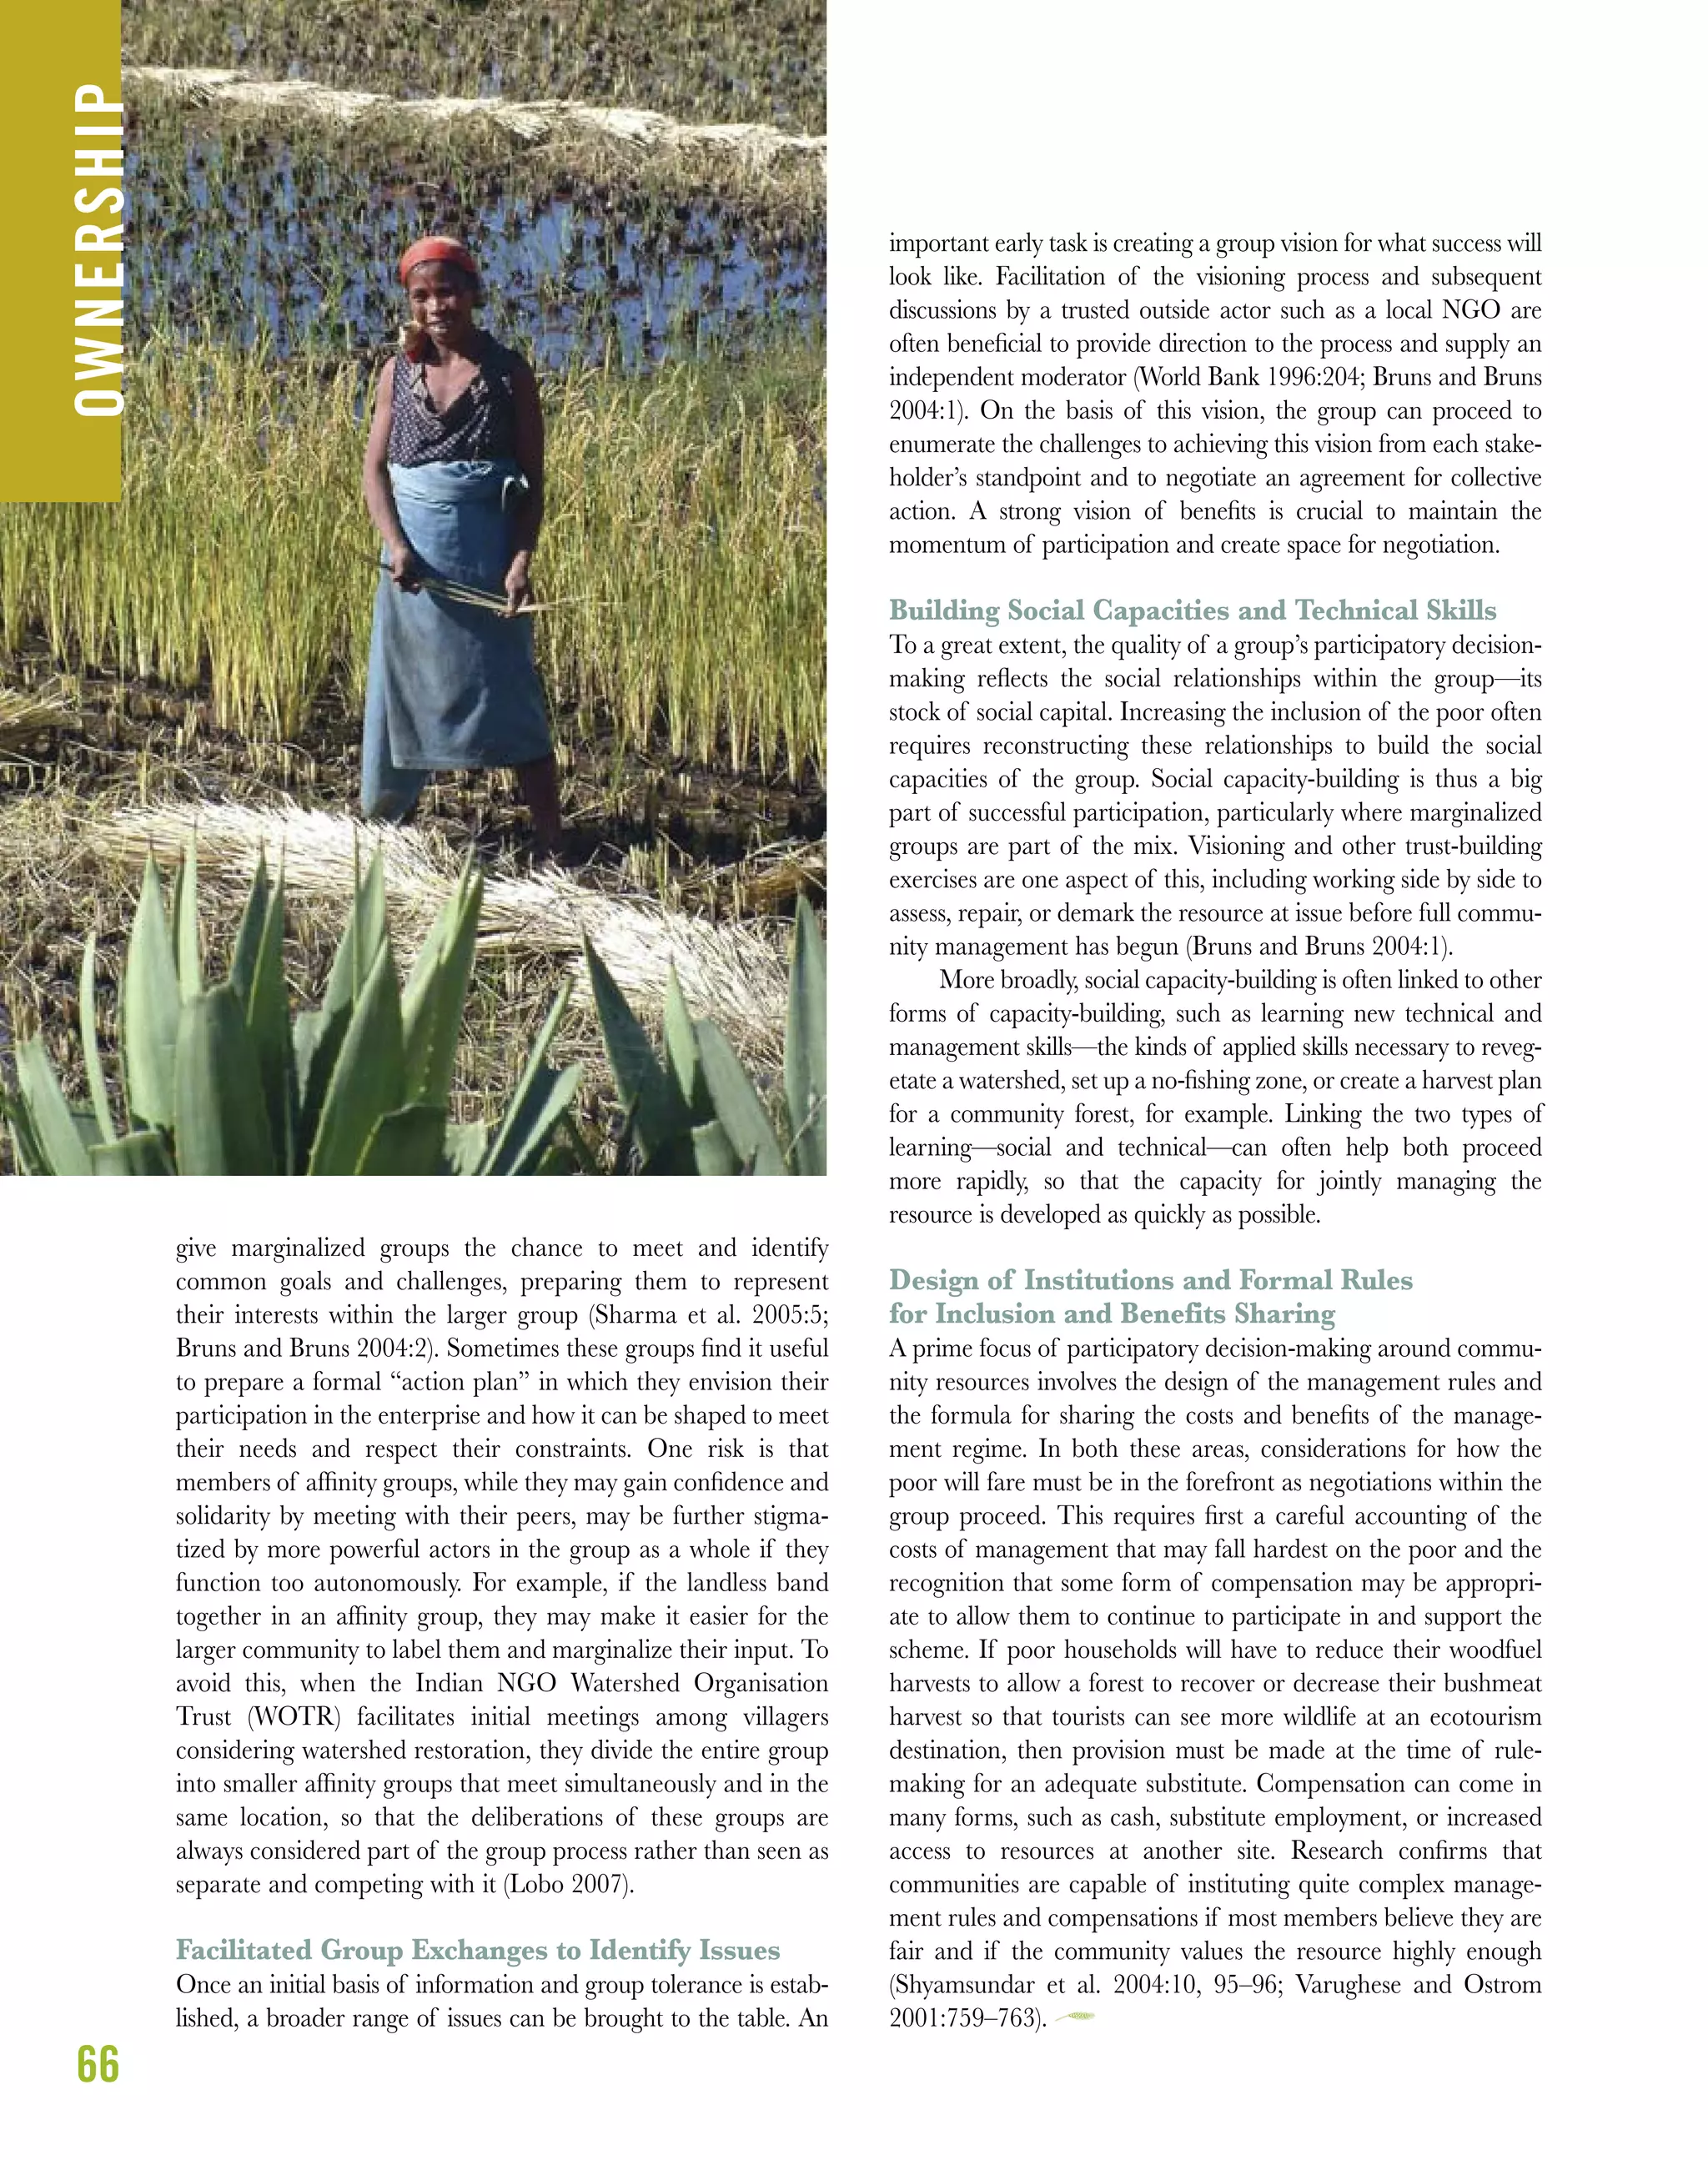
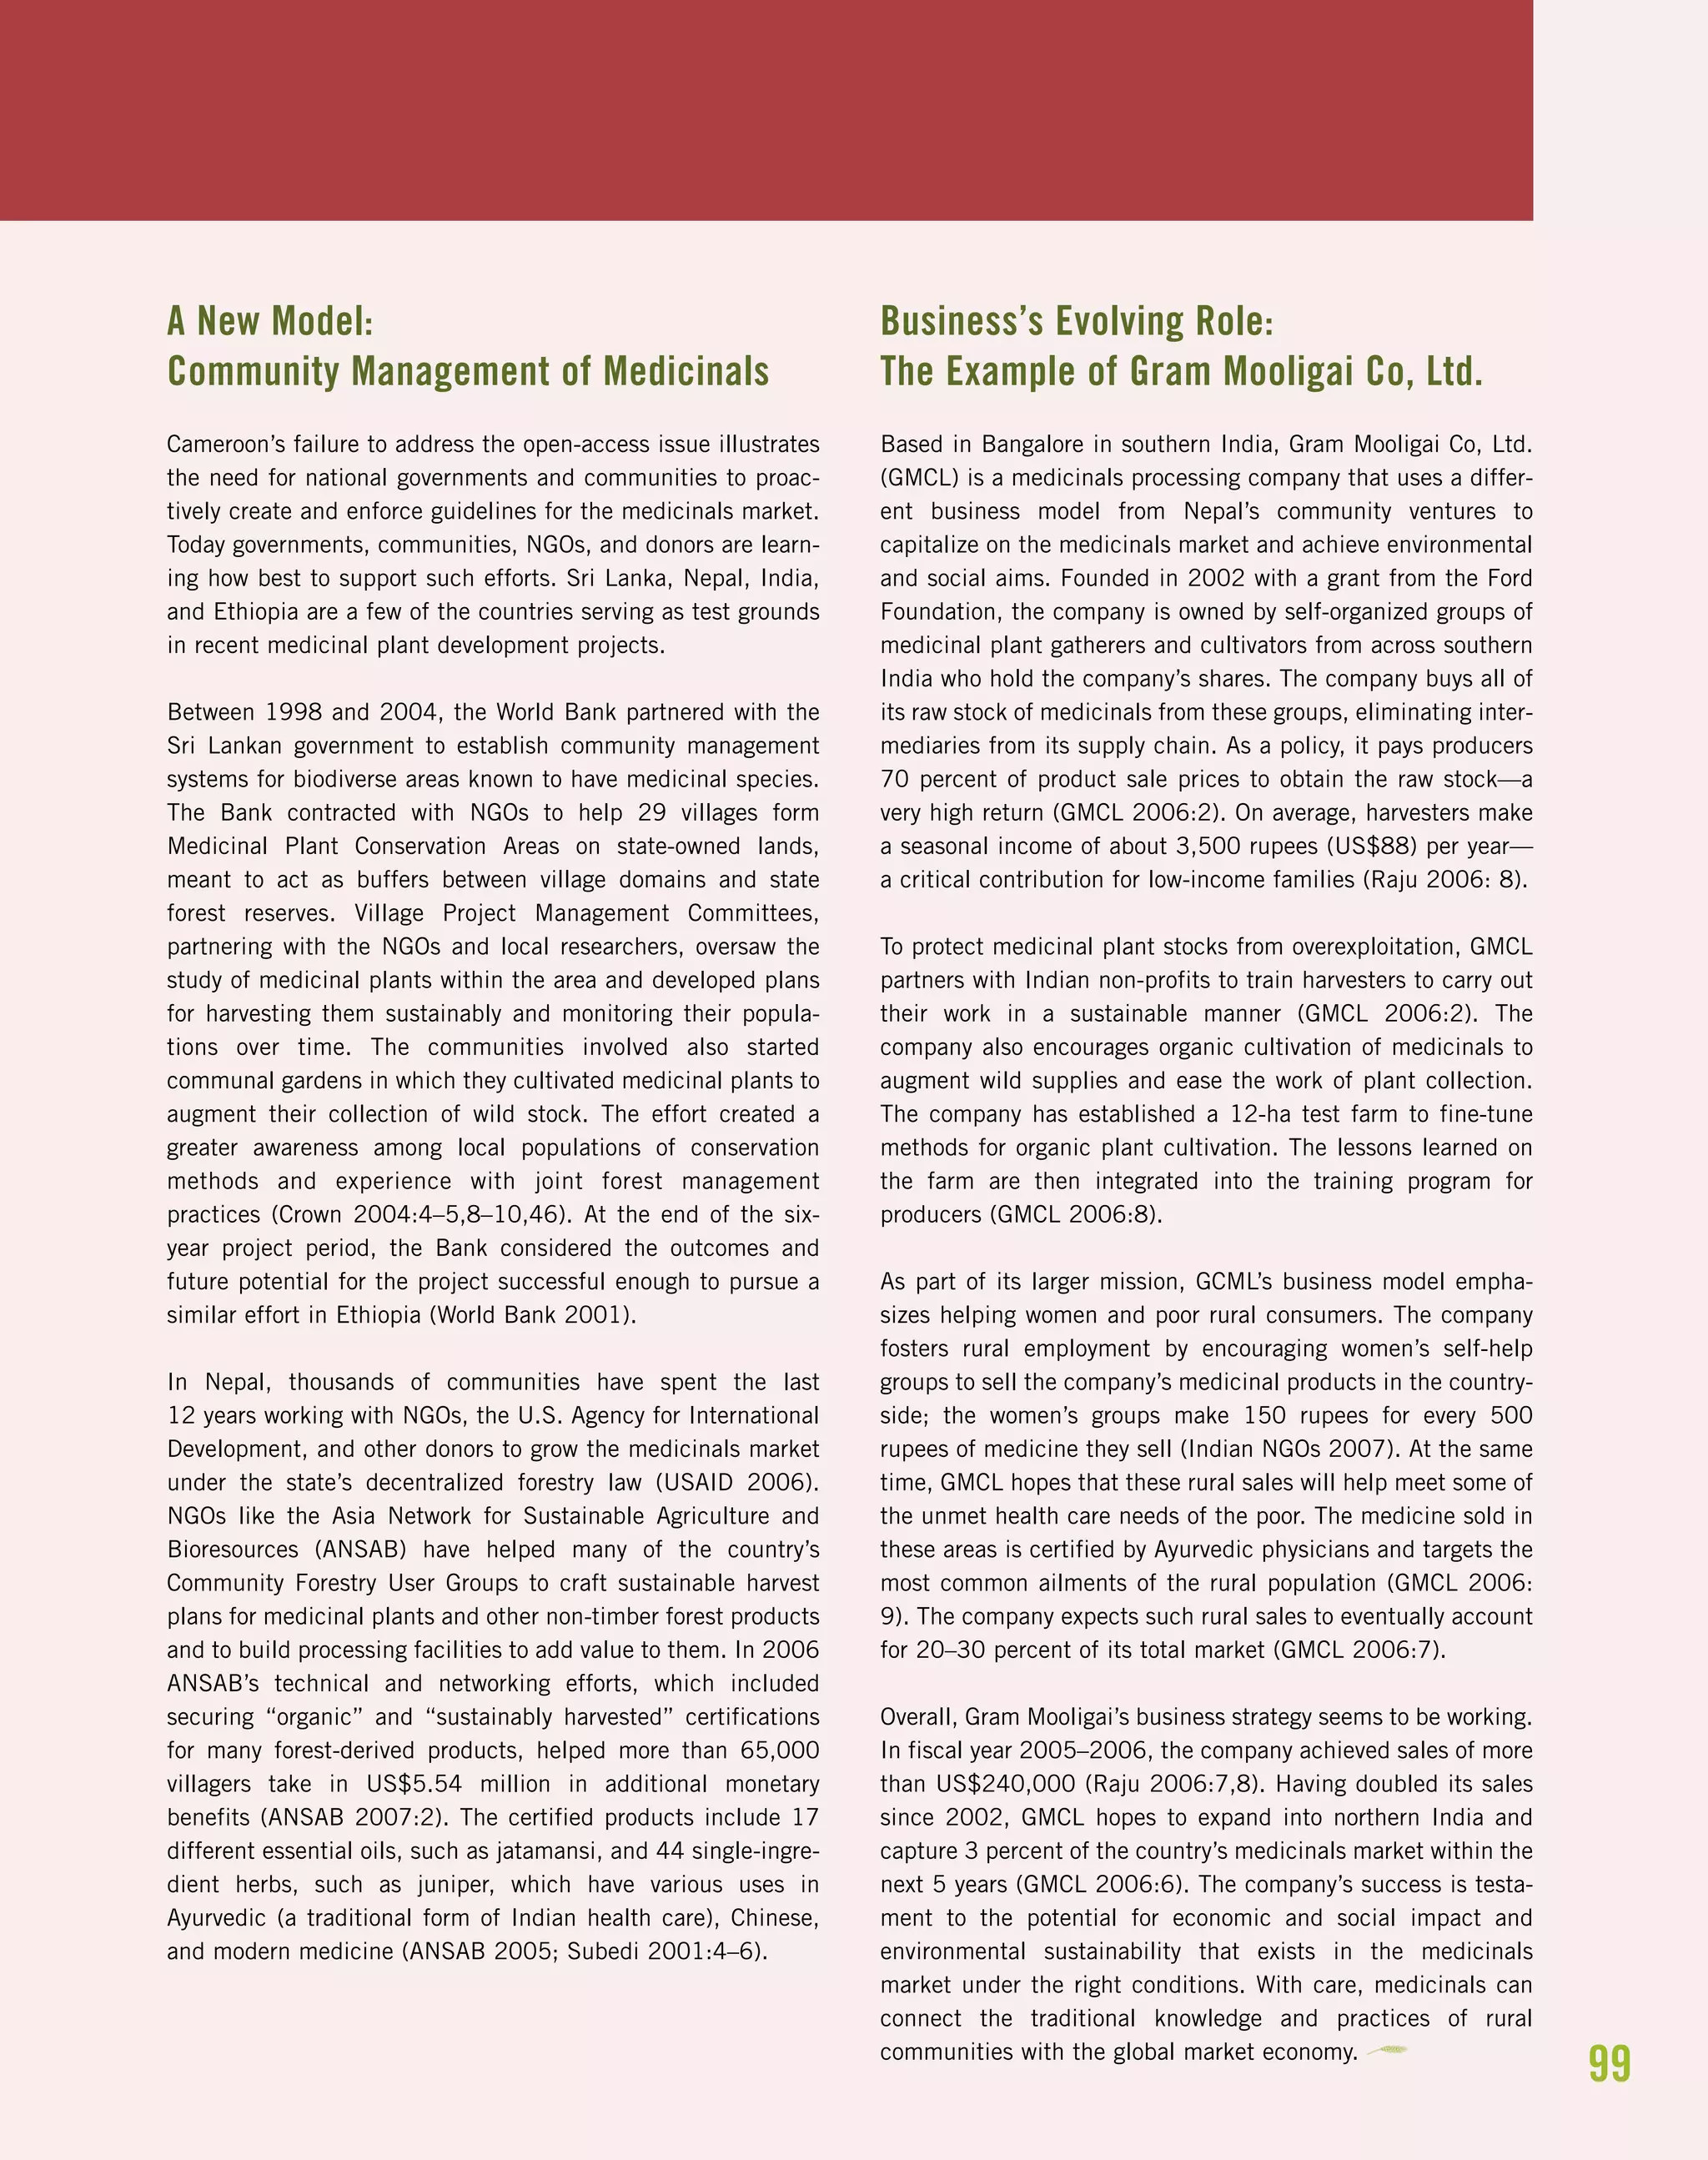
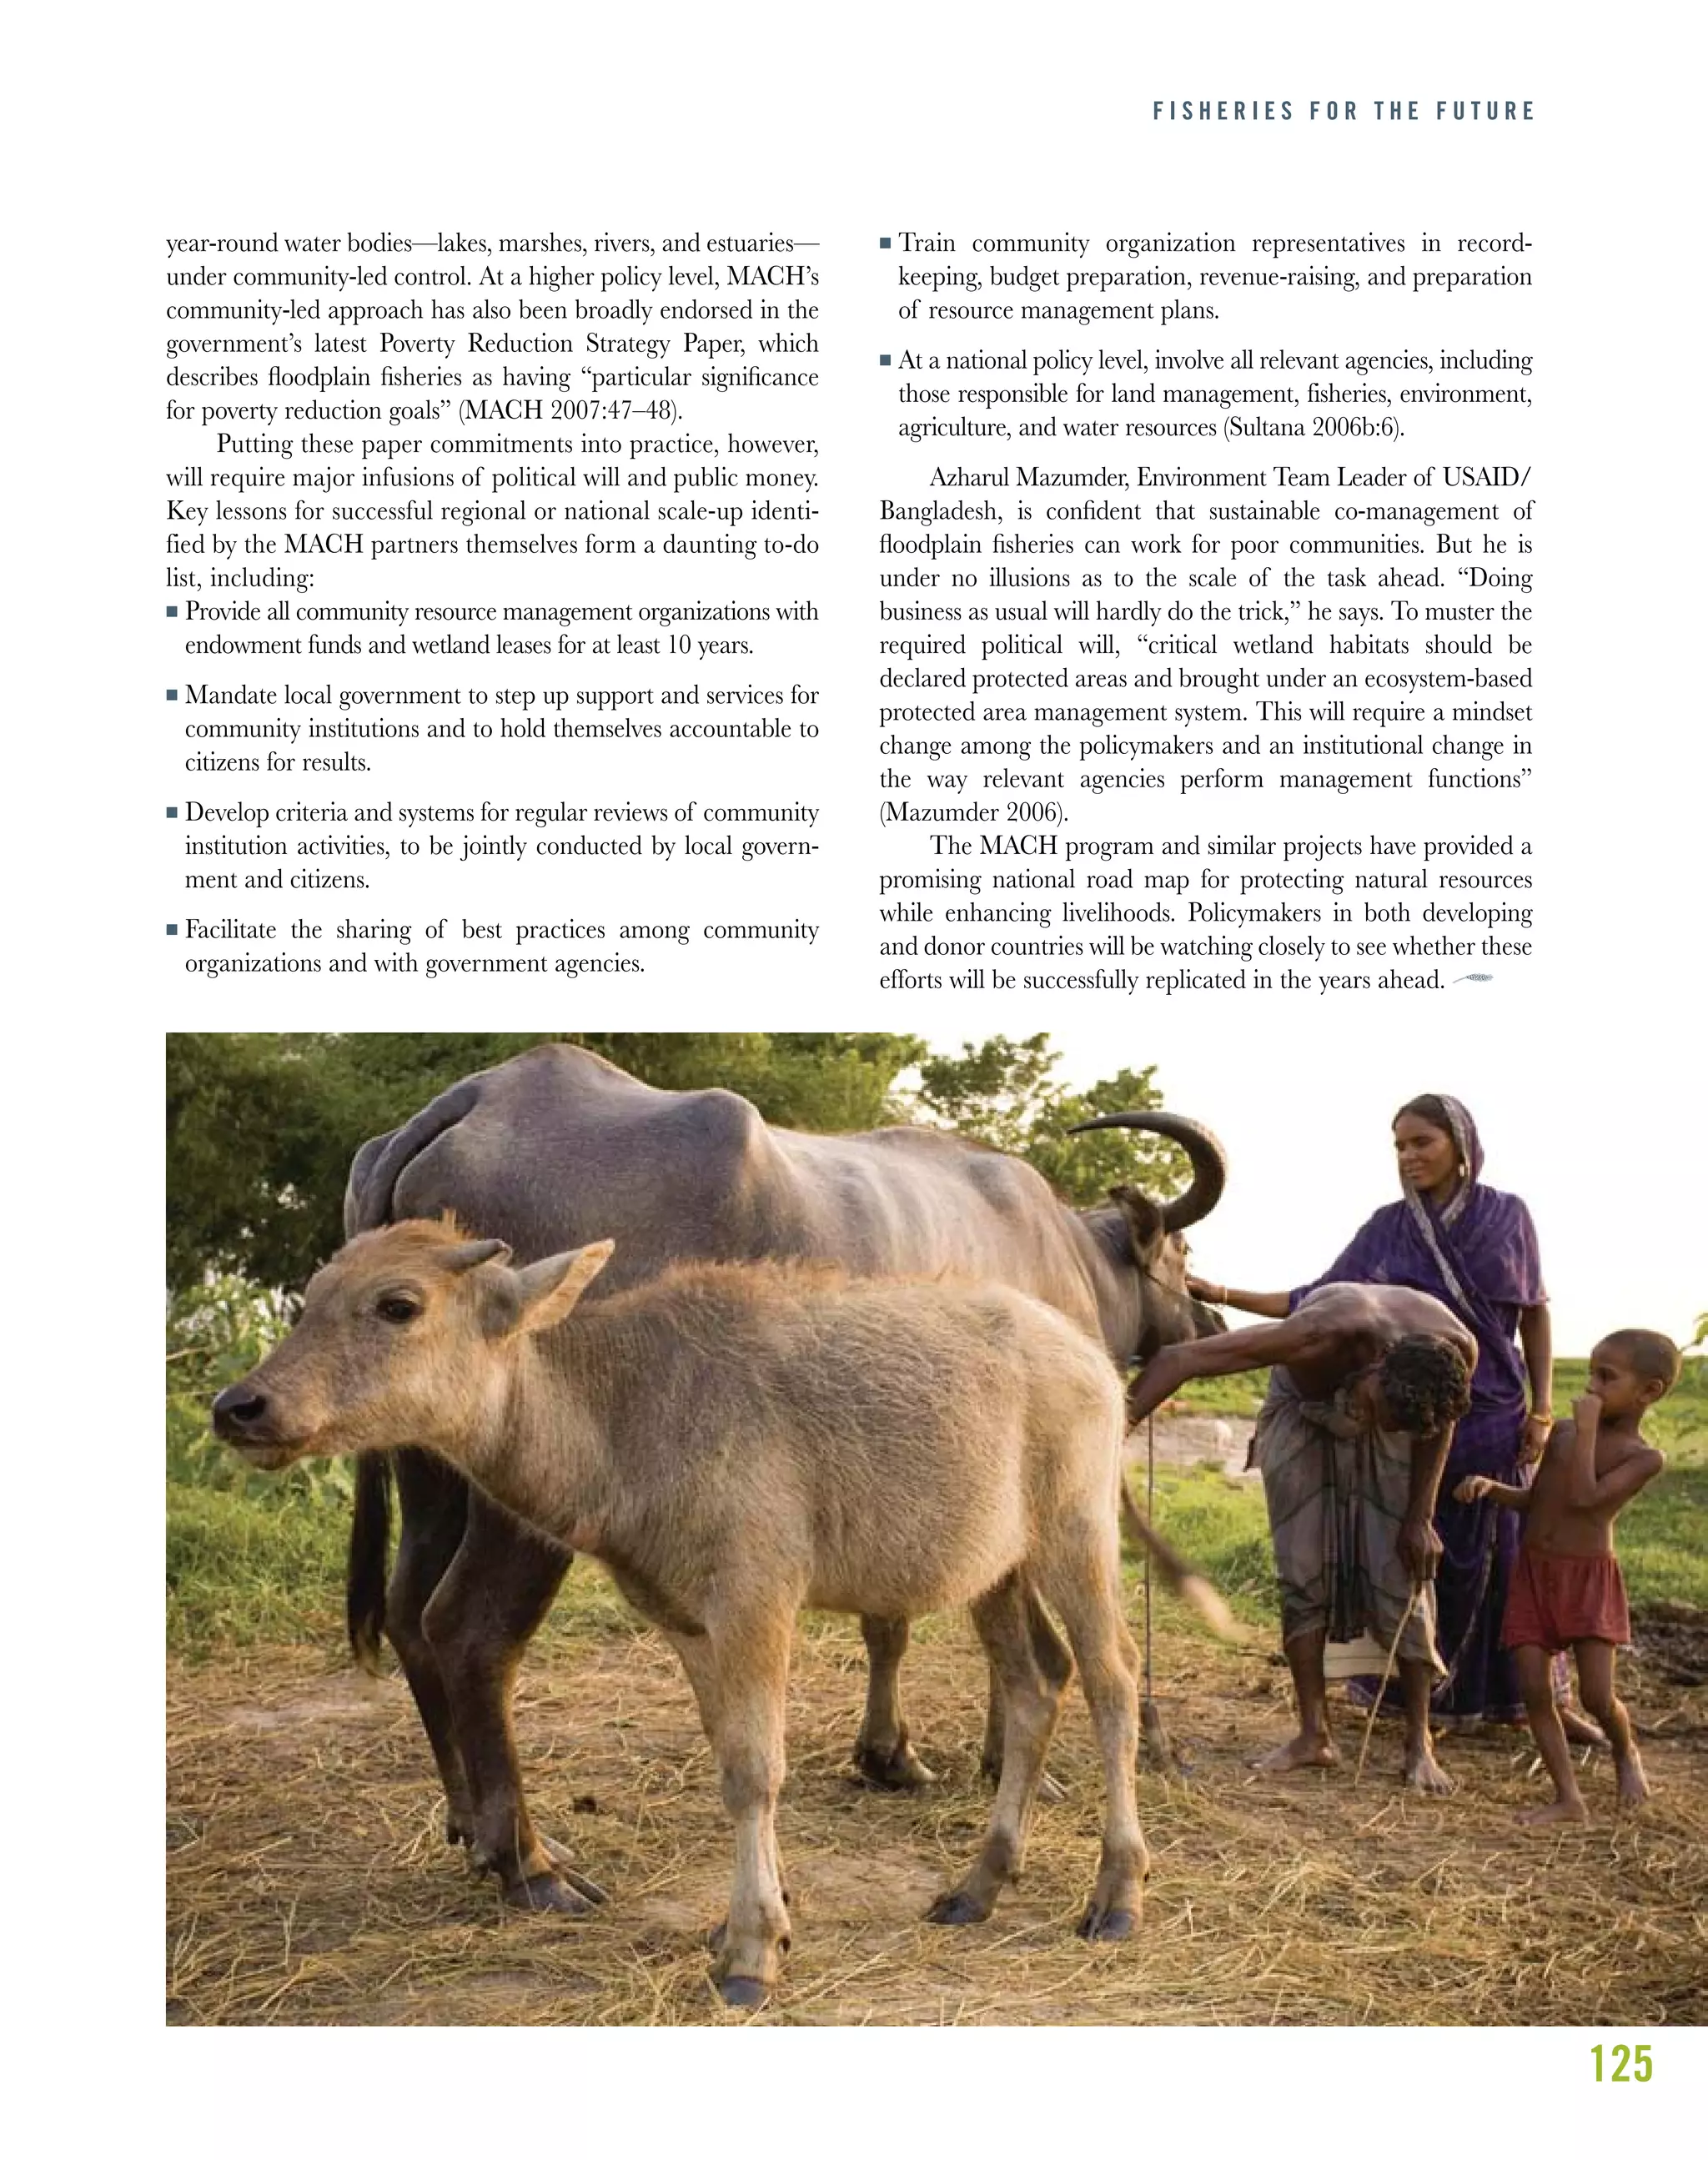
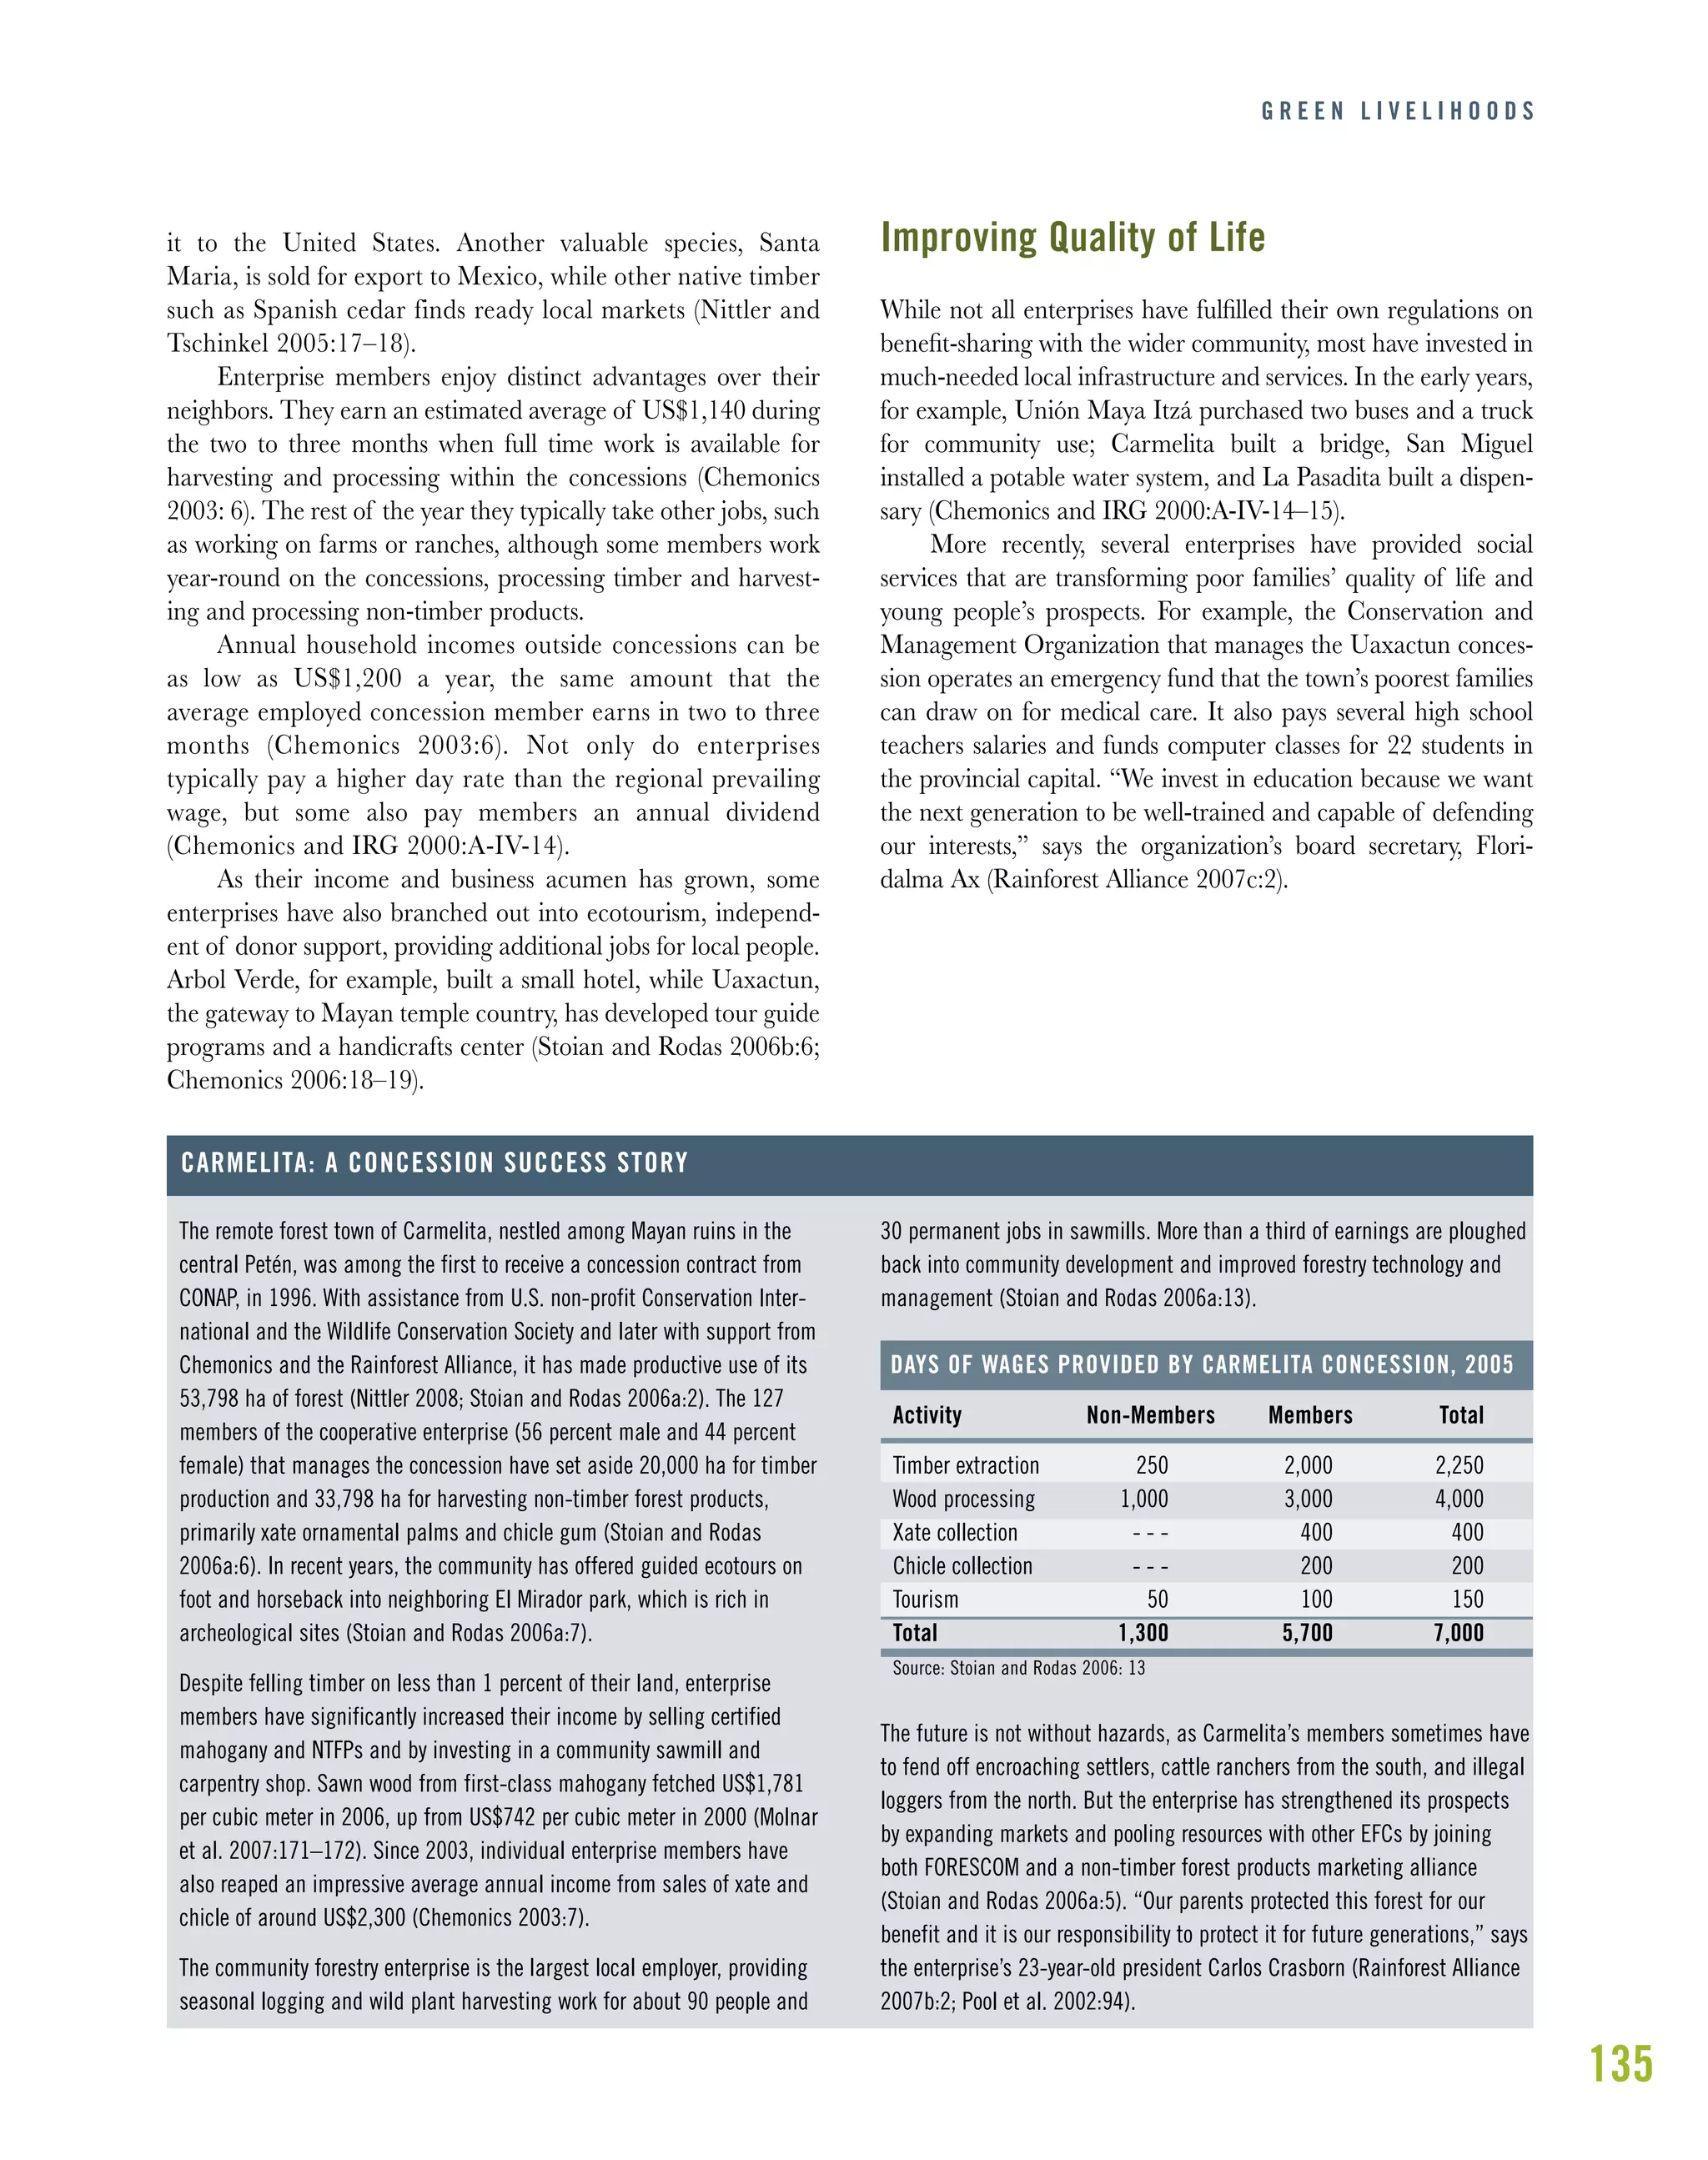
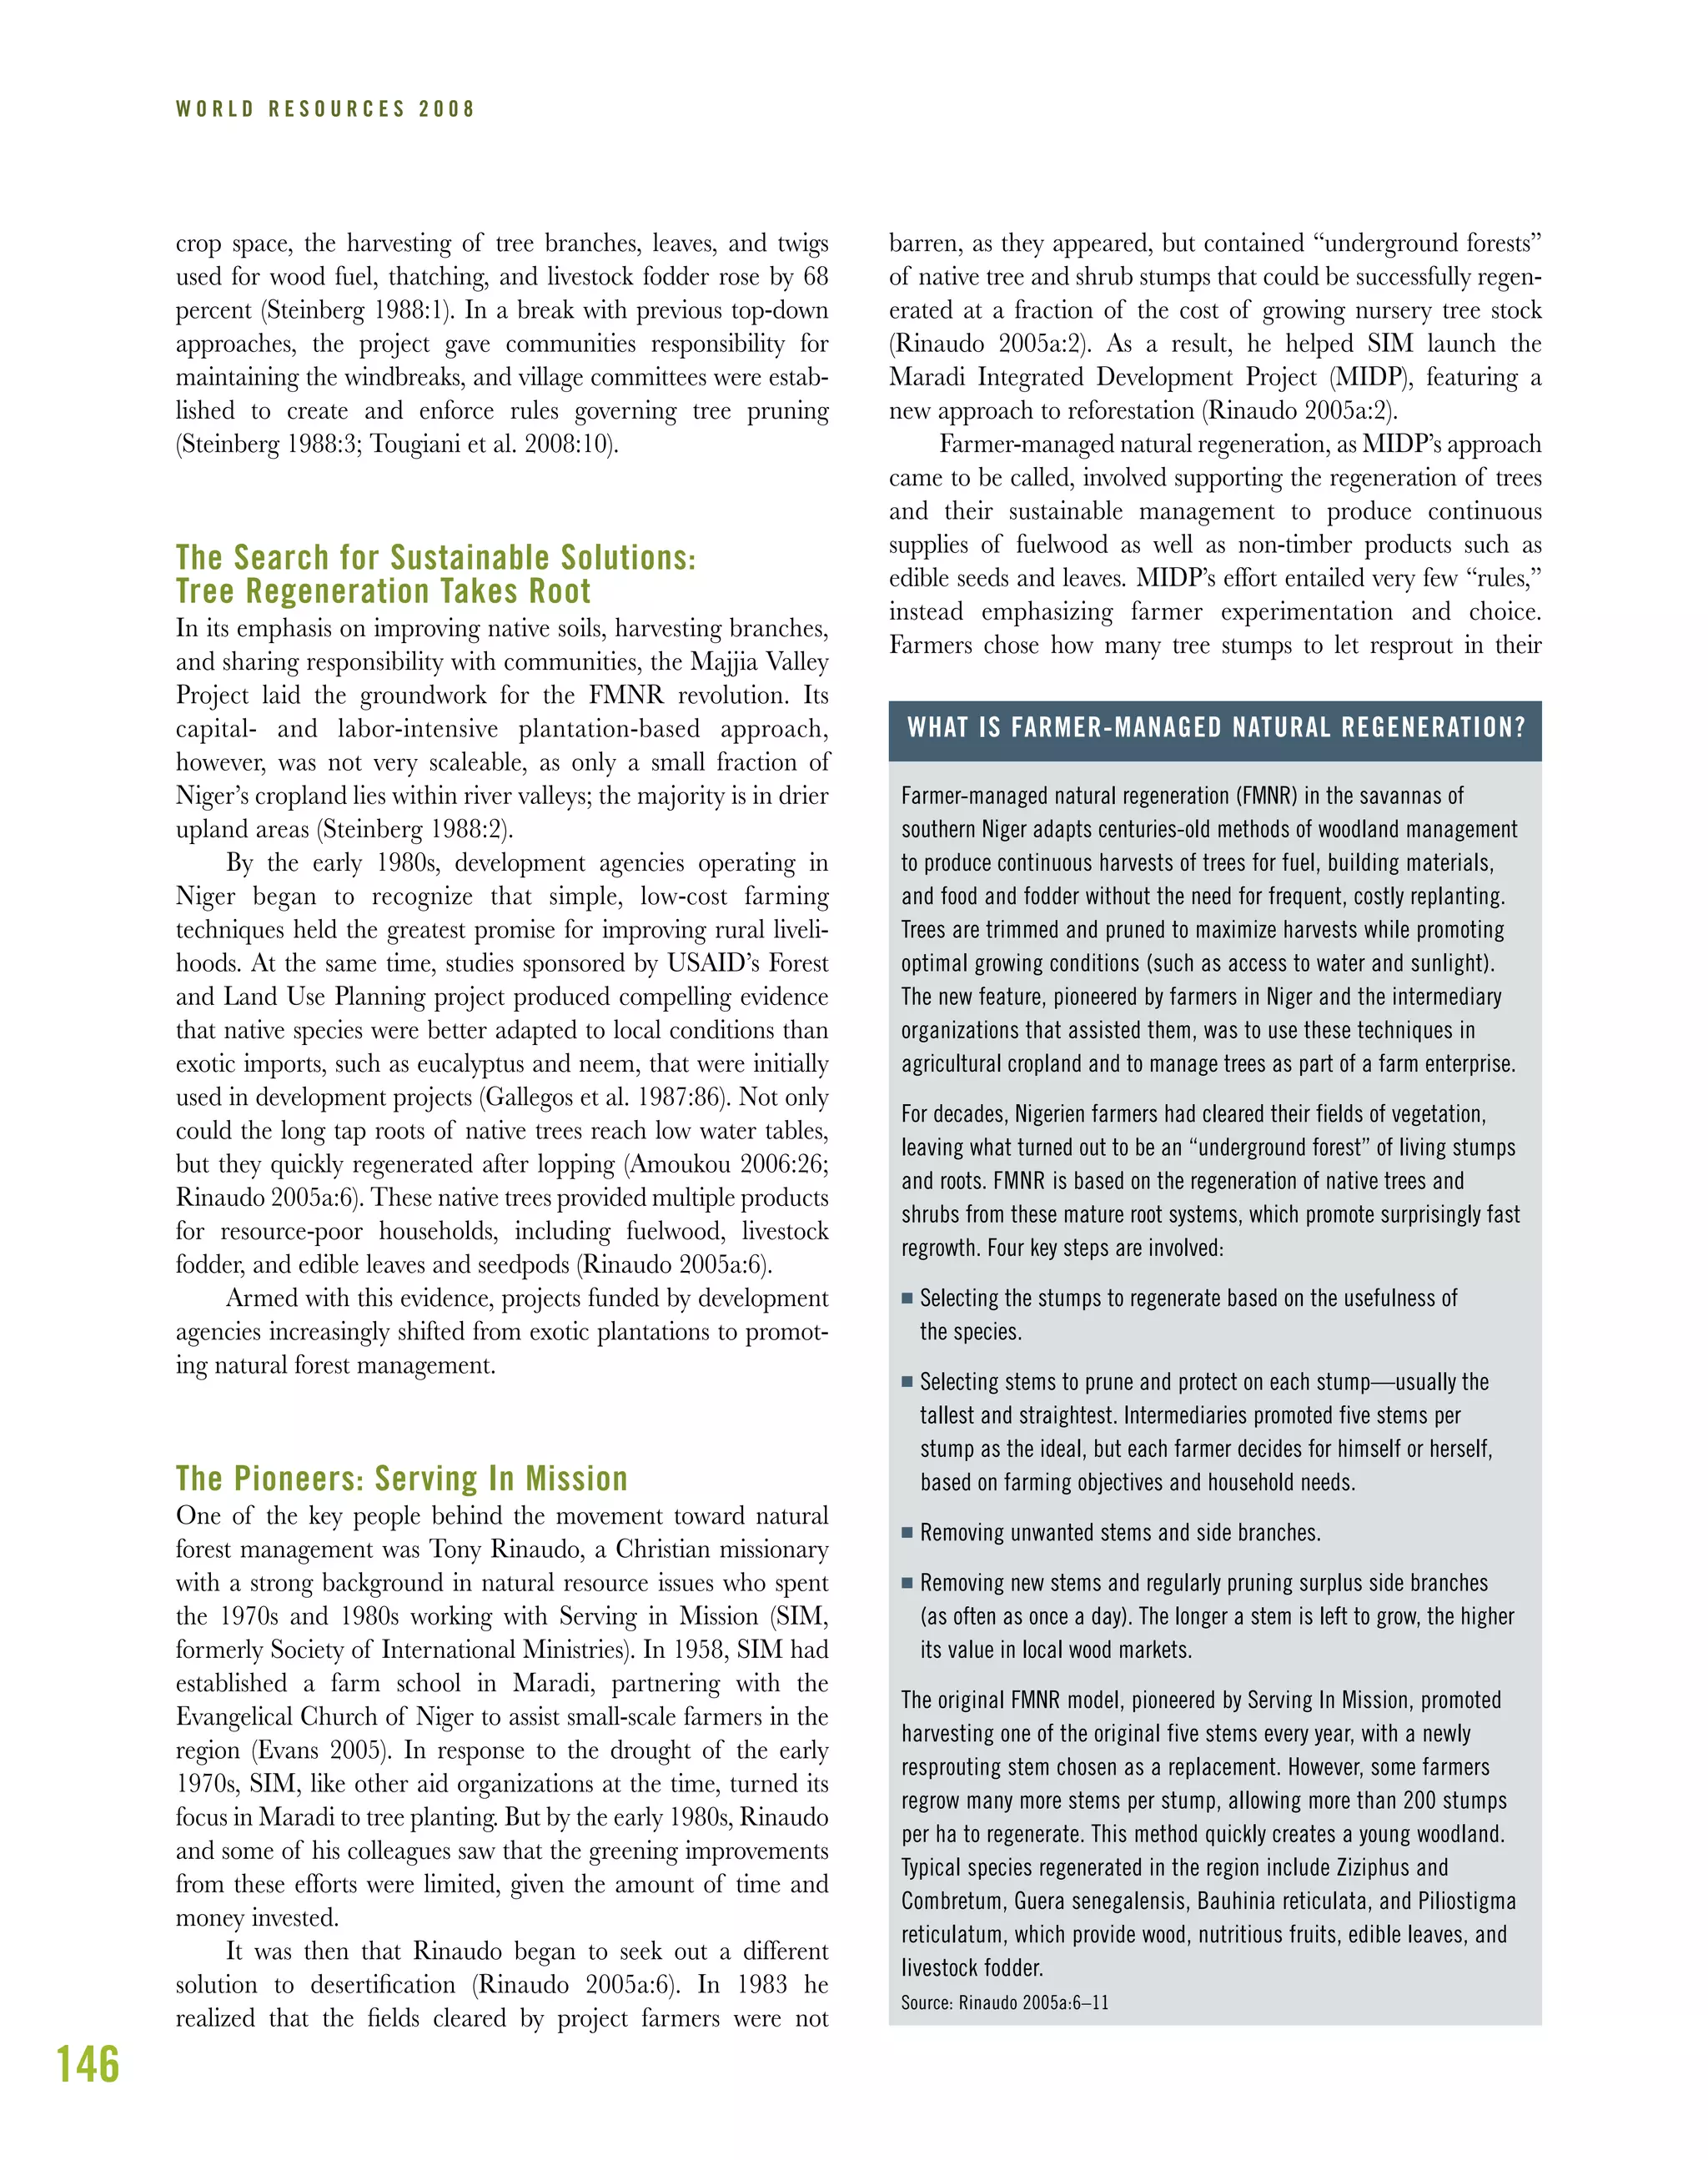
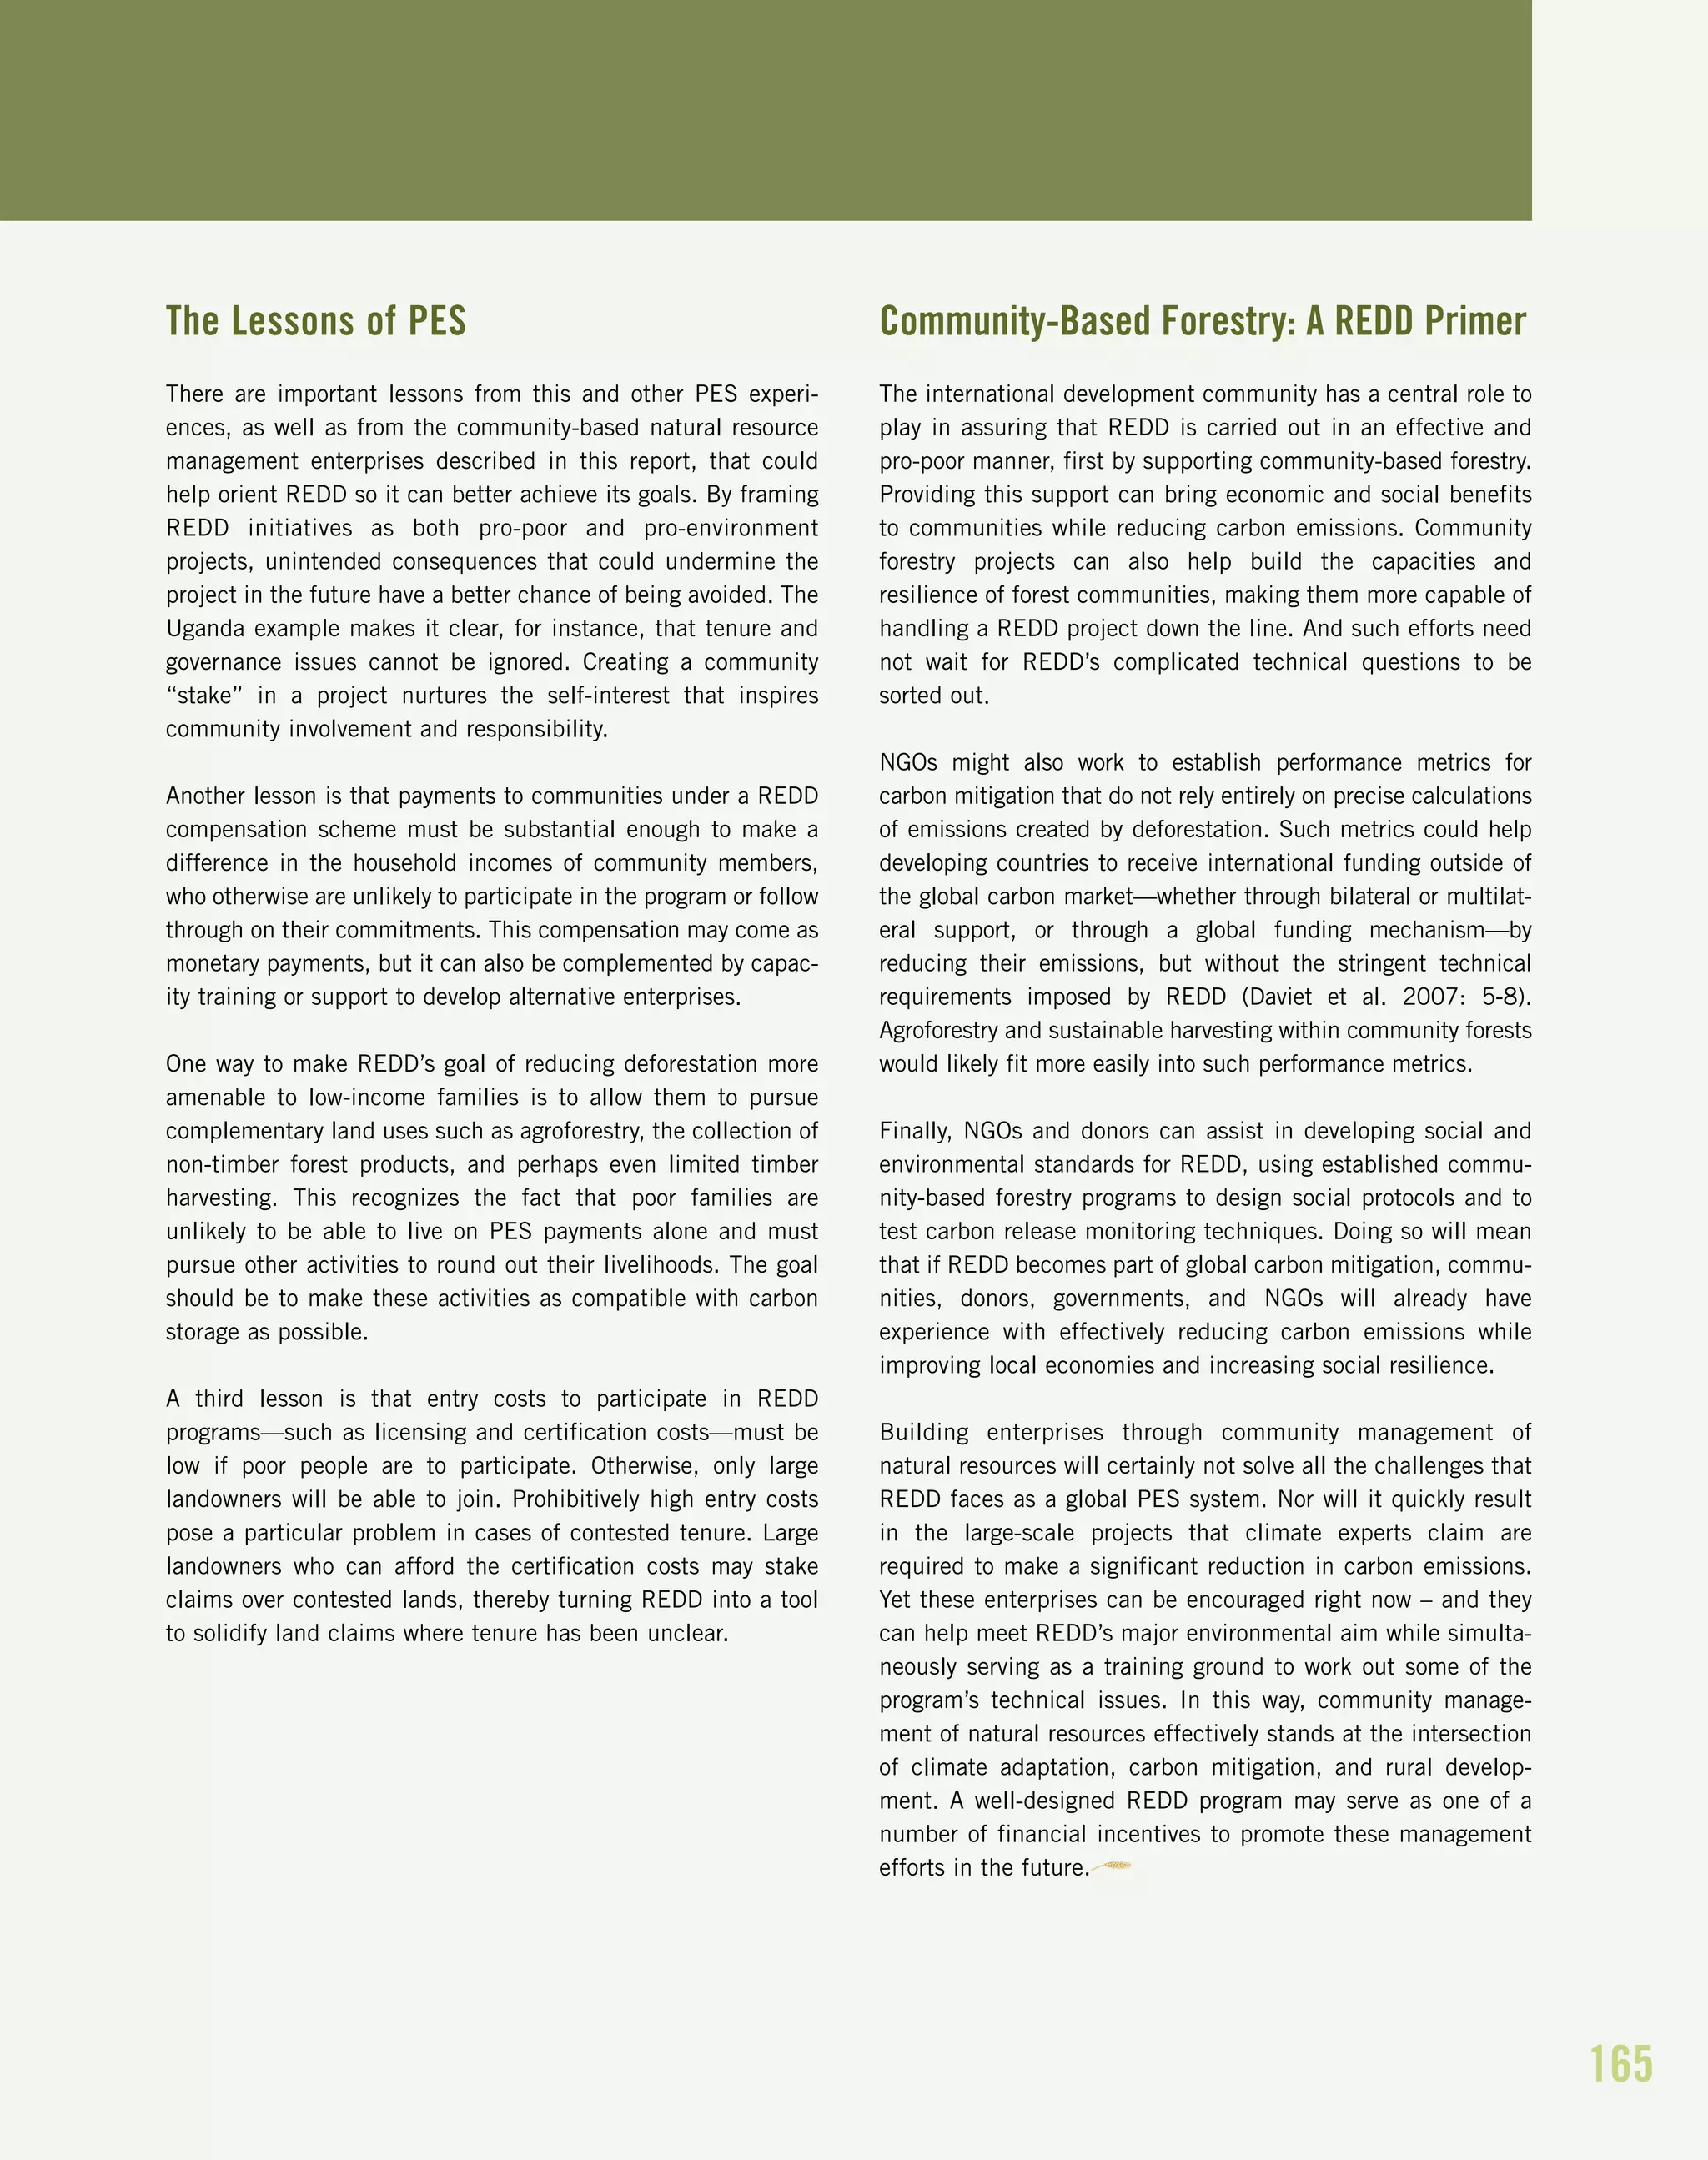
In 2007, Carmelita, Uaxactun, and five other concessions
created a joint marketing committee for xate palms to coordinate
supply and export routes. With the Rainforest Alliance acting as
intermediary, these enterprises are selling between 400 and 600
packages of xate a week to a single buyer, Continental Floral
Greens in Houston. From January to September 2007 they
grossed US$147,948 in US exports (Carrera 2008). Other new
markets include the Adventist Churches of Minnesota, which
bought 122,000 palms sourced from the Maya Biosphere Reserve
over 12 months in 2006–2007 (Rainforest Alliance 2000a:2). For
Palm Sunday 2008, these churches purchased 250,000 palms
with a 5 cent premium on each palm (Carrera 2008).
To meet the demands of eco-conscious customers, the
Rainforest Alliance has helped these communities set sustain-
able harvesting guidelines for collectors and improve supply and
delivery by building two central collection and sorting facilities.
With technical assistance, three enterprises—Carmelita, Uaxac-
tun, and San Andres—are on target to achieve FSC certification
in 2008 for sustainable xate plantations on 170,000 ha of
concession land, the first such management standard in the
world (Rainforest Alliance 2007b:2).
Securing the Future:
A Challenging Road Ahead
Both for nature and for people, Guatemala’s community
forestry enterprises have proved a clear success. As early as
2000, the government’s decision to hand over tenure rights and
management responsibilities to communities with a direct
economic interest in forest protection had paid off. “[They]
have exceeded expectations…are dramatically increasing the
incomes of concessionaires and have reduced the incidence of
forest fires, illegal logging and settlements,” reported the
authors of a 2000 review of the Maya Biosphere Project for
USAID (Chemonics and IRG 2000:III-5).
While the concessions have encountered problems and
required millions of dollars in support, they have continued to do
far better at protecting forest and biodiversity than CONAP has
done in the neighboring national parks. Studies predict that at
current rates of deforestation, the Maya Biosphere Reserve will
lose 38 percent of its 1986 forest cover by 2050. As a result, the
certified concessions are likely to play an increasingly important
role in the future in the reserve (Hughell and Butterfield 2008:2).
The commitment of self-interested communities combined
with the support of government agencies, NGOs, international
donors, and, more recently, overseas buyers has fostered this
success story. Yet 14 years after the first concession was granted,
four EFCs are in trouble and the long-term future of the remain-
der, while promising, is not assured (Nittler 2008). The reasons
for this uncertainty stem from mistakes made when concessions
were first allocated and from failures to address wider policy
issues, such as uncontrolled immigration and agricultural
encroachment that threaten their future stability.
As described earlier, the borders of some early concessions
were hastily drawn without close attention to the makeup of the
forests and without input from forestry professionals. Several
have since proved too small and devoid of high-value timber
species that could provide a viable income from sustainable
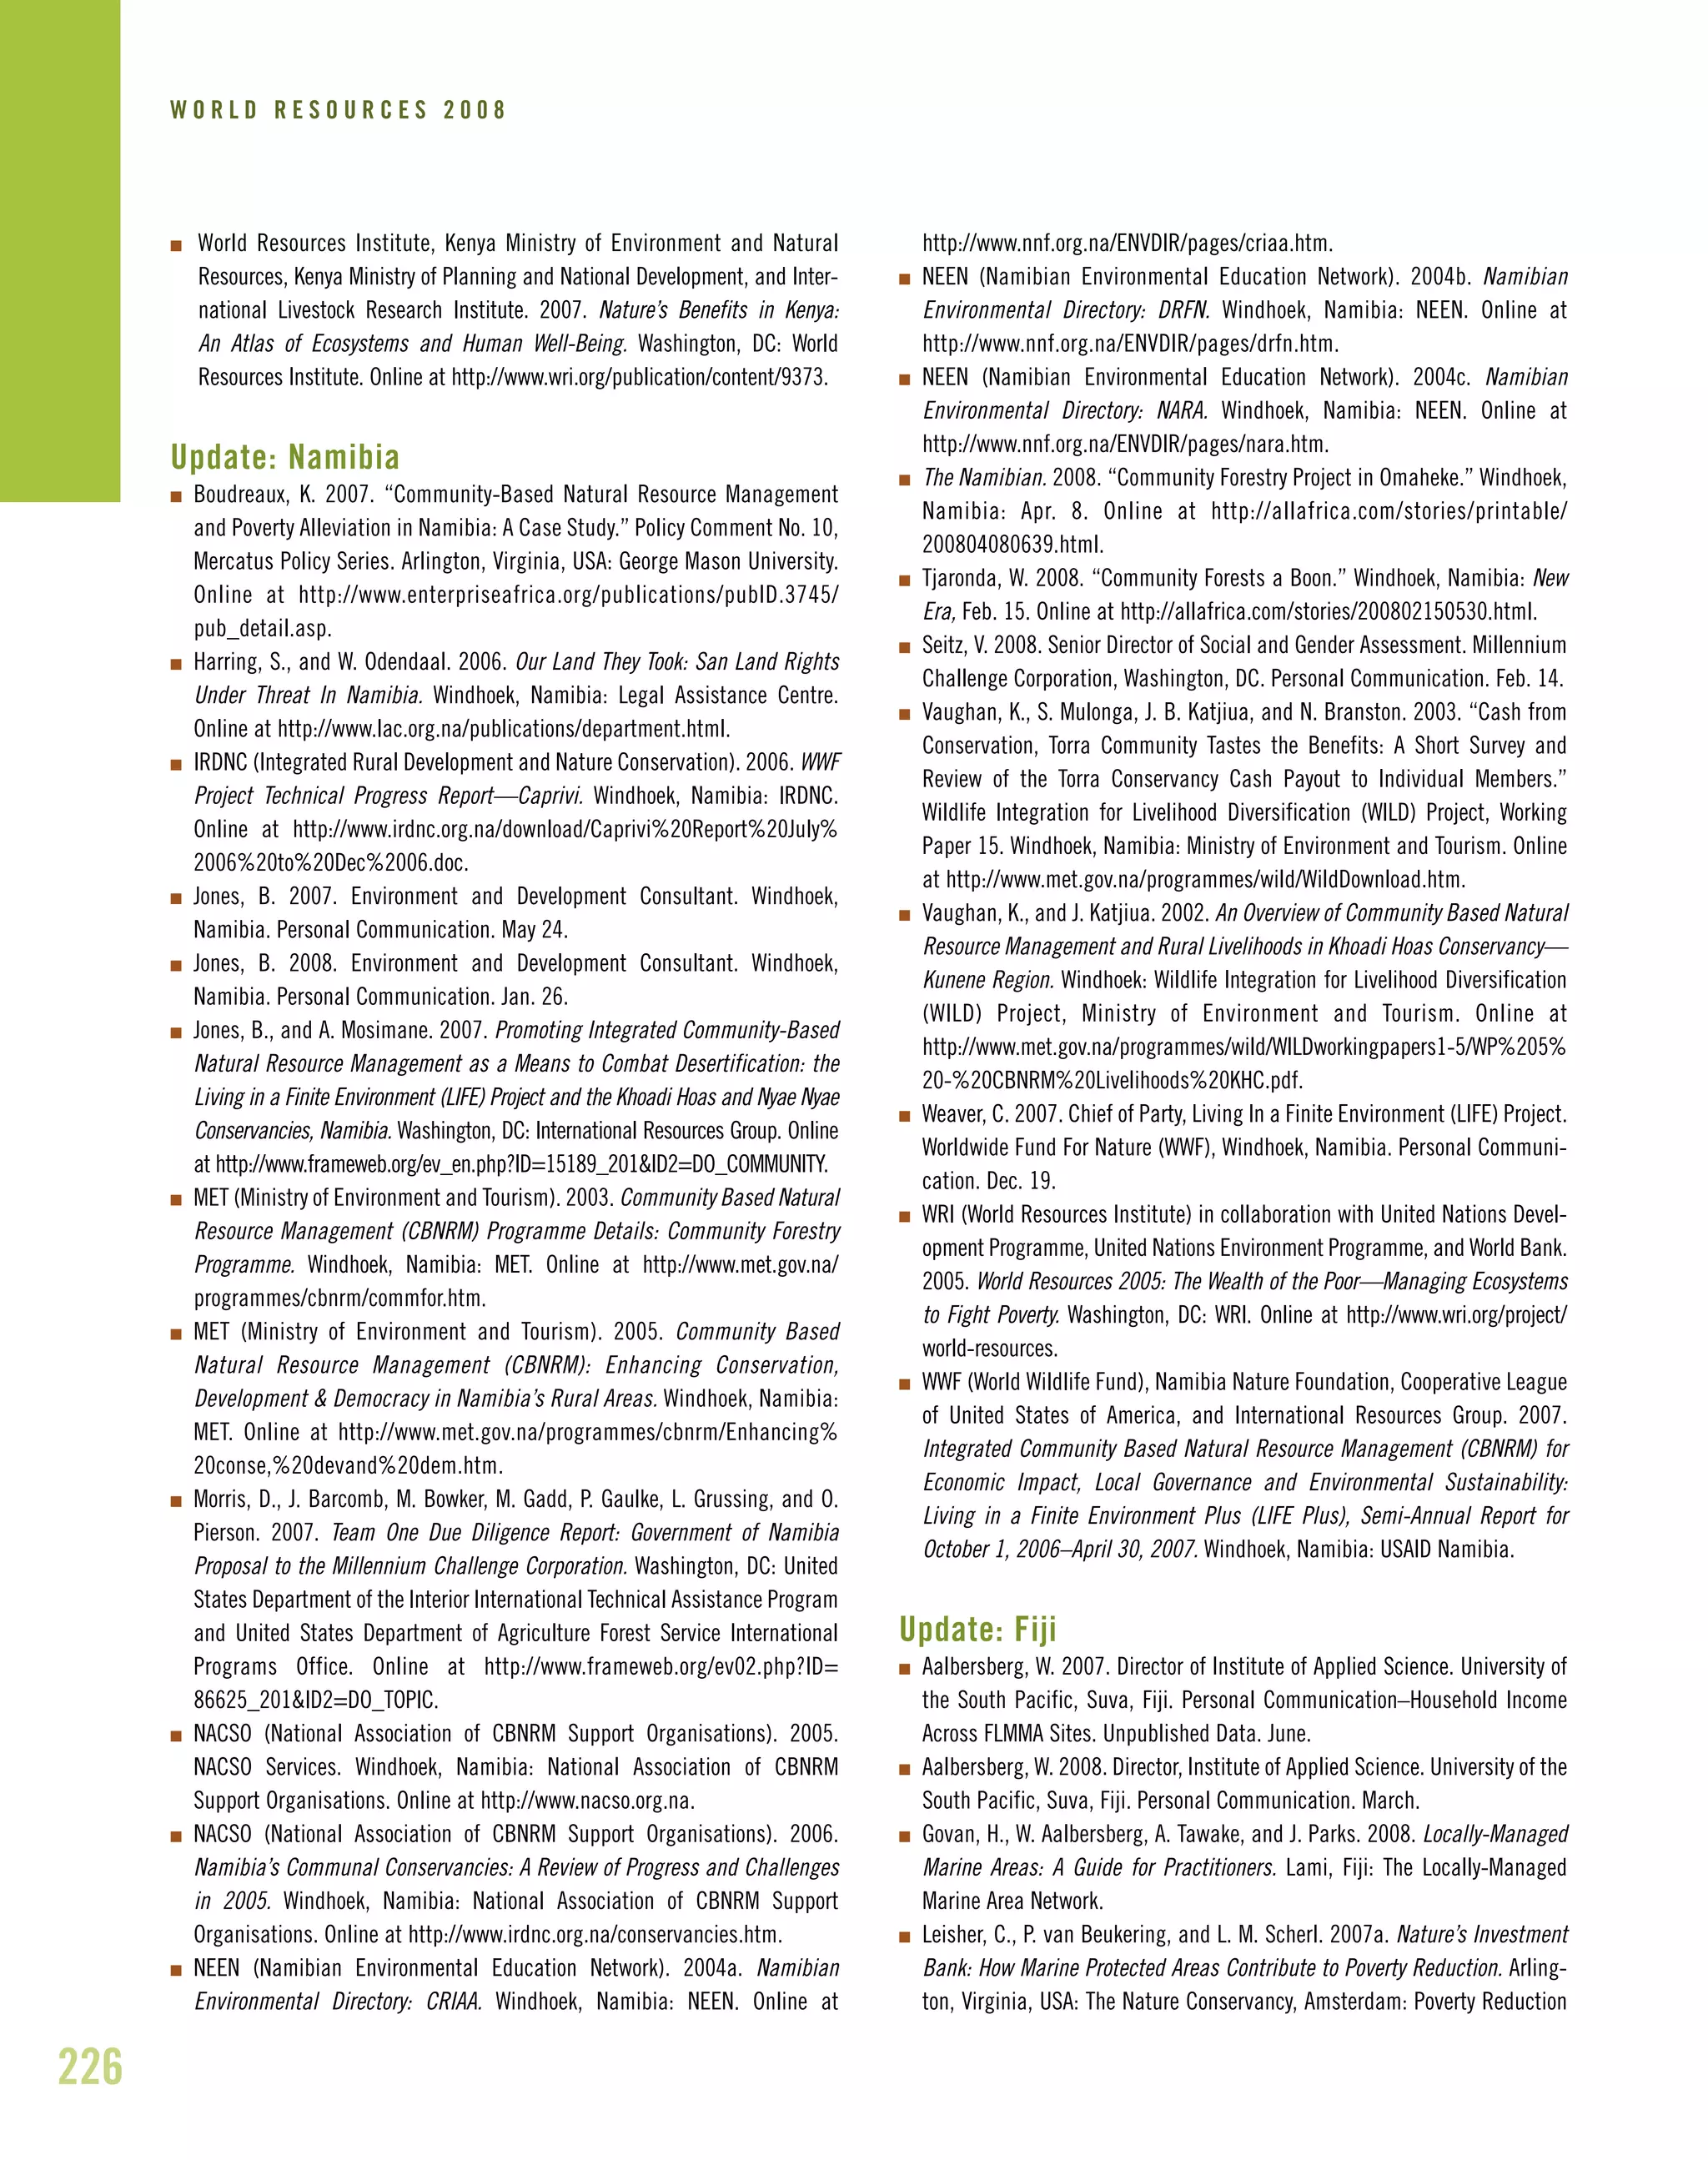
Xate palms](https://image.slidesharecdn.com/worldresources2008rootsofresilience-150506081253-conversion-gate02/75/World-resources-2008_roots_of_resilience-149-2048.jpg)
![138
W O R L D R E S O U R C E S 2 0 0 8
timber operations, and they have struggled to make a profit
(Nittler and Tschinkel 2005).
Under these circumstances, community commitment to
sustainable forestry management has been lacking, with
predictable consequences. Corruption has flourished in a
number of the smaller concessions, including San Miguel (7,039
ha), La Pasadita (18,817 ha), La Colorada (22,067 ha), and
Cruce a La Colorada (20,469 ha). In these concessions, powerful
local figures illegally sell parcels of concession land to settlers and
encourage farmers to encroach into forest earmarked for sustain-
able harvest (Nittler 2008; Carrera 2008). In 2004, SmartWood
suspended the FSC certification status of San Miguel and La
Pasadita, further harming their business outlook and producing
a stalemate that has yet to be resolved (Chemonics and IRG
2000:A-IV-24; Carrera 2007).
Poor organization and governance have also continued to
hold back some enterprises from thriving as independent small
businesses. In 2005, for example, observers noted that the
continued insistence by many enterprises on a yearly turnover of
board members entrenched “a guaranteed recipe for perpetual
incompetence” (Nittler and Tschinkel 2005:8). In the past three
years, however, these problems have lessened significantly as
EFCs have been required to professionalize their management
under conditions specified by the SmartWood sustainable certifi-
cation inspections. At least one manager with proven forestry
experience must be hired, for example, and EFC governing
boards are required to retain at least one or two members for
more than one term of office to ensure continuity of experience
(Carrera 2007). Long-term planning has also improved EFCs’
business performance. With help from Chemonics, seven enter-
prises have produced comprehensive five-year plans enabling
them to forecast timber supply, improve sales forecasts, and avoid
poor investment decisions (Chemonics 2006:26).
In its 2006 completion report, Chemonics International
focused on the growing economic and social resilience of the
concession communities, describing how villagers had devel-
oped into effective entrepreneurs: “Unlike the mindset in 2001,
today most [enterprise] members understand the importance
of managing their organizations for profit. Board members and
managers are more aware of production costs, they have built
in administrative and production controls, and are better
prepared to negotiate more profitable forest-harvesting
contracts” (Chemonics 2006:38). By December 2007, accord-
ing to José Roman Carrera, regional manager for the
Rainforest Alliance’s sustainable forestry division, eight enter-
prises were profitable, operationally self-sufficient, and well
placed to prosper once USAID funding to develop new
products and markets ceases in August 2009 (Carrera 2007).](https://image.slidesharecdn.com/worldresources2008rootsofresilience-150506081253-conversion-gate02/75/World-resources-2008_roots_of_resilience-150-2048.jpg)

![150
W O R L D R E S O U R C E S 2 0 0 8
and managed by farmers and at least 250,000 ha of degraded
land has been restored to crop production (Reij 2008;
McGahuey and Winterbottom 2007:7). A 2005 survey for
USAID recorded tree or shrub stems ranging from 20 to 150 per
ha across three regions, a dramatic 10- to 20-fold increase since
1975 (McGahuey and Winterbottom 2007:6–8). This change in
the rural landscape has enabled hundreds of thousands of
households living on US$2 or less a day to diversify livelihoods
and increase income, thus increasing their economic resilience. It
has also played a critical role in addressing the chronic hunger of
families accustomed to living with unpredictable harvests.
FMNR has also had an enormously empowering effect,
demonstrating to hundreds of thousands of people that they
were not helpless hostages to poverty and a capricious climate.
“[Its success] helped establish a positive mindset about farmers’
capacity to take charge of critical farm management decisions,”
explains USAID natural resources management adviser Mike
McGahuey. “It showed that progress against poverty and deser-
tification was strongest when the rural poor worked on their own
behalf to achieve their own objectives” (McGahuey 2008).
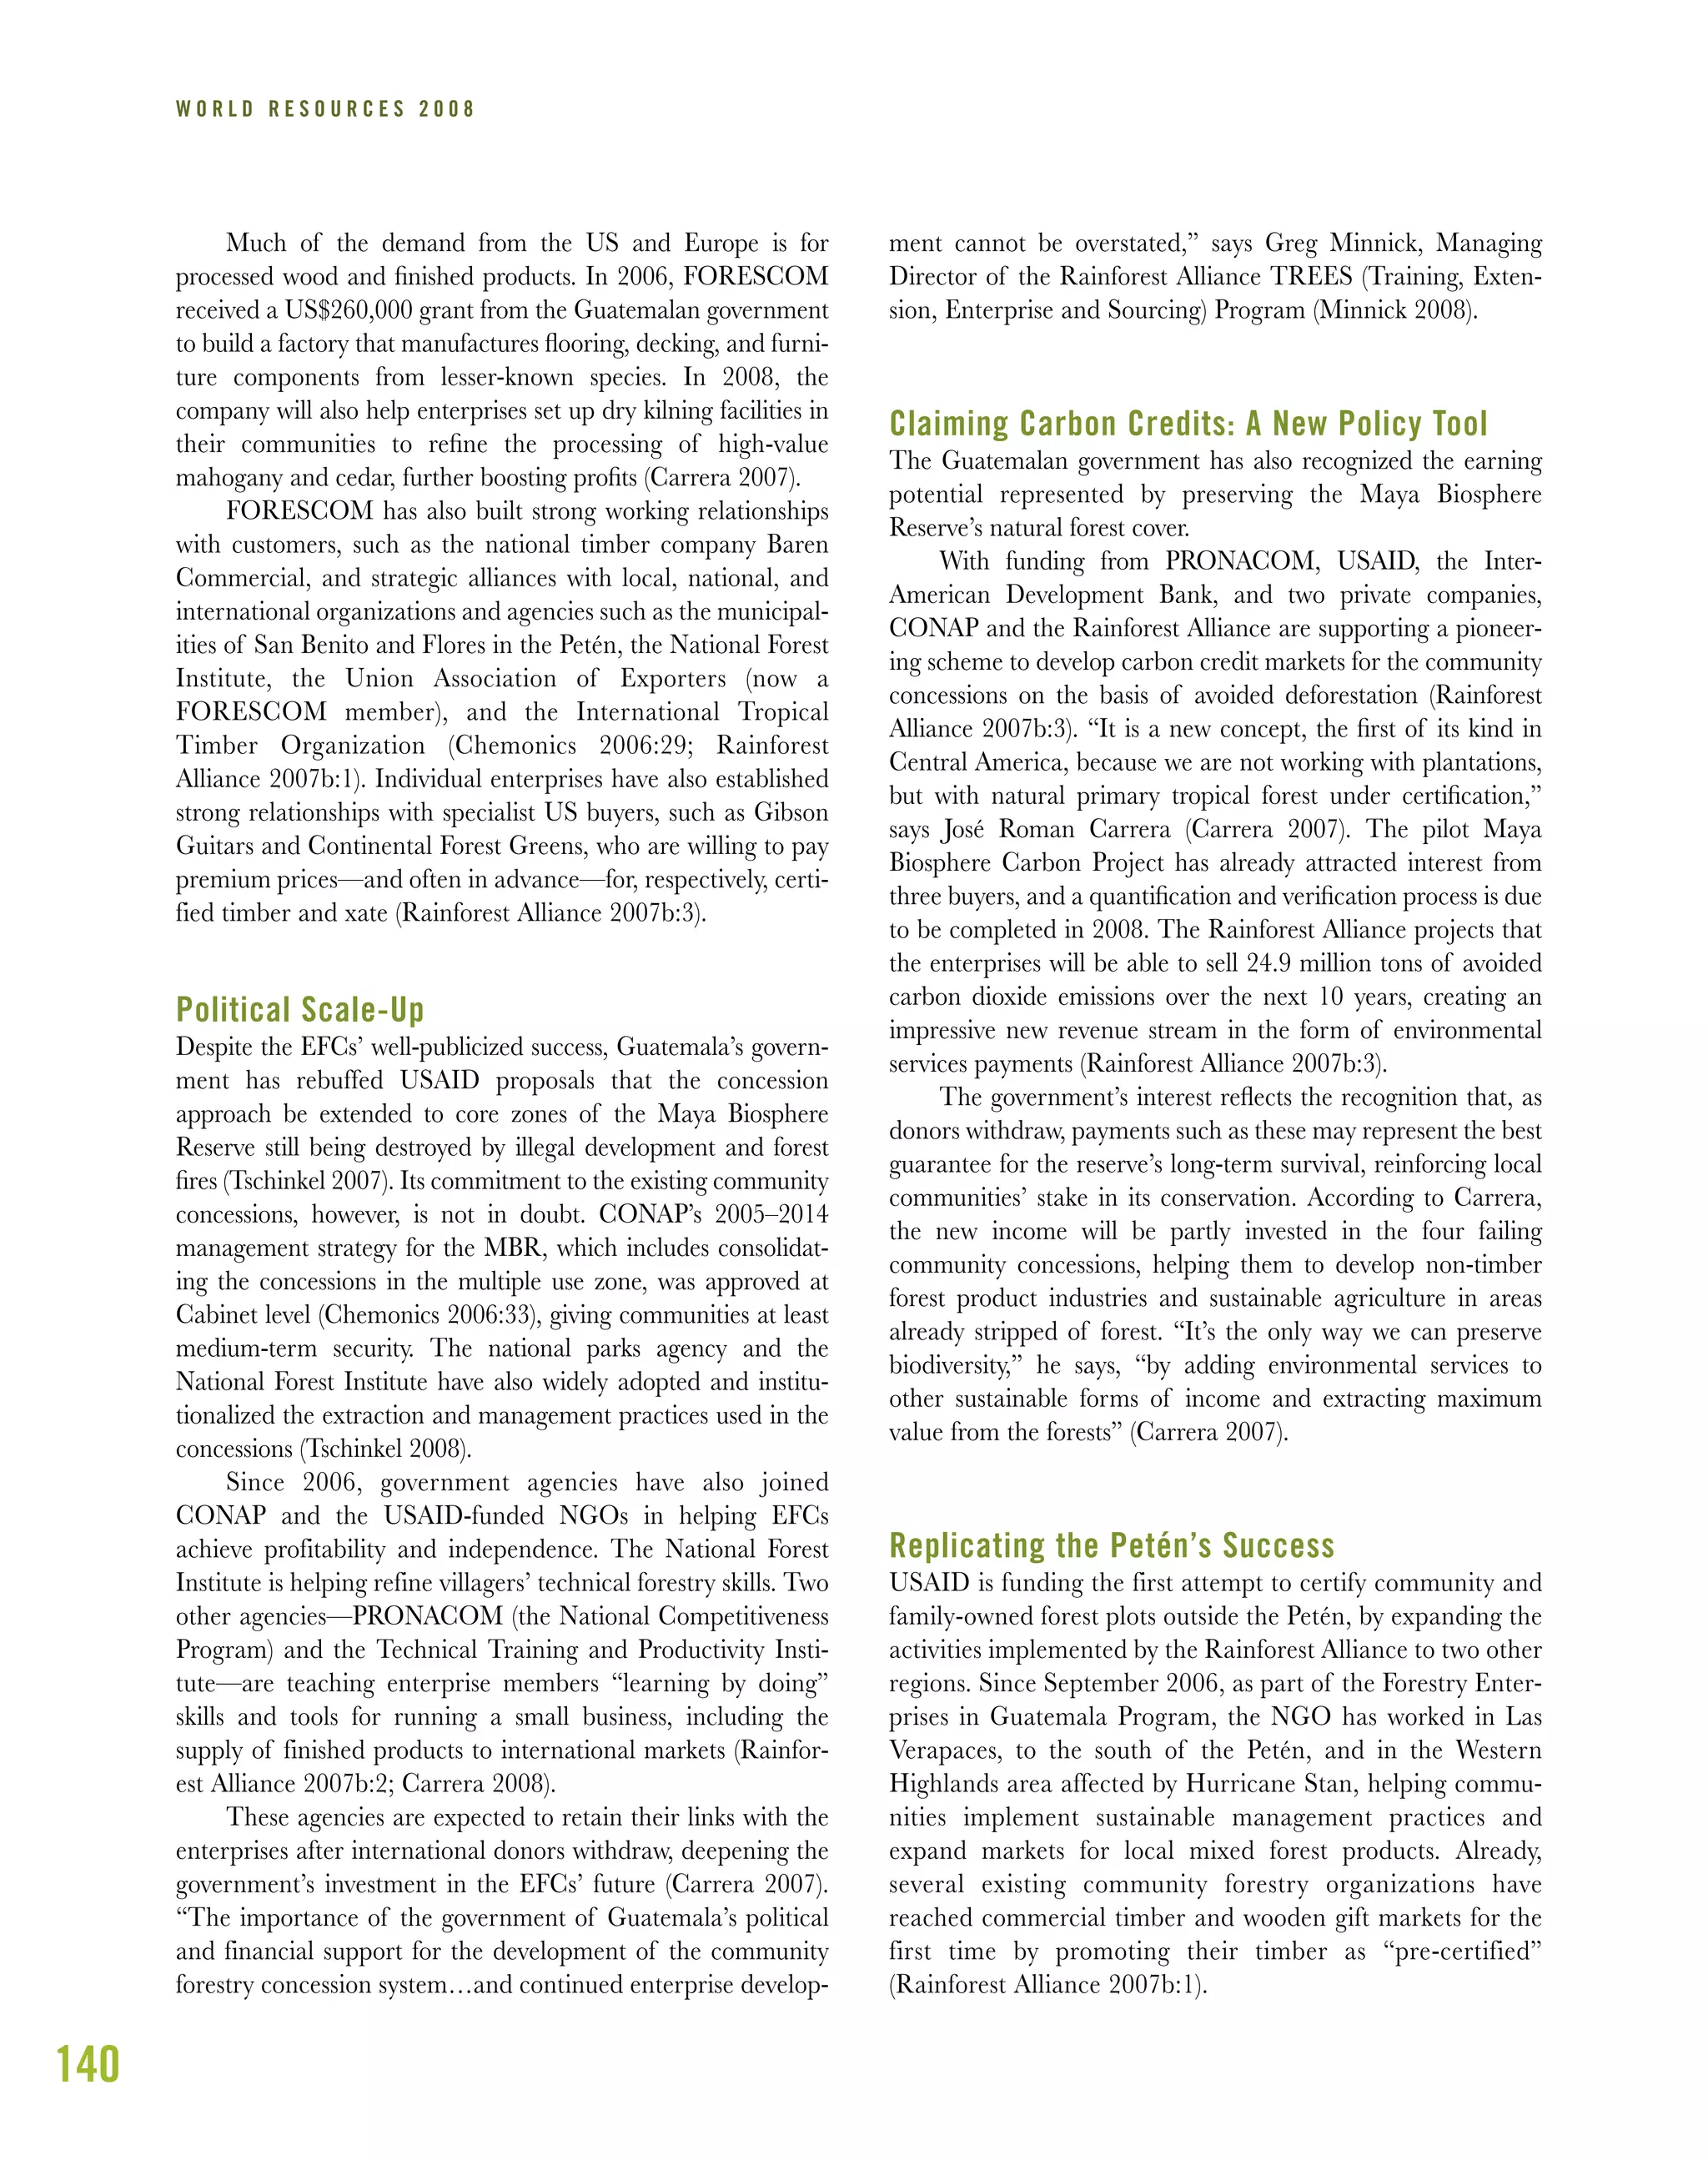
Money Trees
Fuelwood and Fodder Income
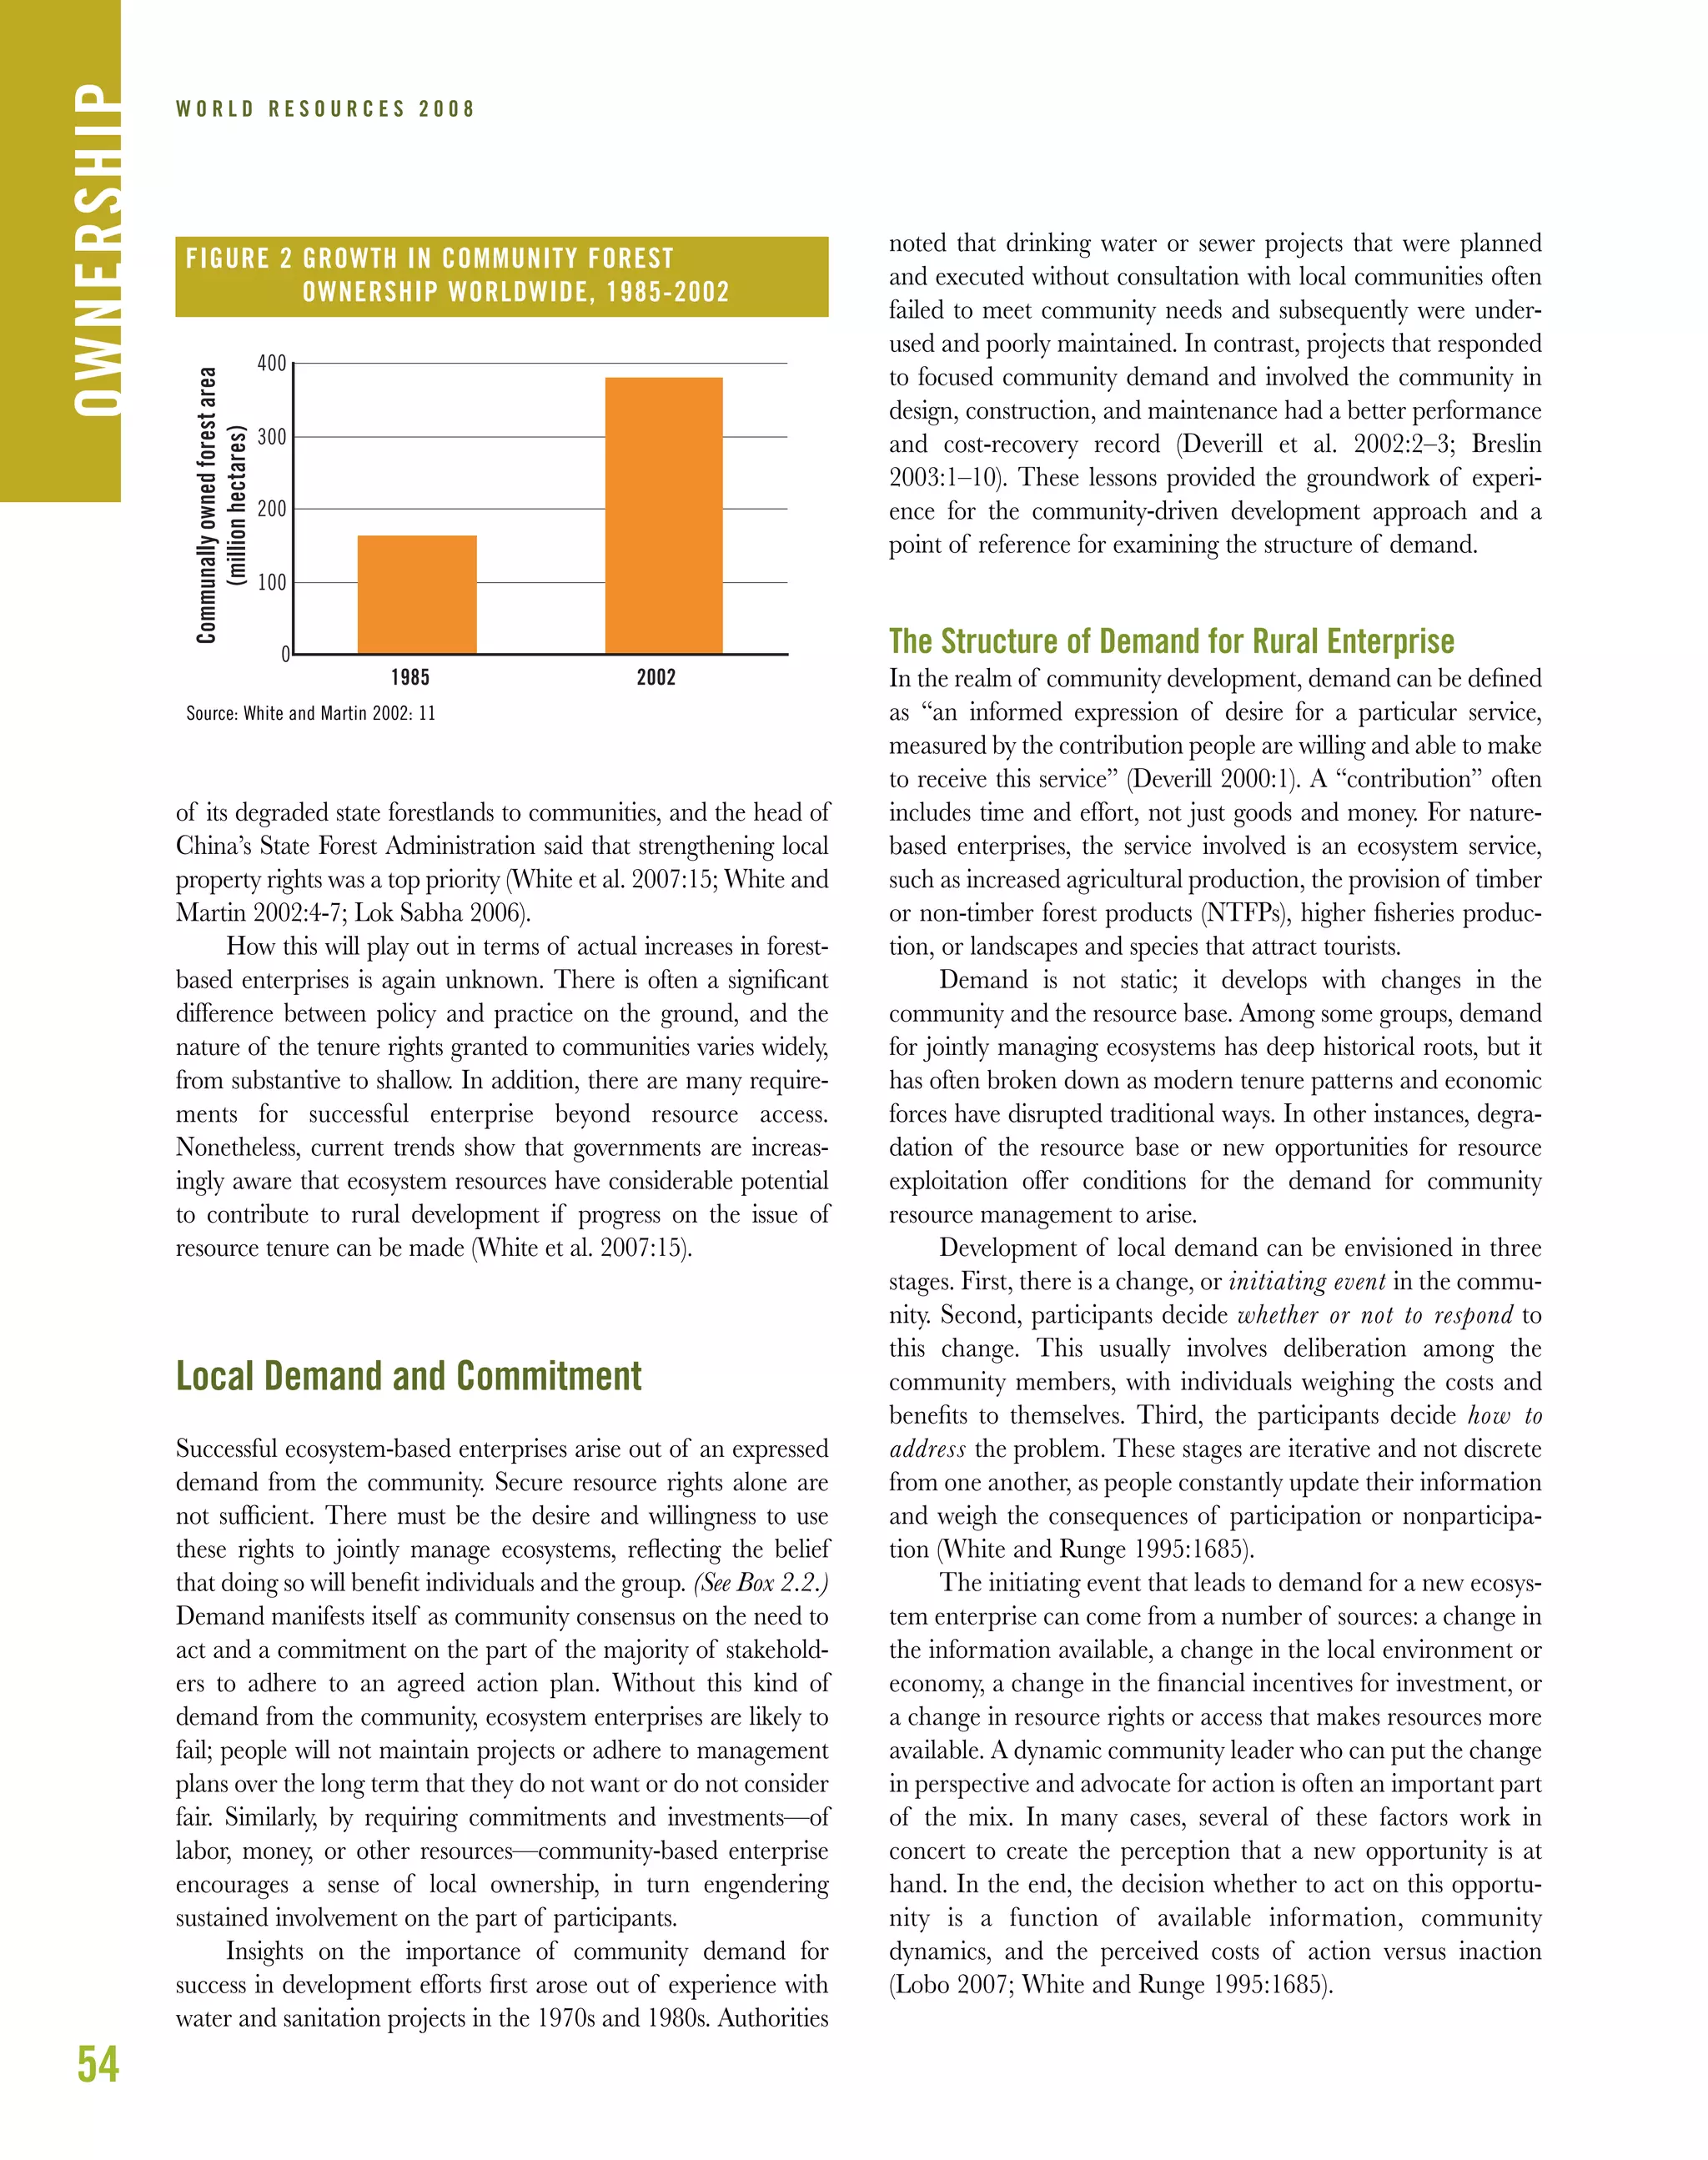
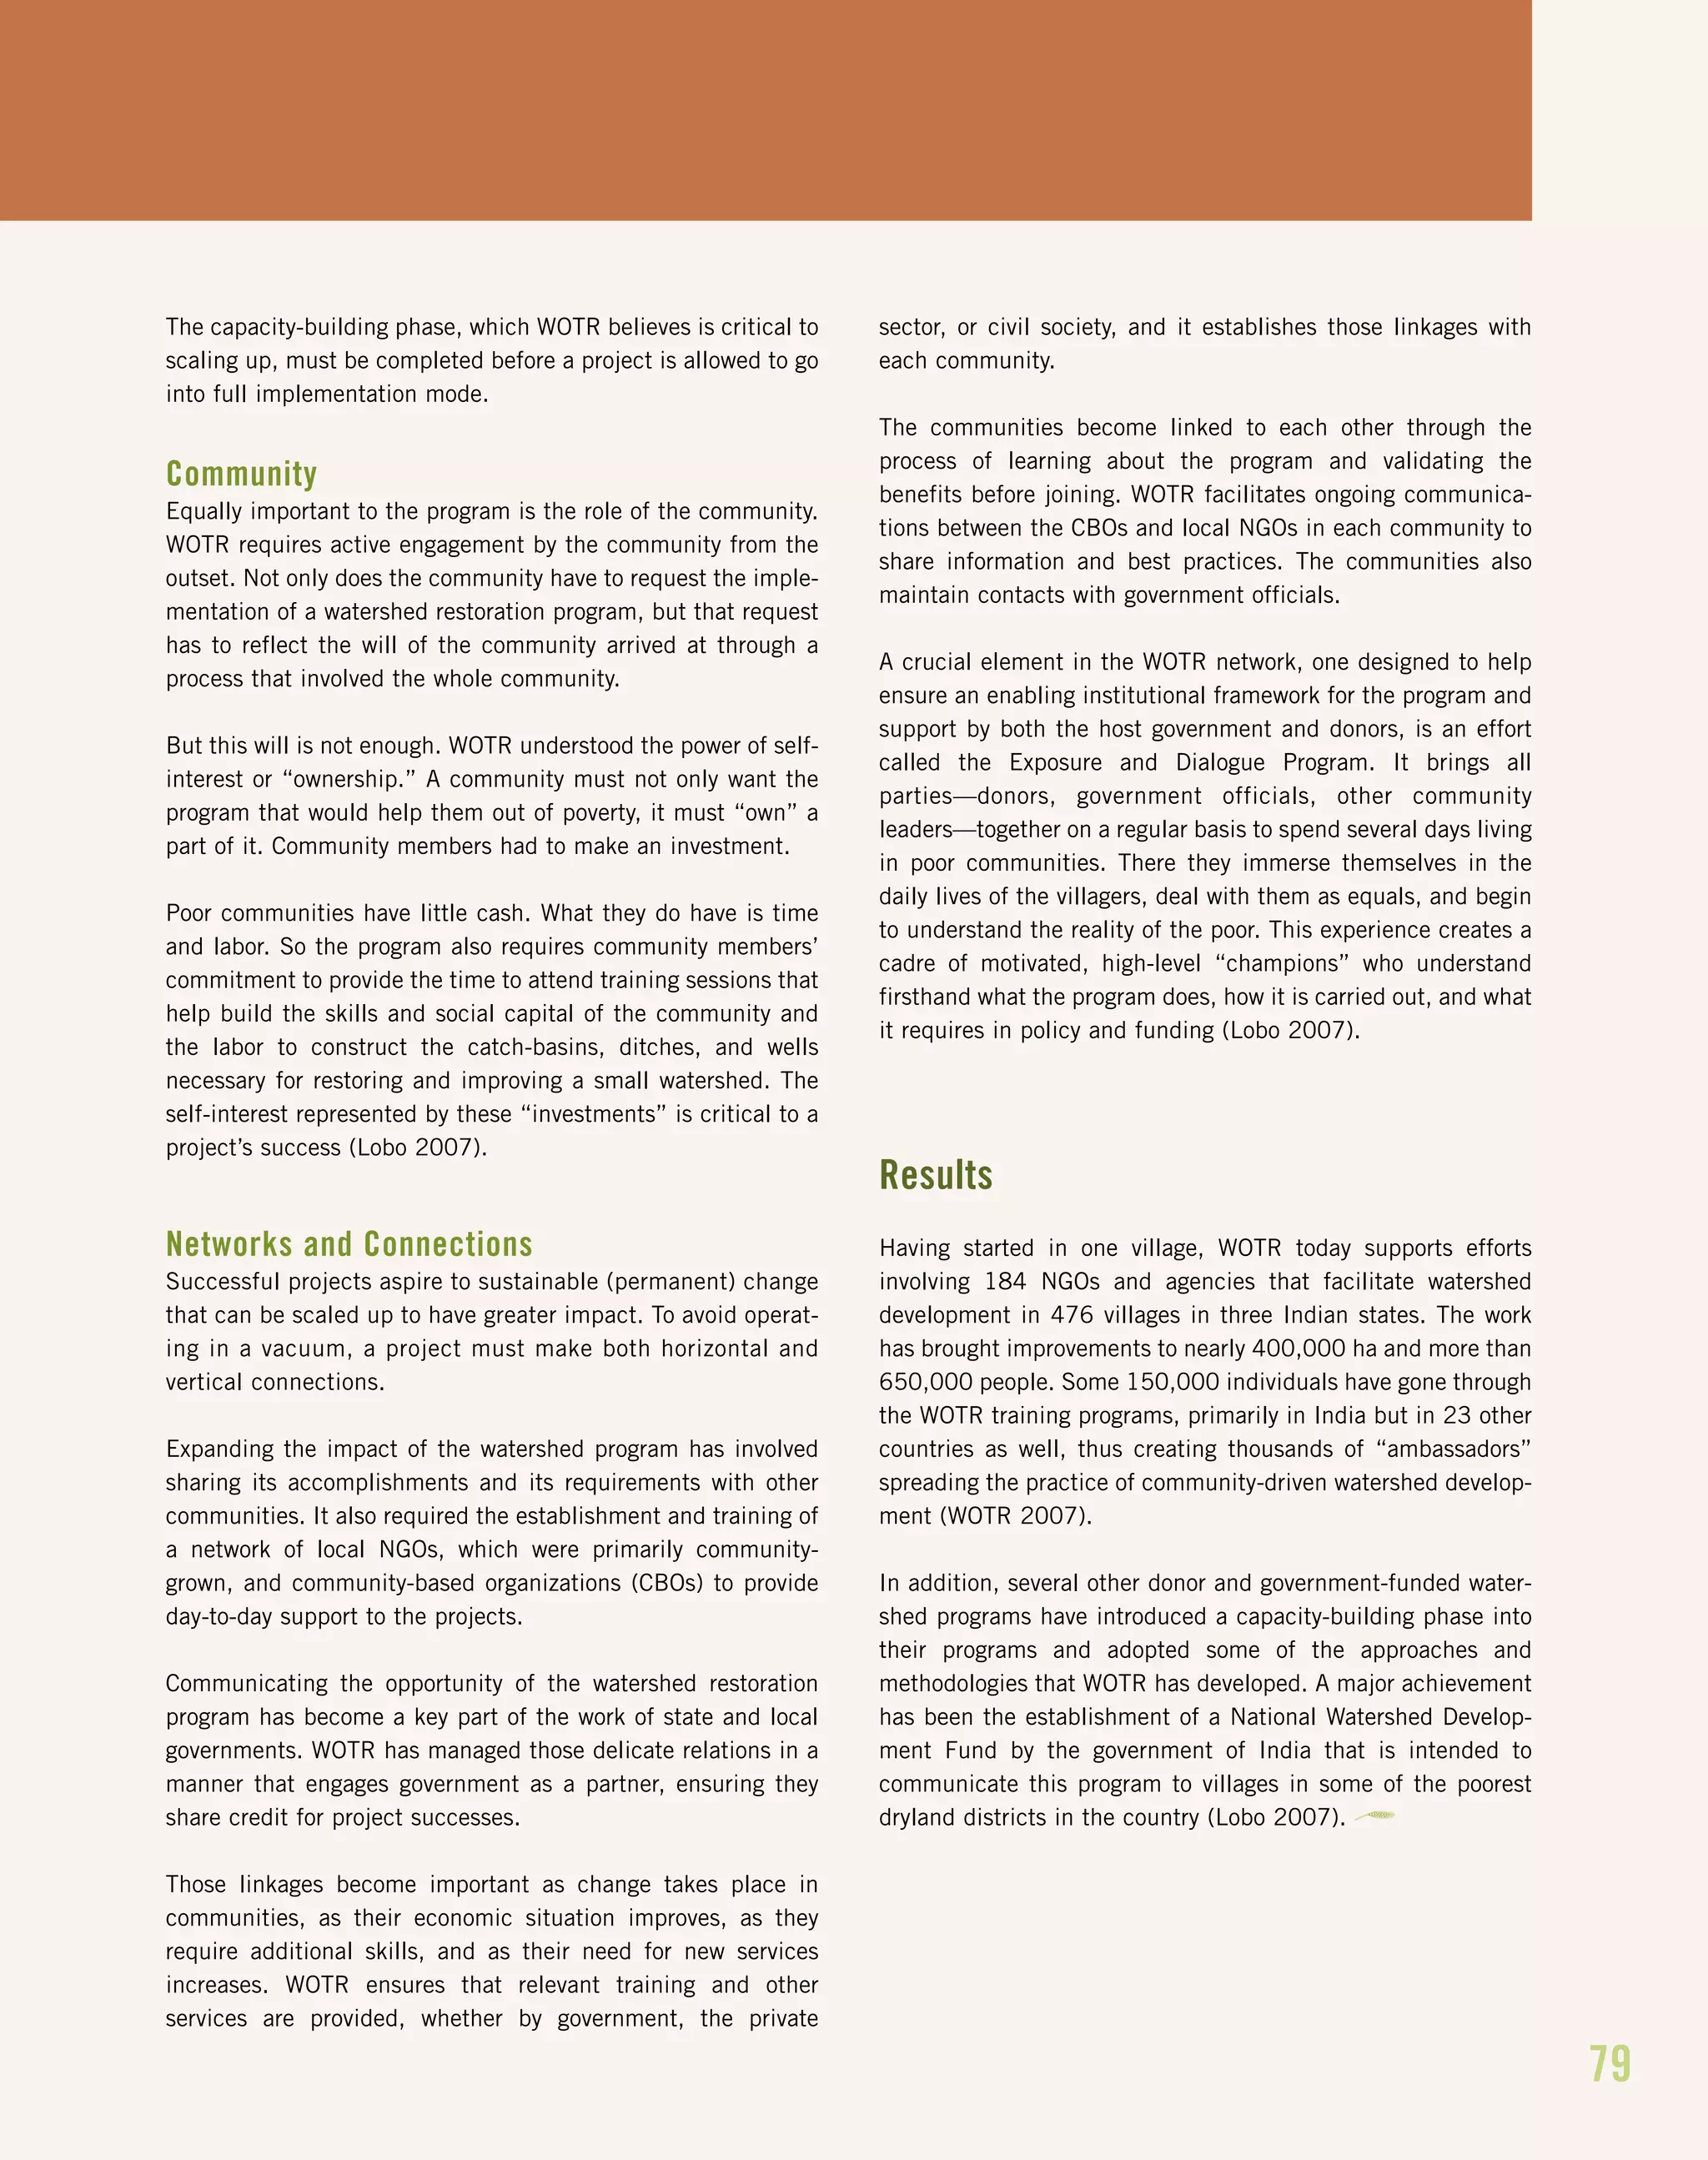
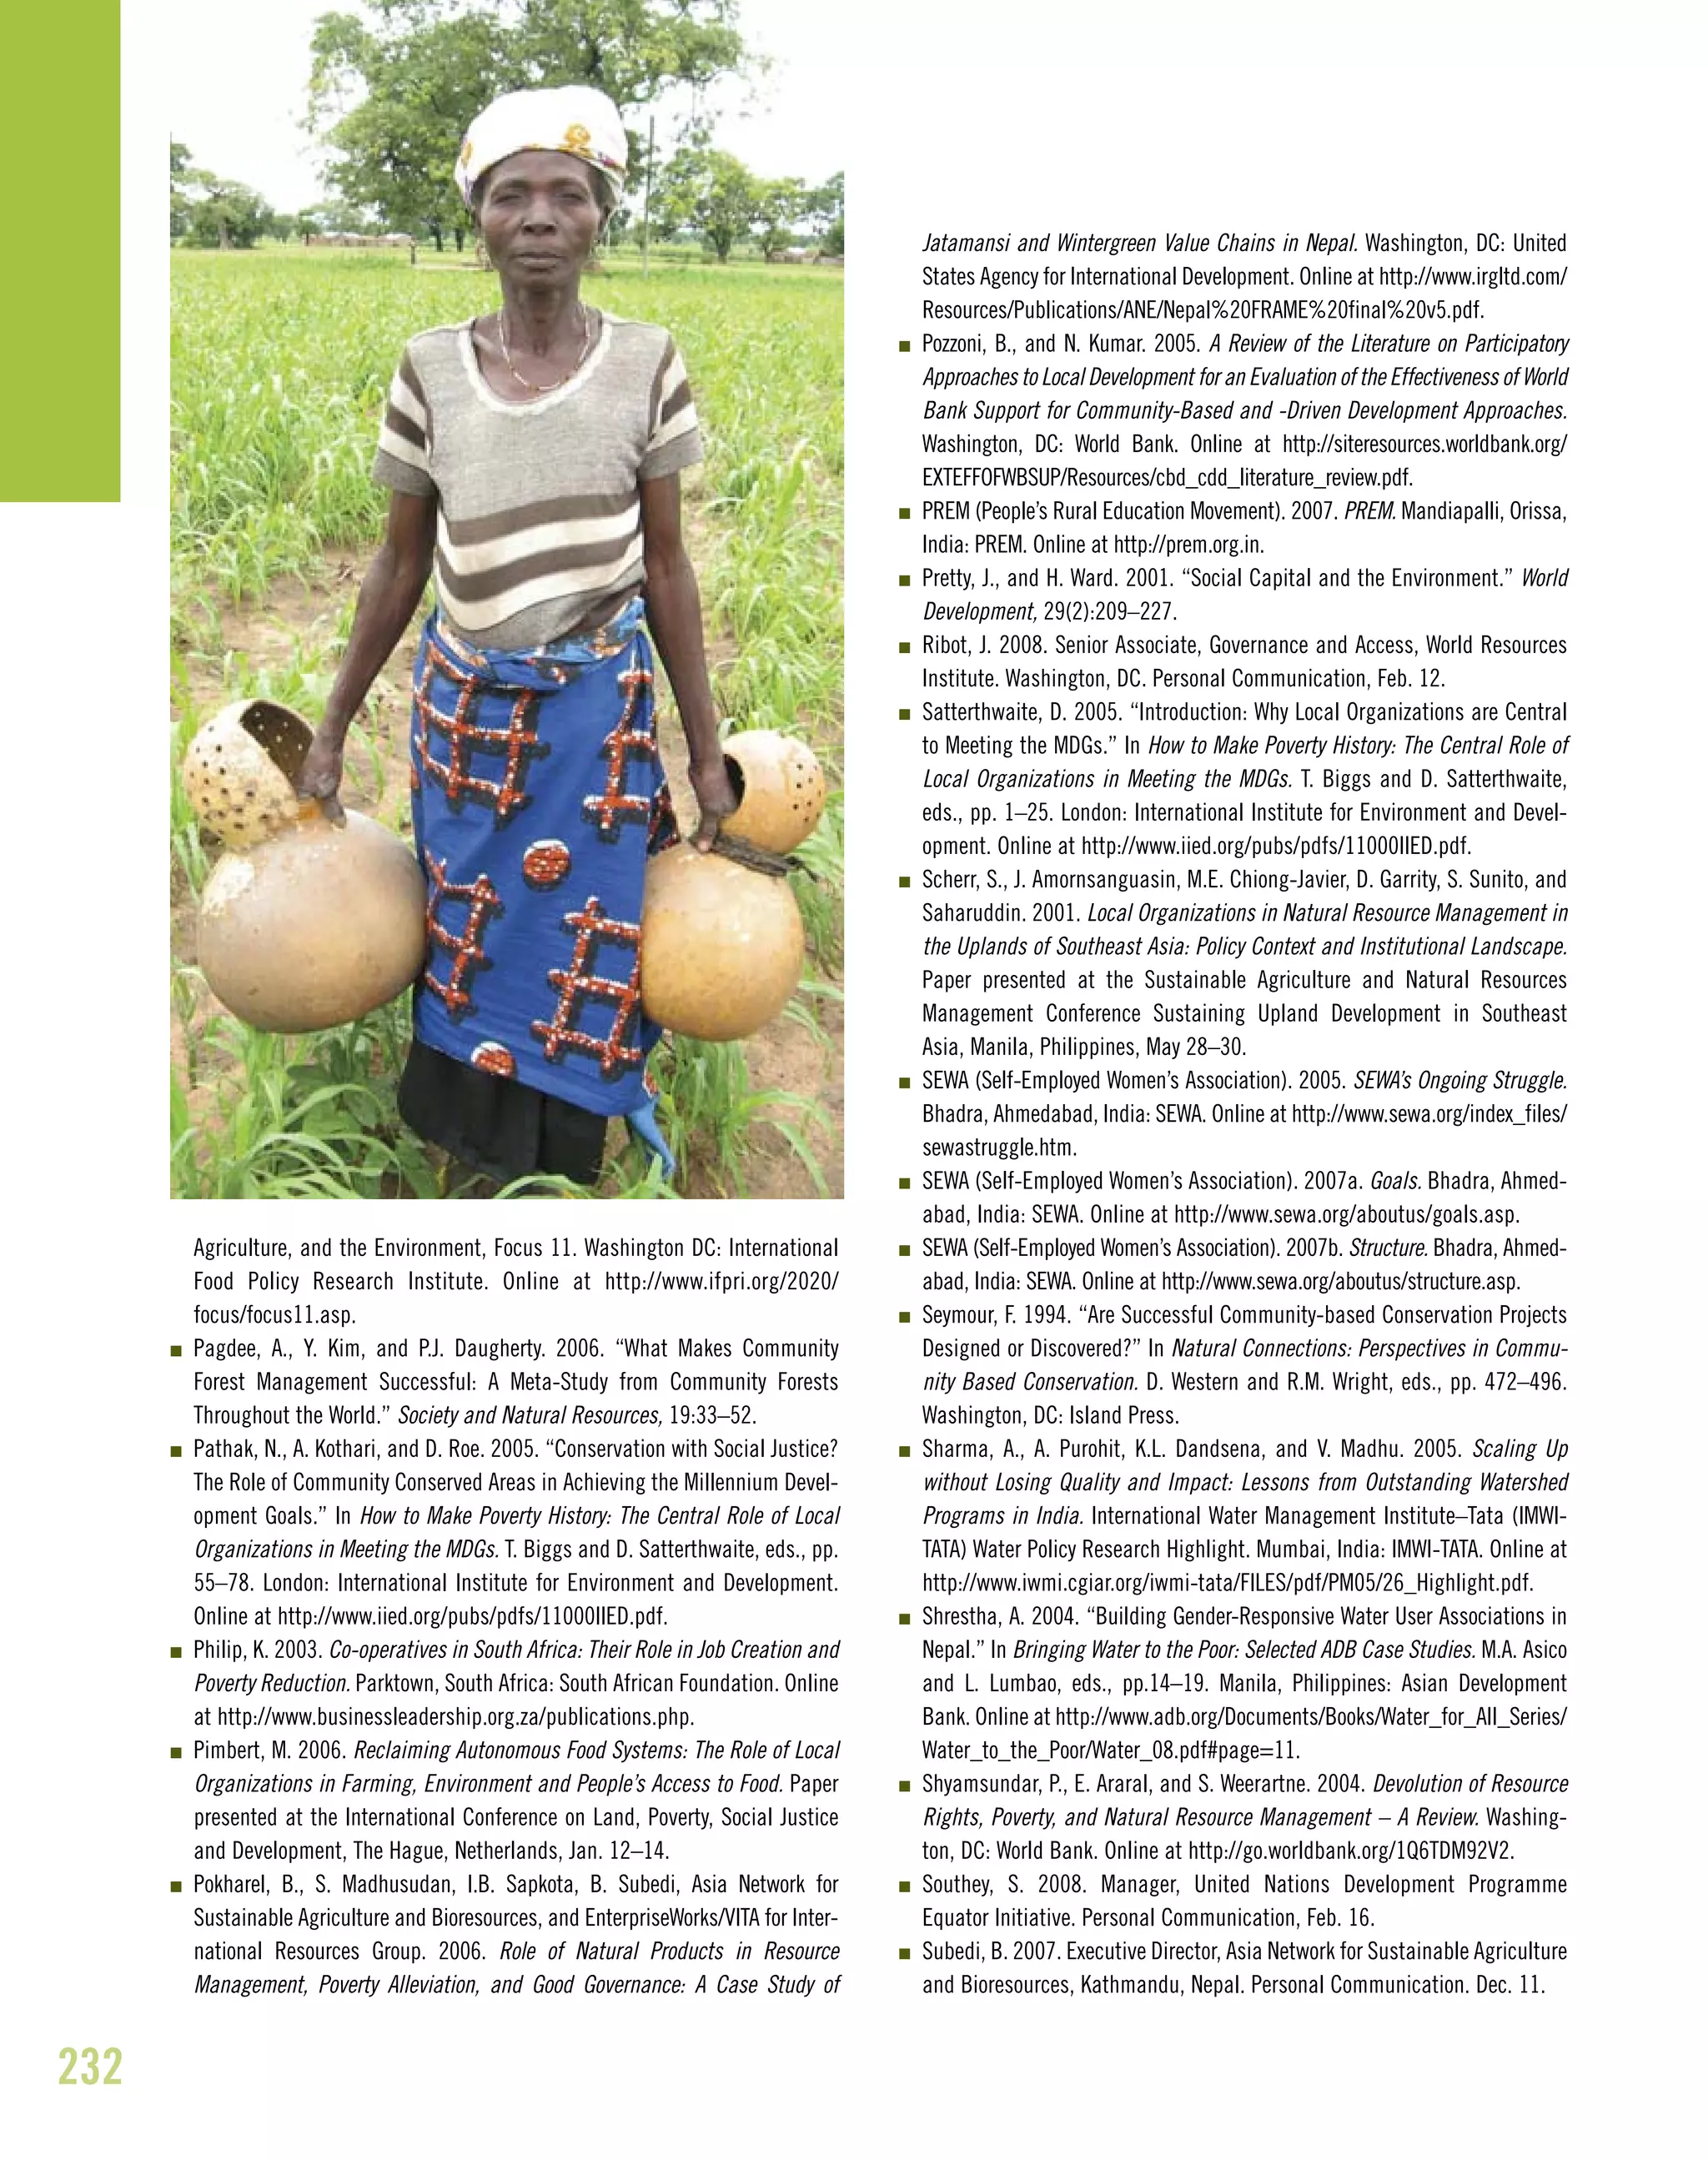
The most immediate benefit for most families practicing
FMNR is the availability of fuelwood from pruned tree
branches. From the first year, communities are able to harvest
light firewood and from the second year to cut branches to sell
in local markets for much-needed extra income. According to
conservative SIM estimates, farmers regenerating 40 stumps on
a 1-ha field could earn an additional 70,000 CFA francs (about
US$140) per year—half the average annual income of a poor
farming household.
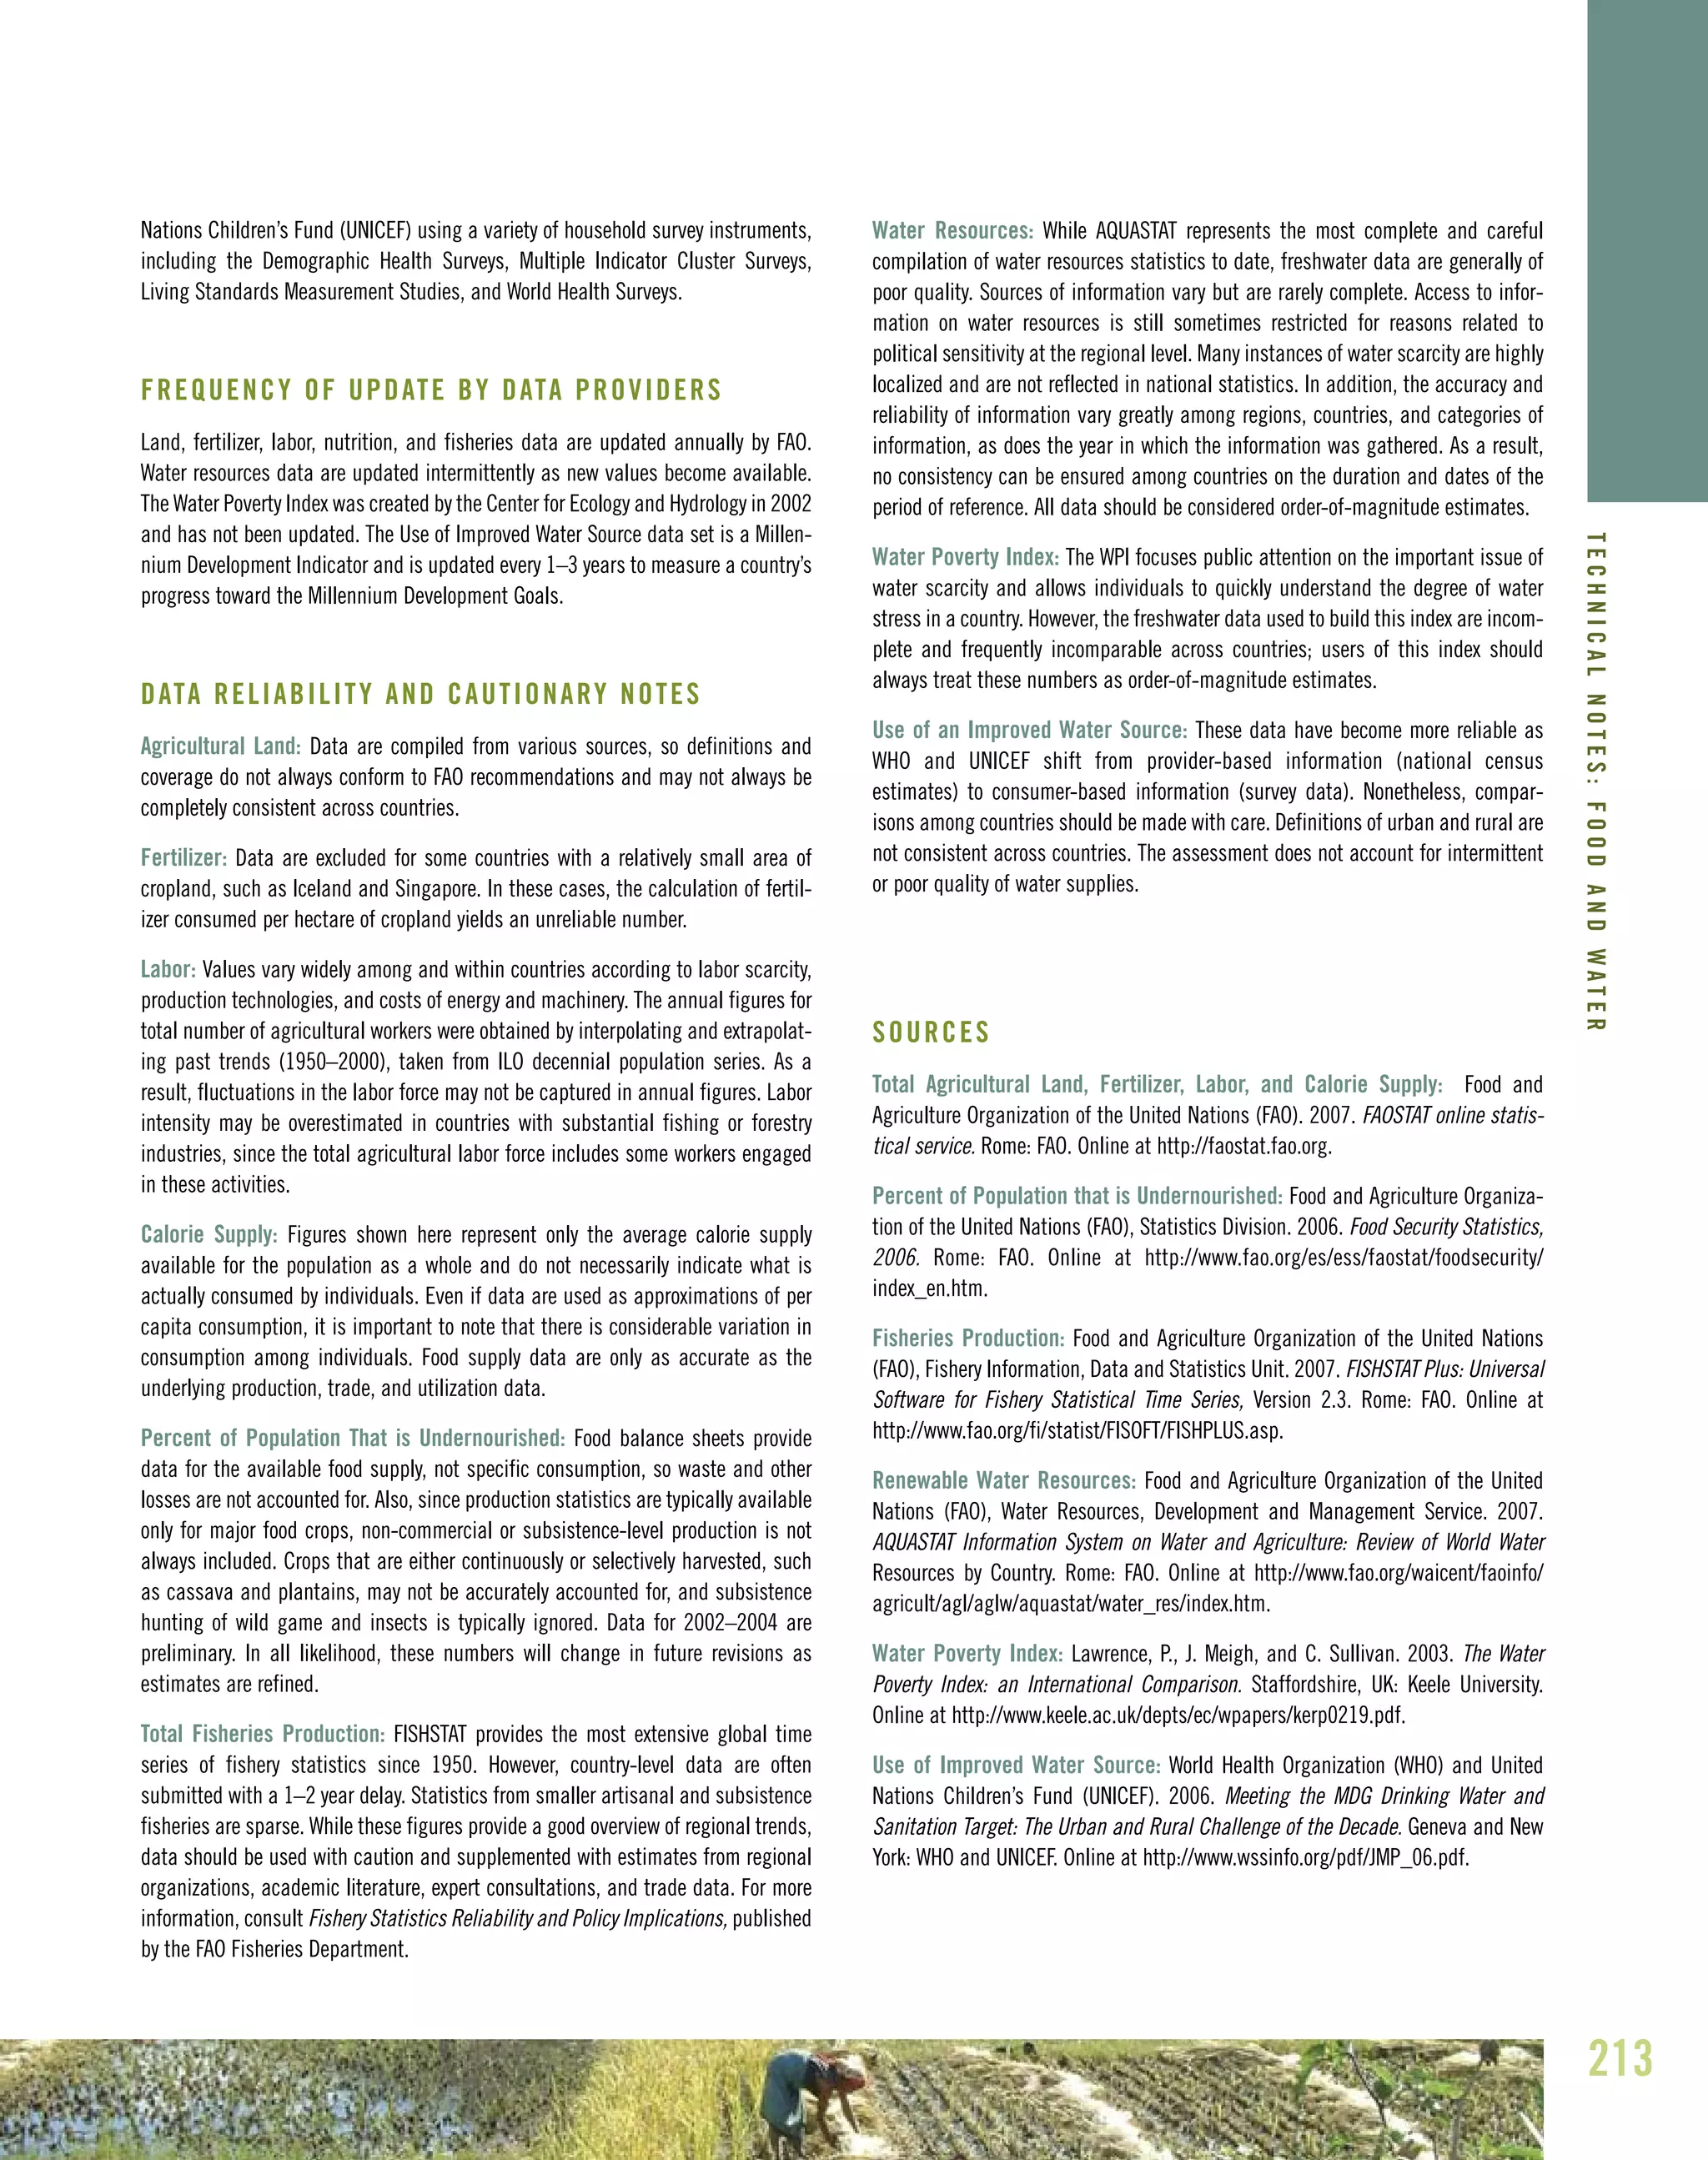
By 2004, researchers had recorded steep increases in
fuelwood and fodder production in FMNR communities, with
majorities of villagers gaining income from one or other
product. Earlier studies indicate that in 100 Maradi villages
alone, about US$600,000 worth of wood was sold between
1985 and 1997 (SIM 1999, as cited by Rinuado 2005a:14). And
survey results from across villages with land rehabilitation
projects demonstrate that residents perceive a marked decrease
in poverty around them as a result of the projects (Abdoulaye
and Ibro 2006:40).
Crop Income
Revegetation also improves the traditionally poor fertility of
Niger’s soils, which in turn boosts crop production. Bush trees
dotted across fields help hold soil in place, reducing wind and
water erosion (Guéro and Dan Lamso 2006:15). Native trees and
shrubs draw up nutrients and distribute them in the topsoil at the
same time that falling leaves and trimmings are used as mulch
(Rinaudo 2005a:12). Livestock and birds attracted to tree shade
and branches leave droppings that fertilize the soil (Rinaudo
2005a:12). Moreover, the growing season on land with trees is
longer because farmers only have to sow once, compared with
twice or more on fields unprotected from the elements (Rinaudo
2005a:4; Reij 2008). Such benefits are magnified when farmers
act collectively, as blanket FMNR villages in Maradi and Zinder
regions have discovered. Vegetation in one field affects nearby
land by serving as a windbreak and promoting improved water
infiltration and soil retention (Winterbottom 2007).
All these FMNR benefits, combined with the soil and water
interventions, have resulted in increases in sorghum yields of
between 20 and 85 percent and in millet yields of between 15 and
50 percent in intervention villages (Amoukou 2006:25). Other
studies suggest that millet yields have even consistently doubled in
some FMNR-practicing communities (Tougiani et al. 2008:16).
This has enabled households both to store more food against the
threat of shortages in the dry season and, occasionally, to sell
surplus crops in local markets or for export to neighboring
Nigeria (Reij 2006:ii).
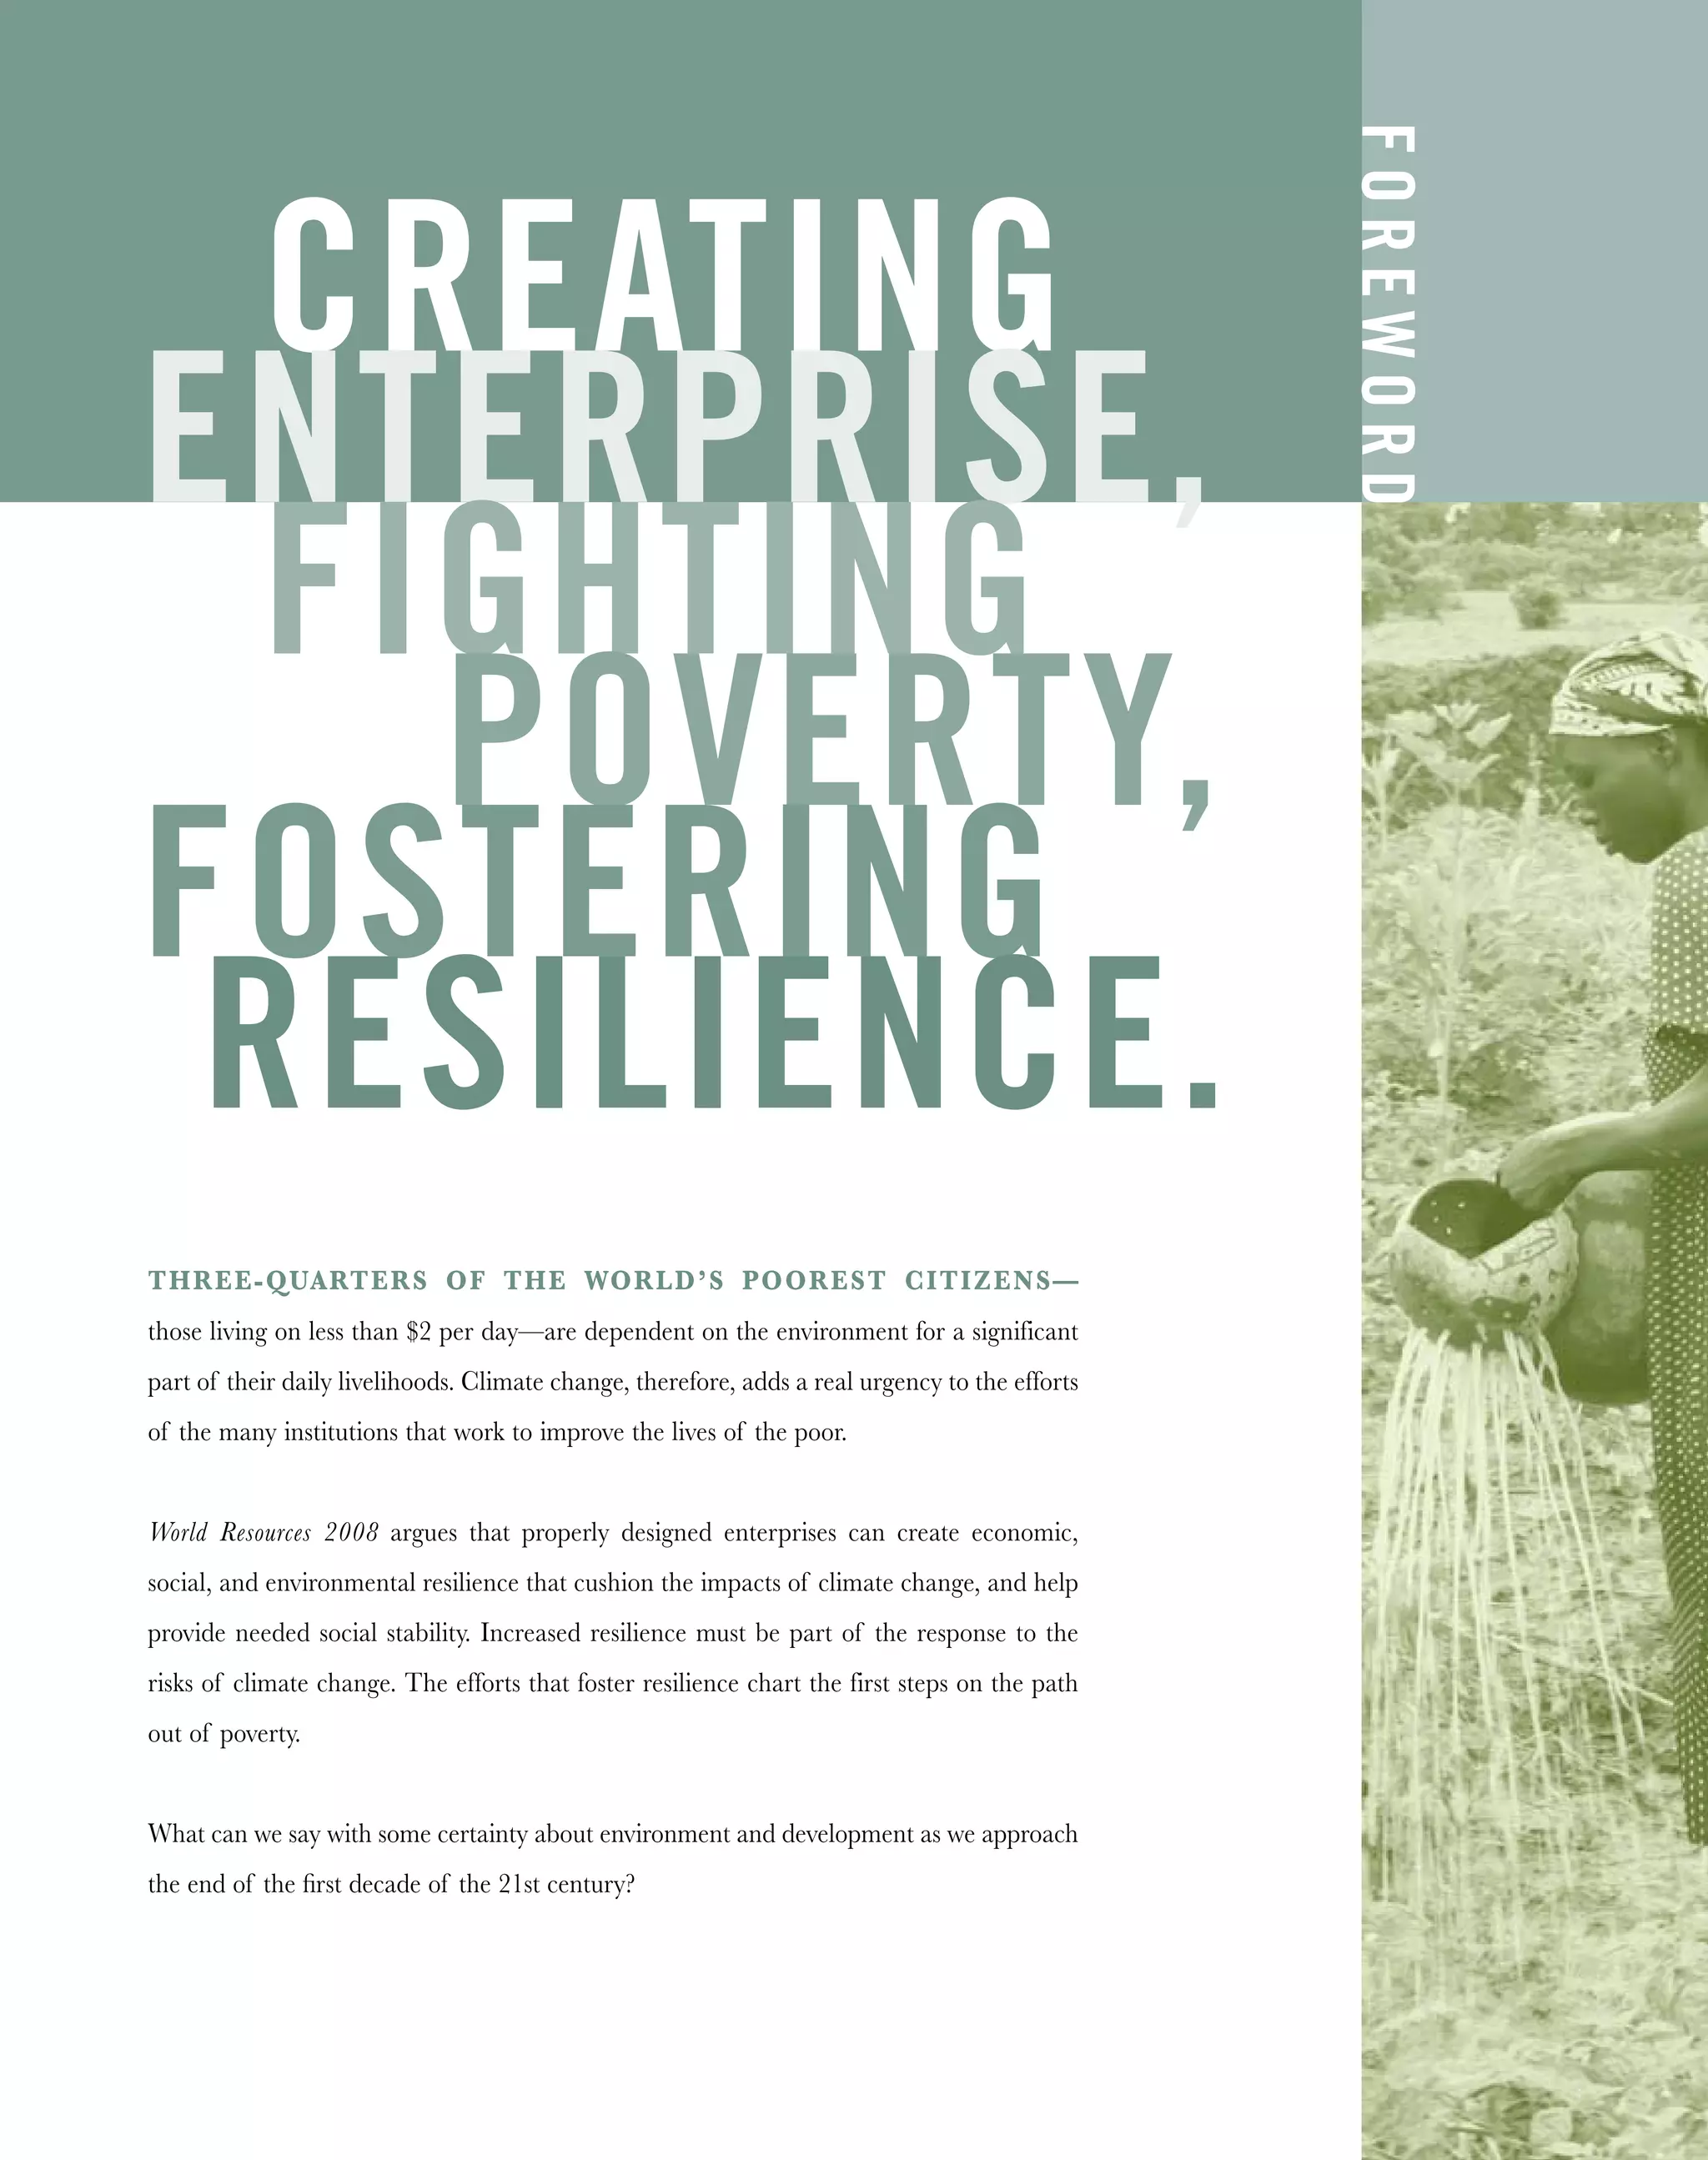
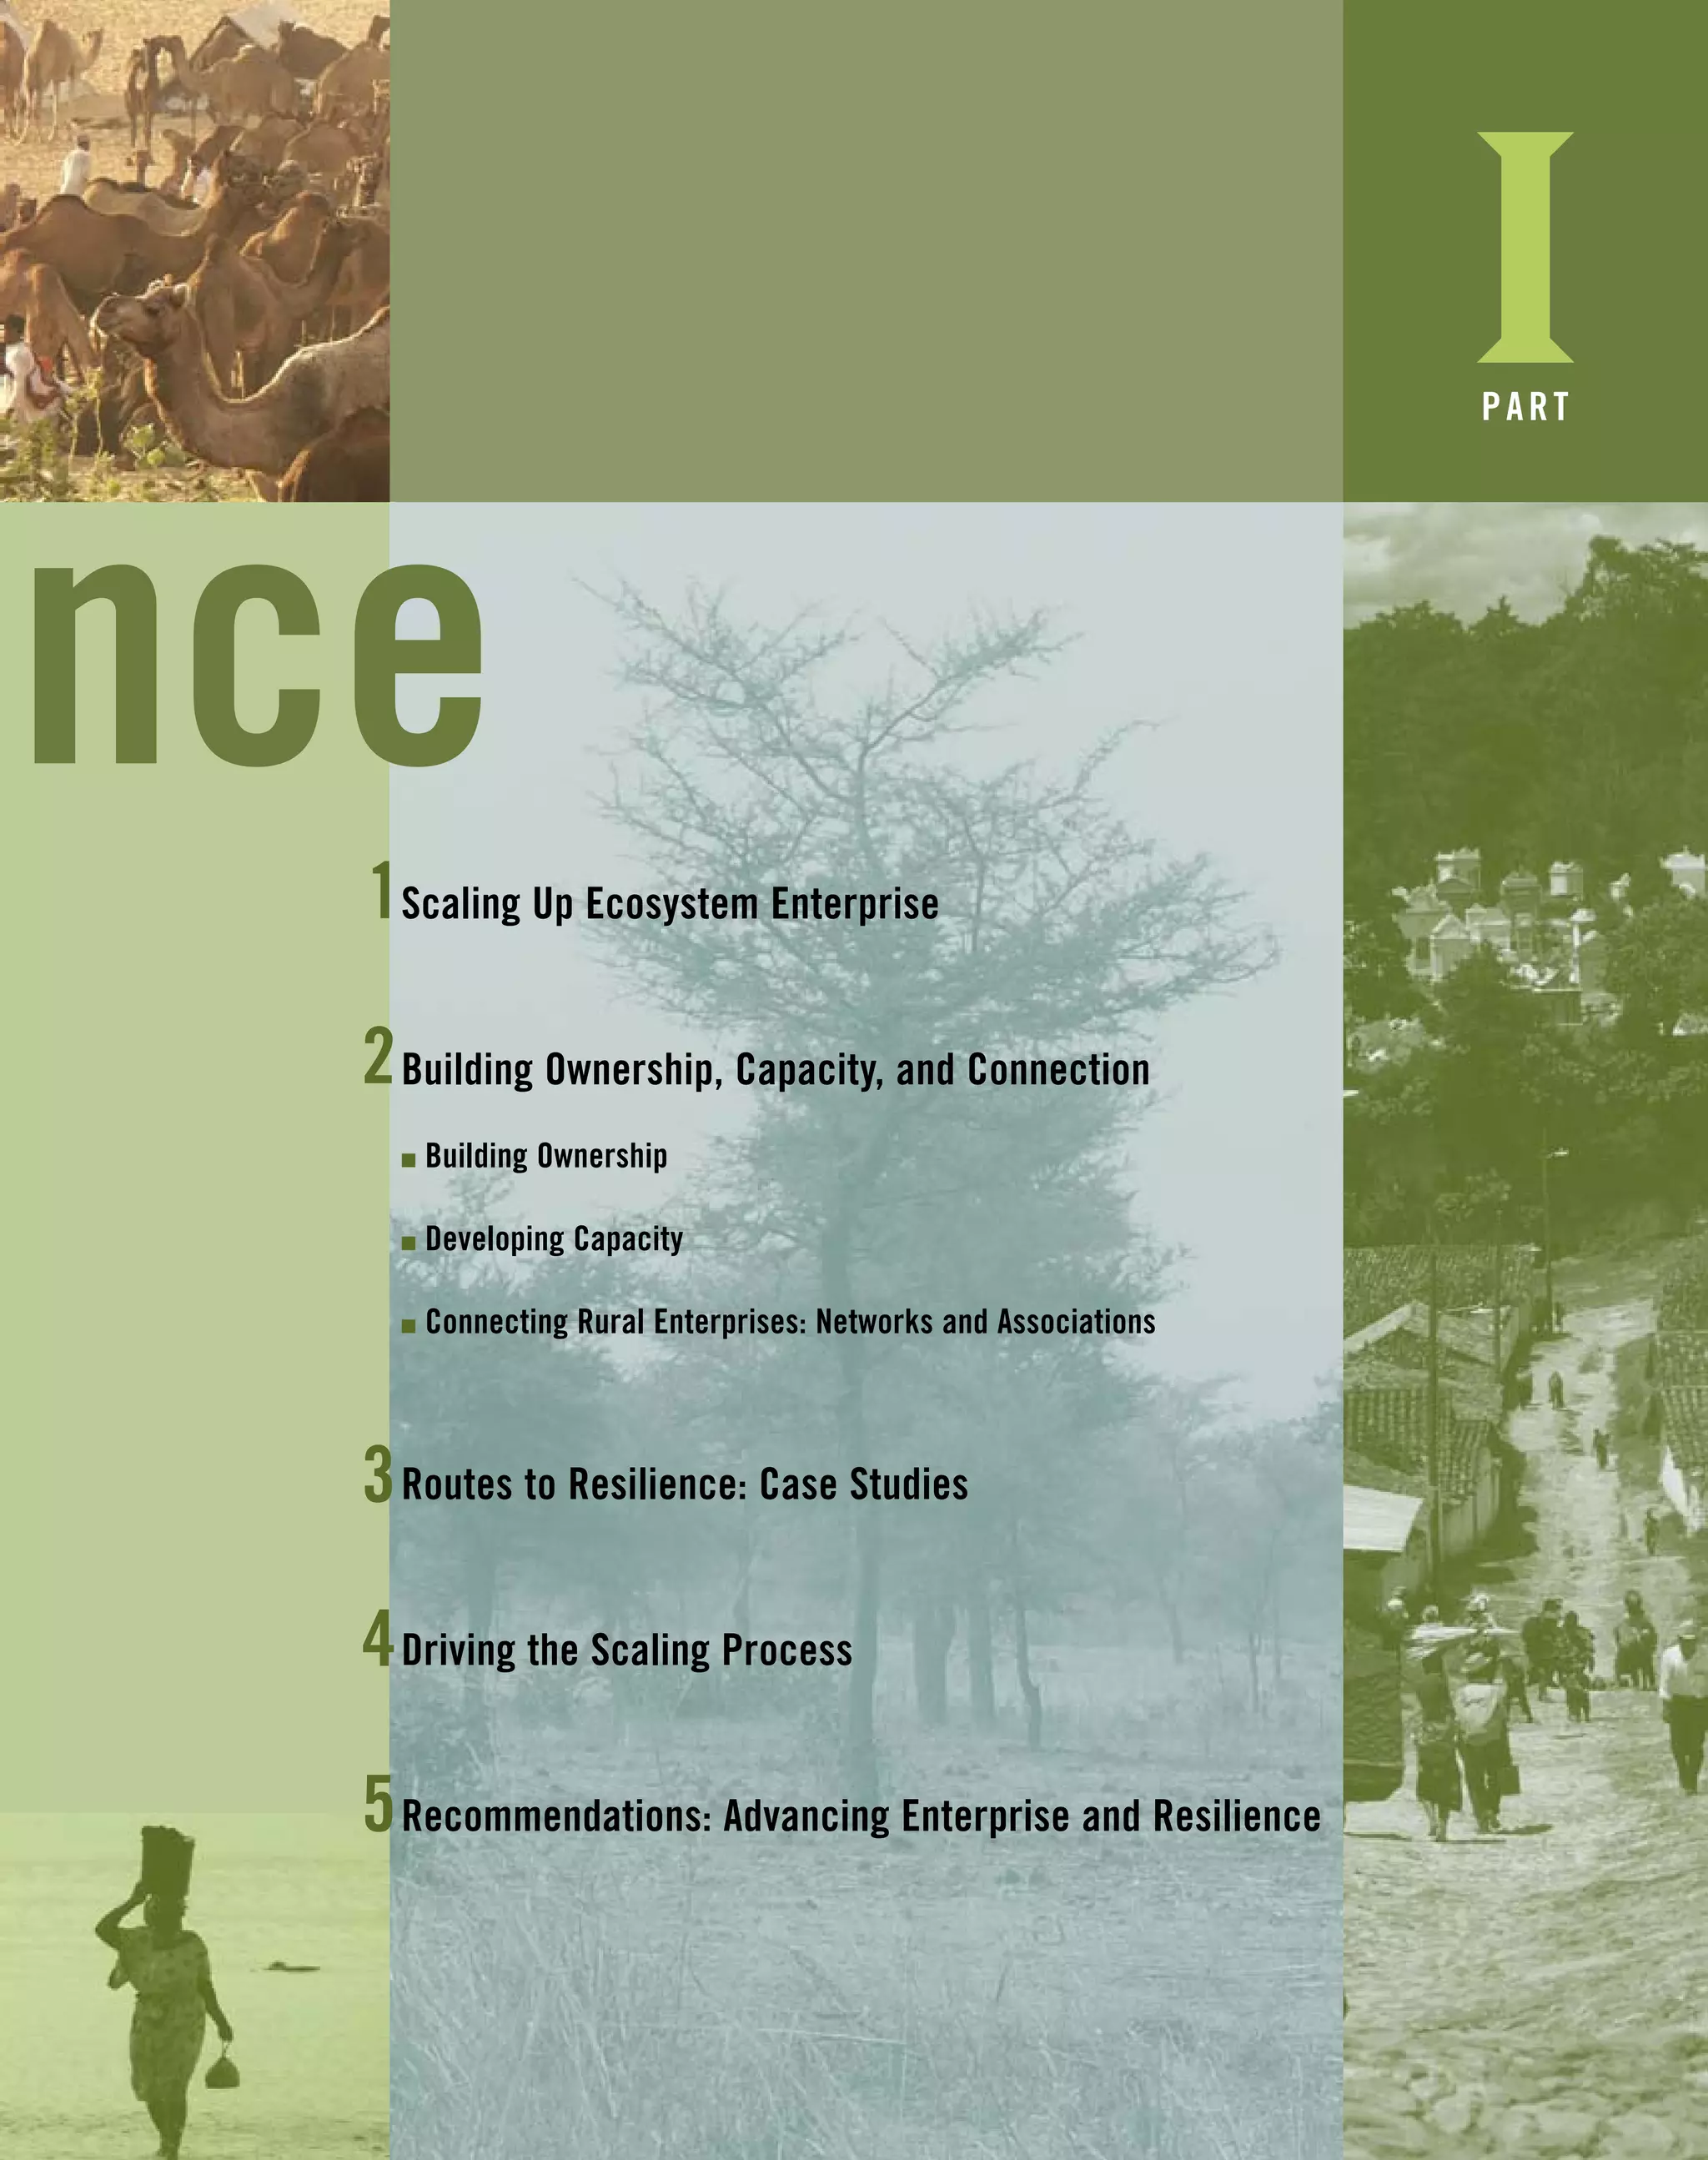
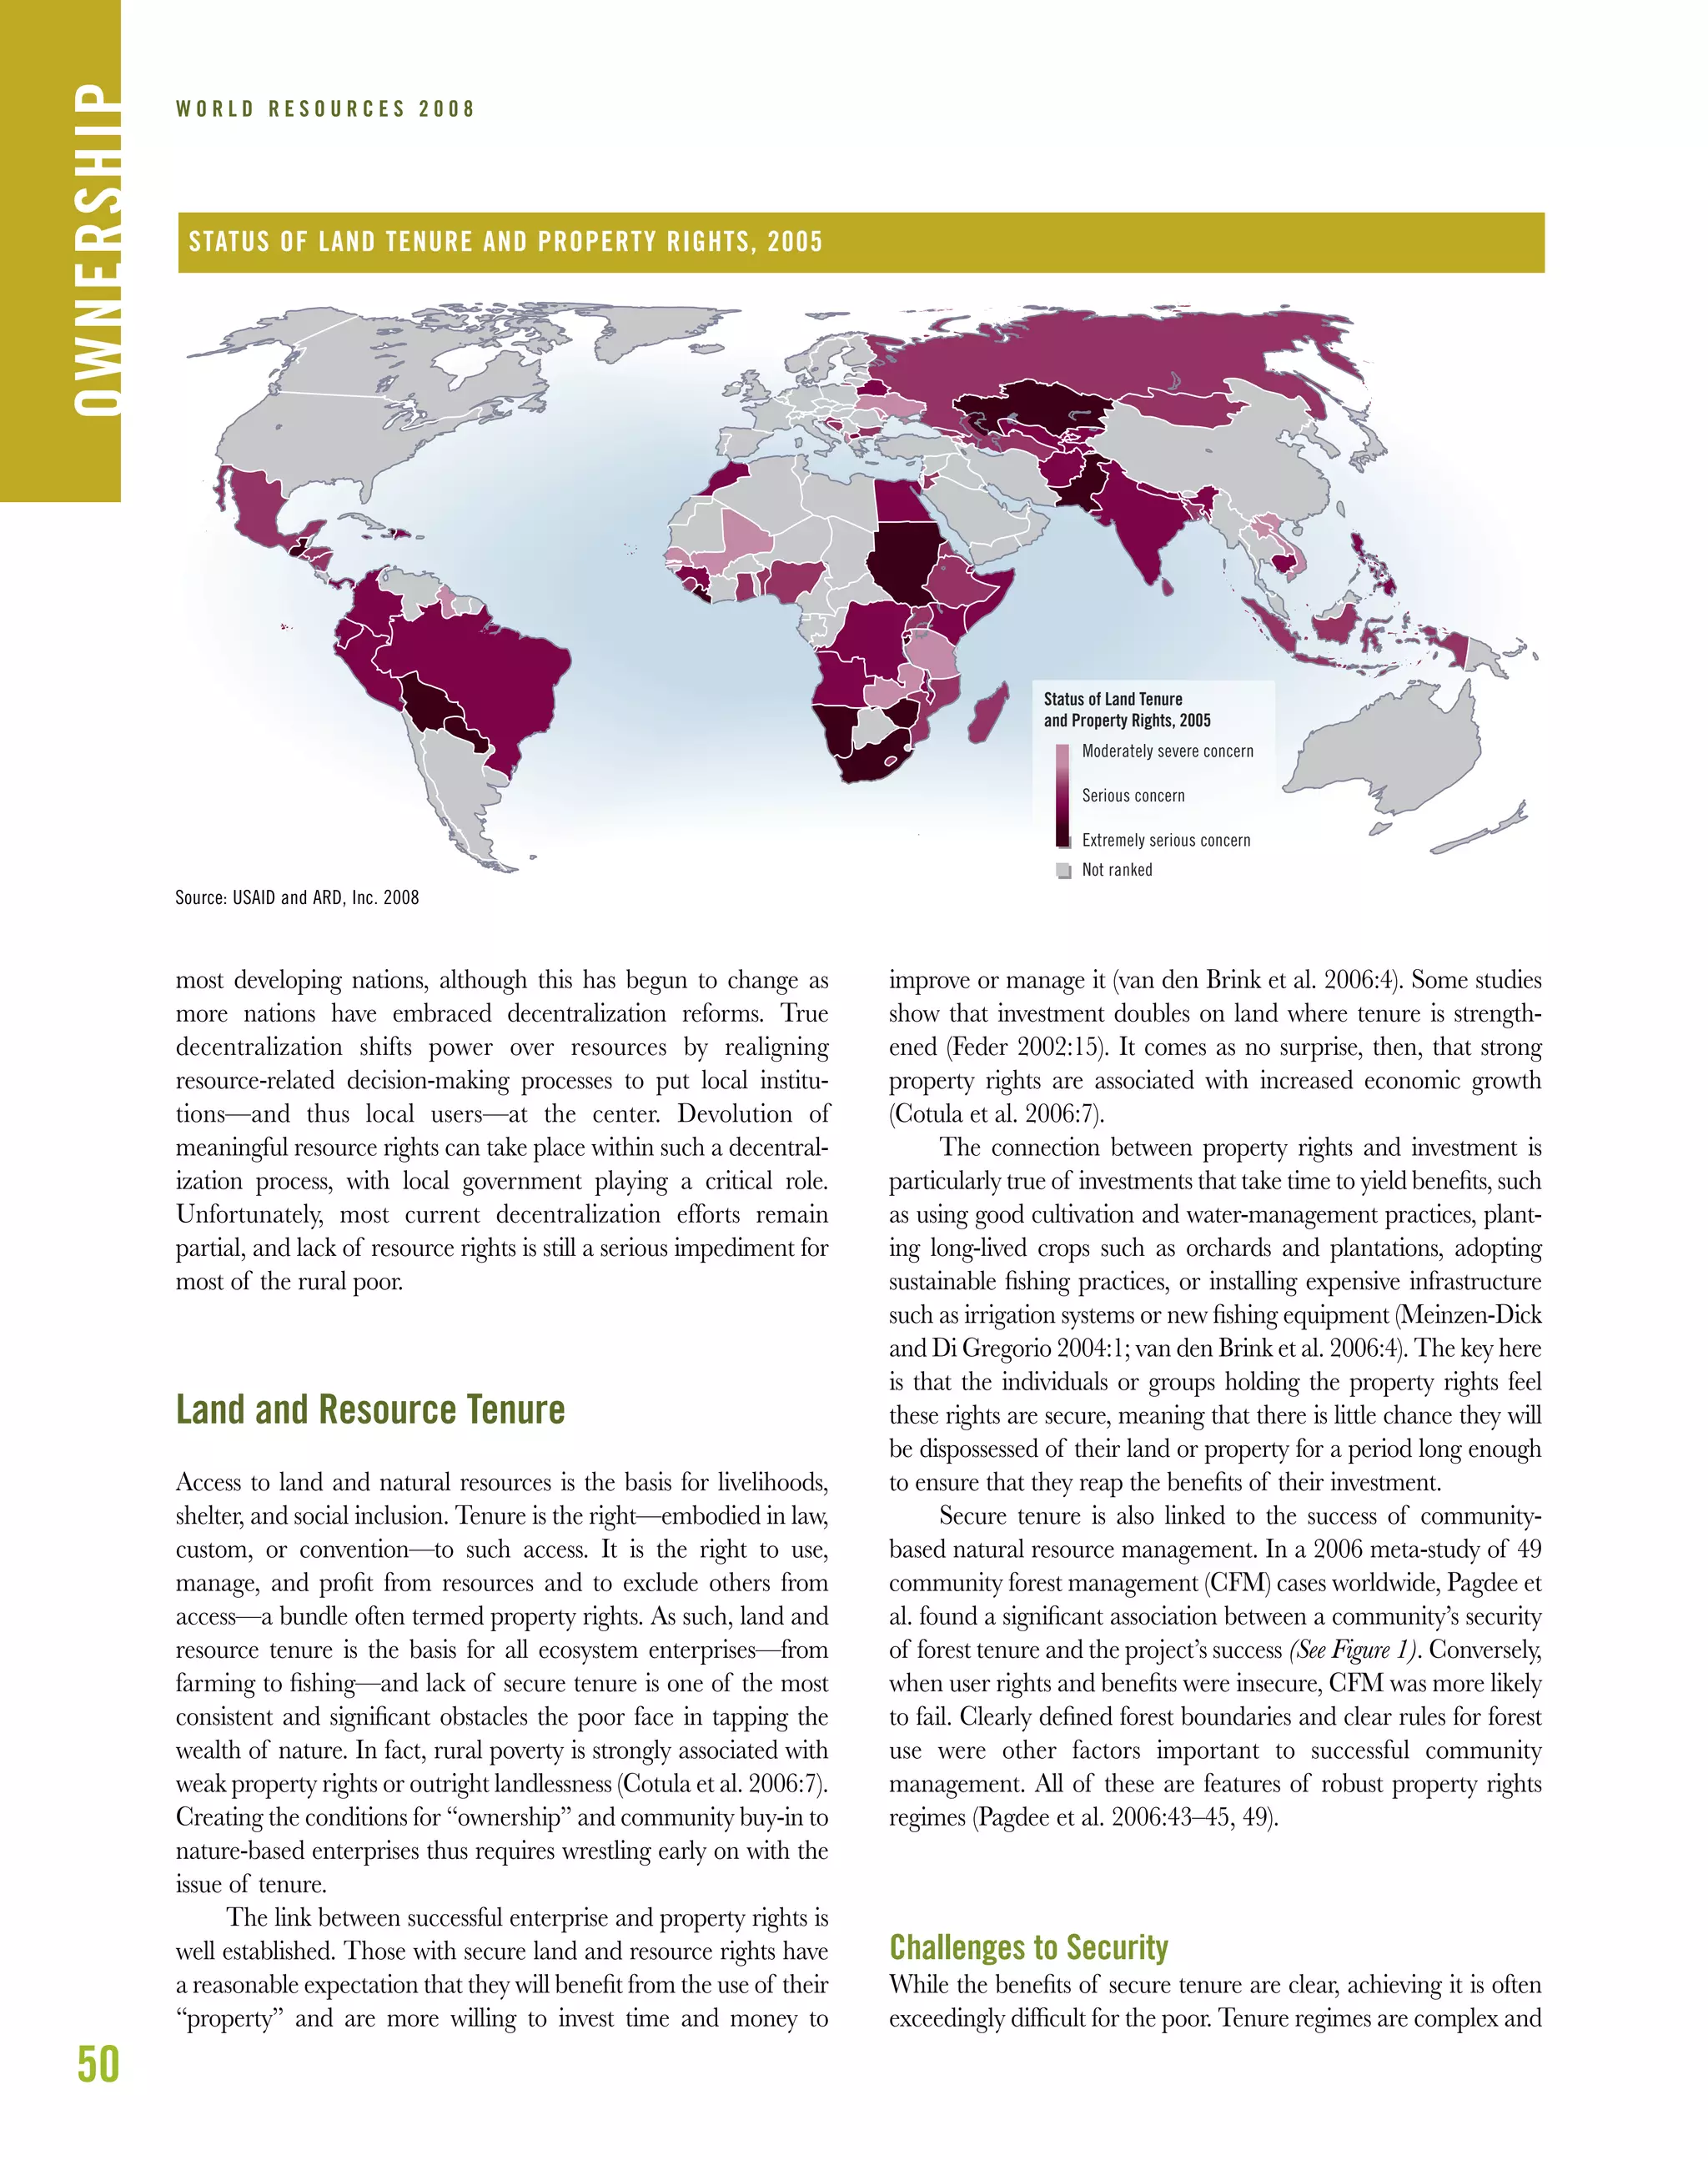
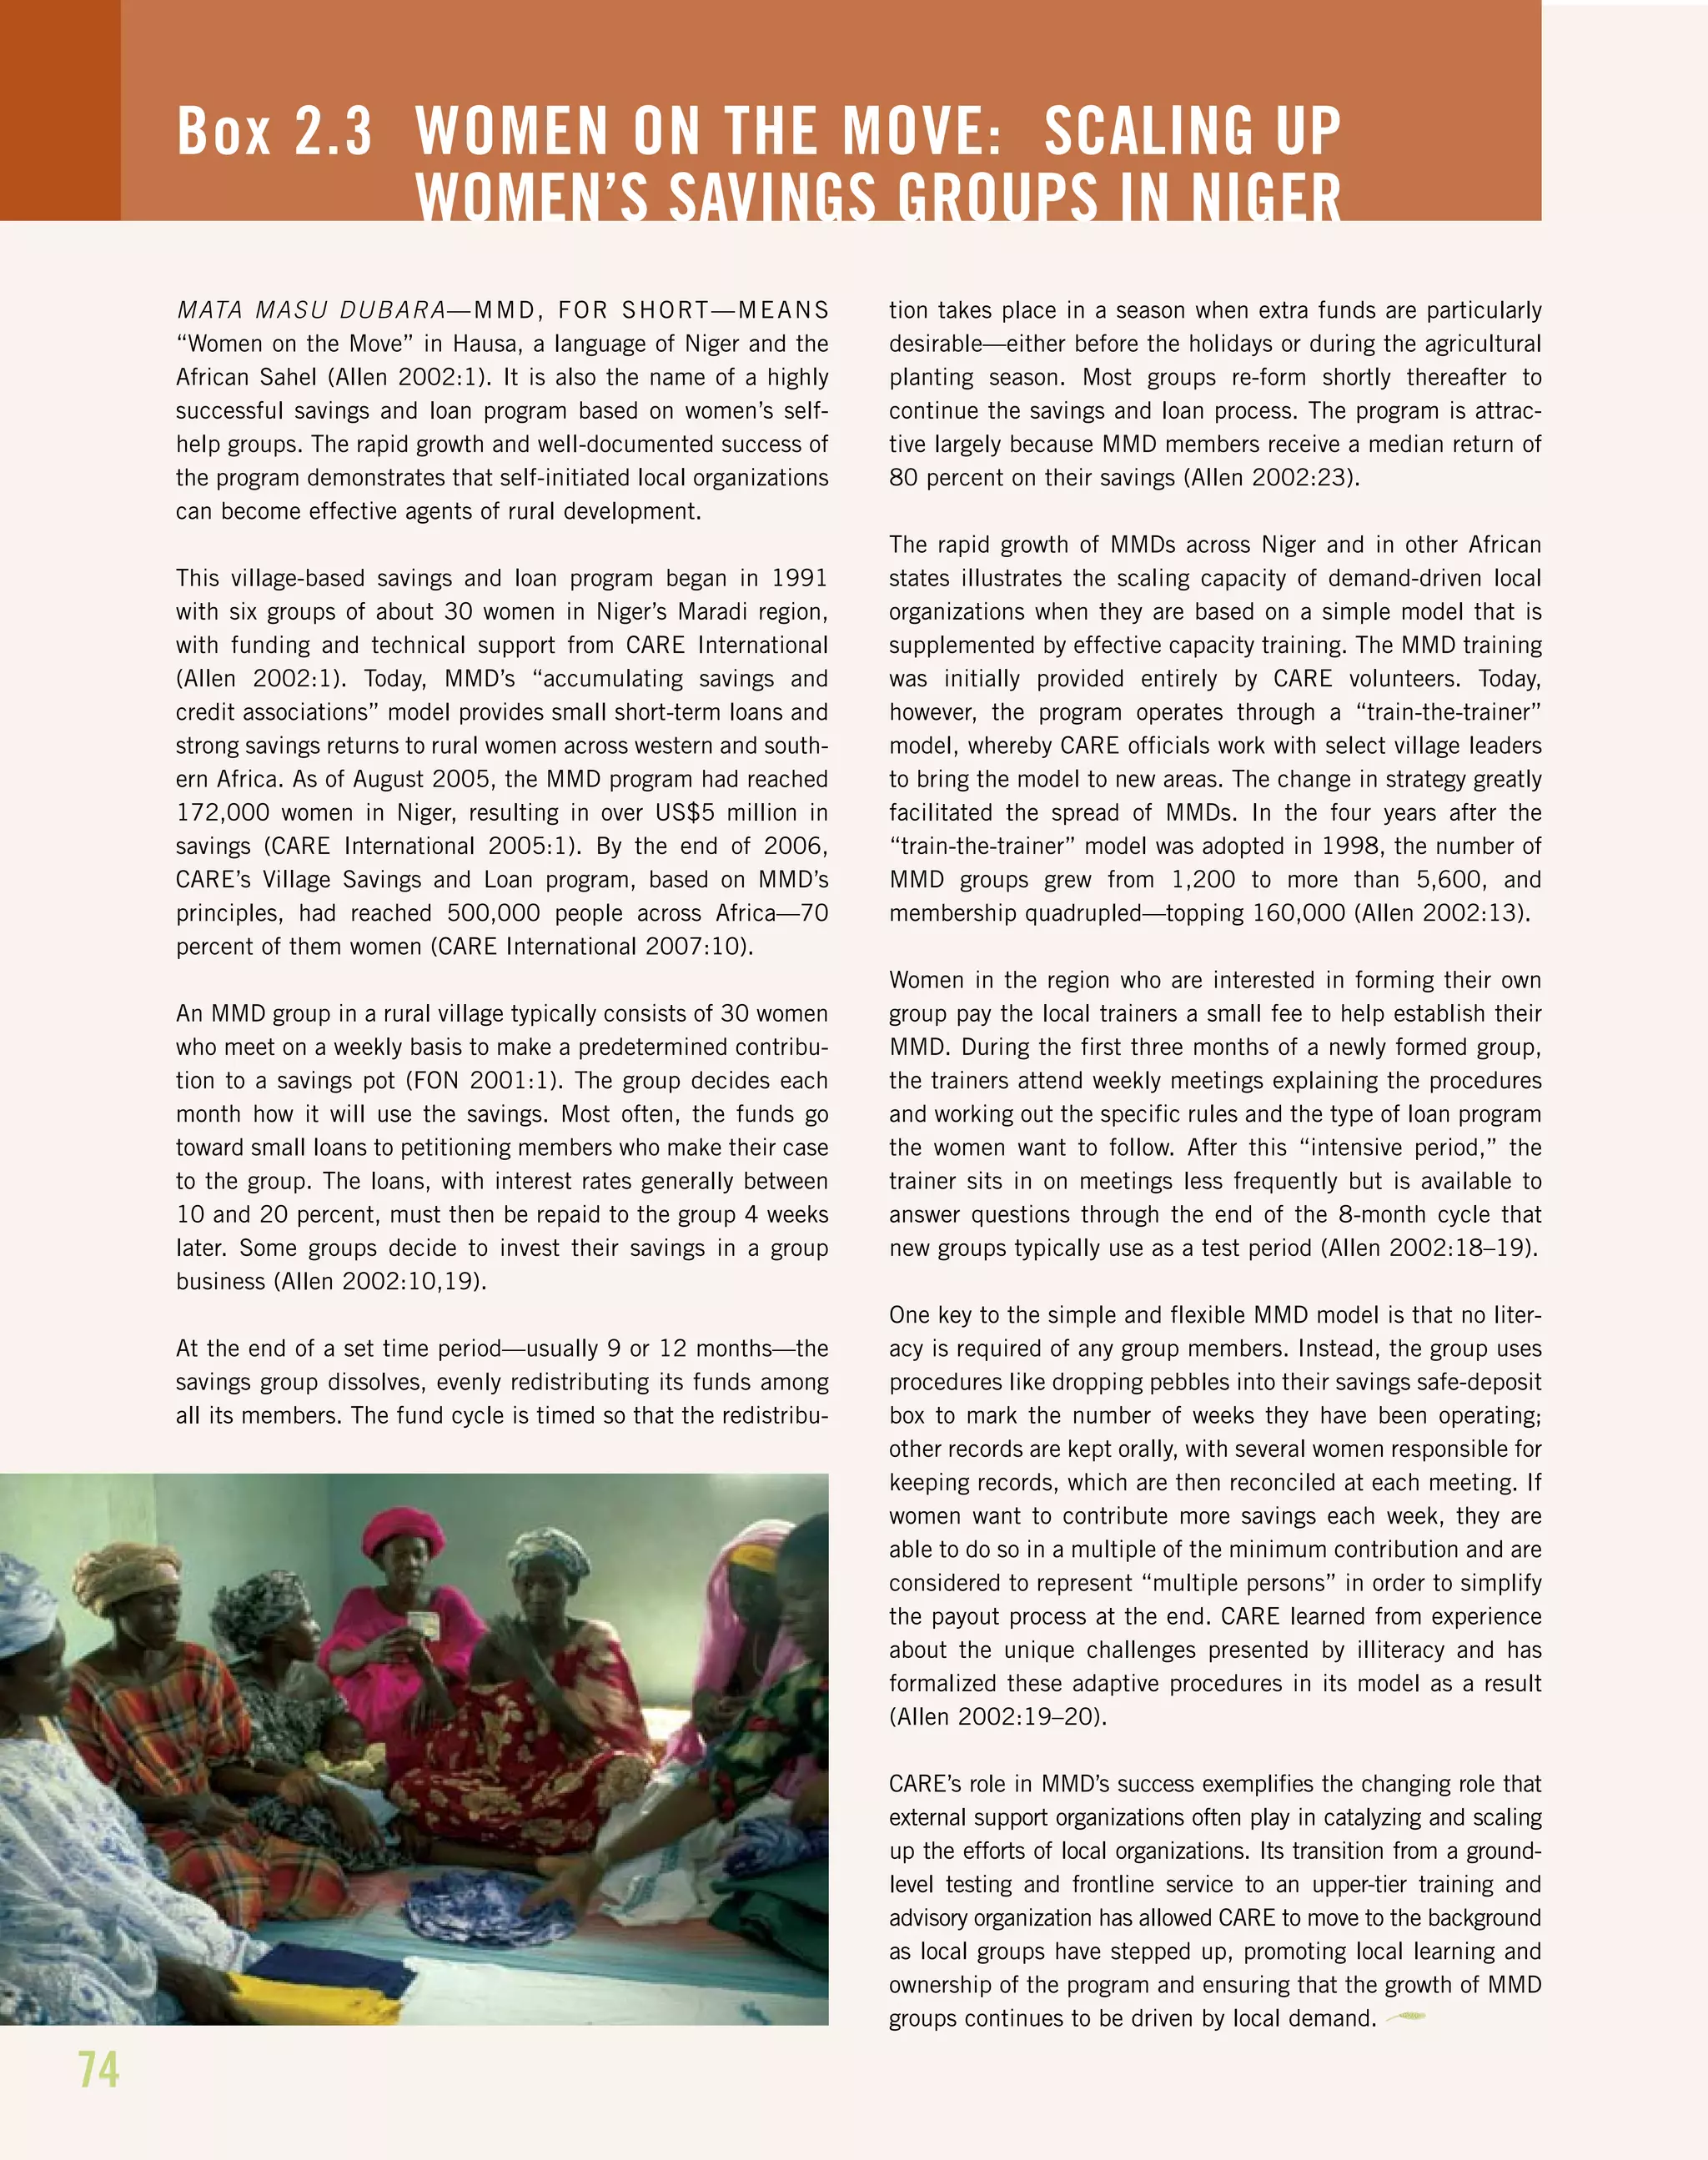
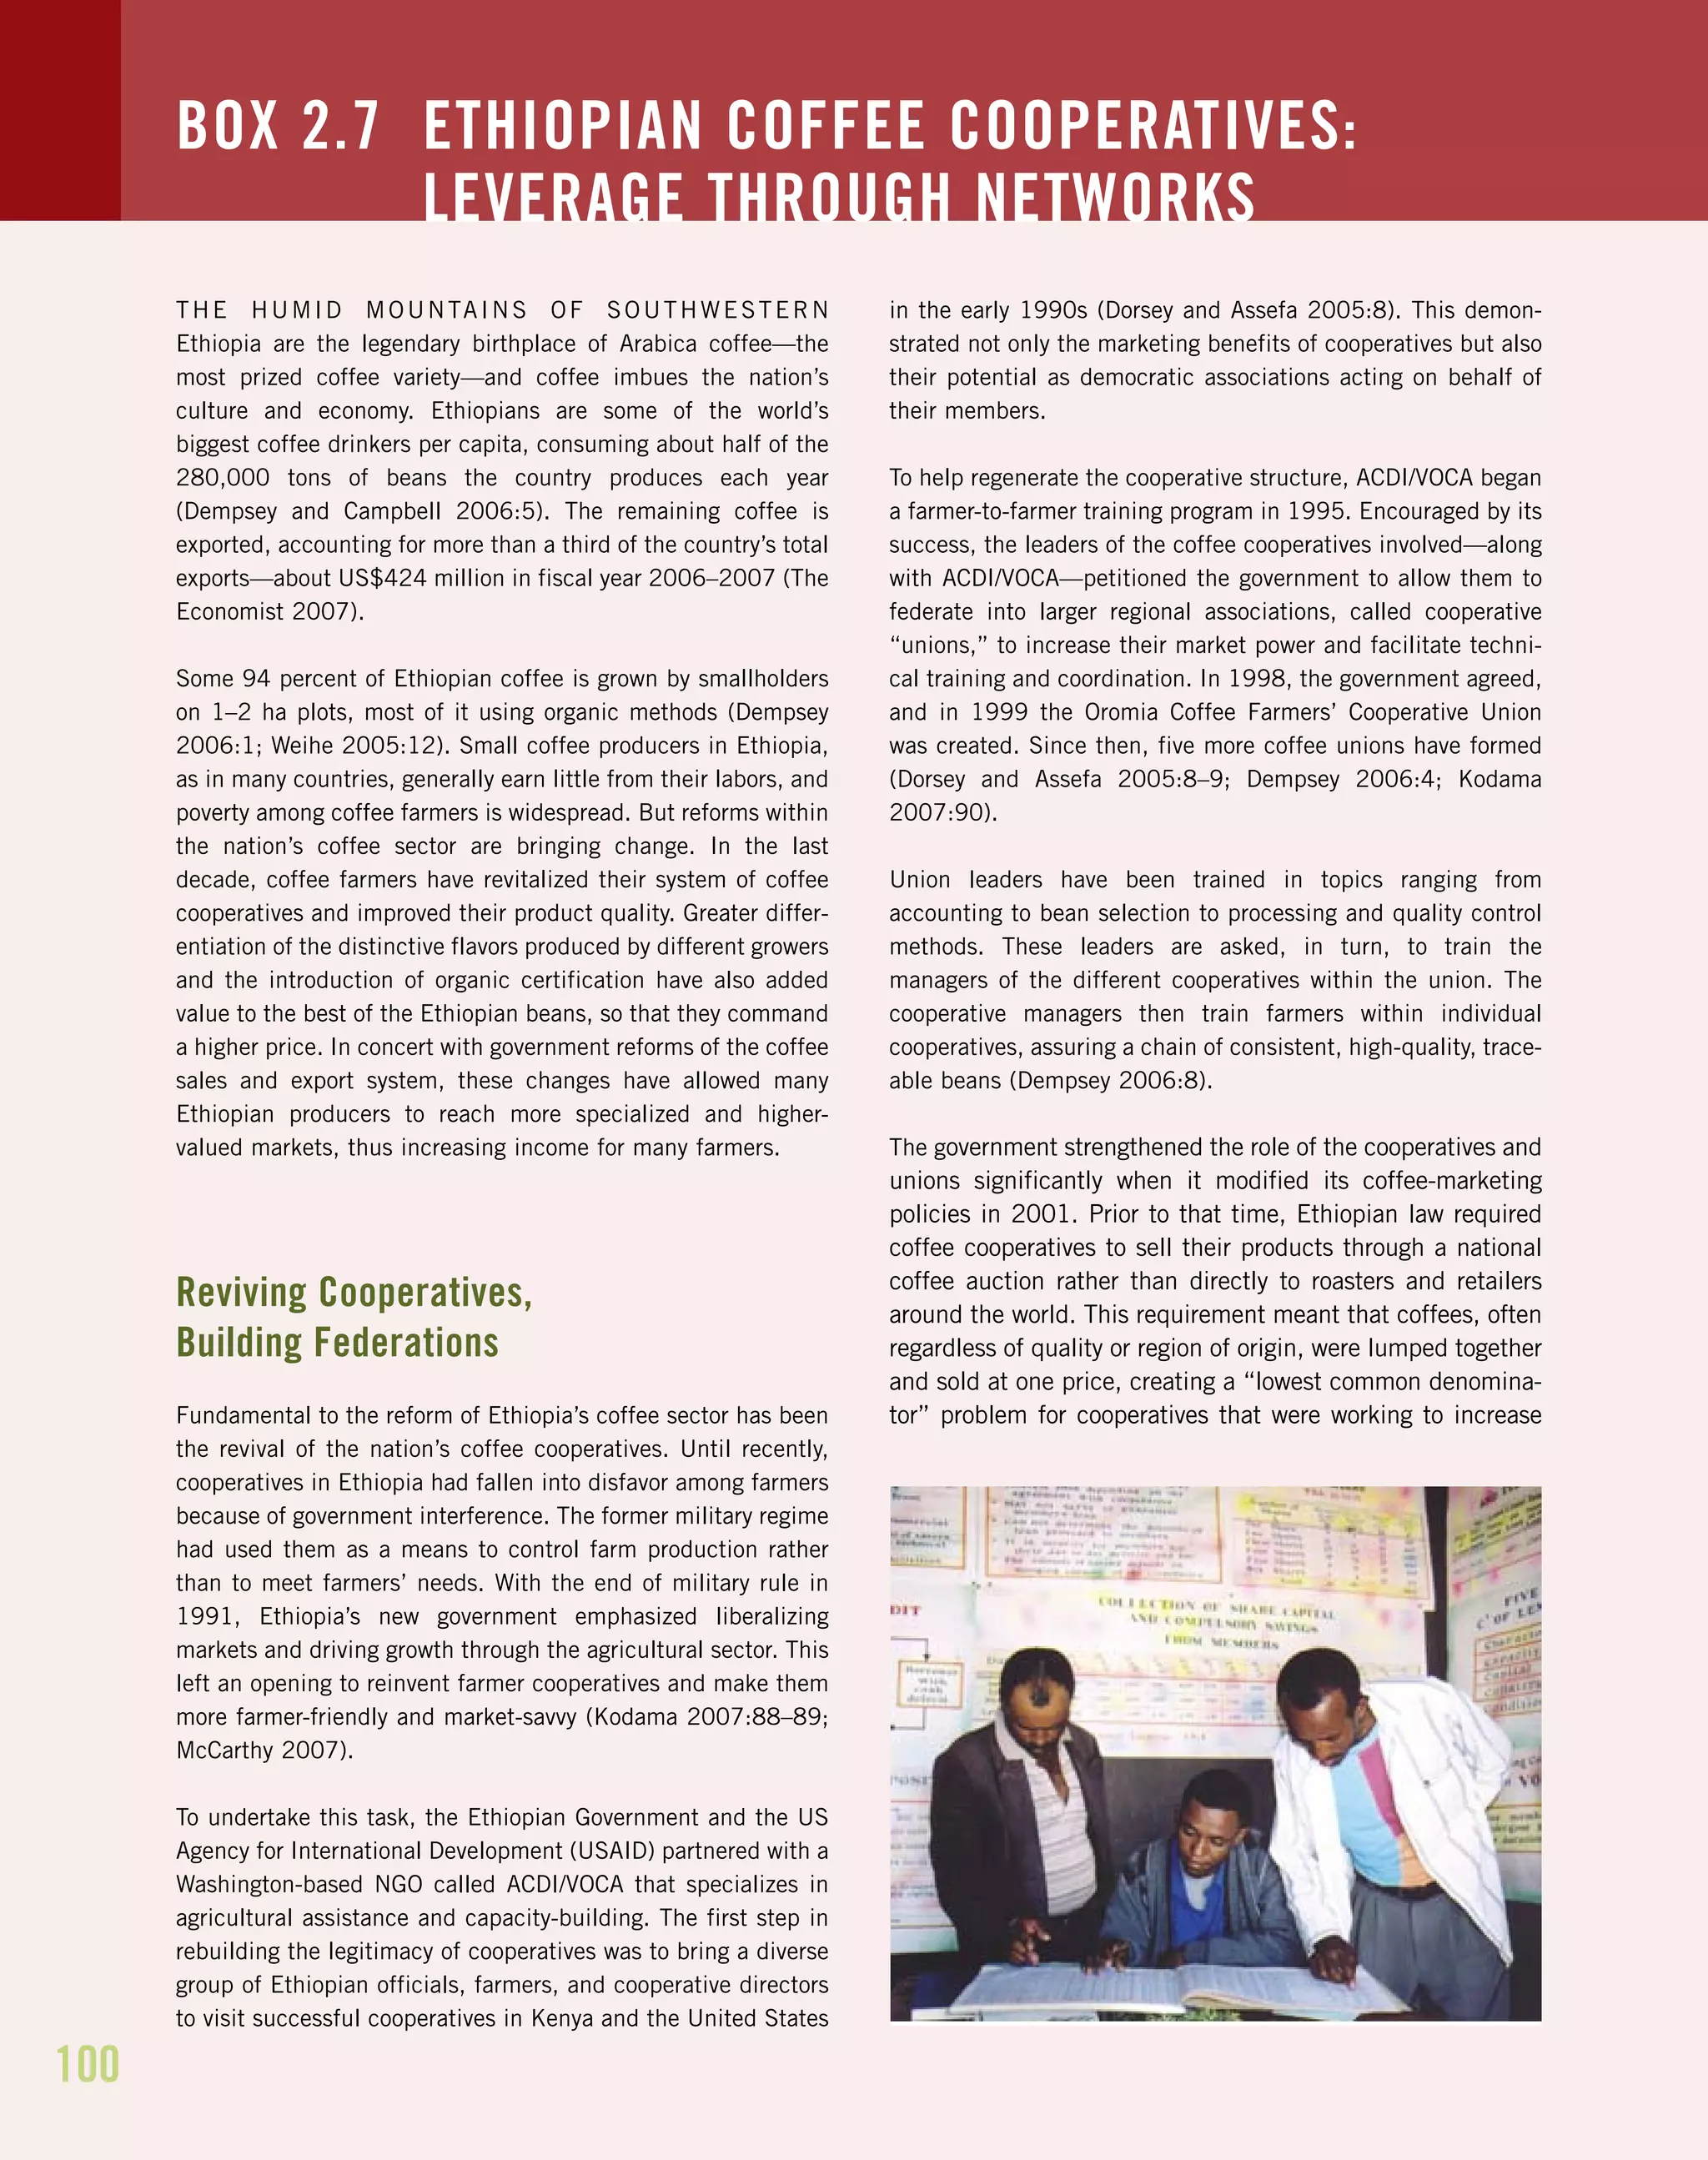
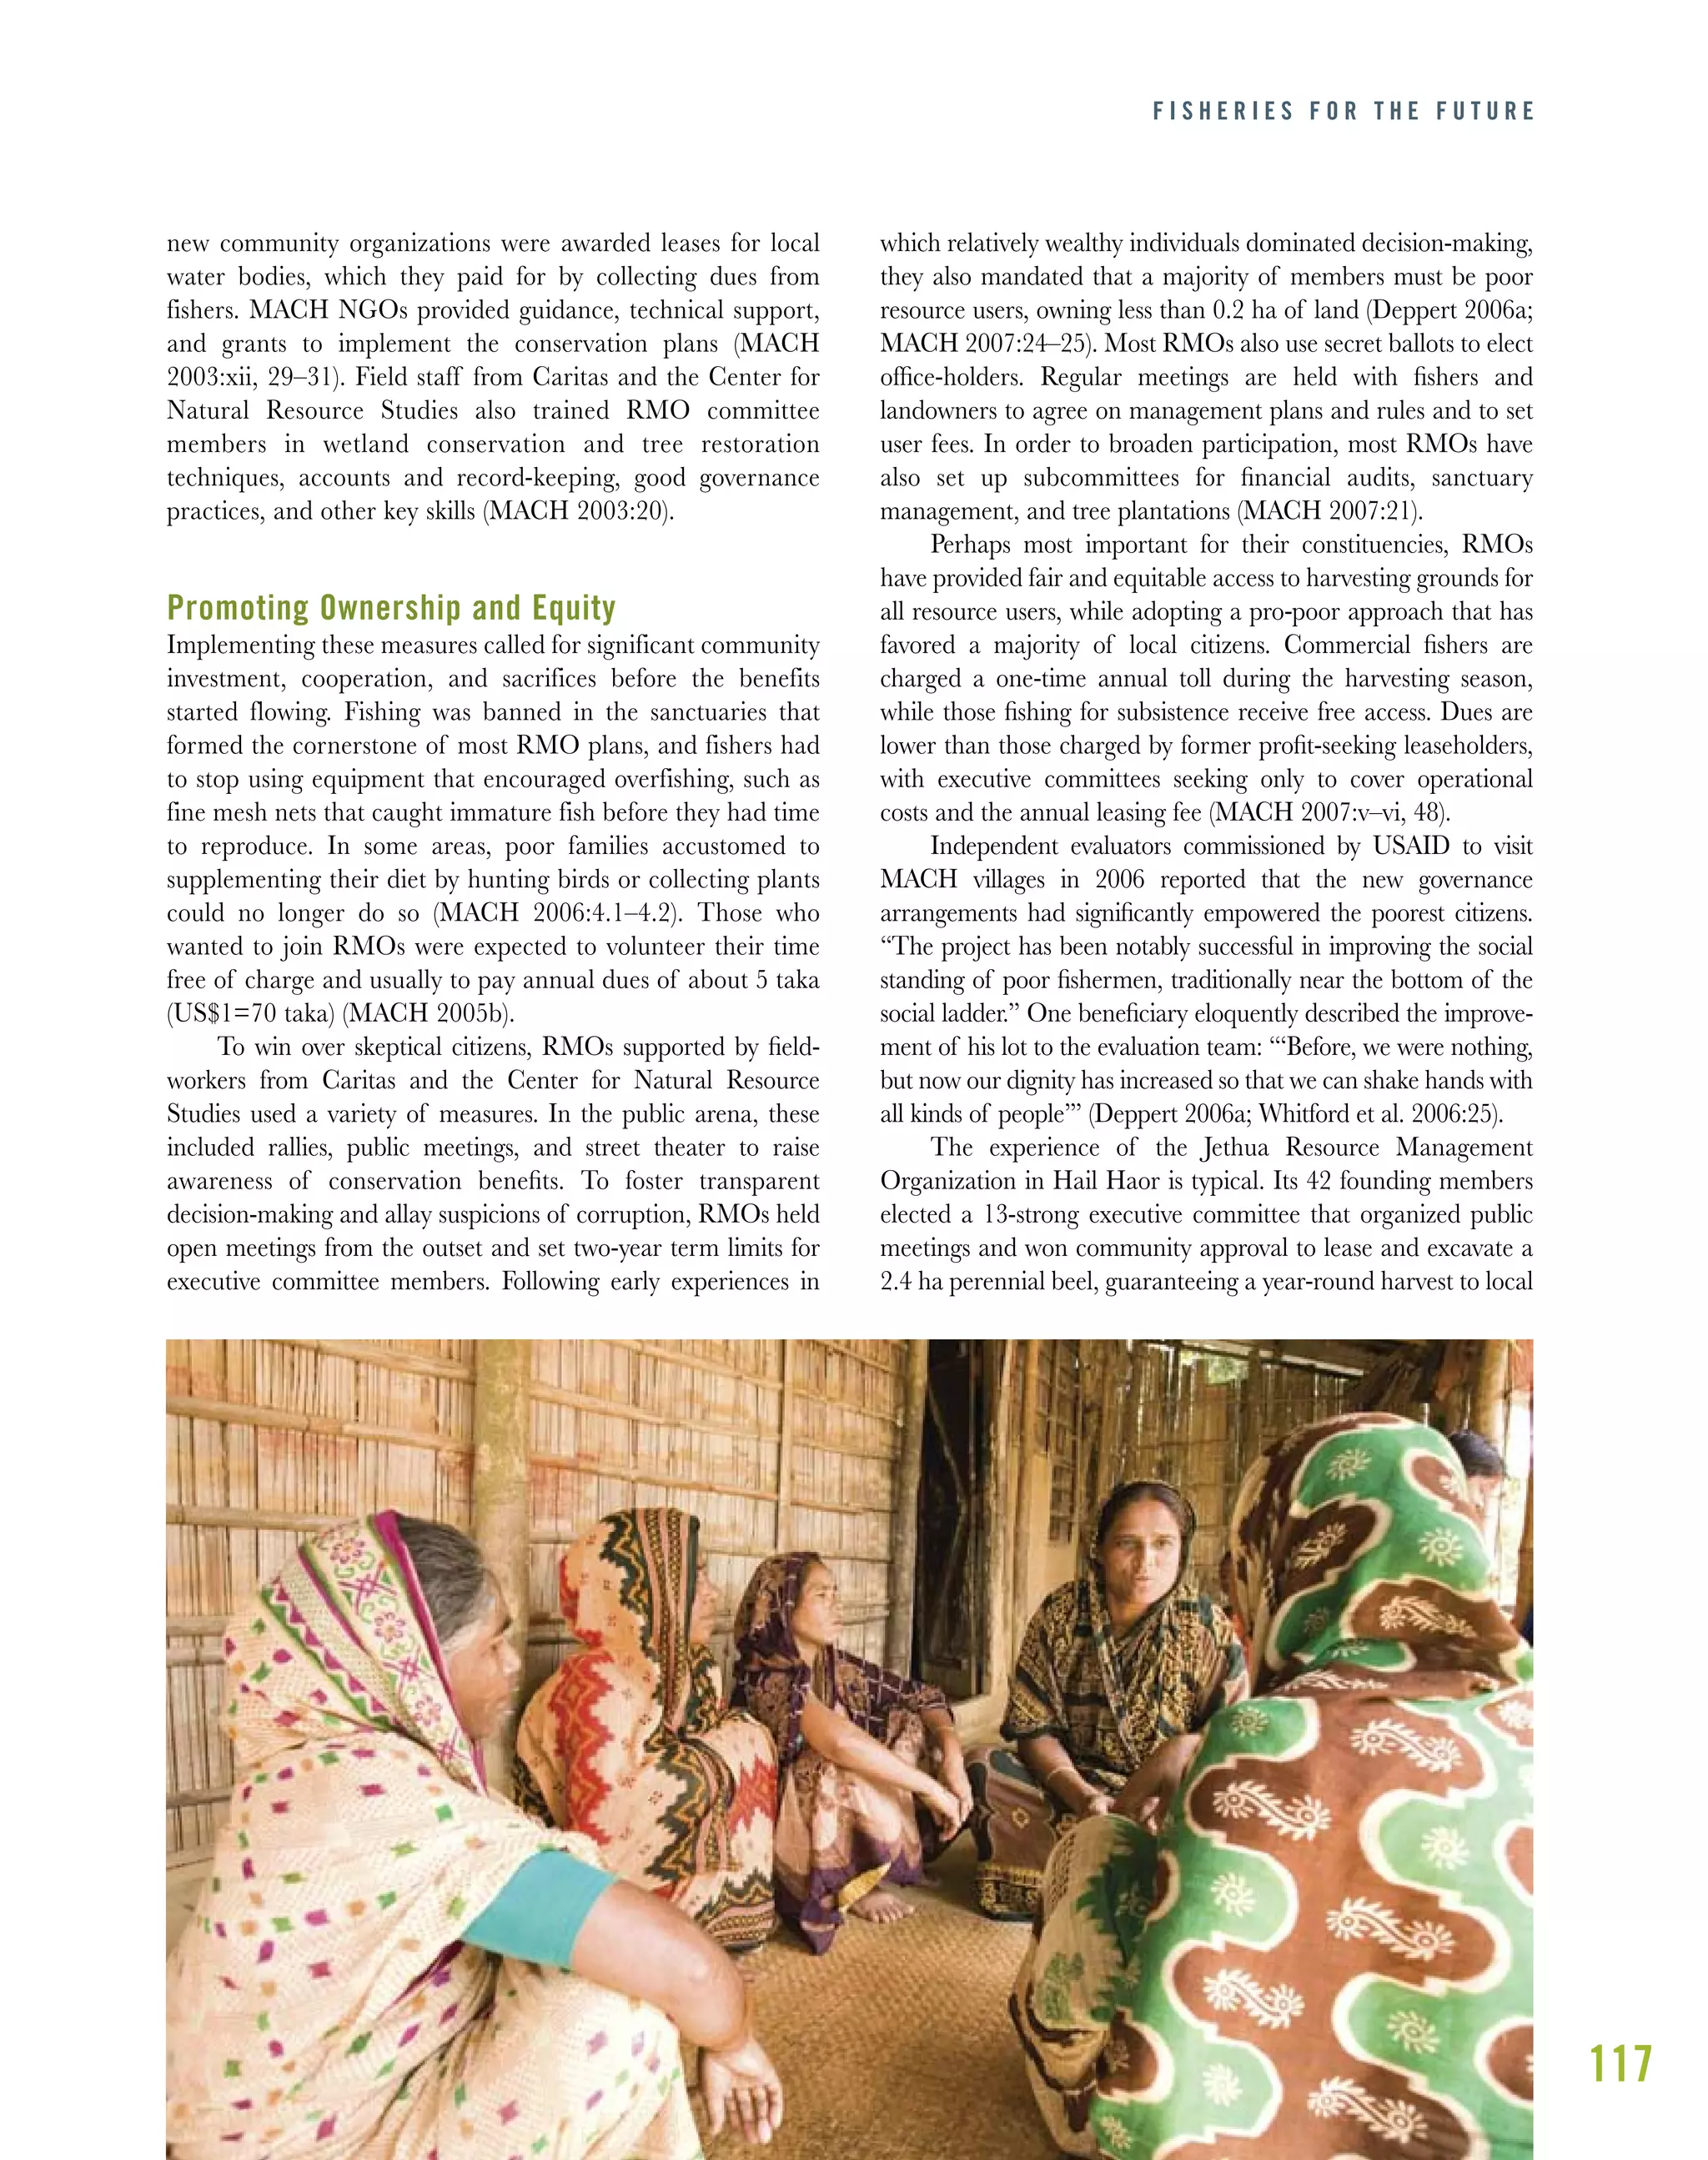
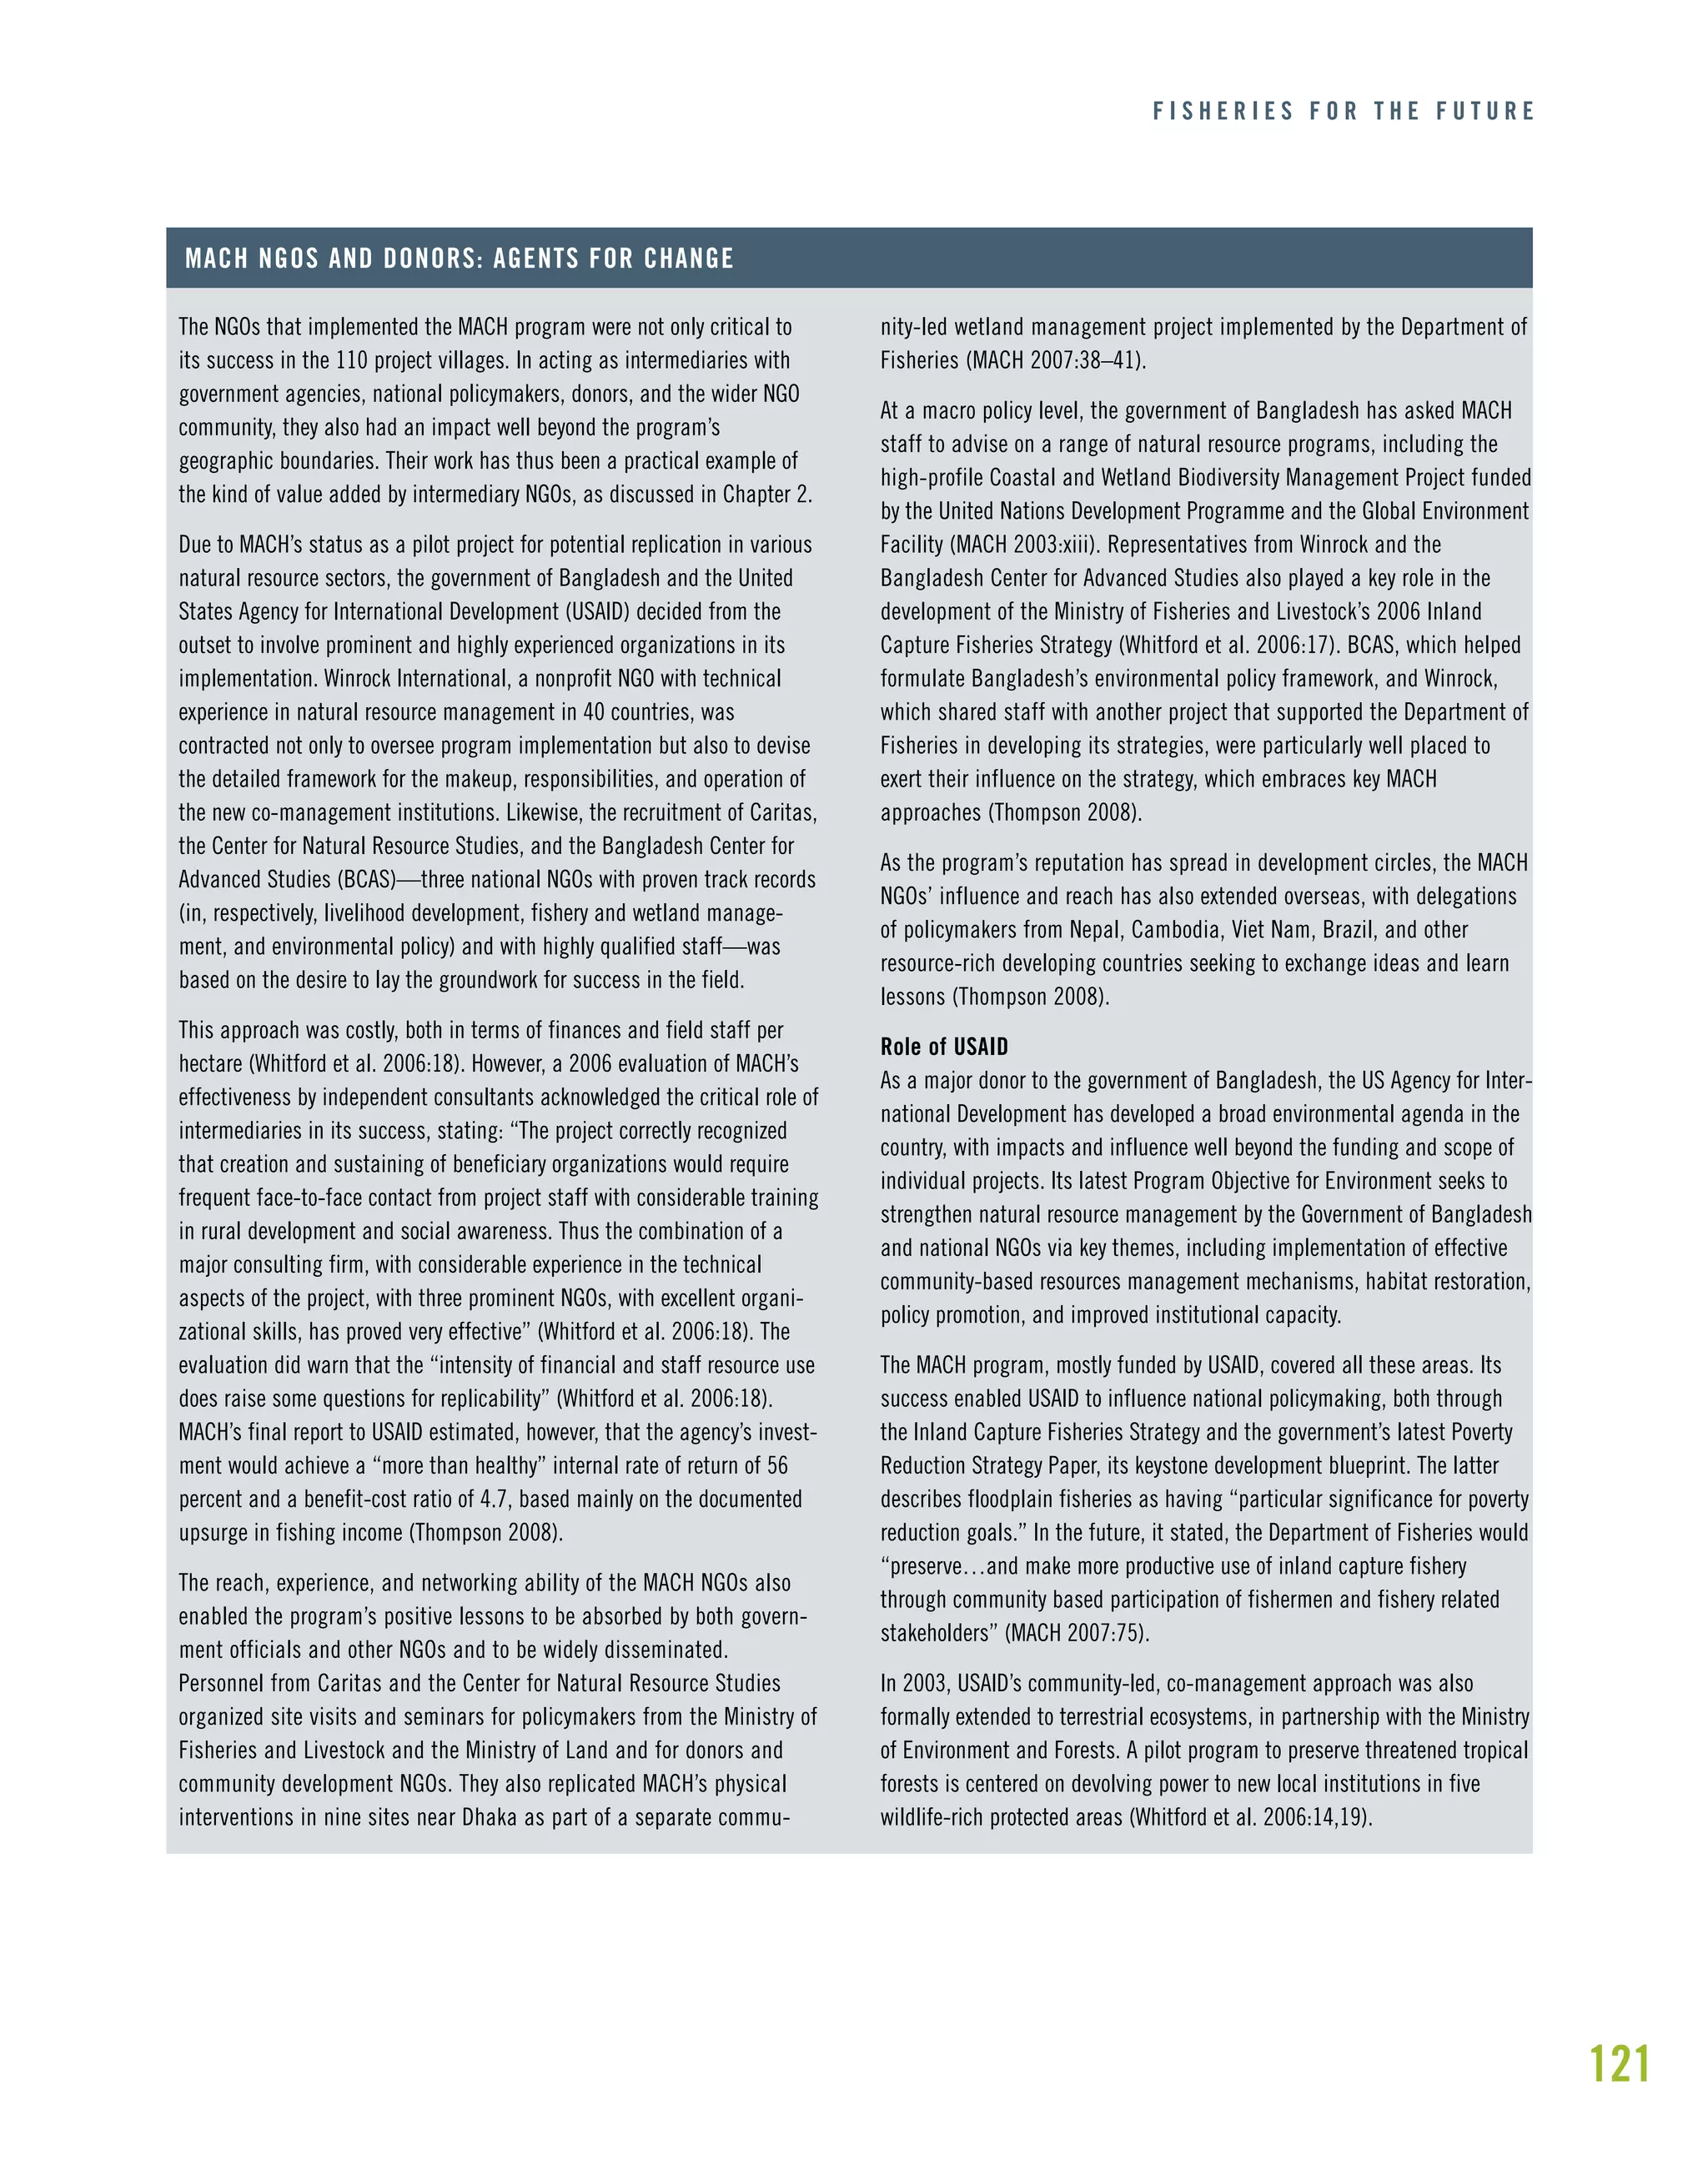
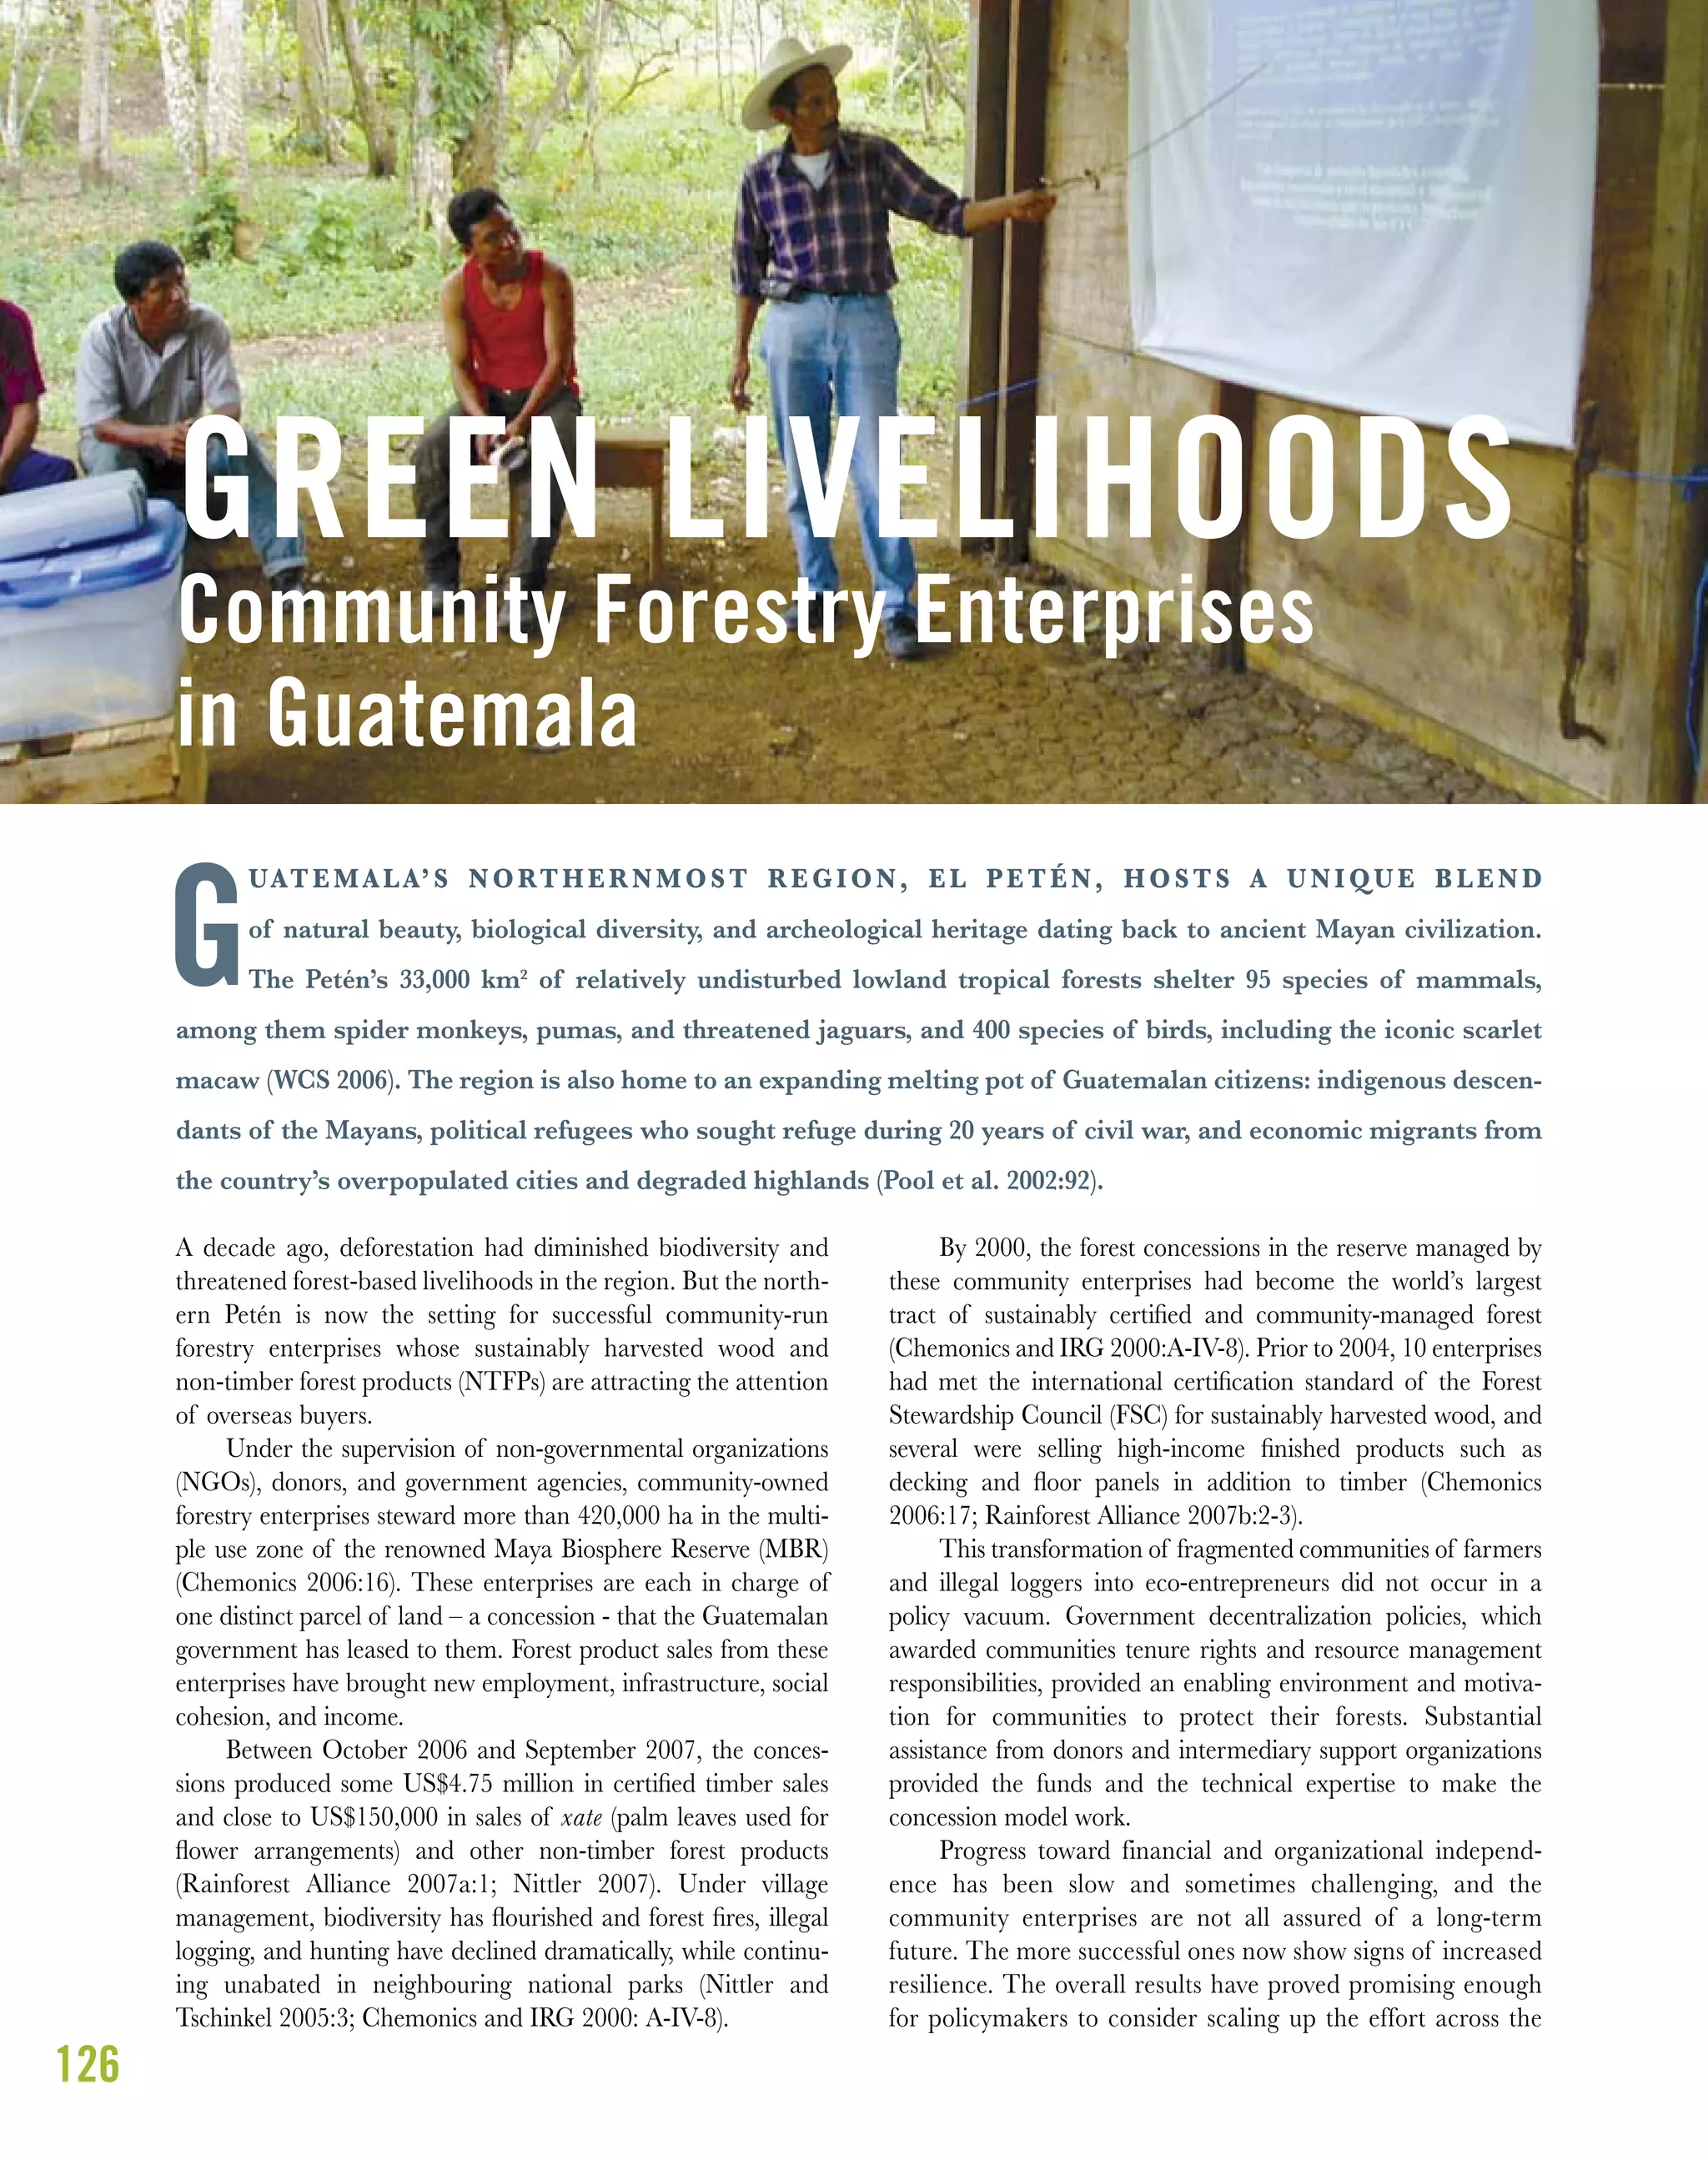
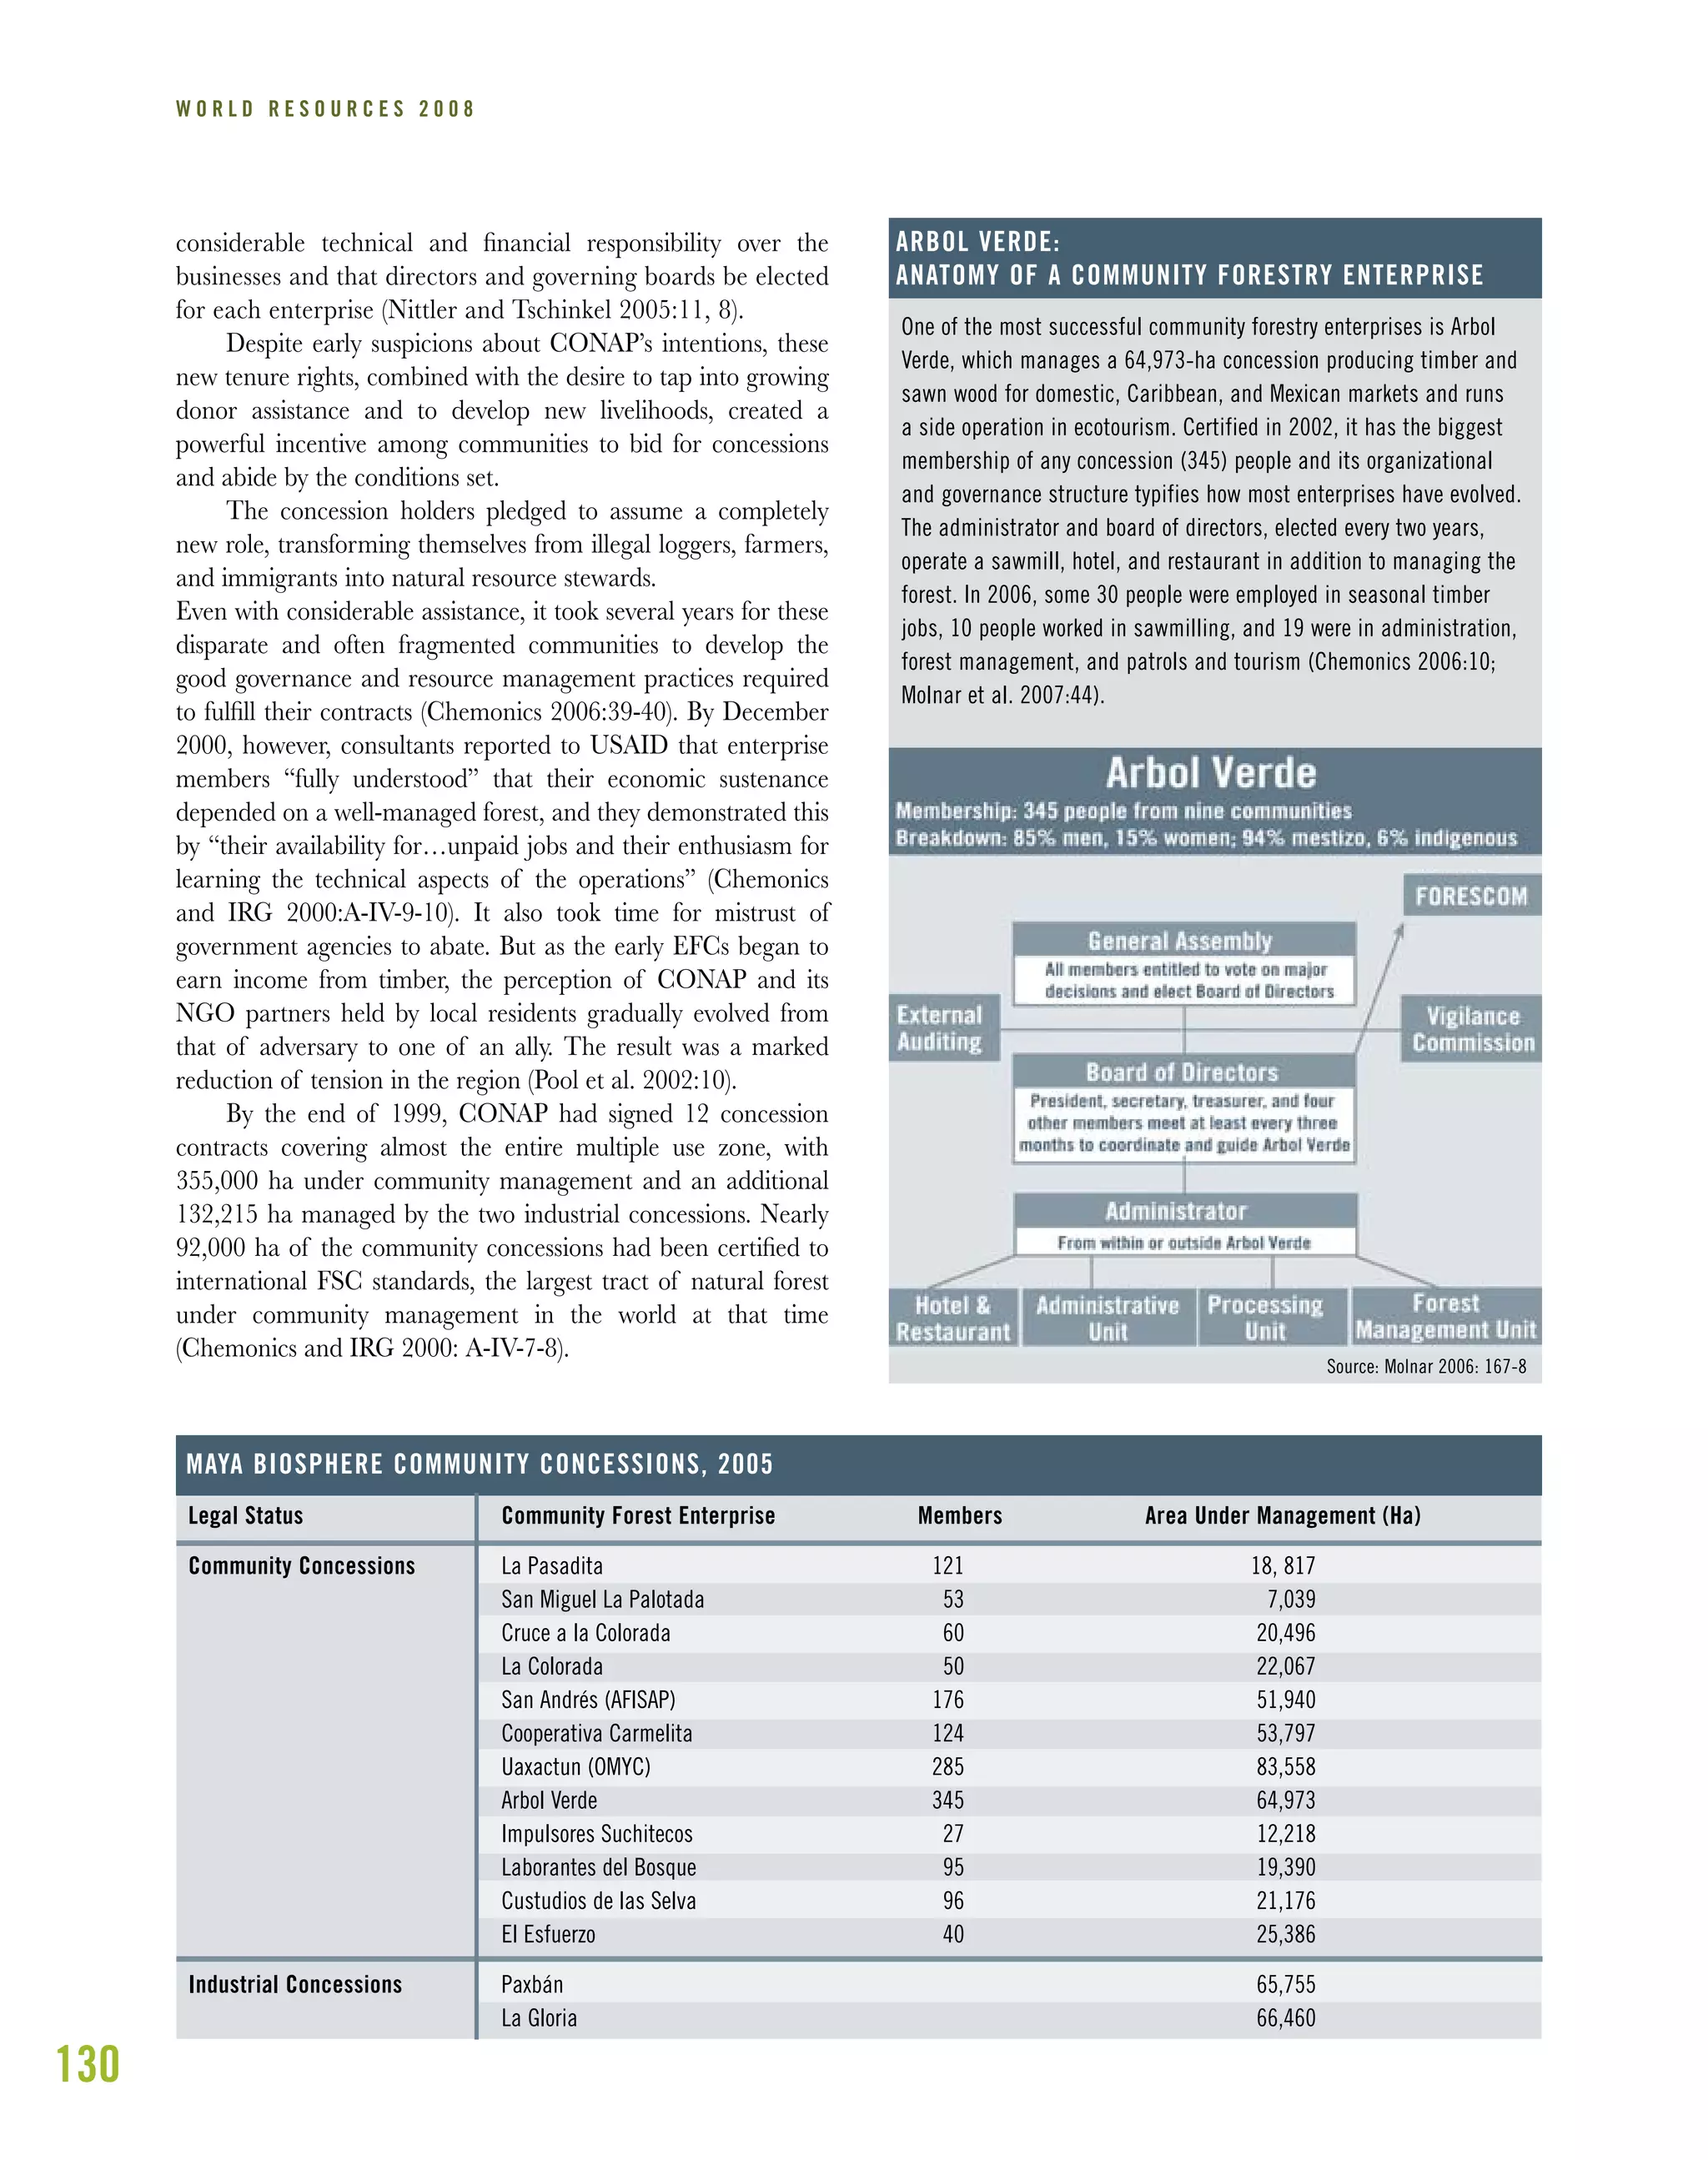
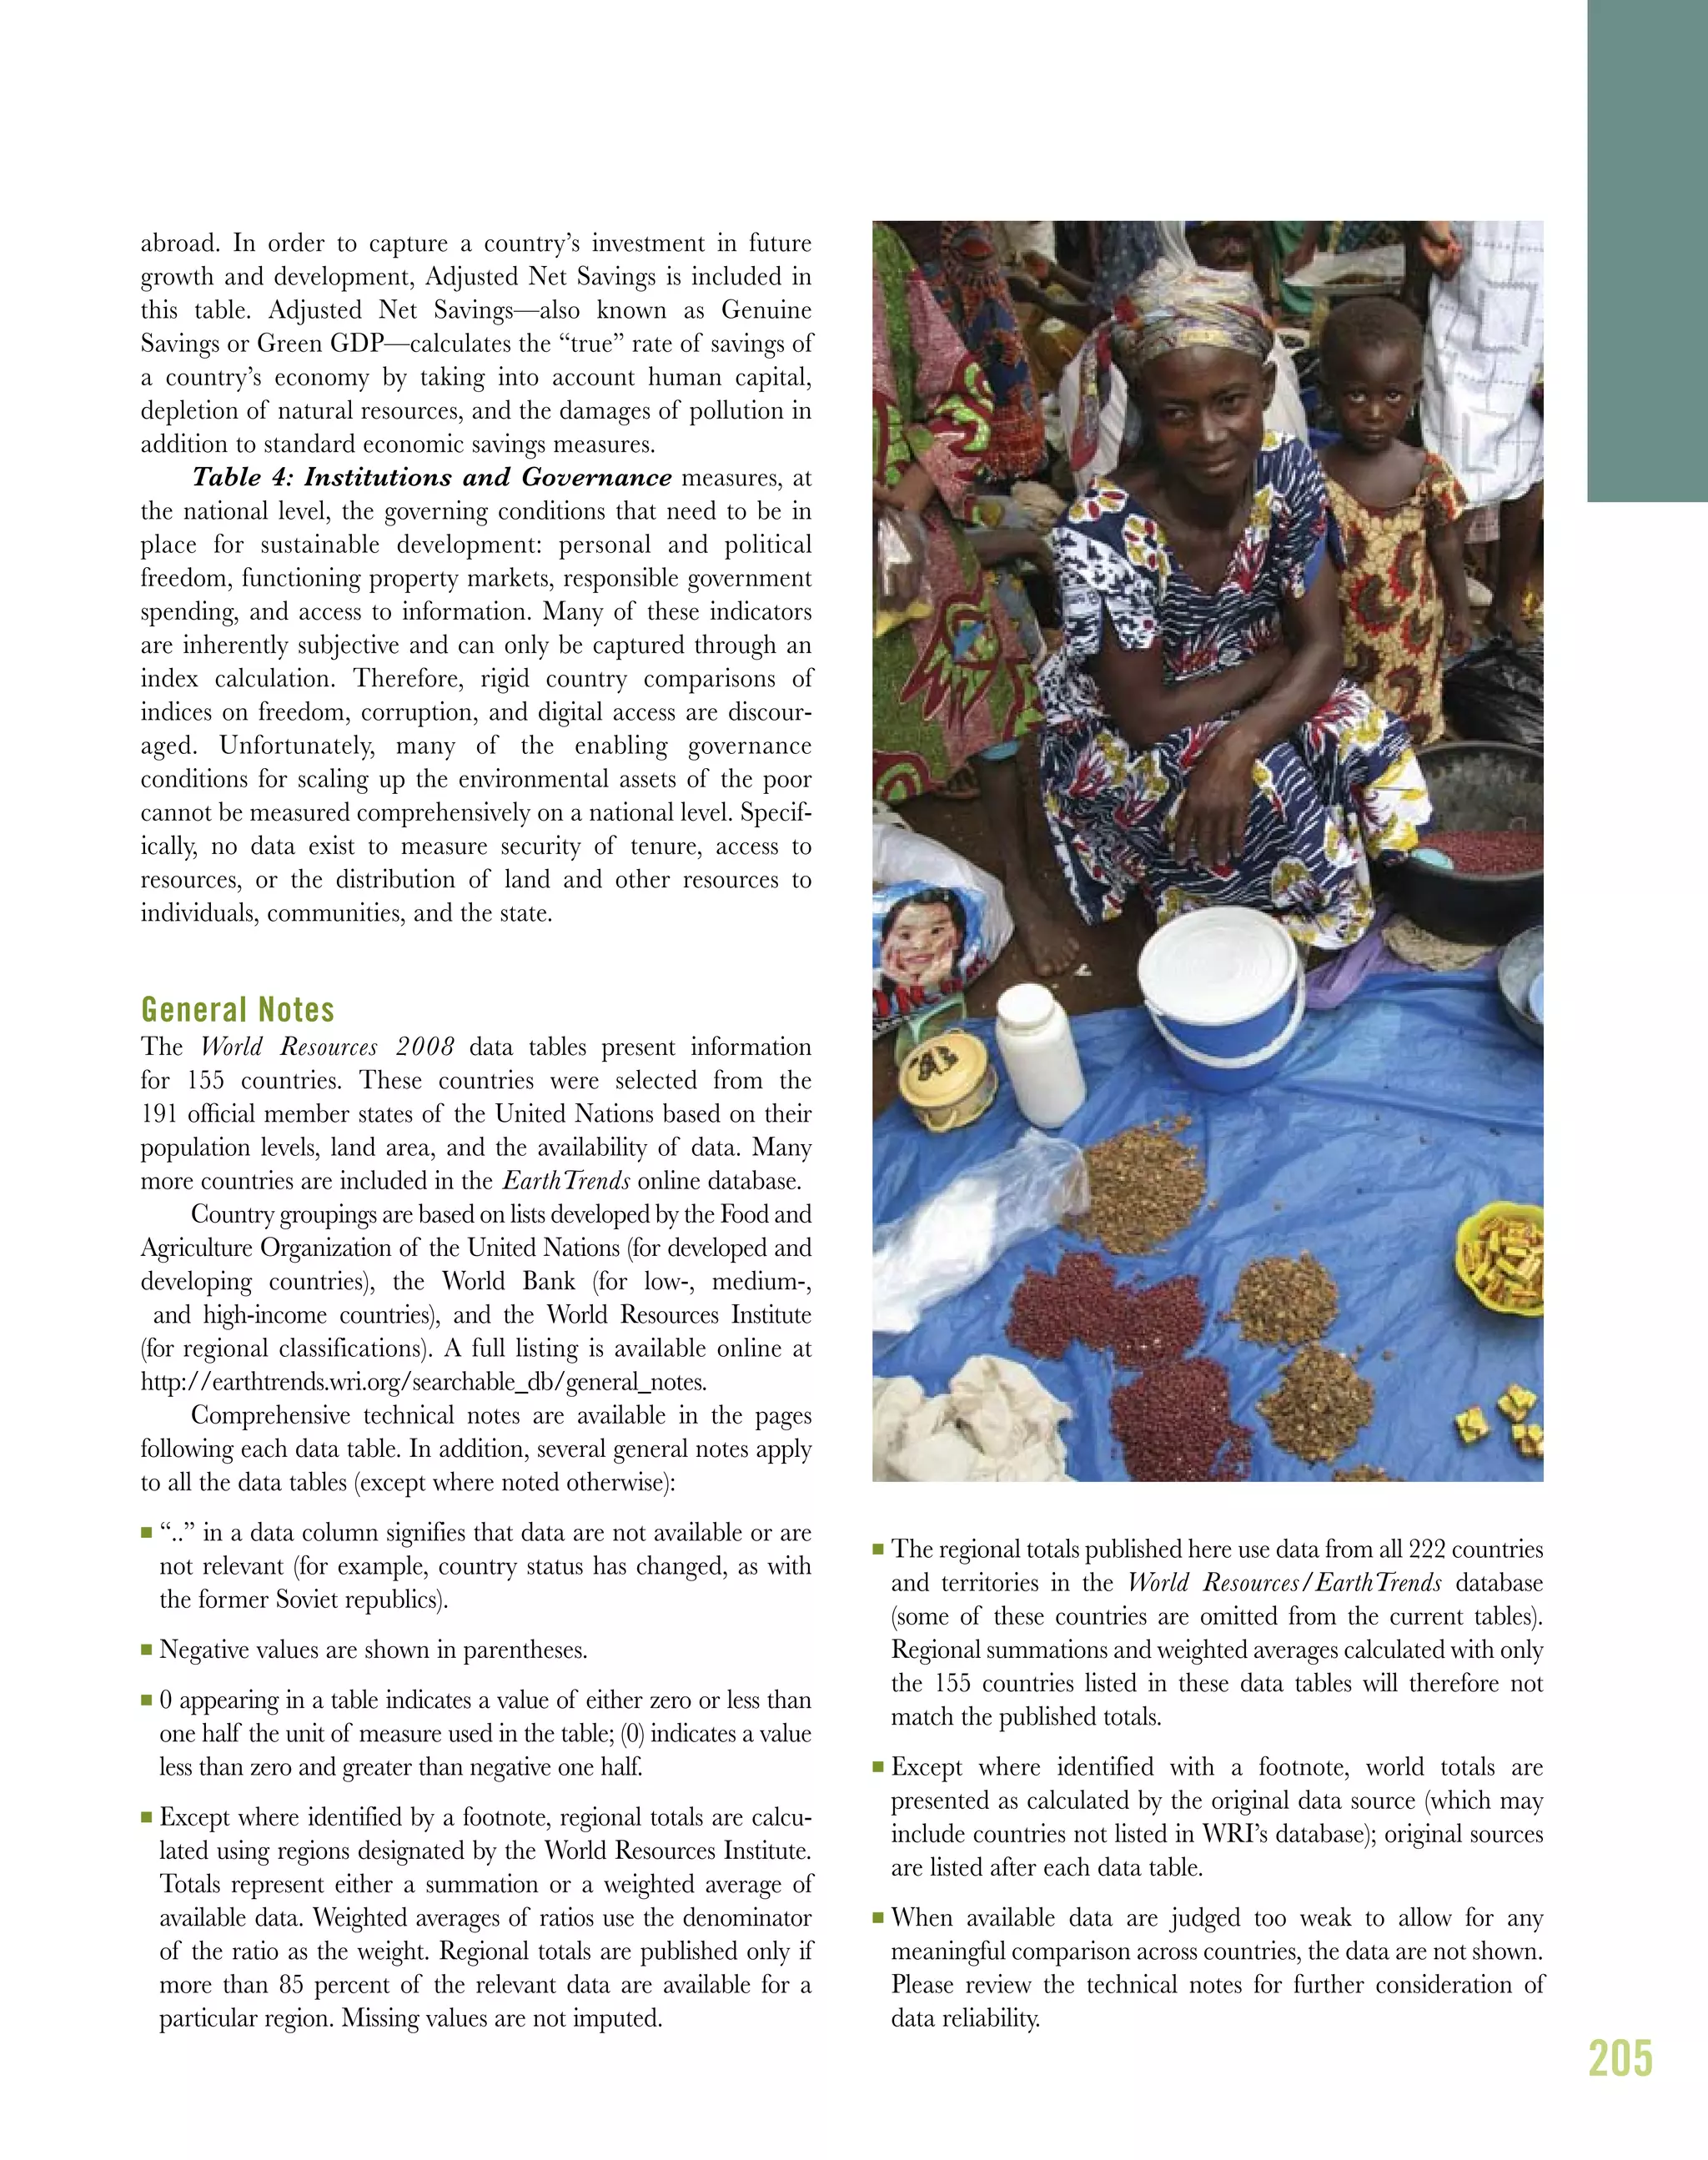
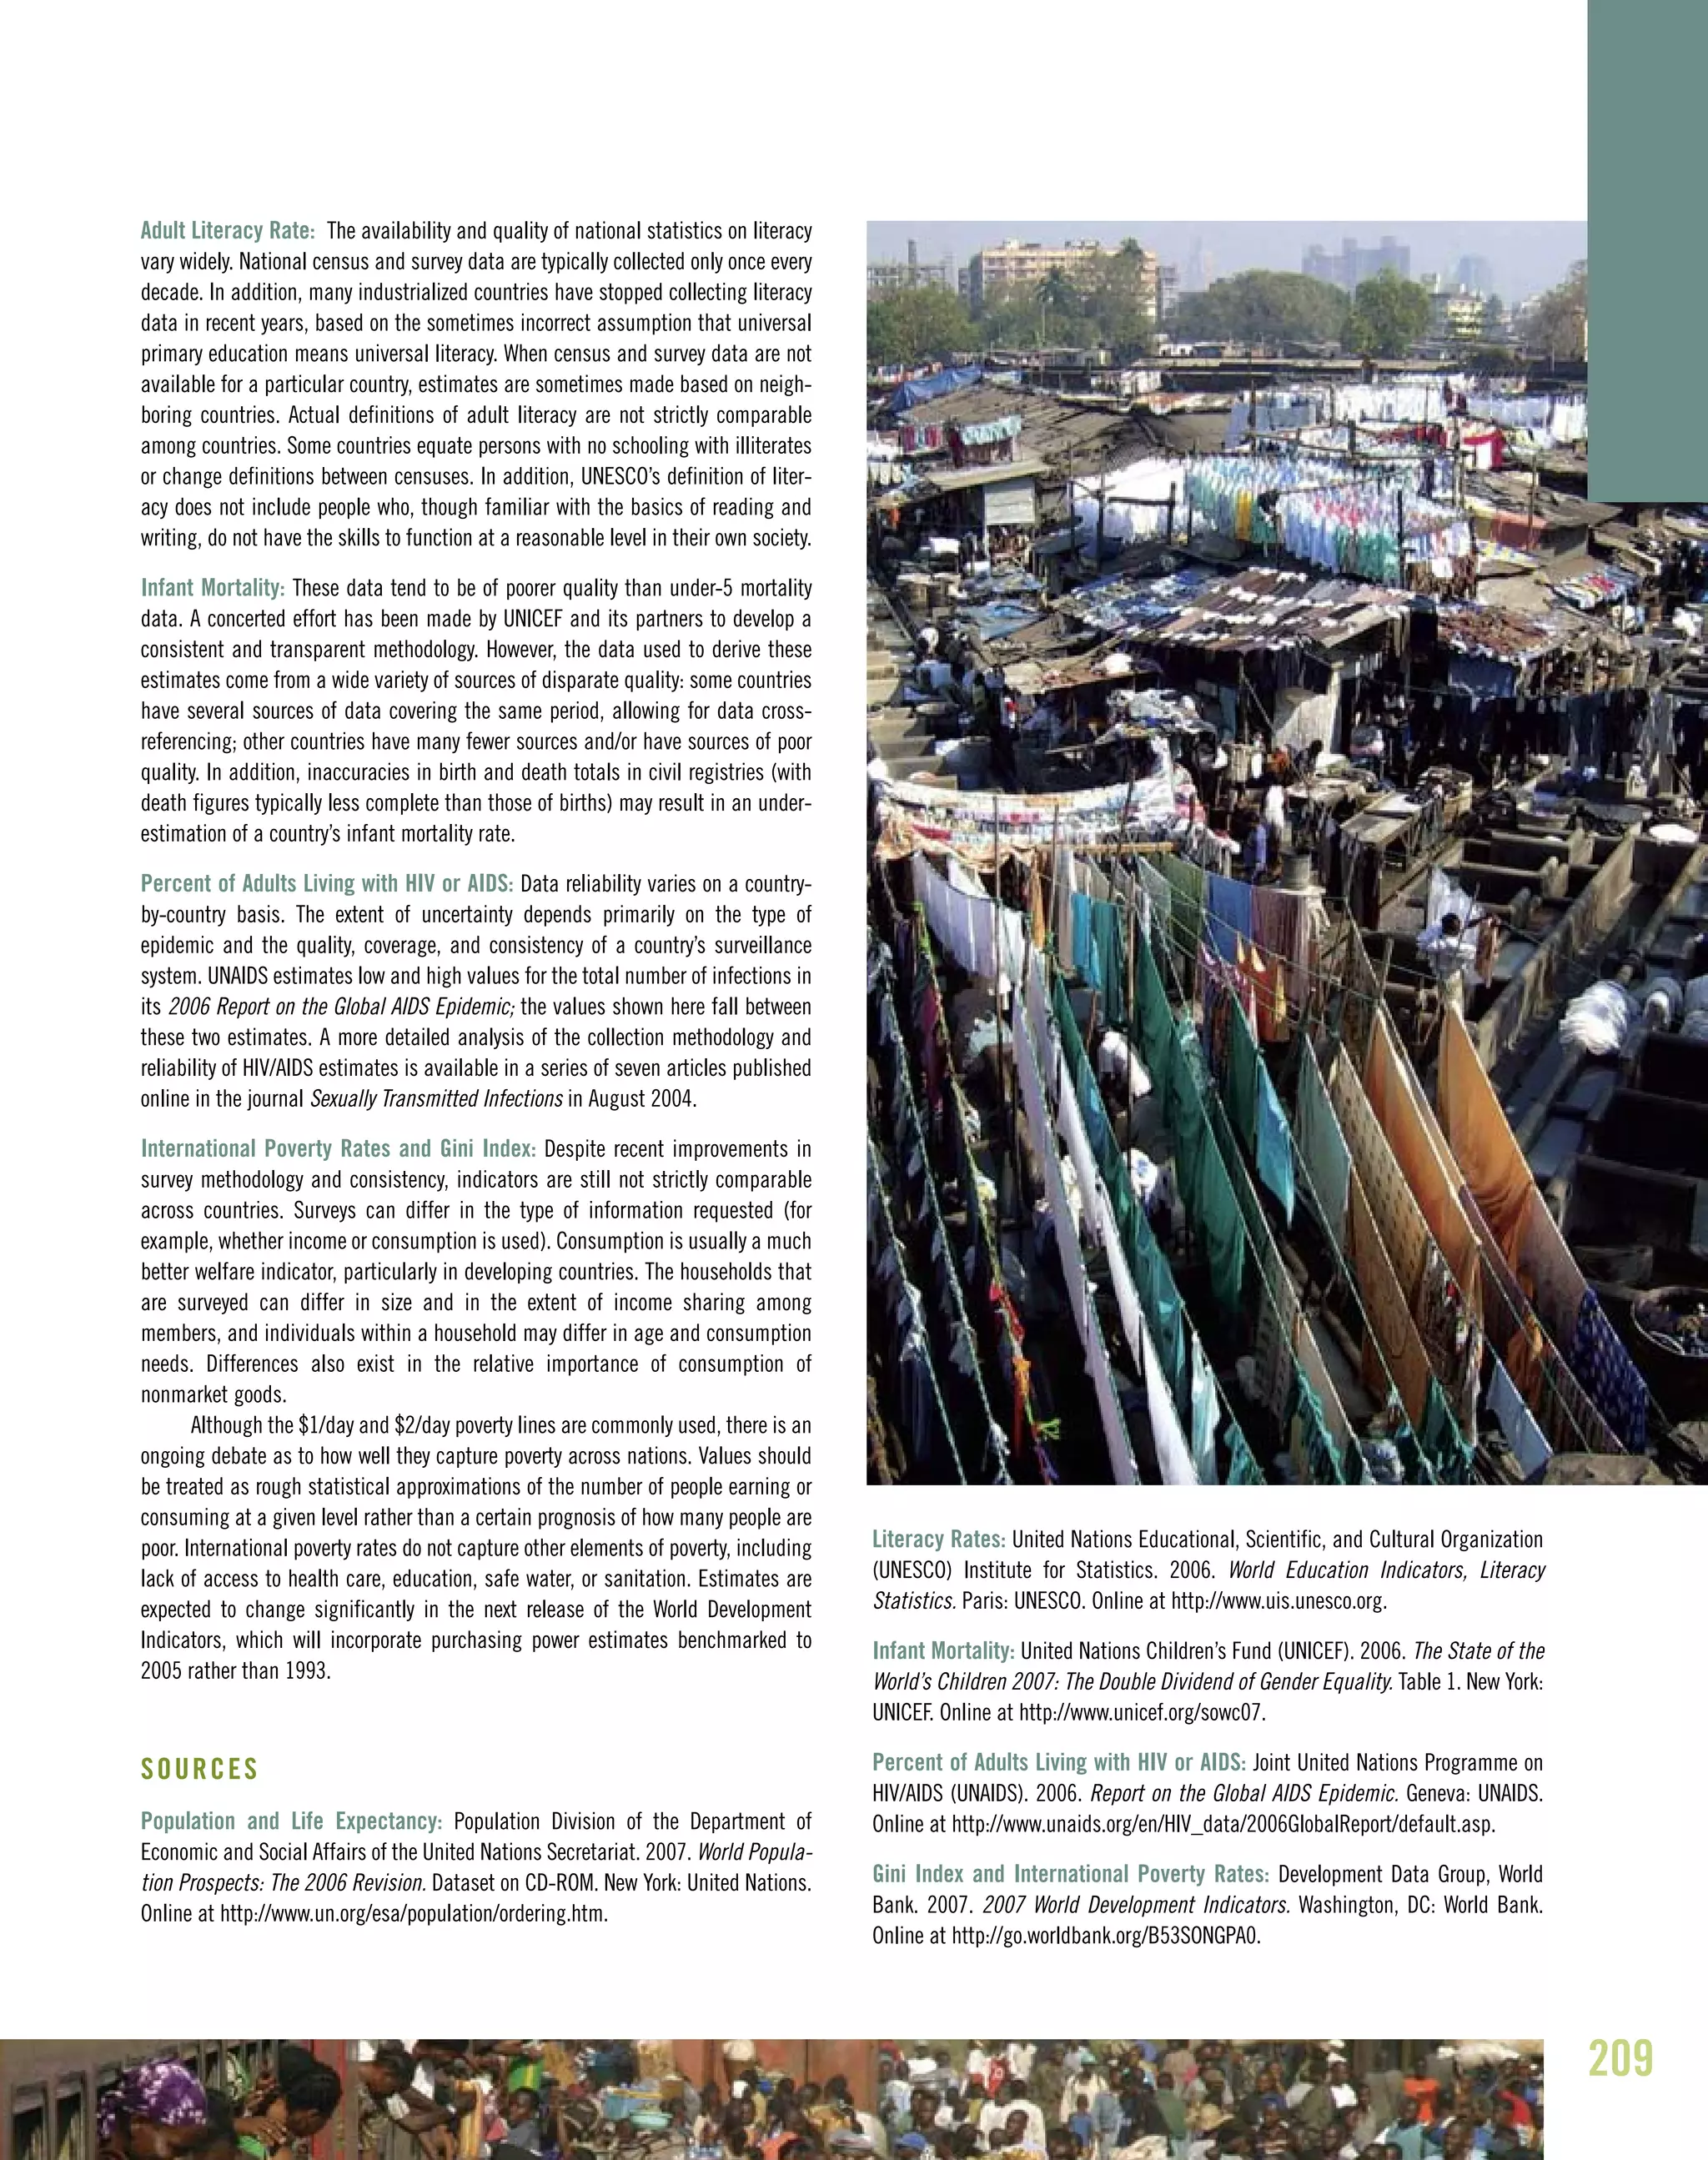
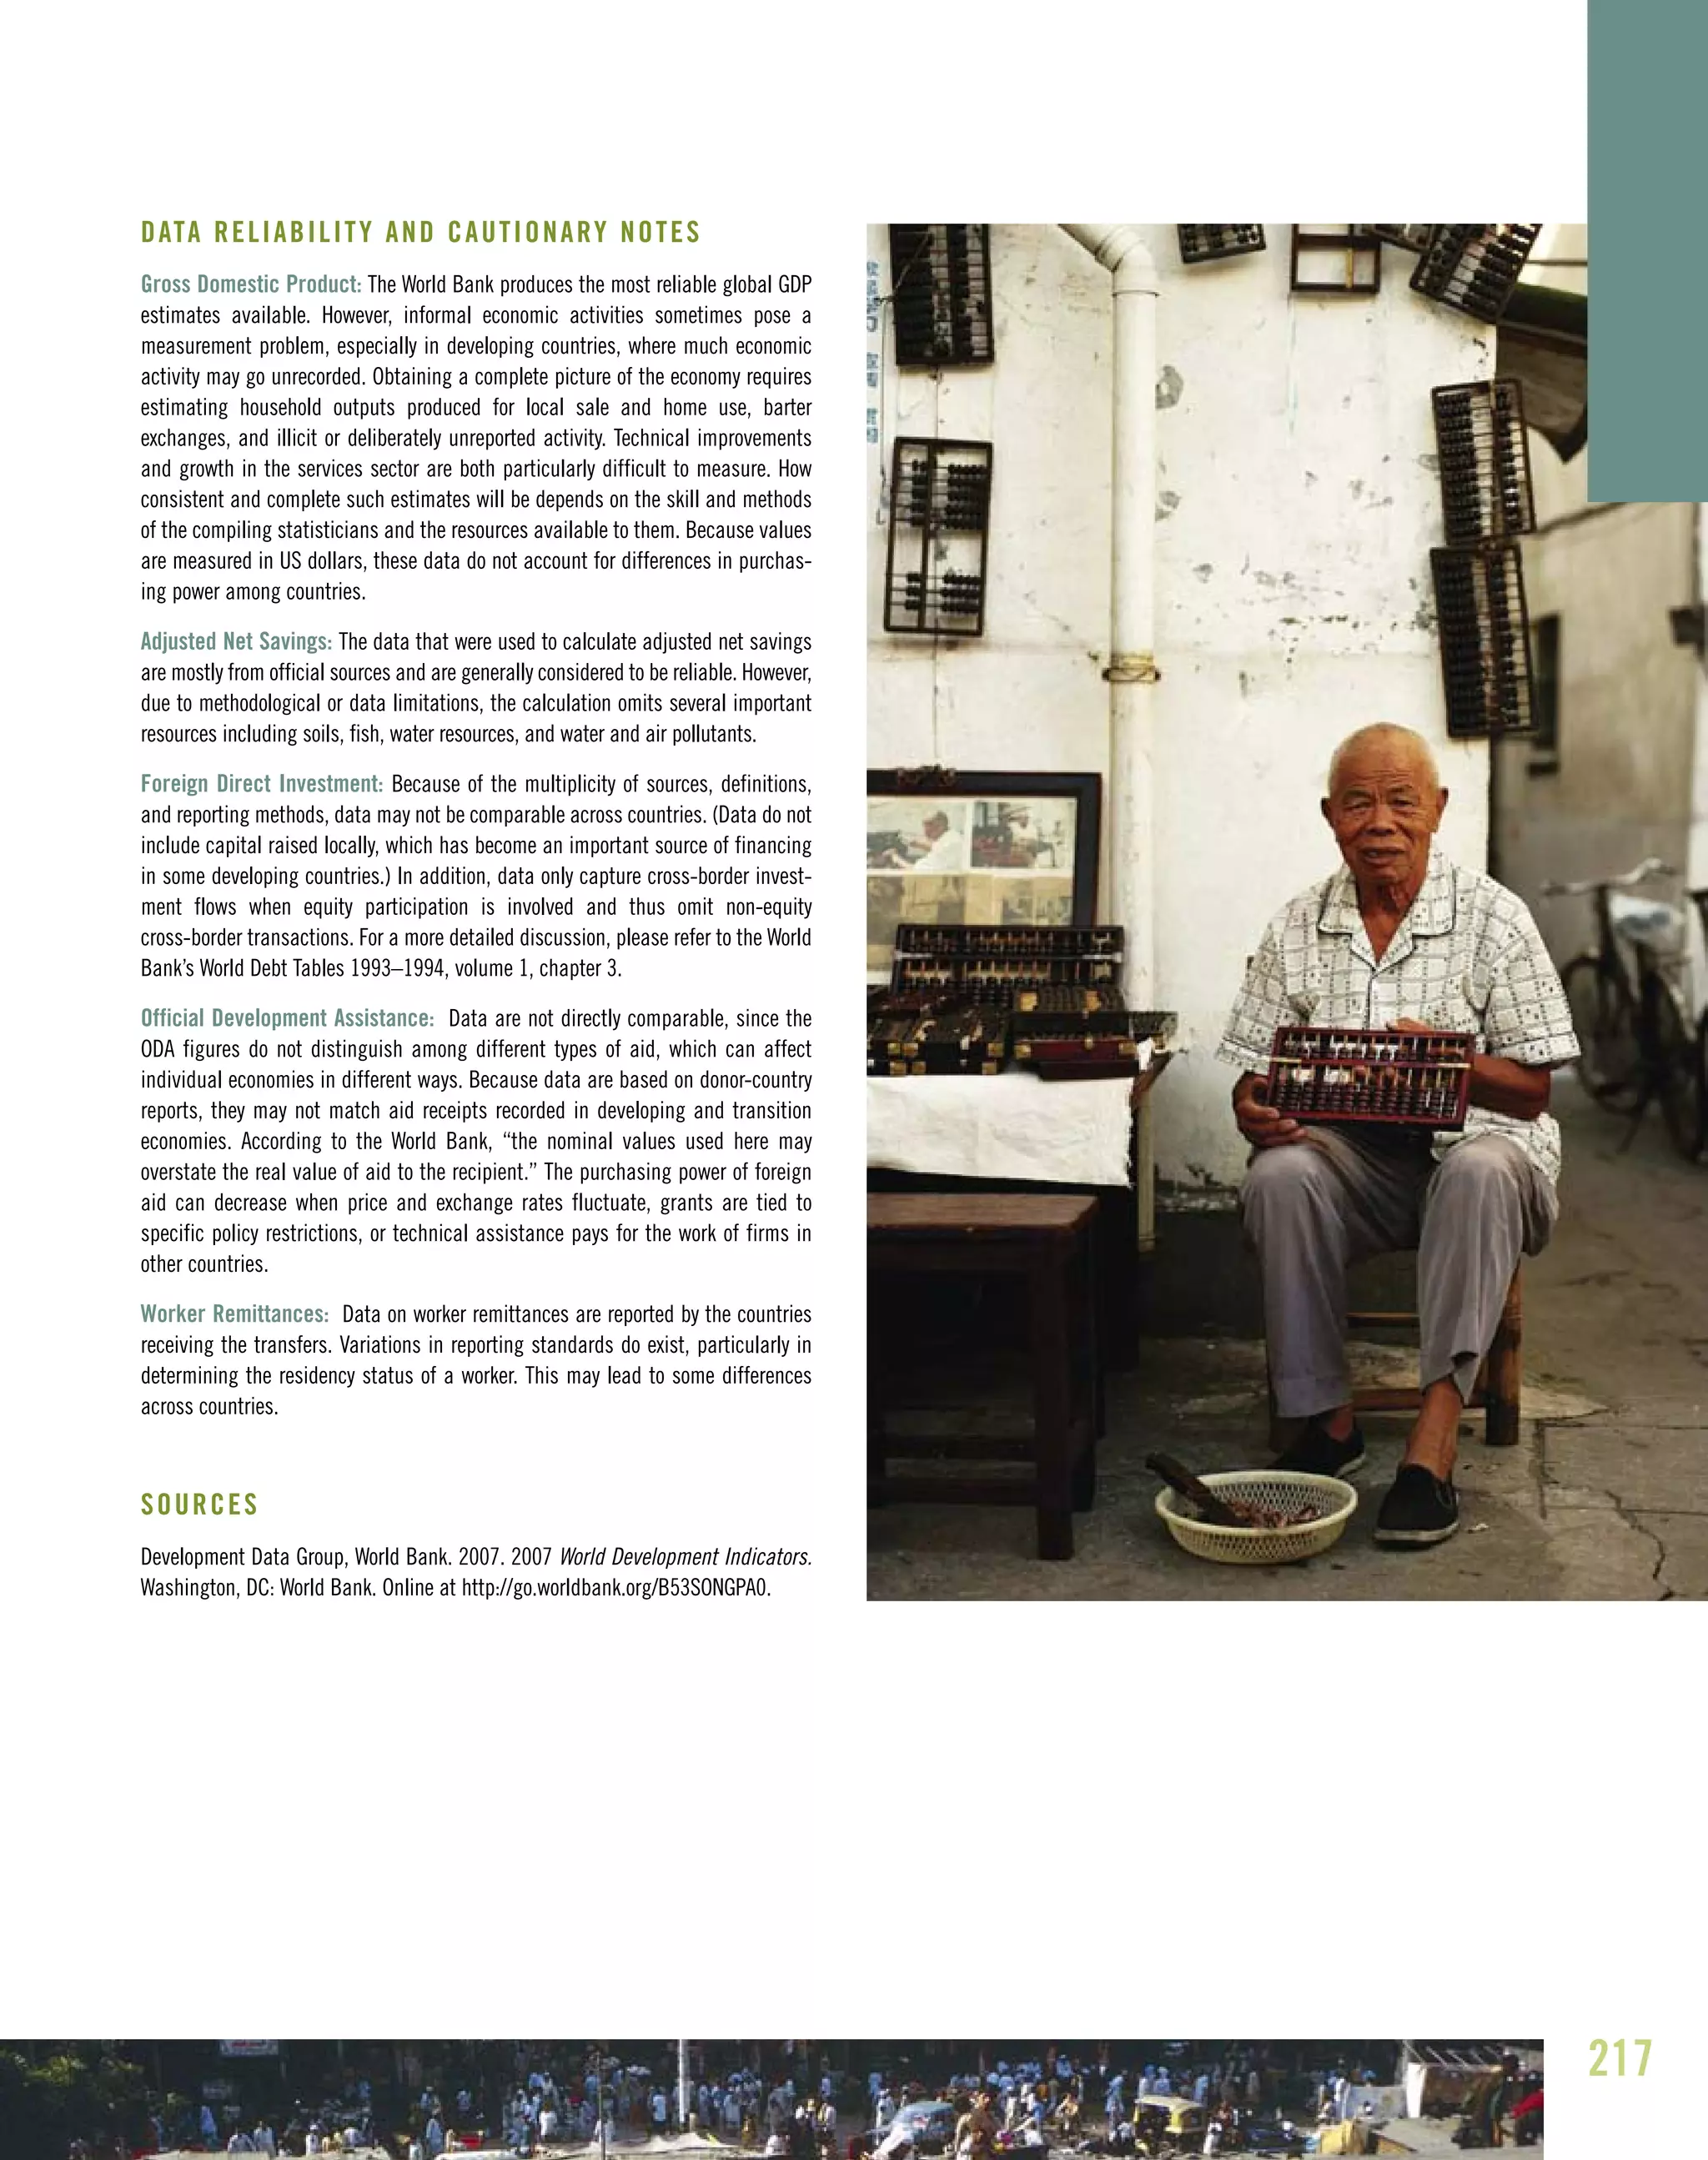
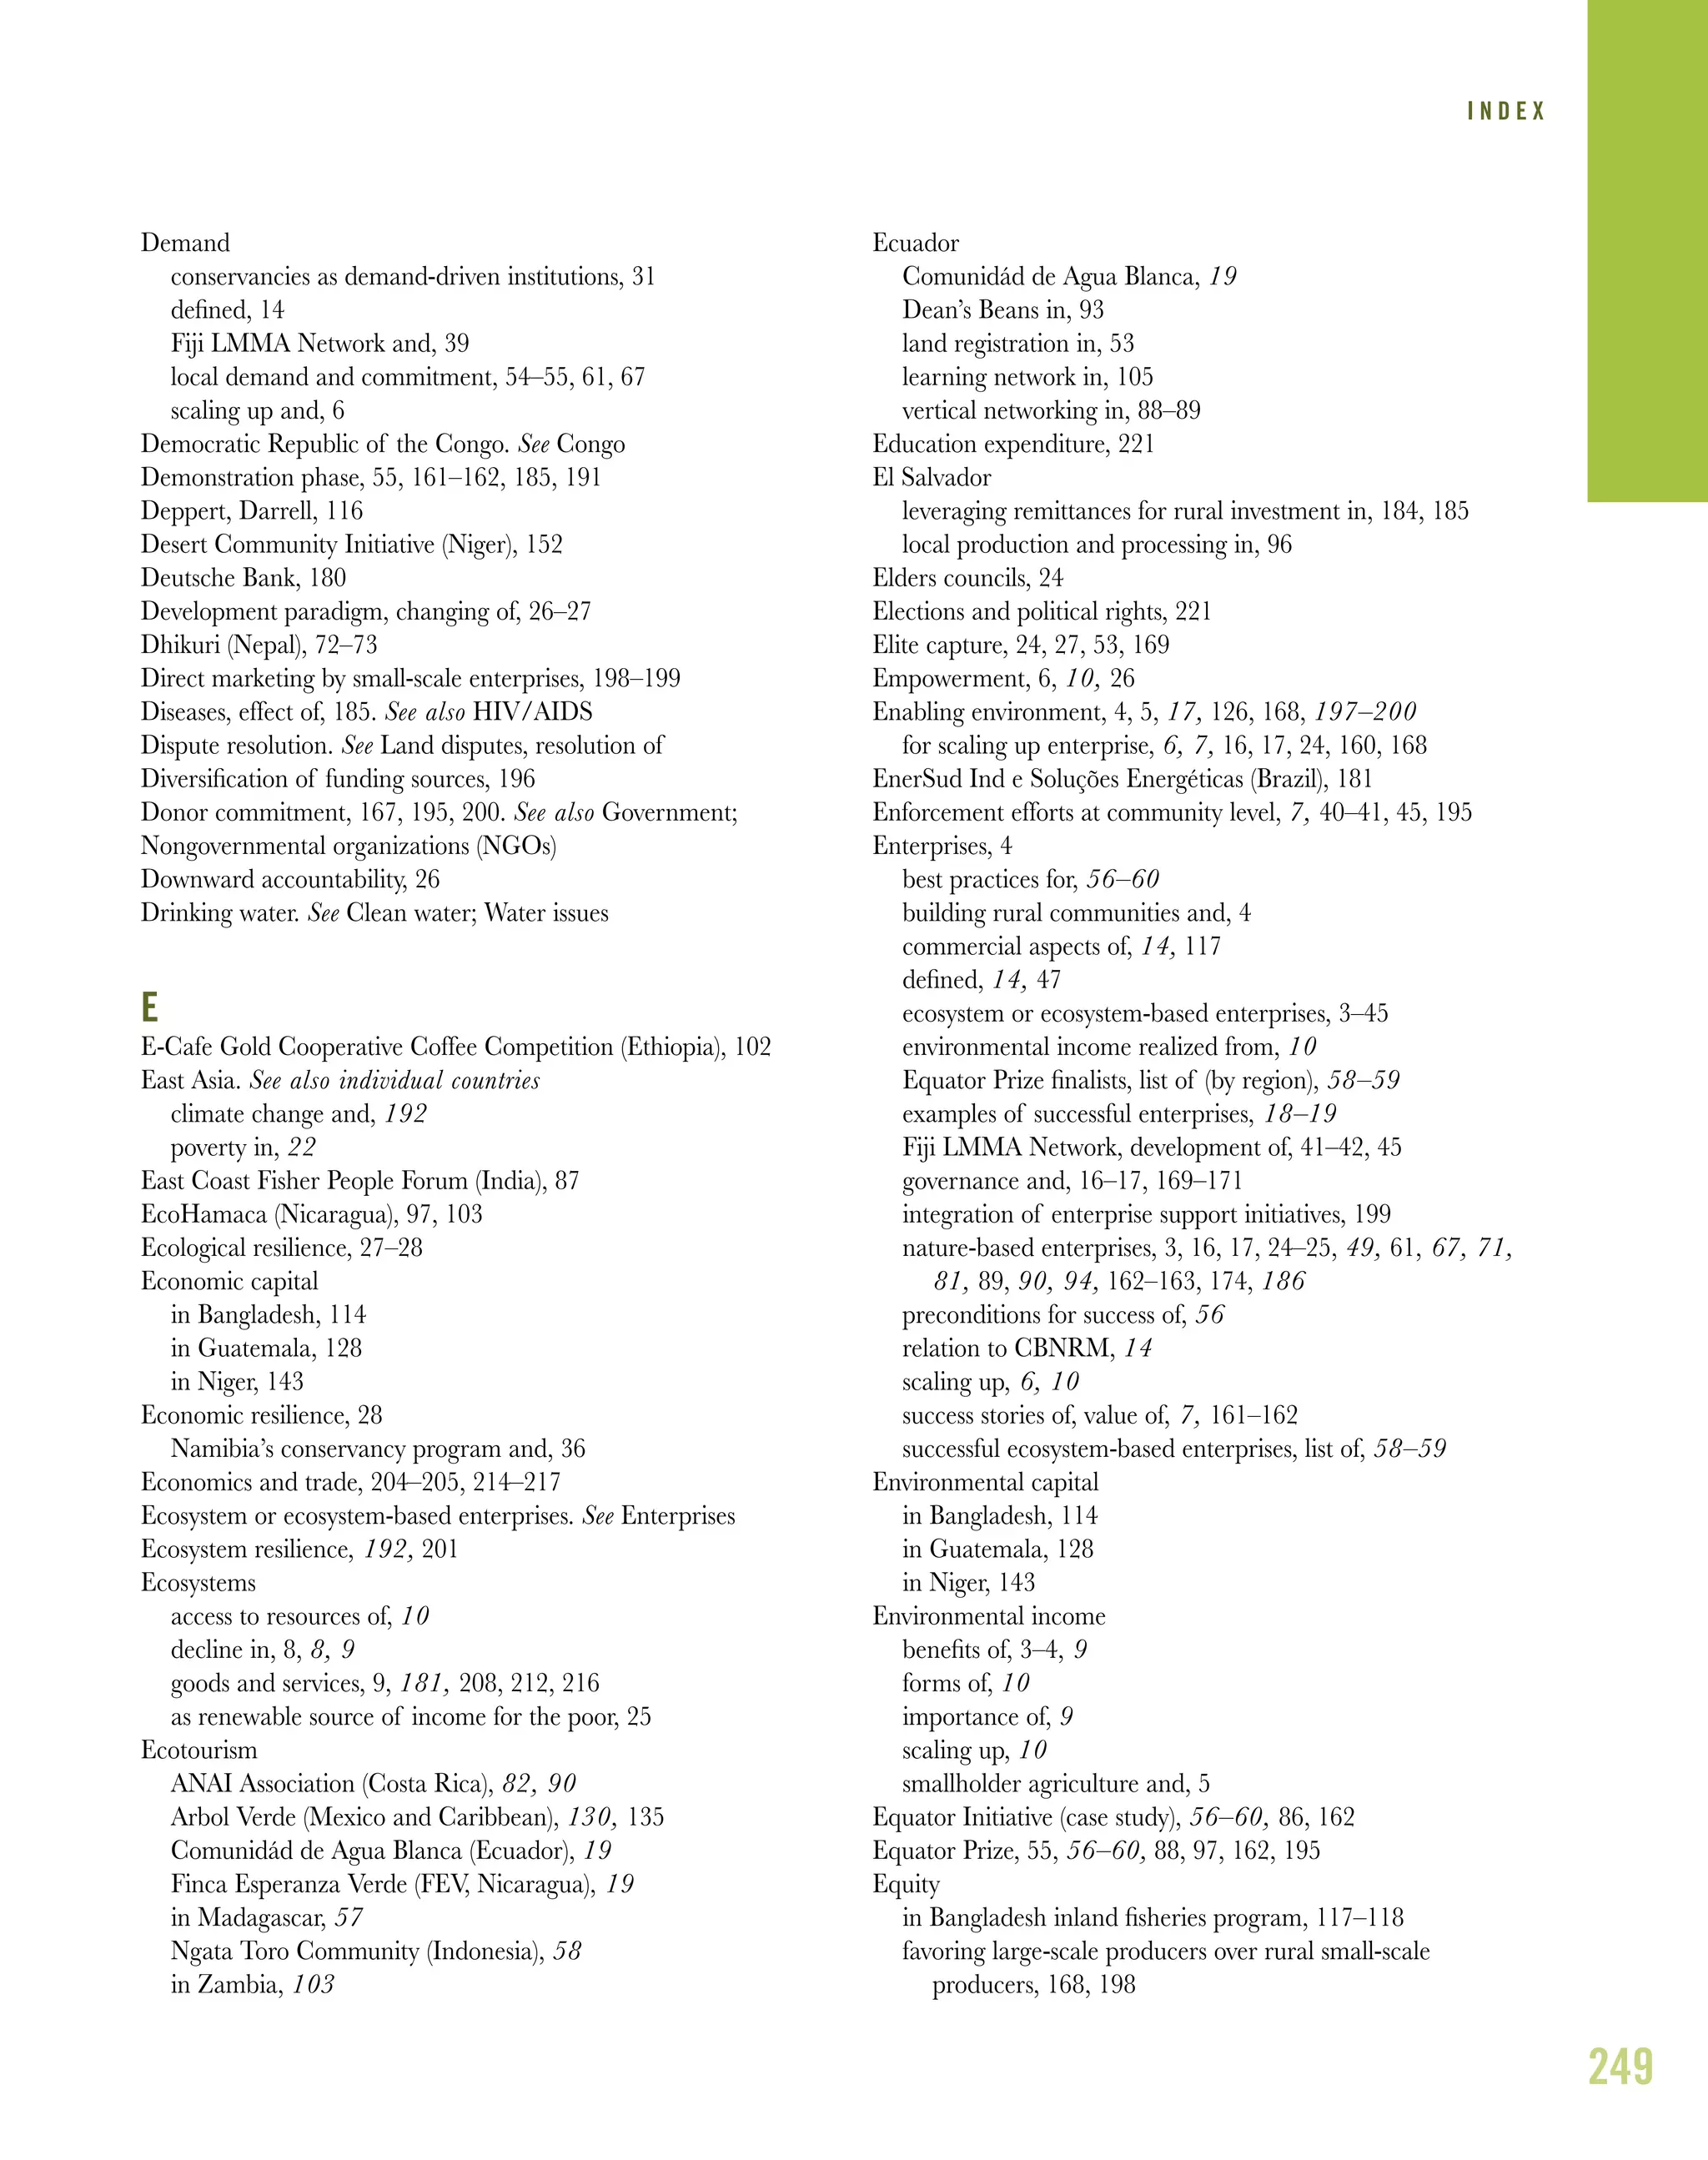
0%
20%
40%
60%
80%
100%
Tama Kolloma Baba Batodi Dan Saga Boukanda
Wood
Hay
Village
Source: Abdoulaye and Ibro 2006: 43
Area: 1 hectare
No. Trees protected: 40/hectare
No. stems protected per tree: 5 stems/stump
Year 1 40 stems x 0.10 cents US$ 4
Year 2 40 stems x 0.70 cents US$ 28
Year 3 40 stems x US$1.50 US$ 60
Year 4 40 stems x US$ 3.50 US$ 140
Year 5 40 stems x US$ 3.50 US$ 140
Year 6 40 stems x US$ 3.50 US$ 140
Total US$ 512
Source: Rinaudo 2005b.
SAMPLE WOOD INCOME BENEFITS FOR FARMERS
PERCENT OF RURAL HOUSEHOLDS EARNING INCOME
FROM WOOD AND HAY IN 2005](https://image.slidesharecdn.com/worldresources2008rootsofresilience-150506081253-conversion-gate02/75/World-resources-2008_roots_of_resilience-162-2048.jpg)
![156
from it. [Such] approaches… will be more and more important
for Niger and for other countries” (McGahuey 2008).
With two thirds of Africa either desert or drylands, this
potential has not been lost on donors, neighboring governments,
and international NGOs. While the vast, spontaneous spread of
re-greening in Niger is unique, tree regeneration and soil and
water conservation projects have also been successfully imple-
mented in other Sahelian countries, notably Burkina Faso, Mali,
Senegal, the Gambia, and Guinea (Winterbottom 2008). Organ-
isation for Economic Co-operation and Development donor
countries, working with the Club du Sahel and the Permanent
Interstate Committee for Drought Control in the Sahel, have
implemented successful programs supporting decentralized
natural resource management, land tenure, and forestry code
reforms (Winterbottom 2008).
During the 1990s, USAID duplicated its policy reform
assistance to Niger in other West African countries, including
Mali, Senegal, and Guinea, where it helped governments reform
forest codes. These reforms recognized farmers’ rights to
Sometimes costly technology is less important than patience and
persistence. The FMNR approach has succeeded in restoring and
improving vast swaths of land in Niger using little more than the time
and persistence of the staff of NGOs and aid agencies. No new technol-
ogy was involved, and no special seeds or other agricultural inputs,
simply the willingness of the NGOs to support the first adopters of the
practice and to take advantage of every chance to demonstrate the
impact of FMNR to other farmers. Even with unexpected setbacks, these
organizations stayed close to the farmers and kept encouraging them.
The result, over time, has been the significant improvement of more
than half the cultivated land in Niger.
Tradition and fear are powerful forces that must be accommo-
dated. The fact that most farmers who had allowed trees to grow on
their land in exchange for food support later uprooted the trees, even
after the benefits of that practice were apparent, demonstrates the
difficulty of securing change in rural and traditional cultures. The NGOs
and donors understood the strength of these traditions, and they
overcame them with patience and perseverance.
Livelihood improvements can also improve community stability.
In rural Sahelian communities, the dry season leaves families seeking
alternative sources of income and food. It is something of a ritual for
men to leave the village for several months at a time seeking paying
work in larger towns and cities. Not only does this exodus increase the
pressure on those left behind, it decreases social cohesion within
communities and commonly results in the introduction of diseases such
as HIV when the men return. One of the important benefits of the
increased productivity from FMNR is that it can provide more in-village
economic opportunities for men and women, reducing the need to leave
to seek work, and so enhancing community resilience. This is a benefit
that we have seen in several cases studies in WRR 2008 and 2005.
Simple methods of communication can yield significant benefits.
The widespread adoption of FMNR practices in Niger was, to a very
large extent, due to simple word-of-mouth…what today is called “viral
communication.” The program began with a few brave souls willing to
break with tradition. It expanded as neighbors witnessed the visible
agricultural and economic improvements created by these changes and
as farmers conversed about the potential benefits of leaving trees in
local and regional markets. Planned visits of farmers to FMNR commu-
nities resulted in a continued spread of the practice. Today, about 5
million ha have benefited; more than 250,000 ha of land that was once
considered unusable is now producing crops, and a significant portion
of the nation’s farmers are involved.
Inclusion is important. As communities in Niger began to adopt FMNR
and water conservation practices, decisions about the use of common
lands and tree protection were necessary. The inclusion of all affected
parties, not just land-owning farmers—women, nomadic herders—was
critical for broad community acceptance of change and the effective-
ness of the new rules.
LEARNING FROM NIGER’S RE-GREENING](https://image.slidesharecdn.com/worldresources2008rootsofresilience-150506081253-conversion-gate02/75/World-resources-2008_roots_of_resilience-168-2048.jpg)
![157
manage trees and to redefine the role of forestry officers as
extension agents, supporting community-based management
(USAID et al. 2002:42, 137). As in Niger, USAID also provided
assistance in Mali and Senegal to help implement newly enacted
forest codes (USAID et al. 2002: 137).
Barriers remain, however, to achieving the level of scale-up
for farmer-led natural resource management witnessed in Niger.
“Unfortunately, key enabling conditions are not yet fully estab-
lished in most countries across West Africa,” says International
Resource Group natural resources management (NRM) expert
Bob Winterbottom, who worked through USAID as Natural
Resources Management Advisor to Niger’s Ministry of
Environment from 1993 to 1996. “An important challenge for
donors and governments will [be] to reinforce their efforts to
reduce barriers to FMNR, such as high taxes on wood and
other ‘natural products’ harvested and marketed by rural
populations, and…onerous permit requirements that discour-
age investment in producing and marketing forest products”
(Winterbottom 2008).
Equally important in creating the incentive to change
among farmers is granting secure land and tree tenure—still
lacking in some West African countries—and the transfer of
rights and authority to local communities to control access to
and use of natural resources. As Niger’s experience has shown,
when farmers are given the rights and tools to control their own
economic destiny, both land and people benefit.
Creating Resilience to Climate Change
The Sahel has been identified as one of the areas most vulnera-
ble to increased drought in a warming climate. While rains have
been relatively good in recent years (except 2004), the long-term
projections are for longer and more frequent droughts across the
region as global temperatures rise (IPCC 2007:444, 447–48). In
the absence of effective natural resource management approaches
such as FMNR in Niger, this raises the threat of future famines
approaching the devastating scale of the 1970s; it also promises
to further the desertification of fragile lands in the Sahel. Yet
development experts and intermediary organizations are hoping
that region-wide expansion of FMNR and other proven land
management programs will help the region increase its resilience
in the face of changing climate (Winterbottom 2008).
Winterbottom notes: “The development community needs
better models for poverty reduction and rural development that
simultaneously assist these populations in adapting to climate
change. The experience in Niger has demonstrated that incorpo-
rating FMNR and other NRM practices are key elements of
such a model” (Winterbottom 2008). Gray Tappan, a geogra-
pher who measures the spread of FMNR across Niger, has seen
these tangible effects throughout his travels: “[Adopting commu-
nities] have become much more resilient to drought in the last 20
years because of the increase in vegetation cover. Crops can fail,
but the farmers, the herders, have something to fall back on. And
that is the trees—the wood, the fruit” (Harris 2007).
One opportunity to extend these cost-effective resilience-
building techniques to more communities would be to integrate
them into the National Adaptation Programmes for Action
(NAPAs) of the countries of the Sahel. The NAPAs are adapta-
tion strategy plans written by developing-country governments
under the United Nations Framework Convention on Climate
Change (CNEDD 2006:3). FMNR can achieve many of the
goals of Niger’s current NAPA, but unlike the actions recom-
mended in the present version, it would not require extensive
external technical and financial assistance (CNEDD 2006:7–8).
Another opportunity to increase the resilience that comes
with FMNR across the Sahel is a new international alliance of
NGOs and research organizations that is developing a Sahel Re-
Greening Initiative. The Initiative will mobilize donor funding to
build on the grassroots successes of FMNR across the West
African Sahel (Reij 2008).
Niger’s current government appears more capable than
earlier administrations of instituting the new Rural Code to
allow for institutionalization of FMNR and other community
conservation practices across Niger. The new government’s
Rural Code Secretariat, created in 2006, is also getting consider-
able support from donors (Wentling 2008a). It is hoped that the
lessons of the drought in 2004, which left many individuals and
communities that did not practice FMNR vulnerable, will help
convince farmers who continue to clear their land indiscrimi-
nately of the benefits of better management.
But there are new challenges. Where tree regeneration is
widely practiced, community and local governments need to act
to resolve conflicts over access to natural resources and property
rights to formerly abandoned land that has been restored
(Winterbottom 2008). In particular, the rights of the more
vulnerable—nomadic herders, the landless, and women—to
equitably gain access to the benefits of FMNR need to be
strengthened (Tougiani et al. 2008:12–15). The gains made by
the current generation of women, for example, could be eroded
unless Niger’s inheritance laws are revised to enable land and
livestock to pass from mother to daughter (BBC 2006).
Nevertheless, in its proven impacts and ready scaleability,
FMNR and associated soil and water conservation practices
provide a potentially transformative model for natural resource
management in the drylands of Africa and beyond.
T U R N I N G B A C K T H E D E S E R T](https://image.slidesharecdn.com/worldresources2008rootsofresilience-150506081253-conversion-gate02/75/World-resources-2008_roots_of_resilience-169-2048.jpg)
![Chapter 1
Main Text
I Adger, W.N. 2000. “Social and Ecological Resilience: Are They Related?”
Progress in Human Geography 24(3):347–364. Online at http://www.uea.ac.uk/
env/people/adgerwn/prghumangeog2000.pdf.
I Arcand, J., and L. Bassole. 2007. Does Community Driven Development
Work? Evidence From Senegal. Paper presented at African Economic Confer-
ence 2007, Addis Ababa, United Nations Economic Commission for Africa,
Nov. 16. Online at www.uneca.org/aec/documents/Jean-Louis%20Arcand_
Leandre%20Bassole.pdf.
I Azim, M.E., M.A. Wahab, and M.C.J. Verdegem. 2002. “Status of Aquaculture
and Fisheries in Bangladesh.” World Aquaculture 34(4):37–40, 67.
I Bebbington, A., and T. Carroll. 2000. “Induced Social Capital and Federa-
tions of the Rural Poor.” Social Capital Initiative Working Paper No. 19.
Washington, DC: World Bank. Online at http://siteresources.worldbank.org/
INTSOCIALCAPITAL/Resources/Social-Capital-Initiative-Working-Paper-
Series/SCI-WPS-19.pdf.
I Binswanger, H., and T. Nguyen. 2004. Scaling Up Community-Driven
Development for Dummies. Washington, DC: World Bank. Online at http://
info.worldbank.org/etools/library/view_p.asp?lprogram=1&objectid=81570
I Blue Ventures Madagascar. 2008. Expeditions: Andavadoaka. London: Blue
Ventures. Online at http://www.blueventures.org/expeditions_andavadoaka.htm.
I Boudreaux, K. 2007. “State Power, Entrepreneurship, and Coffee: The
Rwandan Experience.” Policy Comment No. 15, Mercatus Policy Series.
Arlington, VA, USA: George Mason University. Online at http://ssrn.com/
abstrats=1026935.
I Brenson-Lazan, G. 2003. Groups and Social Resilience Building. West Hartford,
CT, USA: Amauta International, LLC. Online at http://www.communityatwork.com/
resilience/RESILIENCIAENG.pdf.
I Briguglio, L., G. Cordina, S. Bugeja, and N. Ferrugia. 2005. Conceptualiz-
ing and Measuring Economic Resilience. Malta: Islands and Small States
Institute, University of Malta. Online at http://home.um.edu.mt/islands/
resilience_index.pdf.
I FAO (Food and Agriculture Organization of the United Nations). 2005a.
Global Forest Resources Assessment 2005. Rome: FAO. Online at
http://www.fao.org/DOCREP/008/a0400e/a0400e00.htm.
I FAO (Food and Agriculture Organization of the United Nations). 2005b.
National Aquaculture Sector Overview: Bangladesh. Rome: FAO. Online at
http://www.fao.org/fishery/countrysector/naso_bangladesh#tcN110052.
I FAO (Food and Agriculture Organization of the United Nations). 2007a. State
of the World’s Fisheries and Aquaculture 2006. Rome: FAO. Online at
ftp://ftp.fao.org/docrep/fao/009/a0699e/a0699e.pdf.
I FAO (Food and Agriculture Organization of the United Nations). 2007b.
Adaptation to Climate Change in Agriculture, Forestry, and Fisheries:
Perspective, Framework, and Priorities. Rome: FAO. Online at
ftp://ftp.fao.org/docrep/fao/009/j9271e/j9271e.pdf.
I Farrington, J., and C. Boyd. 1997. “Scaling Up the Participatory Management
of Common Pool Resources.” Development Policy Review 15:371–391.
I FEV (Finca Esperanza Verde). 2008. About Us. San Ramón, Nicaragua: FEV.
Online at http://www.fincaesperanzaverde.org.
I Folke, C., S. Carpenter, T. Elmqvist, L. Gunderson, C.S. Holling, B. Walker, J.
Bengtsson, F. Berkes, J. Colding, K. Danell, M. Falkenmark, L. Gordon, R.
Kasperson, N. Kautsky, A. Kinzig, S. Levin, K.-G. Mäler, F. Moberg, L. Ohlsson,
P. Olsson, E. Ostrom, W. Reid, J. Rockström, H. Savenije, and U. Svedin. 2002.
Resilience and Sustainable Development: Building Adaptive Capacity in a
World of Transformation. Background Paper for the Environmental Advisory
Council to the Swedish Government. Stockholm: Swedish Ministry of the
Environment. Online at http://www.sou.gov.se/mvb/pdf/resiliens.pdf.
I Forest Trends. 2005. Rural Resource Initiative: A New Global Initiative
Advancing Forest Tenure, Policy and Market Reforms to Reduce Rural
Poverty, Strengthen Forest Governance, Conserve and Restore Forest Ecosys-
tems and Achieve Sustainable Forest-Based Economic Growth: Concept Note.
Washington, DC: Forest Trends. Online at http://www.forest-trends.org/
documents/publications/conceptnotes/RRI%20Concept%20Note%20-
%20Nov%201[1].doc.pdf.
I Füssel, H-M. 2007. “Vulnerability: A Generally Applicable Conceptual Frame-
work for Climate Change Research.” Global Environmental Change
17:155–167.
I Glavovic, B. 2005. Social Resilience: Building Layers of Resilience to Transcend
Waves of Adversity. PowerPoint presentation at Resilient Infrastructure Confer-
ence, Rotorua, New Zealand, Aug. 8. Online at http://www.caenz.com/info/
2005Conf/pres/Glavovic.pdf.
I Glenzer, K. 2008. “The Power of Local Natural Resource Governance in
Conflict Contexts.” Powerpoint presentation at Woodrow Wilson International
Center for Scholars, Washington, DC. Feb. 28.
I Grootaert, C., and T. van Bastelaer. 2001. Understanding and Measuring
Social Capital: A Synthesis of Findings and Recommendations from the
Social Capital Initiative. Social Capital Initiative Working Paper No. 24.
Washington, DC: World Bank. Online at http://go.worldbank.org
/W8FMEK6FRO.
I ICRISAT (International Crops Research Institute for the Semi-Arid Tropics).
2007. Rural Prosperity Through Integrated Watershed Management: A Case
Study of Gokulpura-Goverdhanpura in Eastern Rajasthan. Pantancheru,
Andhra Pradesh, India: ICRISAT. Online at http://www.icrisat.org/Journal/
volume5/aes/aes6.pdf.
I Kura, Y., C. Revenga, E. Hoshino, and G. Mock. 2004. Fishing for Answers:
Making Sense of the Global Fish Crisis. Washington, DC: World Resources Insti-
tute. Online at http://archive.wri.org/publication_detail.cfm?pubid=3866#1.
I Larson, A., and J. Ribot. 2007. “The Poverty of Forestry Policy: Double Standards
on an Uneven Playing Ground.” Sustainability Science 2(2):189–204.
I MACH (Management of Aquatic Ecosystems through Community
Husbandry). 2006. MACH-II Briefing Packet for USAID Evaluation Team,
Part I: Achievement, Influence and Future. Dhaka: MACH.
I Meinzen-Dick, R. 2008. Senior Research Fellow. International Food Policy
Research Institute, Washington, DC. Personal Communication. Feb. 14.
I MA (Millennium Ecosystem Assessment). 2005. Ecosystems and Human
Well-Being: General Synthesis. Washington, DC: Island Press. Online at
http://www.millenniumassessment.org/documents/document.356.aspx.pdf
I Molnar, A., M. Liddle, C. Bracer, A. Khare, A. White, and J. Bull. 2007.
Community Based Forest Enterprises in Tropical Forest Countries: Status
and Potential. Washington, DC: Forest Trends; Rights and Resources
Initiative; and International Tropical Timber Organization. Online at
http://www.rightsandresources.org/documents/index.php?pubID=109.
I Morton, J., and S. Anderson. 2008. “Climate Change and Agrarian Societies
in Drylands.” Paper presented at the World Bank workshop The Social
224
References](https://image.slidesharecdn.com/worldresources2008rootsofresilience-150506081253-conversion-gate02/75/World-resources-2008_roots_of_resilience-236-2048.jpg)
![227
and Environmental Management; Australia: Department of the Environment
and Water Resources; Jakarta, Indonesia: Worldwide Fund for Nature. Online
at http://www.nature.org/initiatives/protectedareas/files/mpa_report.pdf.
I Leisher, C., P. van Beukering, and L.M. Scherl. 2007b. Nature’s Investment
Bank: How Marine Protected Areas Contribute to Poverty Reduction. Video.
Arlington, Virginia, USA: The Nature Conservancy, Amsterdam: Poverty Reduc-
tion and Environmental Management; Australia: Department of the
Environment and Water Resources; Jakarta, Indonesia: Worldwide Fund for
Nature. Online at http://www.prem-online.org/index.php?p=projects&cid=19.
I LMMA (Locally Managed Marine Area) Network. 2005a. History of the LMMA
Network. Lami, Fiji: LMMA Network. Online at http://www.lmmanetwork.org/
Site_Page.cfm?PageID=33.
I LMMA (Locally Managed Marine Area) Network. 2005b. What is an LMMA?
Lami, Fiji: LMMA Network. Online at http://www.lmmanetwork.org/
Site_Page.cfm?PageID=15.
I LMMA (Locally Managed Marine Area) Network. 2006a. A Focus on Lessons
Learned. Annual Report of the LMMA Network for 2005. Lami, Fiji: LMMA Network.
Online at http://www.lmmanetwork.org/Site_Documents/Grouped/LMMA%
202005%20Annual%20Report%20Final%2030%20May%202006.pdf.
I LMMA (Locally Managed Marine Area) Network. 2006b. Newsletter. Issue 7,
October. Lami, Fiji: LMMA Network. Online at http://lmmanetwork.org/
Site_Documents/Grouped/LMMA%20Newsletter%207%20Oct%202006.pdf.
I LMMA (Locally Managed Marine Area) Network. 2007a. Enhancing LMMA
Effectiveness through Continued Learning: Annual Report of the LMMA Network
for 2006. Lami, Fiji: LMMA Network. Online at: http://www.lmmanetwork.org/
Site_Documents/Grouped/LMMA%202006%20Annual%20Report%20final%2
013%20June%2007.pdf.
I LMMA (Locally Managed Marine Area) Network. 2007b. Lessons Learned.
Video. Lami, Fiji: LMMA Network. Online at http://www.lmmanetwork.org/
Site_Page.cfm?PageID=67.
I Narsey, W. 2007. “Truth Behind Our Poverty.” Fiji Times, June 10.
I O’Garra, T. 2007. Estimating the Total Economic Value (TEV) of the Navakavu
LMMA (Locally Managed Marine Area) in Vitu Levu Island (Fiji). Noumea, New
Caledonia: Initiative for the Protection and Management of Coral Reefs in
the Pacific (CRISP). Online at http://www.icriforum.org/secretariat/gmdc/pdf/
CRISP_TEV_REPORT.pdf.
I Rarabici, V. 2007. “Fish Wardens on Alert for Illegal Fishermen.” Fiji Times
Online. July 23. Online at http://www.lmmanetwork.org/Site_Documents/
Grouped/Fiji%20Times%20Online%20July%2007.pdf.
I Tawake, A. 2008 [Forthcoming]. “Scaling-Up Networks of Locally Managed
Marine Areas (LMMAs) to Island Wide Ecosystem Management while Decen-
tralizing the Effort of Fiji LMMA Network and its Implementation from
National to Provincial Levels.” Suva, Fiji: Institute of Applied Sciences,
University of the South Pacific. Pages based on manuscript of June 13, 2007.
I Tawake, A, L. Nailetica, J. Ravula, M. Crabbe, H. Dugmore, G. Hill, K. Picker-
ing, and R. Tamanivalu. 2005. Kadavu Yabula Management Support Team: A
Report on the Effectiveness and Site Suitability of 5 Tabu Areas (MPAs) in
Kadavu. Institute of Applied Sciences (IAS), Technical Report No. 2005/09.
Suva, Fiji: IAS, University of the South Pacific. Online at http://ias.fst.usp.ac.fj/
index.php?id=3469&tx_kharticlepages_pi1[page]=4&cHash=044b9cf14b.
I USP (University of the South Pacific). 2007. Final Report to the MacArthur
Foundation: Improving the Art and Science of Effective Conservation in Fiji
and the Western Pacific. Suva, Fiji: USP.
I van Beukering, P. J. H., L. M. Scherl, E. Sultanian, C. Leisher, and P. S. Fong.
2007. Case Study 1: Yavusa Navakavu Locally Managed Marine Area (Fiji).
Arlington, Virginia, USA: The Nature Conservancy; Amsterdam: Poverty
Reduction and Environmental Management; Australia: Department of the
Environment and Water Resources; Jakarta, Indonesia: Worldwide Fund for
Nature. Online at http://www.prem-online.org/archive/19/doc/Country%
20Report%20Navakavu%20_Fiji_.pdf.](https://image.slidesharecdn.com/worldresources2008rootsofresilience-150506081253-conversion-gate02/75/World-resources-2008_roots_of_resilience-239-2048.jpg)
![Chapter 2
Main Text
I ActionAid India. 2002. Critical Webs of Power. New Delhi: ActionAid India.
Online at http://www.actionaid.org/main.aspx?PageID=278.
I Agrawal, A. 2001. “Common Property Institutions and Sustainable Gover-
nance of Resources.” World Development 29(10):1649–1672.
I AIDER (Asociación para la Investigación y Desarrollo Integral). 2007.
Pucallpa, Ucayali, Perú: AIDER. Online at http://aider.com.pe/home.
I AKRSP (Aga Khan Rural Support Programme). 2003. Introduction. AKRSP.
Online at http://www.akrsplessons.org/akrsp.php.
I Alsop, R., D. Sjoblom, C. Namazie, and P. Patil. 2000. Community-Level User
Groups in Three World Bank Aided Projects: Do They Perform as Expected?
Washington, DC: World Bank. Online at http://povlibrary.worldbank.org/library/
view/10285/.
I Alsop, R. and B. Kurey. 2005. Local Organizations in Decentralized Develop-
ment: Their Functions and Performance in India. Washington, DC: World
Bank. Online at http://go.worldbank.org/S9B3DNEZ00
I Alter Eco. 2007. Alter Eco Fair Trade. San Francisco: Alter Eco, Inc. Online at
http://www.altereco-usa.com/main.php?section=home&subsection=main.
I ANAI (Asociación ANAI). 2005a. About ANAI. San Jose, Costa Rica: Asociación
ANAI. Online at http://www.anaicr.org/gallery/en/index.php?option=
com_content&task=view&id=53&Itemid=114. Viewed Jan. 30, 2008.
I ANAI (Asociación ANAI). 2005b. ANAI History. San Jose, Costa Rica: Asociación
ANAI. Online at http://anaicr.org/index.php?option=com_content&task=
view&id=15&Itemid=131. Viewed Jan. 30, 2008.
I ANAI (Asociación ANAI). 2005c. ANAI Accomplishments. San Jose, Costa Rica:
Asociación ANAI. Online at http://anaicr.org/index.php?option=com_content&task=
view&id=16&Itemid=135. Viewed Jan. 30, 2008.
I ANAI (Asociación ANAI). 2005d. Training and Leadership. San Jose, Costa Rica:
Asociación ANAI. Online at http://anaicr.org/index.php?option=com_content&task=
view&id=38&Itemid=82. Viewed Jan. 30, 2008.
I ANAI (Asociación ANAI). 2005e. Gandoca Beach Program. San Jose, Costa
Rica: Asociación ANAI. Online at http://anaicr.org/index.php?option=com_
content&task=view&id=106&Itemid=182. Viewed Jan. 30, 2008.
I ANAI (Asociación ANAI). 2005f. Sea Turtle Program Accomplishments. San Jose,
Costa Rica: Asociación ANAI. Online at http://anaicr.org/index.php?option=com_
content&task=view&id=114&Itemid=190. Viewed Jan. 30, 2008.
I Andersson, E., R. Wilson, and D. Warburton. 2005. The True Costs of Public Partic-
ipation. London: Involve. Online at http://www.involve.org.uk/index.cfm?fuseaction=
main.viewSection&intSectionID=390.
I ANSAB (Asia Network for Sustainable Agriculture and Bioresources). 2005a.
About ANSAB. Kathmandu, Nepal: ANSAB. Online at http://ansab.org/
about.php?linkno=24.
I ANSAB (Asia Network for Sustainable Agriculture and Bioresources). 2005b.
Nepal NTFP Alliance: Final Report. Kathmandu, Nepal: ANSAB. Online at
http://www.frameweb.org/ev02.php?ID=17653_201&ID2=DO_TOPIC.
Viewed 1/30/08.
I ANSAB (Asia Network for Sustainable Agriculture and Bioresources). 2007.
Annual Report, 2006. Kathmandu, Nepal: ANSAB.
I Barrett, C. D. Lee, and J. McPeak. 2005. “Institutional Arrangements for
Rural Poverty Reduction and Resource Conservation.” World Development
33(2):193–197.
I Basorun, Y.O., and J.O. Olakulehin. 2007. “The Lagos State Fish Farmers’
Association.” LEISA Magazine, How Farmers Organise 23(1):10–11. Online
at http://www.leisa.info/index.php?url=magazine-details.tpl&p[readOnly]=
0&p[_id]=90648.
I Bebbington, A. and T. Carroll. 2000. “Induced Social Capital and Federations
of the Rural Poor.” Social Capital Working Paper No. 19. Washington, DC:
World Bank. Online at http://siteresources.worldbank.org/INTSOCIALCAPITAL/
Resources/Social-Capital-Initiative-Working-Paper-Series/SCI-WPS-19.pdf.
I Beltran, J., P. Orozco, V. Zapata, J. Sanz, M. Roa, and A. Schmidt. 2004.
“Scaling Out and Scaling Up—The Importance of Watershed Management
Organizations.” In Scaling Up and Out: Achieving Widespread Impact
Through Agricultural Research, D. Pachico and S. Fujisaka, eds., pp.152-
171. Cali, Colombia: International Center for Tropical Agriculture (CIAT).
Online at http://www.ciat.cgiar.org/impact/pdf/scaling_up.pdf.
I Berkes, F., C. Seixas, D. Fernandes, D. Medeiros, S. Maurice, and S. Shukla.
2004. Lessons from Community Self-Organization and Cross-Scale Linkages in
Four Equator Initiative Projects. Winnipeg, Canada: Natural Resources Insti-
tute, University of Manitoba. Online at http://www.umanitoba.ca/institutes
/natural_resources/pdf/Lessons%20from%20Community%20Self-
Organization%20and%20CrossScale%20Linkages%20in%20Four%20Eq
uator%20Initiative%20Projects.pdf.
I Best, R., S. Ferris, and A. Schiavone. 2005. Building Linkages and Enhanc-
ing Trust Between Small-Scale Rural Producers, Buyers in Growing Markets
and Suppliers of Critical Inputs. Paper presented at the International
Seminar Beyond Agriculture: Making Markets Work for the Poor, Church
House Conference Centre, Westminster, London, UK. Kent, UK: Crop Post-
Harvest Program, Natural Resources International Limited. Online at
http://www.cphp.uk.com/uploads/documents/CPHPTheme%20papers.pdf.
I Blomley, T. 2006. Mainstreaming Participatory Forestry Within the Local
Government Reform Process in Tanzania. London: International Institute
for Environment and Development. Online at http://www.iied.org/pubs/
display.php?o=14536IIED&n=7&l=71&g=Tanzania.
I Body Shop. a. Shea Butter. UK: The Body Shop International. Online at
http://www.thebodyshop.com/bodyshop/browse/ingredient_detail.jsp?ingre
dientId=500208
I Body Shop. b. Support Community Trade. UK: The Body Shop International.
Online at http://www.thebodyshop.com/bodyshop/values/support_community_
trade.jsp?cmre=default-_-Footer-_-ValuesCommunityTrade.
I Boyd, G. 2005. Organisational Mechanisms that Best Serve the Poor. Discussion
Paper. London: Caledonia Centre for Social Development and International Insti-
tute for Environment and Development. Online at http://www.iied.org/pubs/
pdfs/13515IIED.pdf.
I BRAC. 2005. History. Dhaka, Bangladesh: BRAC. Online at
http://www.brac.net/history.htm.
I BRAC. 2007. BRAC at a Glance. Dhaka, Bangladesh: BRAC. Online at
http://www.brac.net/downloads_files/BRAC%20At%20A%20Glance%20-
%20June%202007.pdf.
I Braun, A., J. Okoth, H. Khaamala, and G. Khisa. 2007. “Building FFS
Networks in East Africa.” LEISA Magazine, How Farmers Organise
23(1):18–19. Online at http://www.leisa.info/index.php?url=magazine-
details.tpl&p[readOnly]=0&p[_id]=90648.
I Breslin, E. 2003. Demand Response Approach in Practice: Why Sustainabil-
ity Remains Elusive. WaterAid Discussion paper. London: WaterAid. Online at
228
W O R L D R E S O U R C E S 2 0 0 8](https://image.slidesharecdn.com/worldresources2008rootsofresilience-150506081253-conversion-gate02/75/World-resources-2008_roots_of_resilience-240-2048.jpg)
![233
I Subedi, B., H.R. Ojha, K. Nicholson, and S.B. Binayee. 2004. Community-Based
Forest Enterprises in Nepal: Case Studies, Lessons and Implications.
Kathmandu, Nepal: Asia Network for Sustainable Agriculture and Bioresources.
I Taylor, P., L. Raynolds, and D. Murray. 2003. One Cup at a Time: Poverty Allevi-
ation and Fair Trade Coffee in Latin America. Fort Collins, Colorado, USA:
Colorado State University. Online at http://www.colostate.edu/Depts/Sociology/
FairTradeResearchGroup/doc/fairtrade.pdf.
I Thiele, G., A. Devaux, C. Velasco, and K. Manrique. 2006. “Horizontal Evalua-
tion: Stimulating Social Learning among Peers.” Institutional Learning and
Change Initiative Brief 13. Rome: Institutional Learning and Change Initia-
tive. Online at http://www.cgiar-ilac.org/downloads/Briefs/ILAC_Brief13.pdf.
I Thi Phi, L., N. Van Duong, N. Ngoc Quong, and P. Lac Vang. 2004. “Making
the Most of Market Chains: Challenges for Small-Scale Farmers and Traders
in Upland Vietnam.” Small and Medium Forest Enterprise Series No. 2.
London: International Institute for Environment and Development. Online at
http://www.iied.org/pubs/display.php?o=9313IIED&n=8&l=47&k=Vietnam.
I Toulmin, C. 2005. “Securing Land and Property Rights in Sub-Saharan Africa:
The Role of Local Institutions.” In How to Make Poverty History: The Central
Role of Local Organizations in Meeting the MDGs. T. Biggs and D. Satterth-
waite, eds., pp. 27–54. London: International Institute for Environment and
Development. Online at http://www.iied.org/pubs/pdfs/11000IIED.pdf.
I Turton, C., M. Warner, and B. Groom. 1998. “Scaling Up Participatory Water-
shed Development in India: A Review of the Literature.” Overseas Development
Institute (ODI), Agriculture & Extension Network Paper No. 86. London: ODI.
Online at http://www.odi.org.uk/networks/agren/papers/agrenpaper_86.PDF.
I UNDP (United Nations Development Programme). 1998. Capacity Assessment
and Development in a Systems and Strategic Management Context. Technical
Advisory Paper No. 3. New York: UNDP. Online at http://www.pogar.org/
publications/other/undp/governance/capsystech3-98e.pdf.
I UNDP (United Nations Development Programme). 2004. Unleashing Entre-
preneurship: Making Business Work for the Poor. New York: UNDP. Online at
http://www.undp.org/cpsd/report/index.html.
I UNDP (United Nations Development Program). 2006a. Equator Prize 2006
Nomination Form: Nam Ha Ecoguide Service. New York: UNDP. Online at
http://www.equatorinitiative.net/files/2006-053_LaoPDR_NamHaEcoguideService.doc.
I UNDP (United Nations Development Programme). 2006b. “The Costa Rican Organic
Agricultural Movement (MAOCO).” In Community Action to Conserve Biodiversity:
Linking Biodiversity Conservation with Poverty Reduction., pp. 36–37. New York:
UNDP. Online at http://sgp.undp.org/index.cfm?module=ActiveWeb&page=
WebPage&s=biodiversity_case_st.
I UNDP (United Nations Development Programme). 2008a. Equator Initiative.
New York: UNDP. Online at http://www.undp.org/equatorinitiative/.
I UNDP (United Nations Development Programme). 2008b. Capacity Develop-
ment Homepage. New York: UNDP. Online at http://www.capacity.undp.org/
index.cfm?module=ActiveWeb&page=WebPage&s=capacity_development.
I UNDP (United Nations Development Program) Energy and Environment
Group. 2006. Community Action to Conserve Biodiversity: Linking Biodiver-
sity Conservation with Poverty Reduction. New York: UNDP. Online at
http://www.undp.org/equatorinitiative/documents/pdf/biodiversity_case_
studies_english.pdf.
I Uphoff, N. 1992. Local Institutions and Participation for Sustainable Devel-
opment. London: International Institute for Environment and Development.
Online at http://www.iied.org/pubs/display.php?o=6045IIED.
I Uphoff, N. 1999. “Understanding Social Capital: Learning from the Analysis
and Experience of Participation.” In Social Capital: A Multifaceted Perspective,
P. Dasgupta and I. Serageldin, eds. Washington, DC: World Bank. Online at
http://www.worldbank.org.in/external/default/main?pagePK=51187349&piPK
=51189435&theSitePK=295584&menuPK=64187510&searchMenuPK=2956
11&theSitePK=295584&entityID=000094946_99110505361324&searchMe
nuPK=295611&theSitePK=295584.
I Uphoff, N., and L. Buck. 2006. Strengthening Rural Local Institutional
Capacities for Sustainable Livelihoods and Equitable Development.
Washington, DC: World Bank. Online at http://siteresources.worldbank.org/
EXTSOCIALDEVELOPMENT/Resources/244362-1170428243464/3408356-
1170428261889/3408359-1170428299570/Strengthening-Rural-Local-
Institutional-Capacities.pdf
I Uphoff, N., M. Esman, and A. Krishna, eds. 1998. Reasons for Success:
Learning From Instructive Experiences in Rural Development. West Hartford:
Kumarian Press.
I USAID (United States Agency for International Development). 1984. Local
Organizations in Development. USAID Policy Paper. Washington, DC: USAID.
Online at http://www.usaid.gov/policy/ads/200/localorg/localorg.pdf.
I USAID (United States Agency for International Development) and ARD, Inc.
2008. Global Land Tenure Master Database. 2007. Unpublished data. Origi-
nal graphics published in USAID and ARD, Inc. 2007. “Land Tenure and
Property Rights Tools and Regional Reports.” Washington, DC: USAID
EGAT/Natural Resources Management/Land Resources Management Team
and Burlington, Vermont: ARD, Inc. Online at http://prrgp.com/tools.htm.
I USAID (United States Agency for International Development) and WWF (World
Wildlife Fund). 2007. LIFE PLUS Cumulative Progress Towards Achievement
of Strategic Objective Results And Intermediate Results for the Period:
October 1, 2006 – September 30, 2007. Washington, DC: USAID and WWF.
I Valcárcel, V. 2007. T’ikapapa gana el World Challenge 2007. Lima, Peru: Papa
Andina. Dec. 5. Online at http://papandina.cip.cgiar.org/index.php?id=
47&tx_ttnews[tt_news]=52&cHash=de3a74ed43.
I van den Brink, R., G. Thomas, H. Binswanger, J. Bruce, and F. Byamugisha.
2006. “Consensus, Confusion, and Controversy: Selected Land Reform
Issues in Sub-Saharan Africa.” Working Paper No. 71. Washington, DC: World
Bank. Online at http://www.icarrd.org/en/icard_doc_down/TD7.pdf.
I Varughese, G., and E. Ostrom. 2001. “The Contested Role of Heterogeneity in
Collective Action: Some Evidence from Community Forestry in Nepal.” World
Development, 29(5):747–765.
I von Benda-Beckmann, K. 1981. “Forum Shopping and Shopping Forms:
Dispute Processing in a Minanagkabau Village.” Journal of Legal Pluralism
19:117–159.
I WCS (Wildlife Conservation Society). 2006a. WCS Fact Sheet for Zambia: COMACO
ProducerGroupsasEntryPointsforFoodSecurityandDiversifiedLivelihoods.New
York: WCS. Online at http://www.wcs.org/international/Africa/zambia.
I WCS (Wildlife Conservation Society). 2006b. Maize Production in Luangwa
Valley in Relation to Farming Practices: Strategies for Sustainable Agricul-
ture and Natural Resource Conservation. New York: WCS. Online at
http://itswild.org/files/maize-production-in-luangwa-valley-in-relation-to-
farming-practices.pdf.
I WCS (Wildlife Conservation Society). 2007. Zambia. New York: WCS. Online
at http://www.wcs.org/international/Africa/zambia.
I White, A., and A. Martin. 2002. Who Owns the World’s Forests? Forest Tenure
R E F E R E N C E S](https://image.slidesharecdn.com/worldresources2008rootsofresilience-150506081253-conversion-gate02/75/World-resources-2008_roots_of_resilience-245-2048.jpg)

This document provides information about the production of the World Resources 2008 report, which examines how properly designed rural enterprises can help the poor build resilience to climate change impacts. It lists the contributors to the report, including editors, writers, research assistants, and partner organizations. It also includes a table of contents that gives an overview of the report's chapters, which discuss scaling up ecosystem management, building local ownership and capacity, case studies, driving the scaling process, and recommendations. The goal is to argue that enterprises rooted in local ecosystems can improve livelihoods and foster economic, social, and environmental resilience for poor communities.


