Download as PDF, PPTX

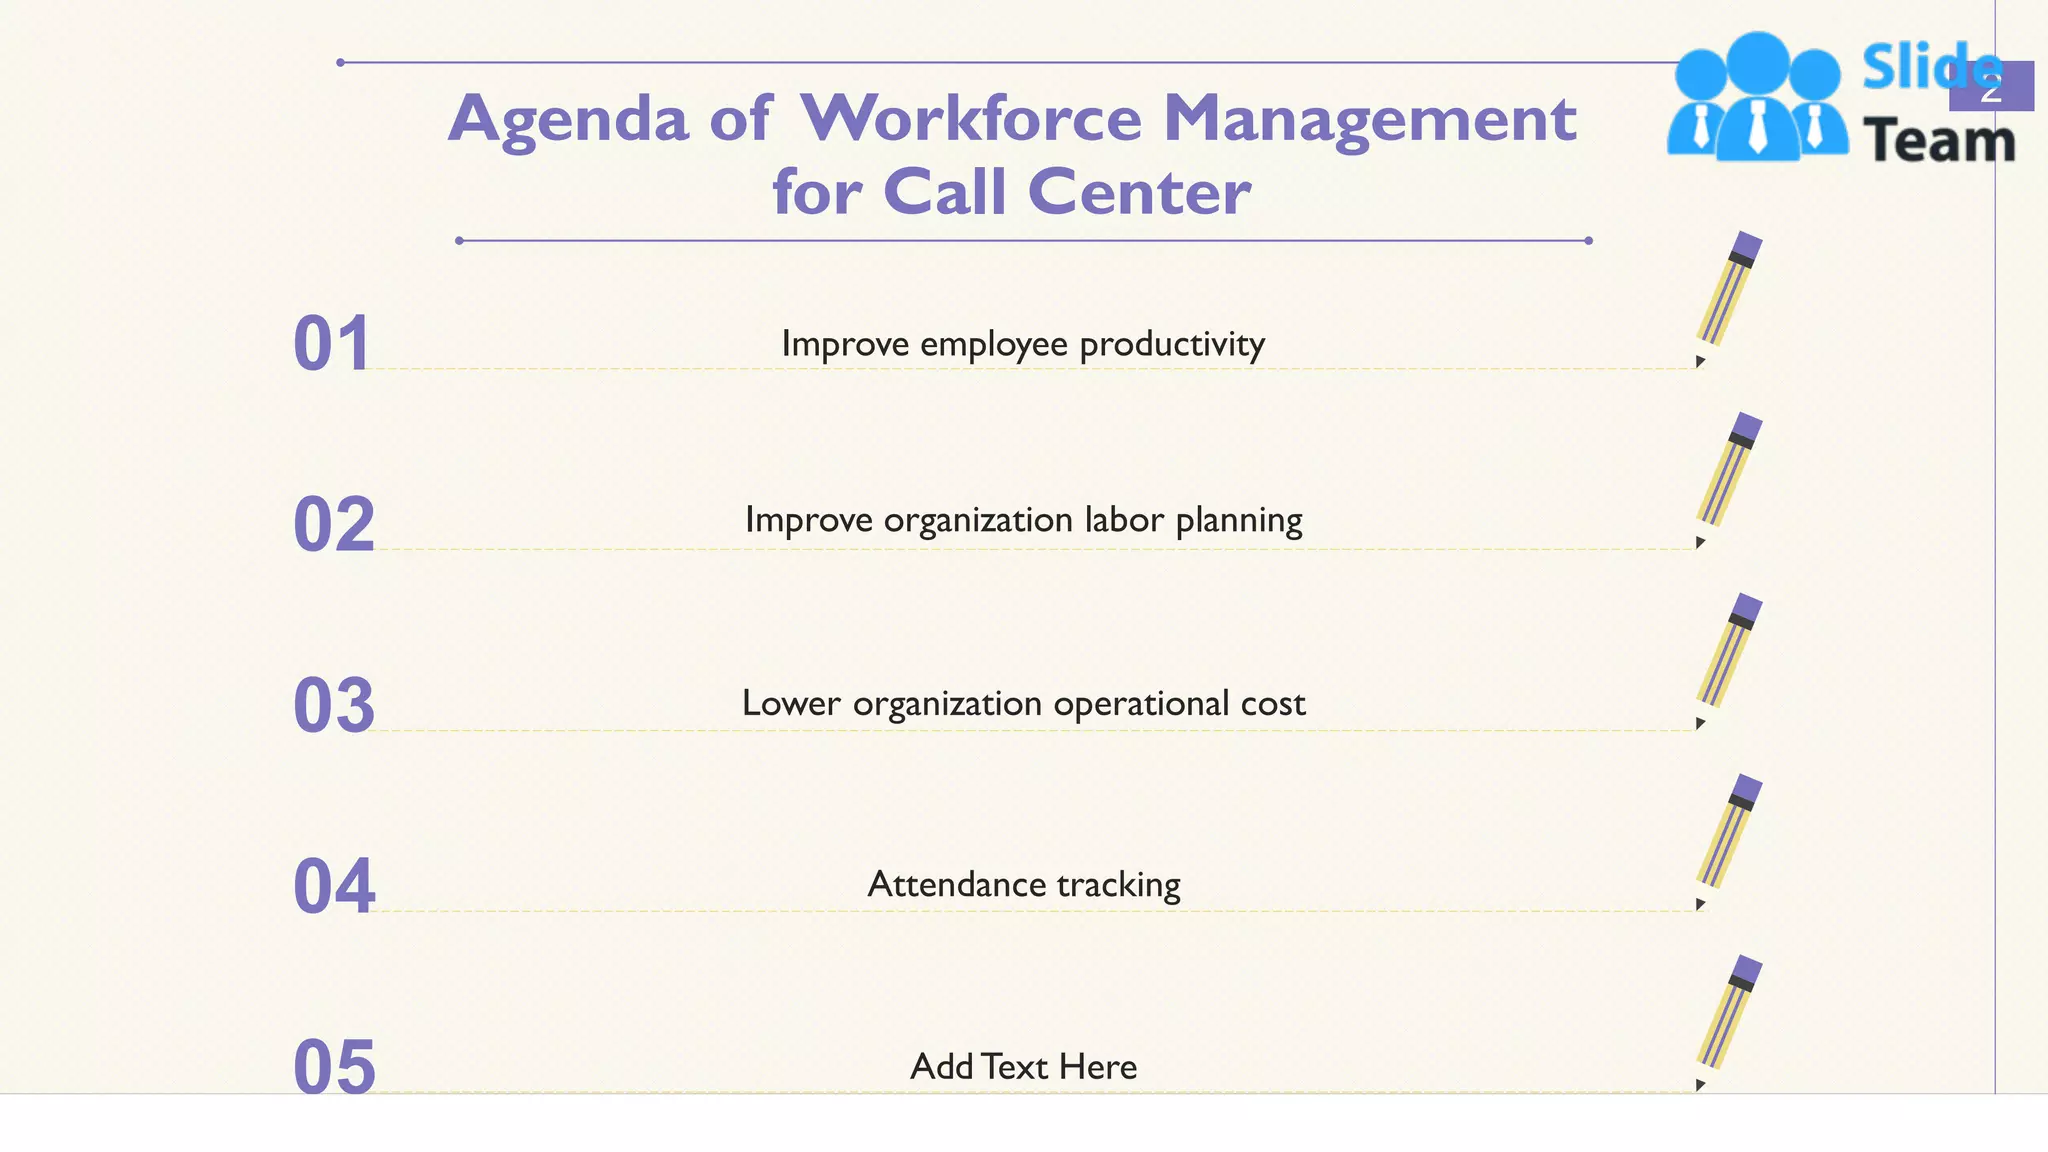
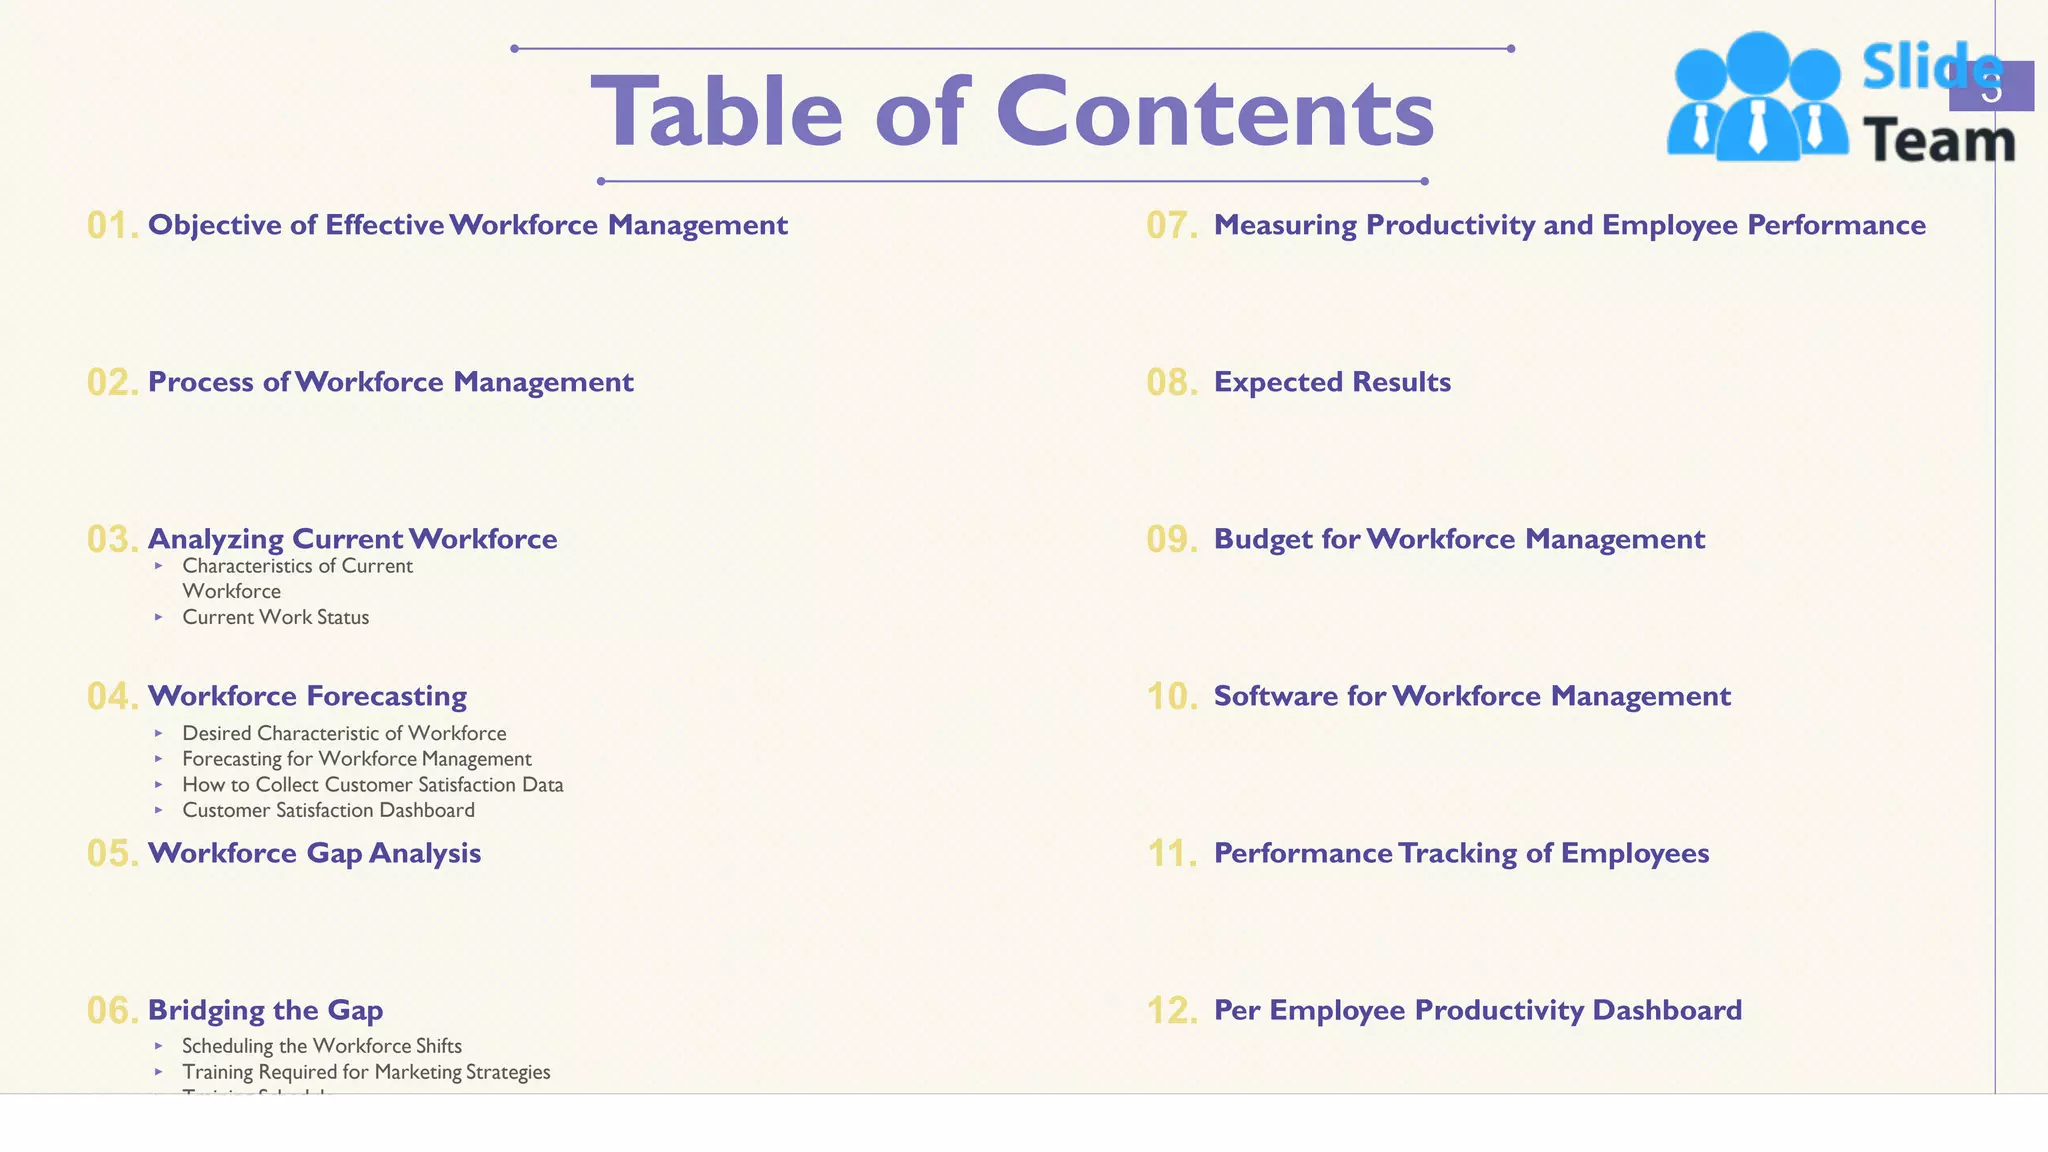
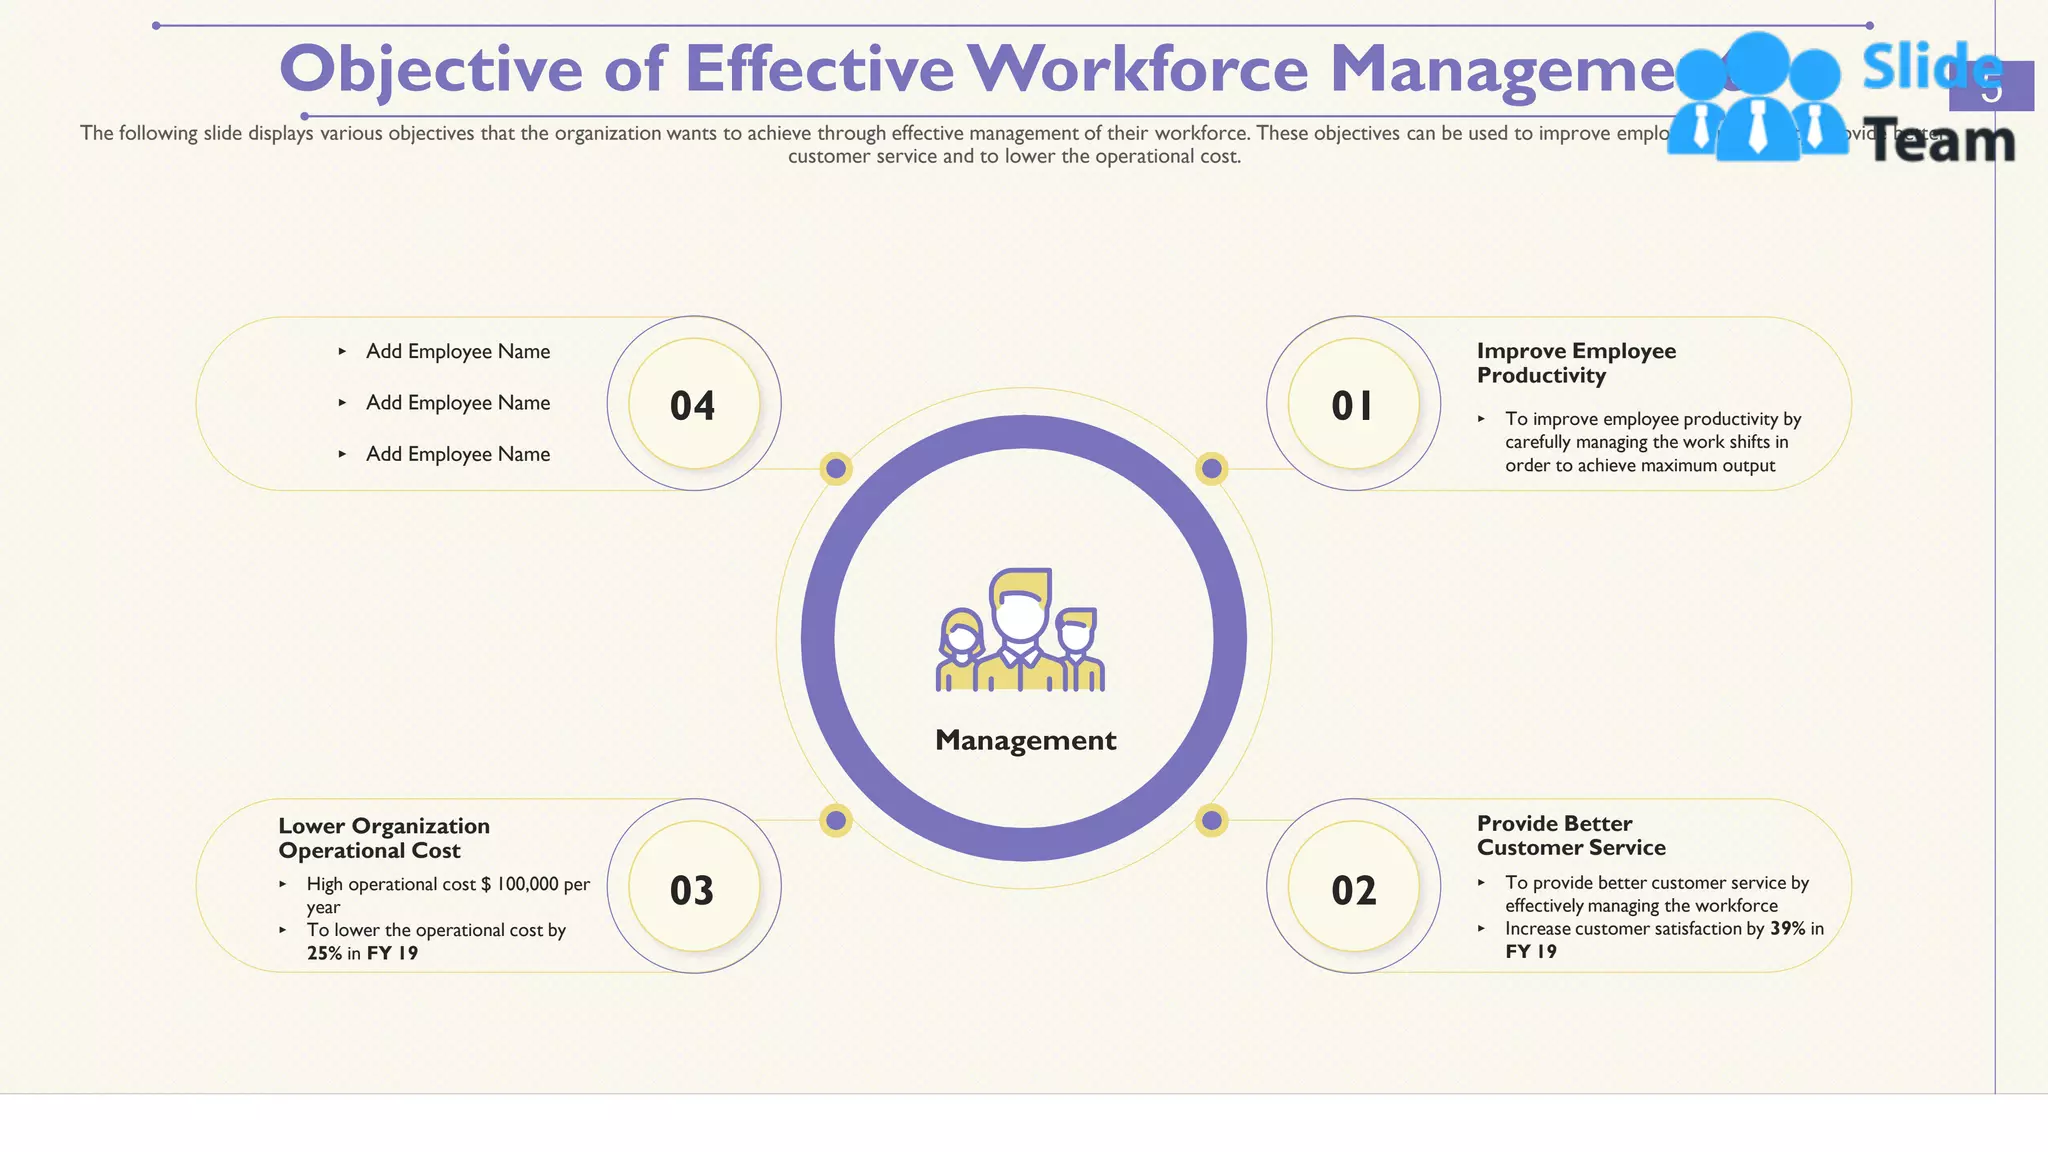
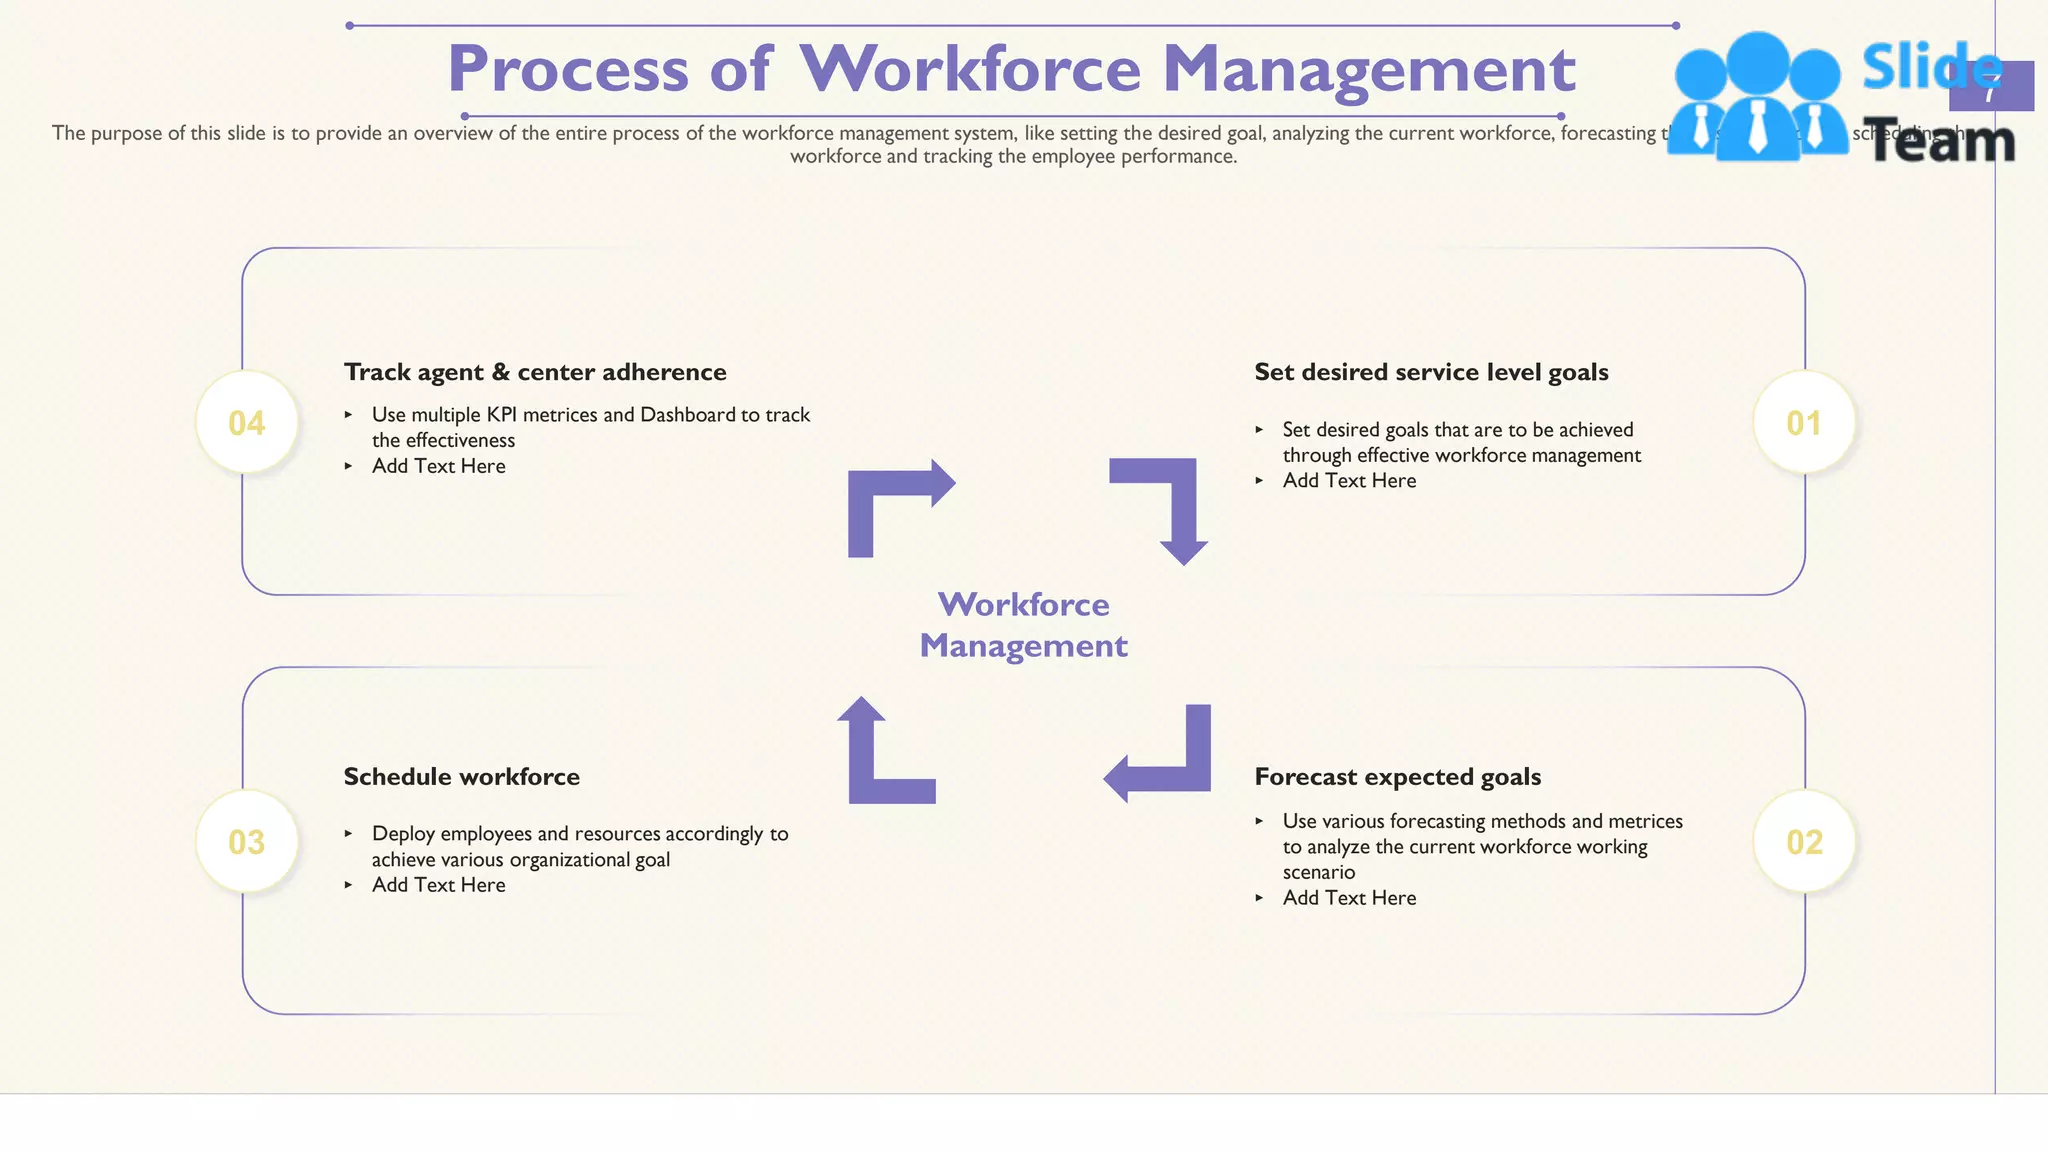
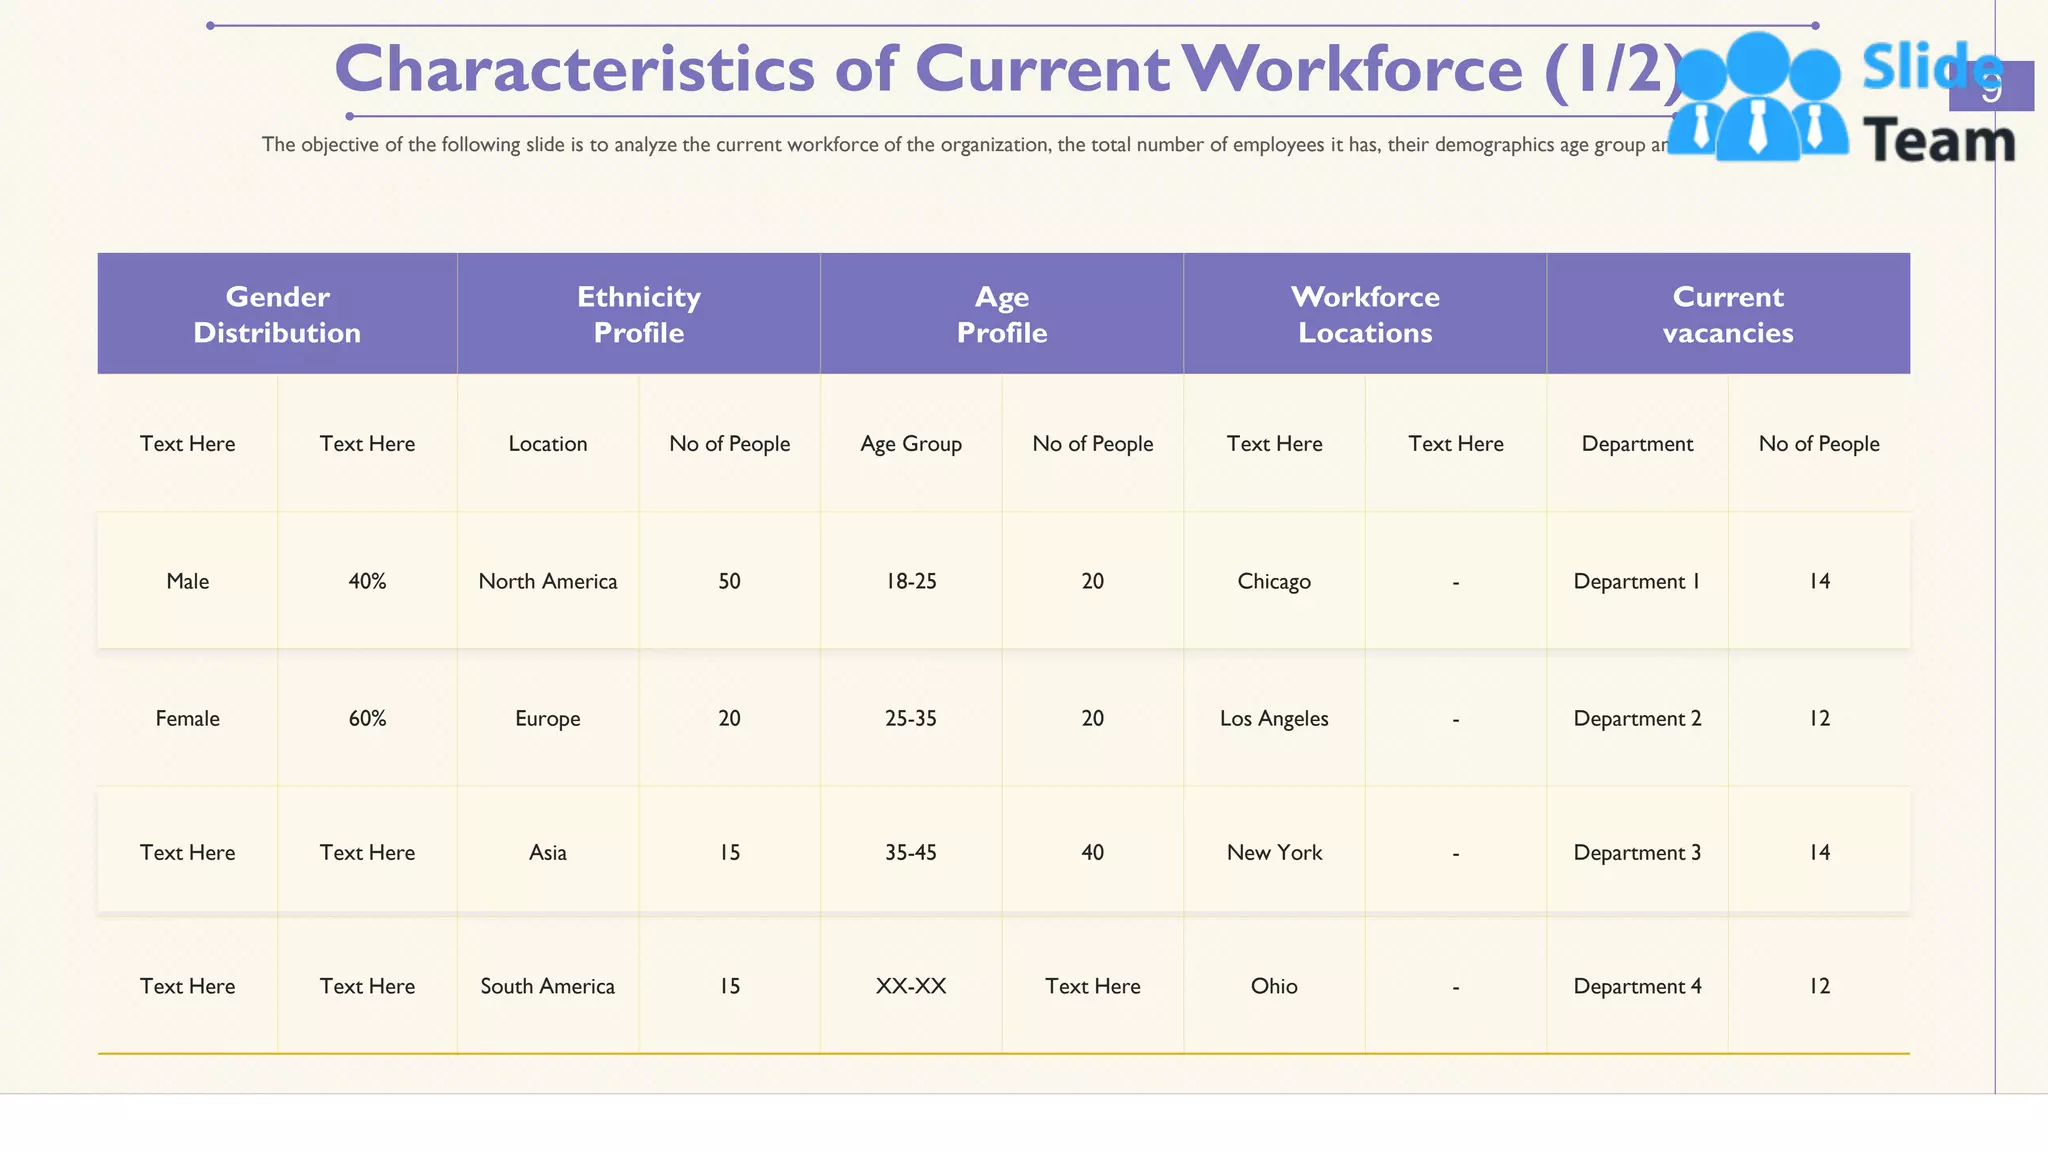
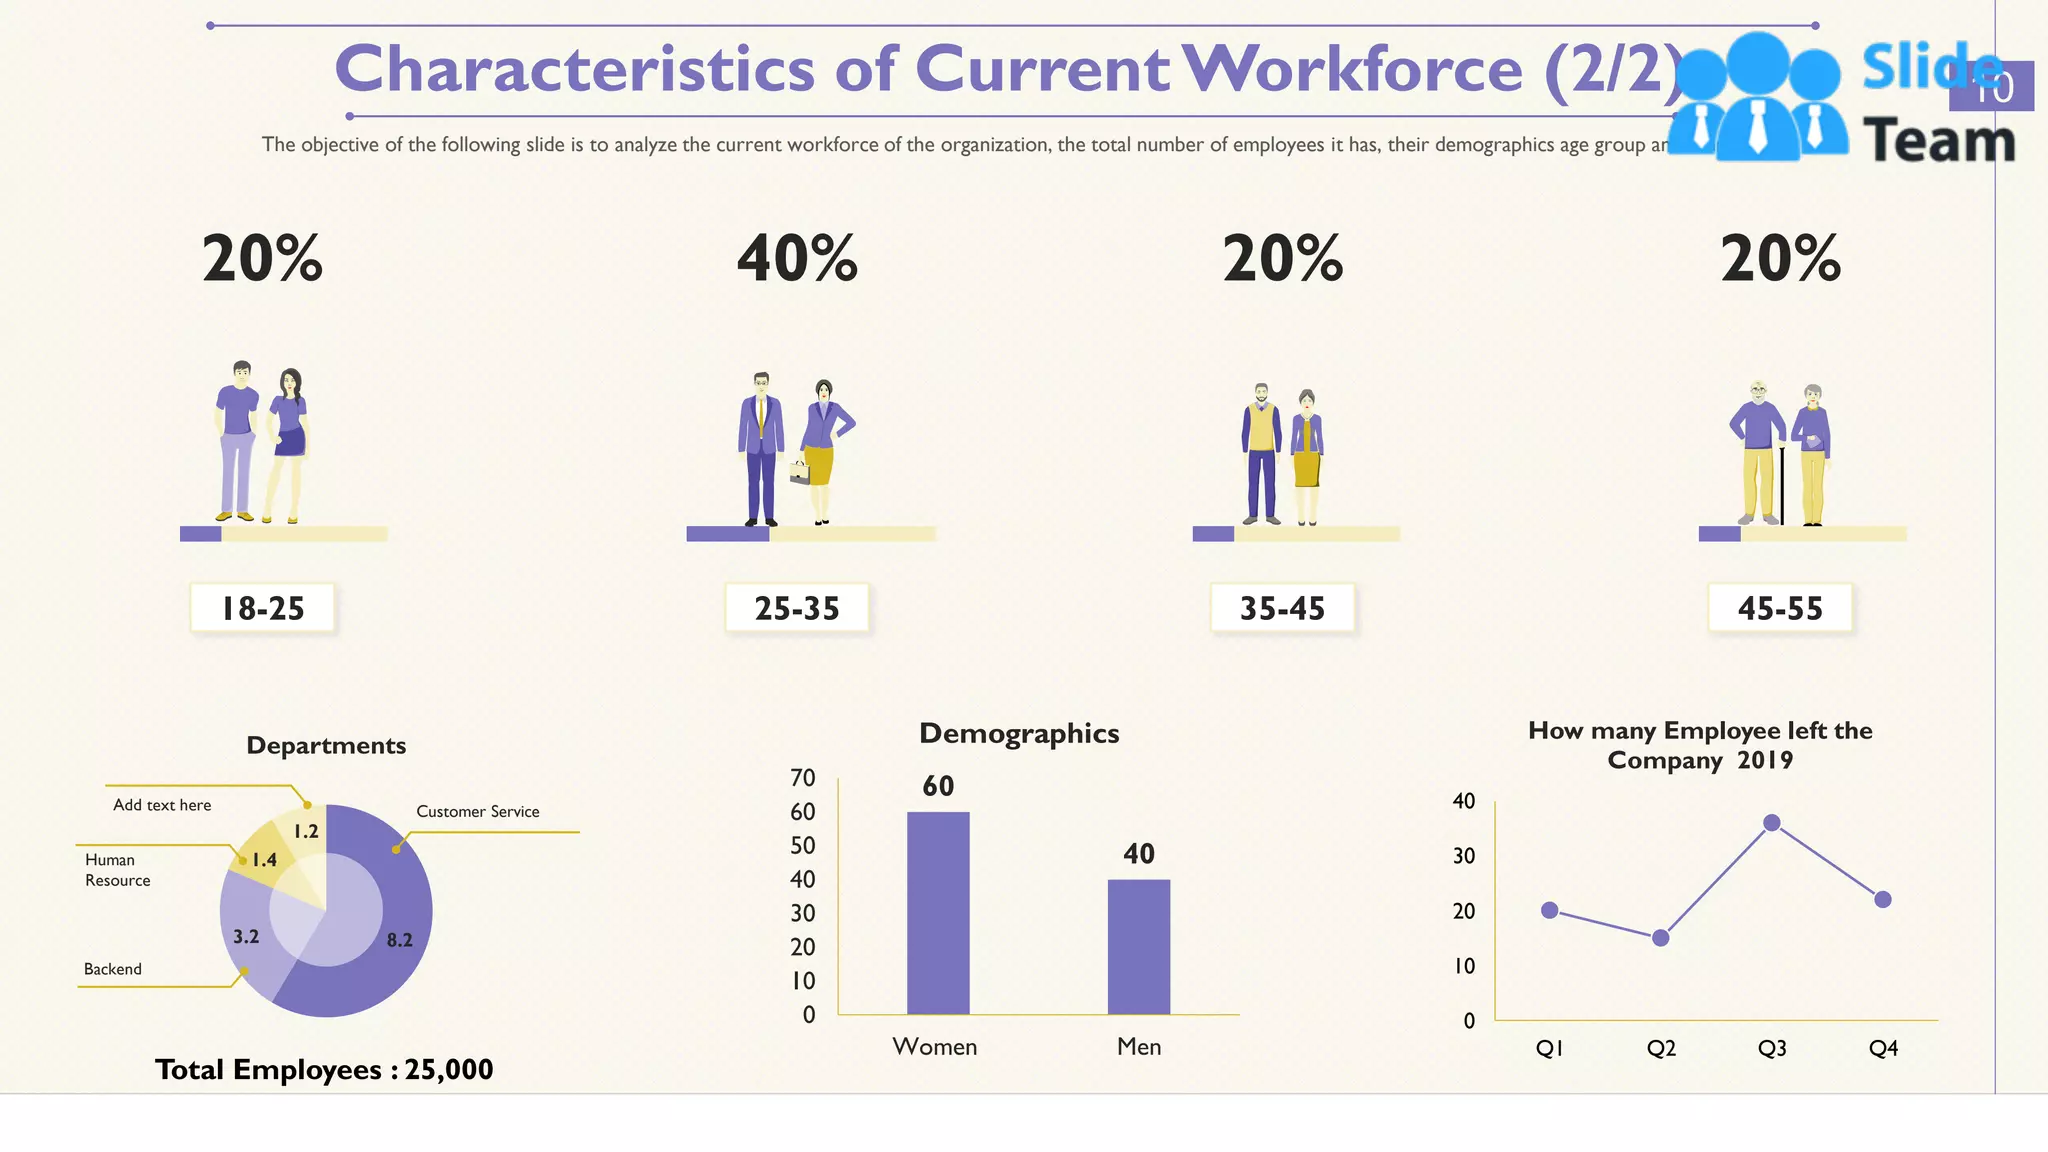
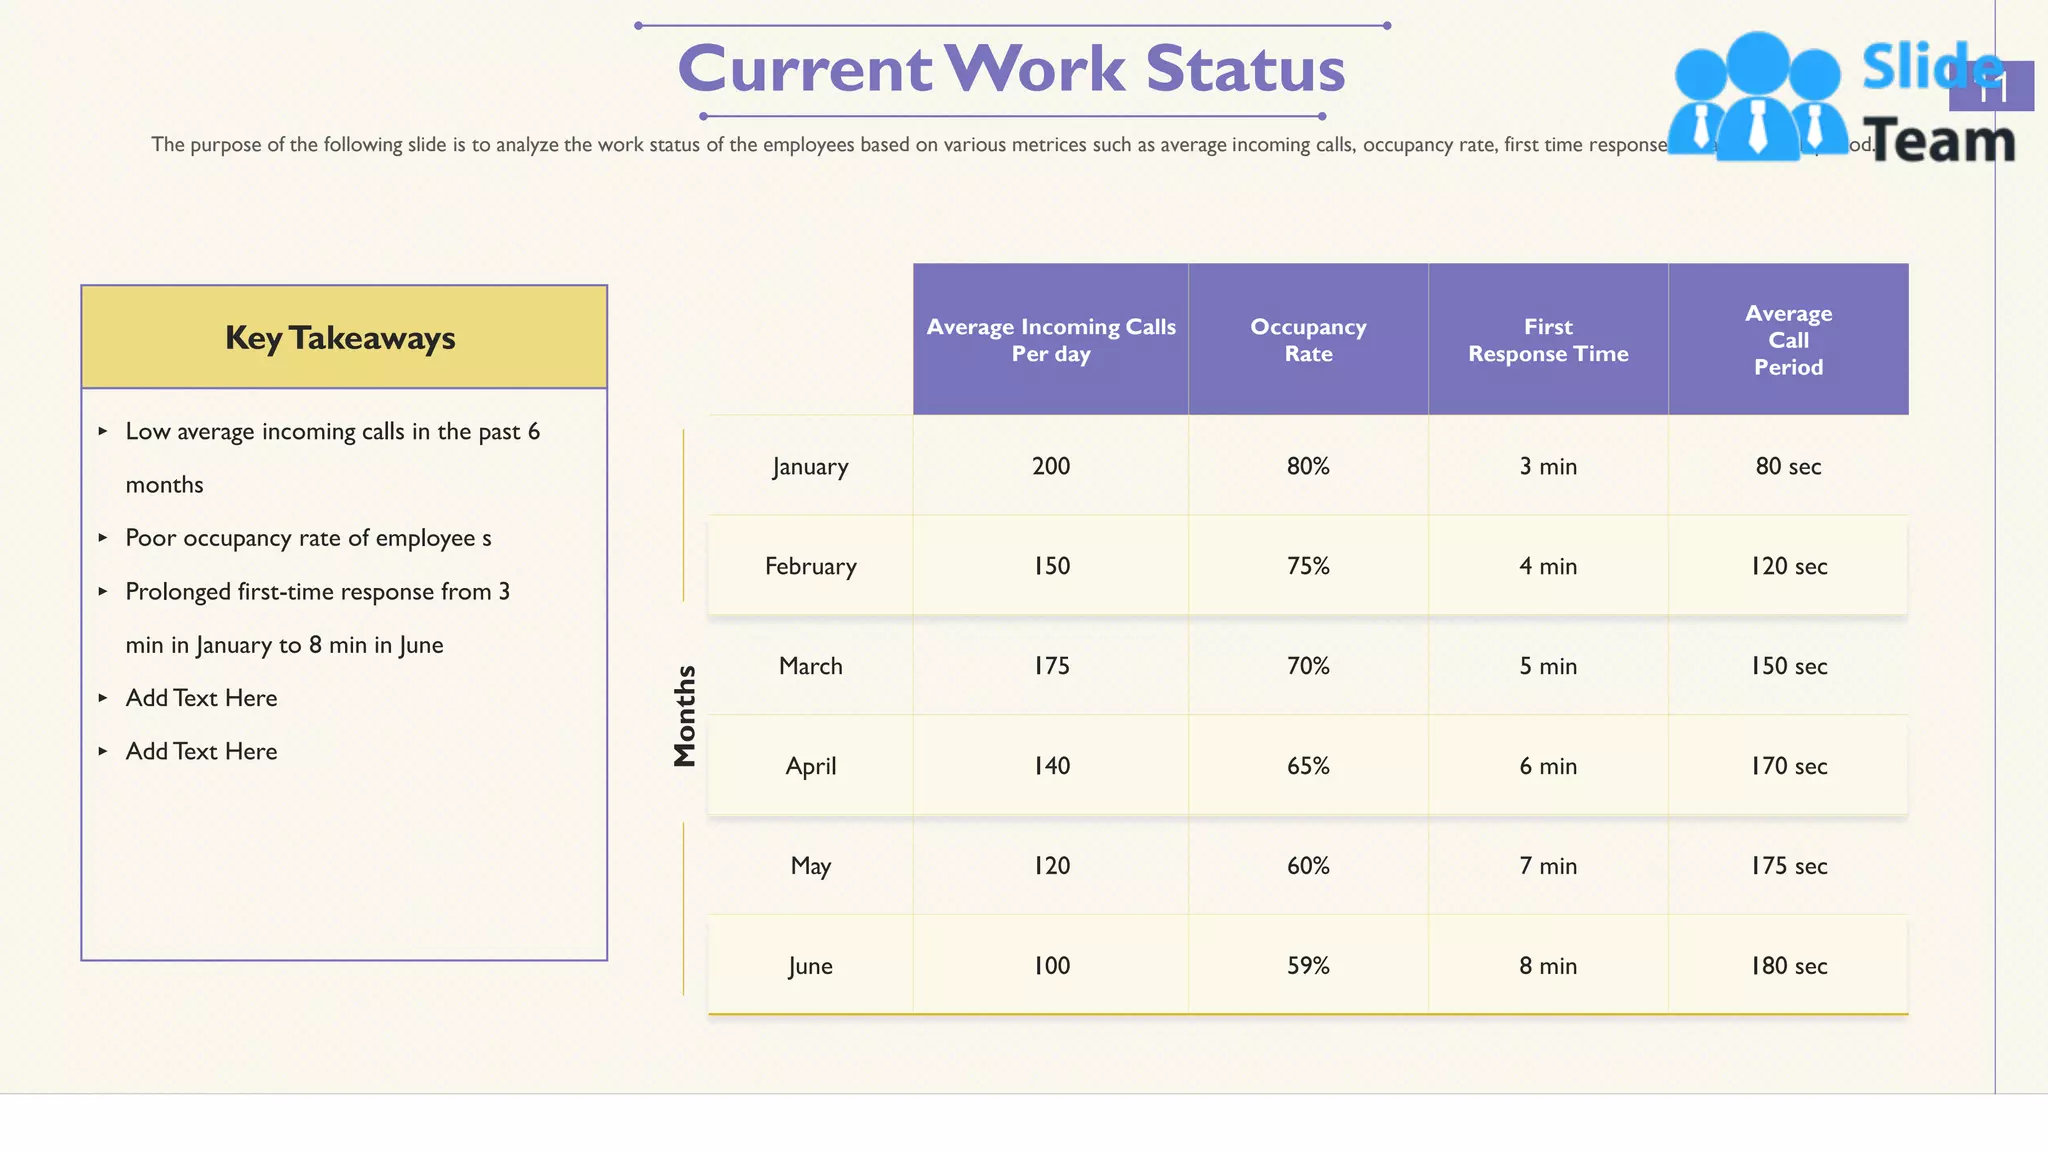
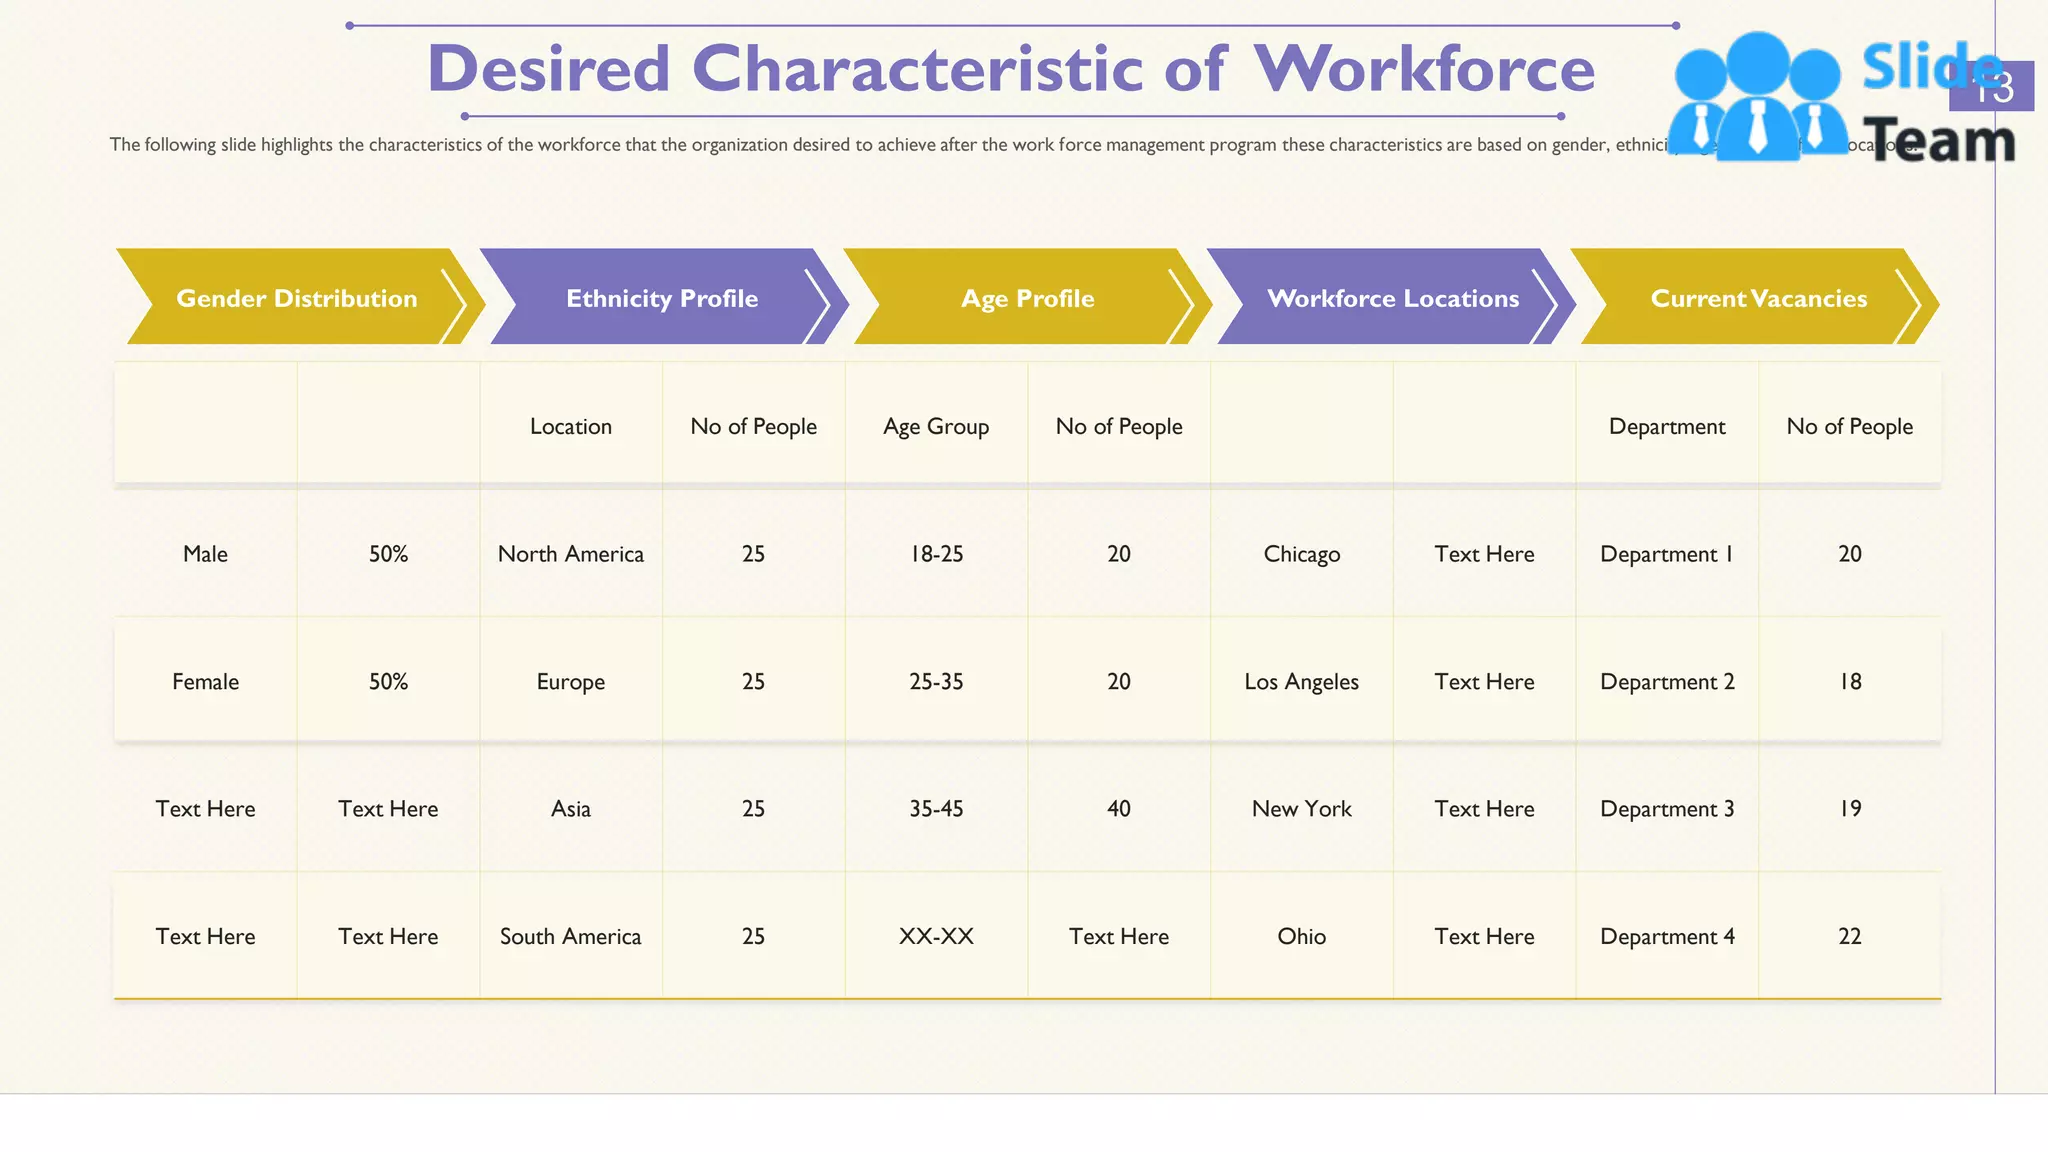
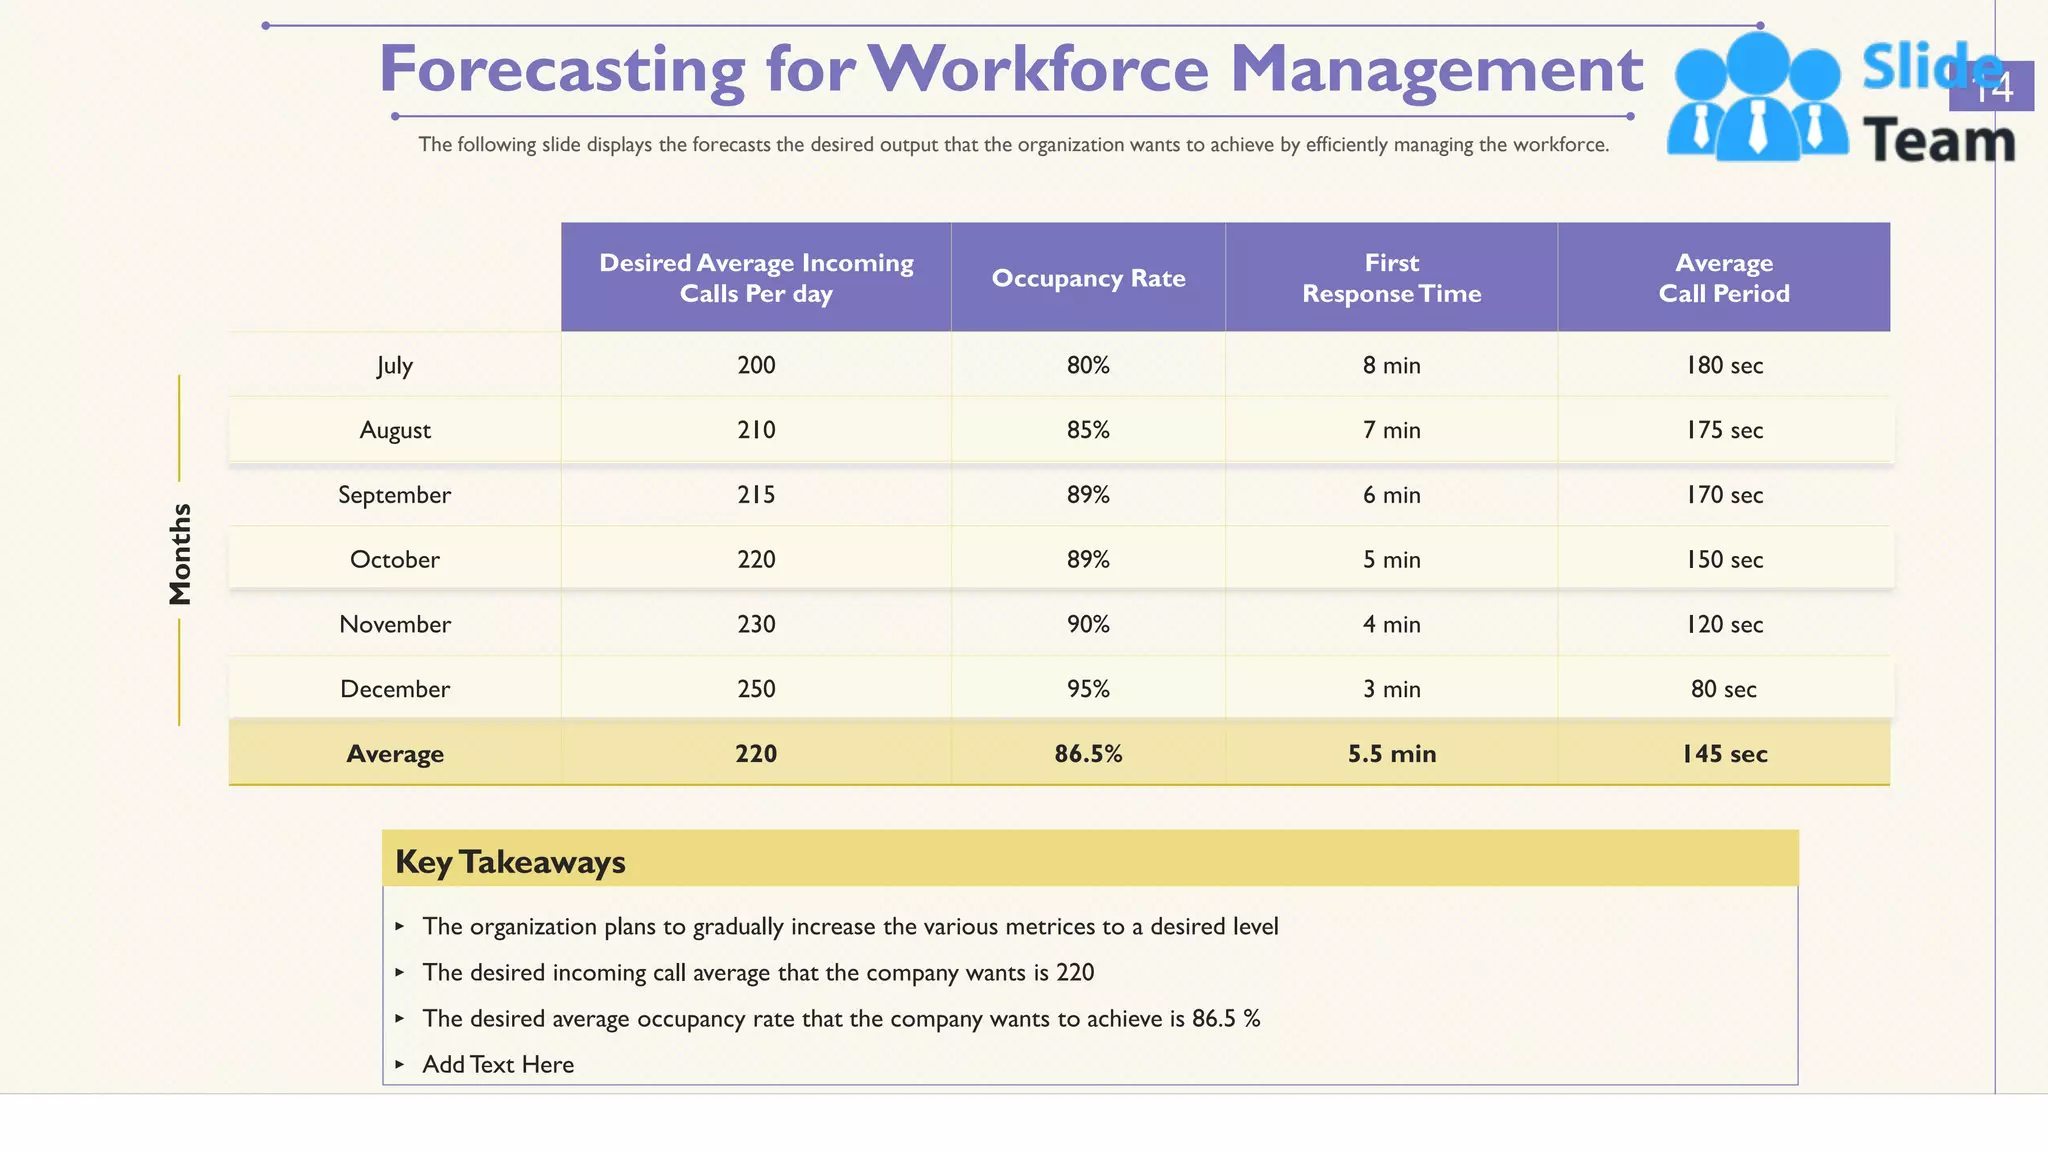
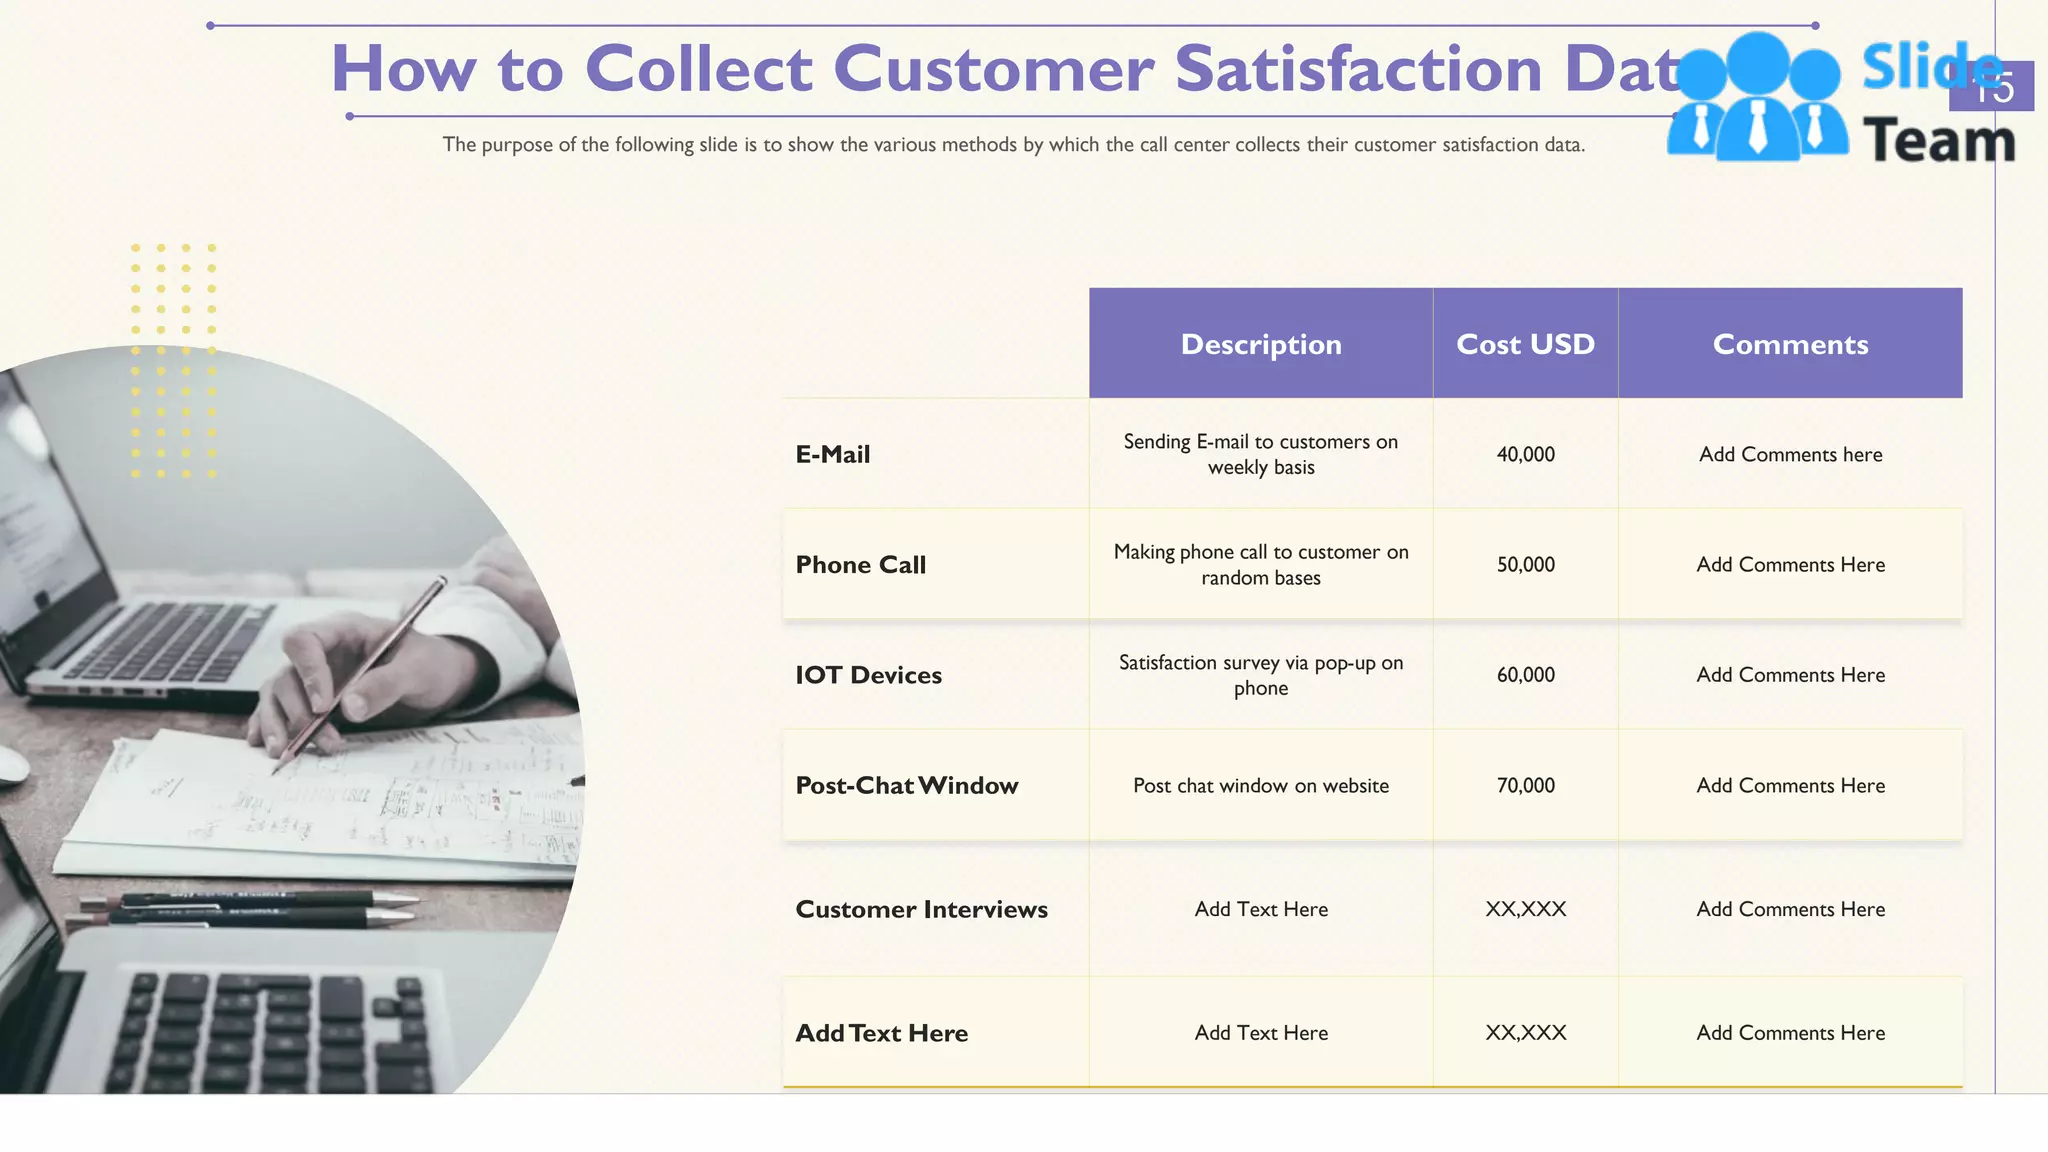
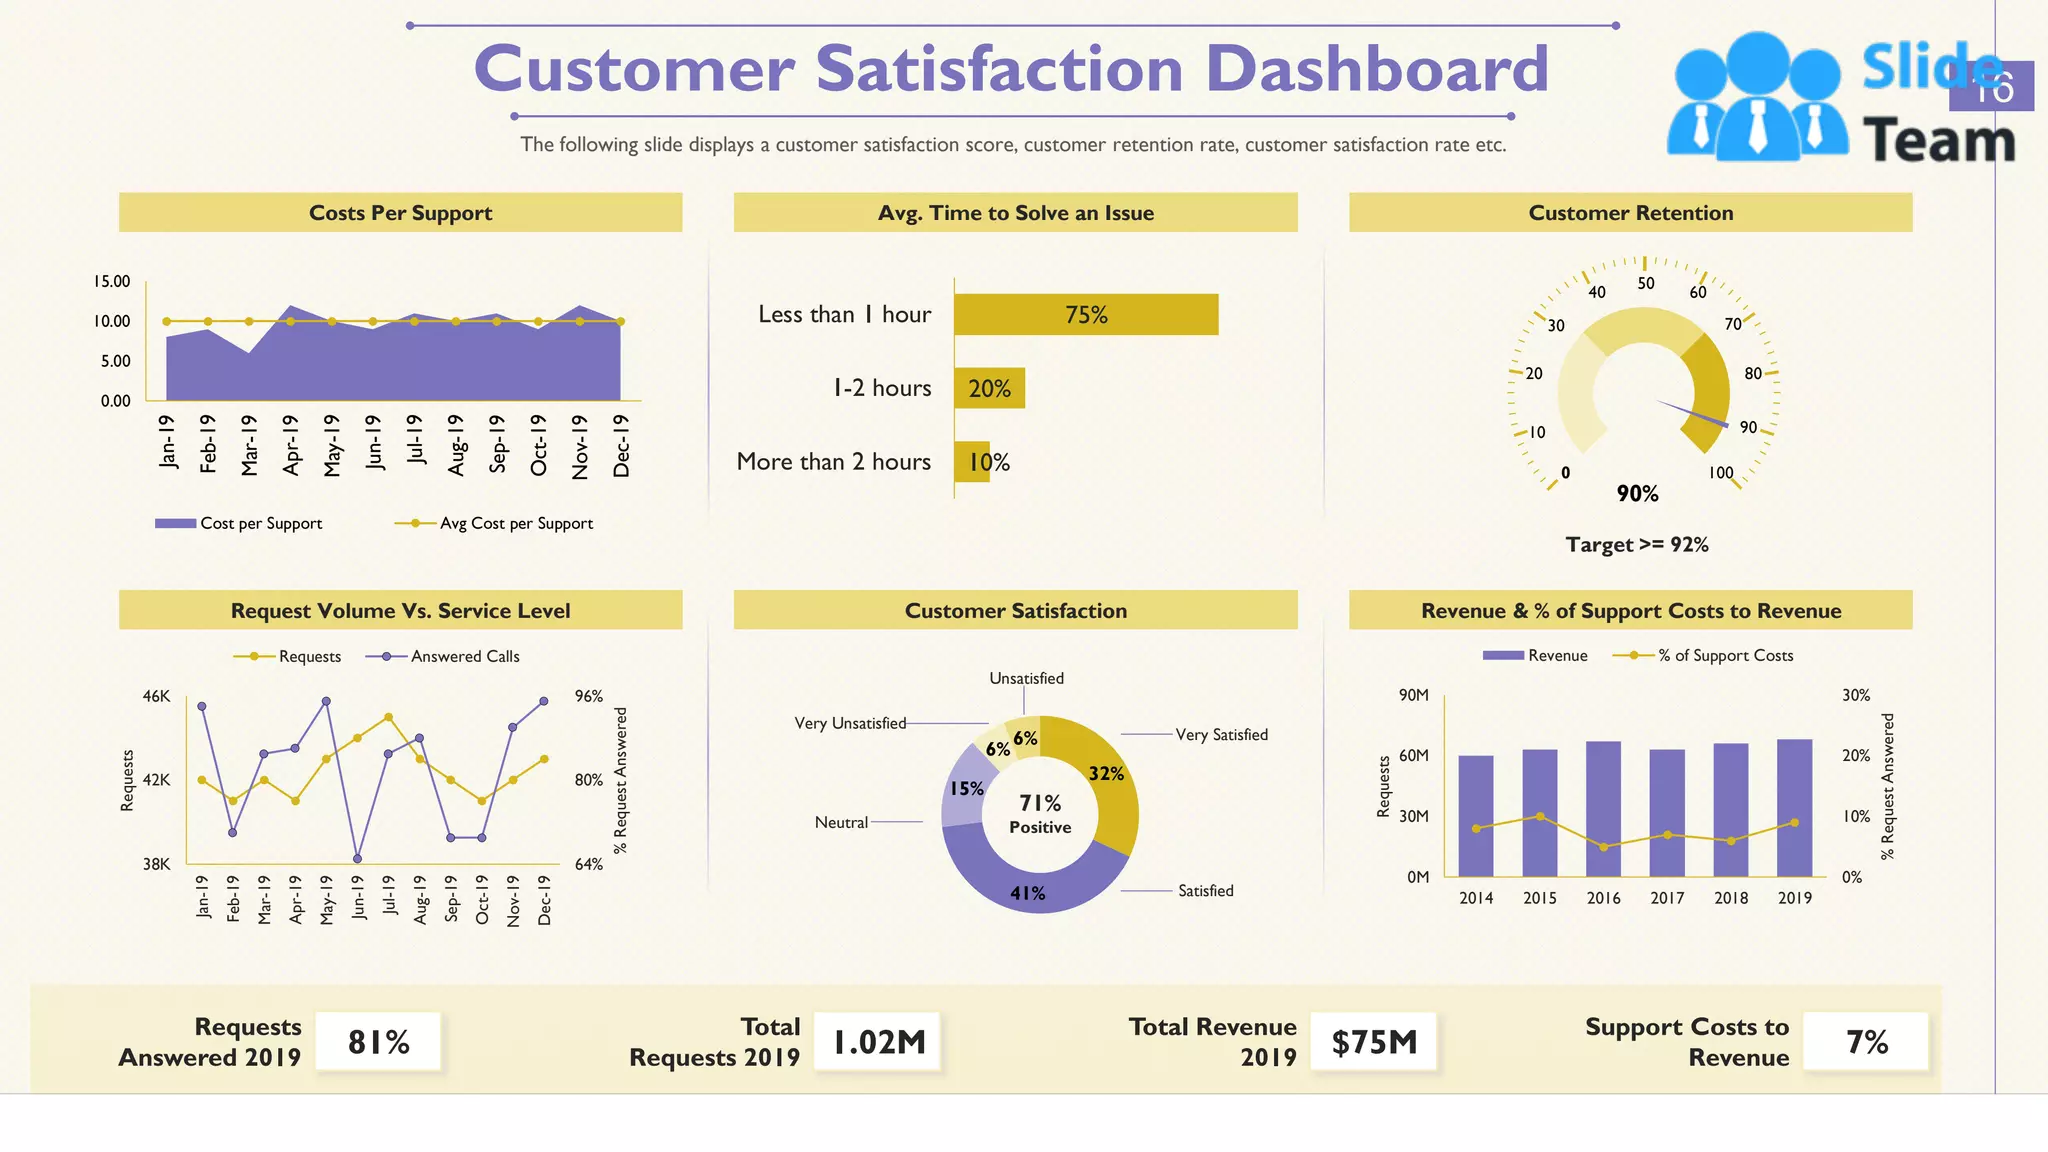

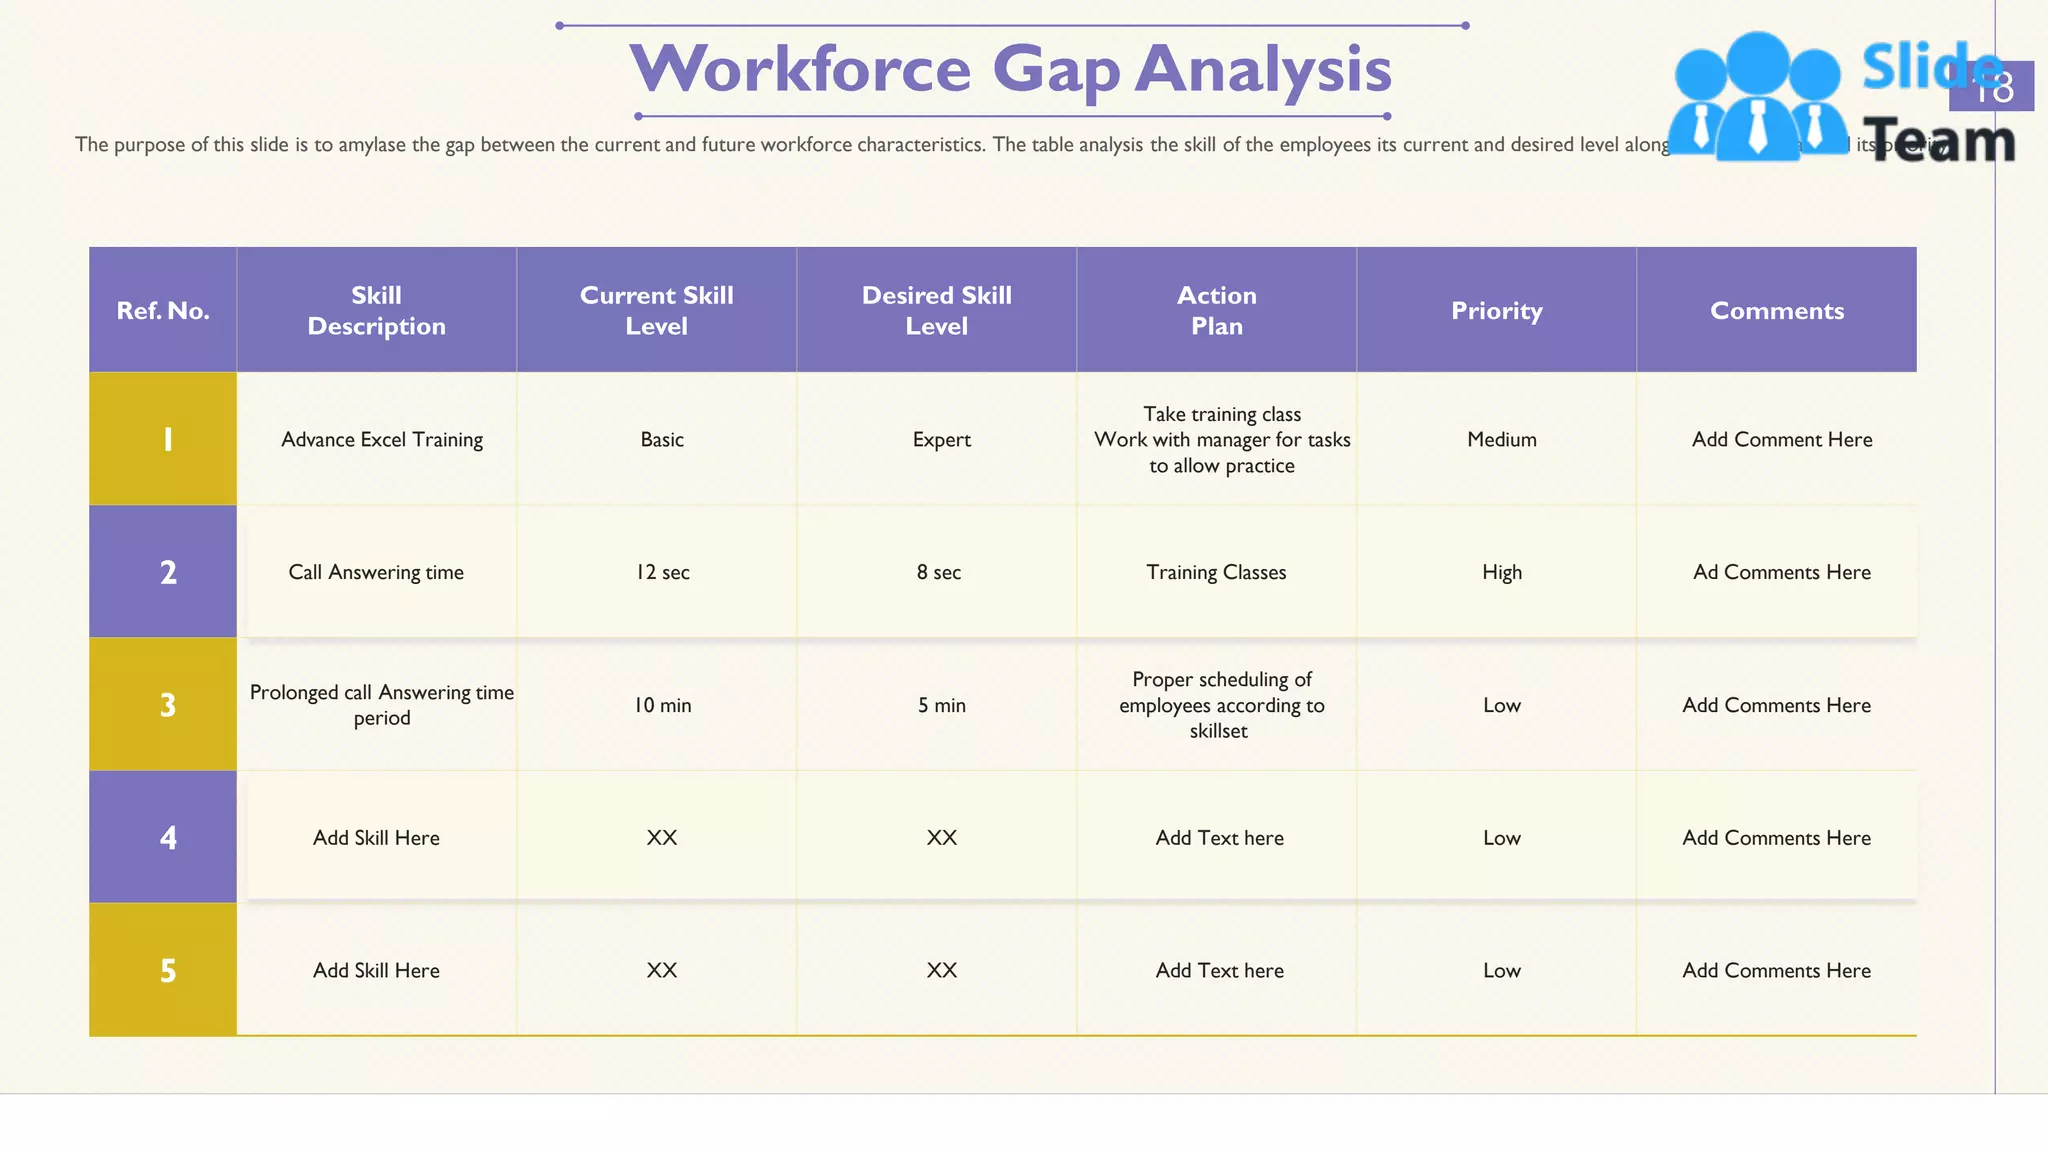
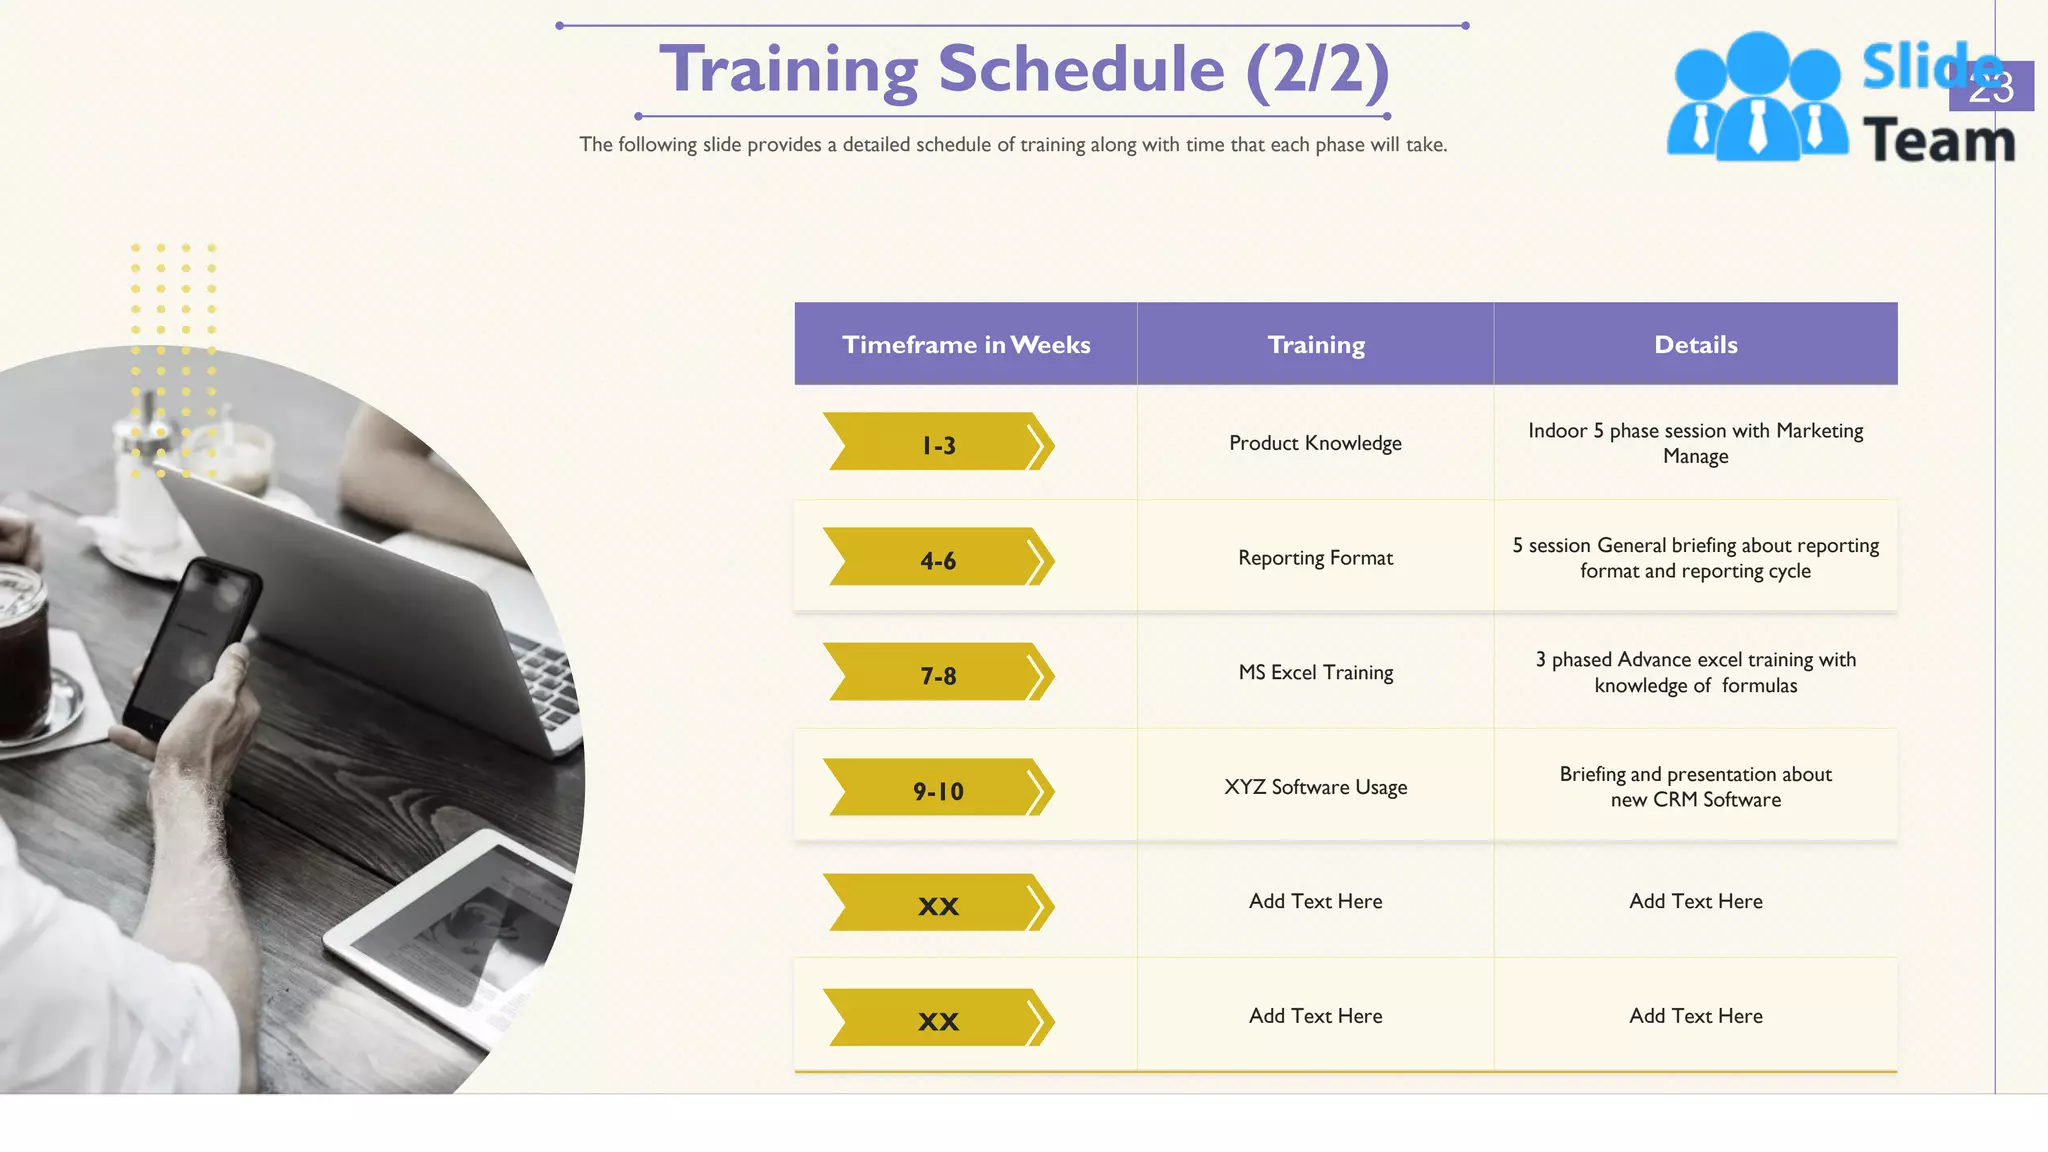
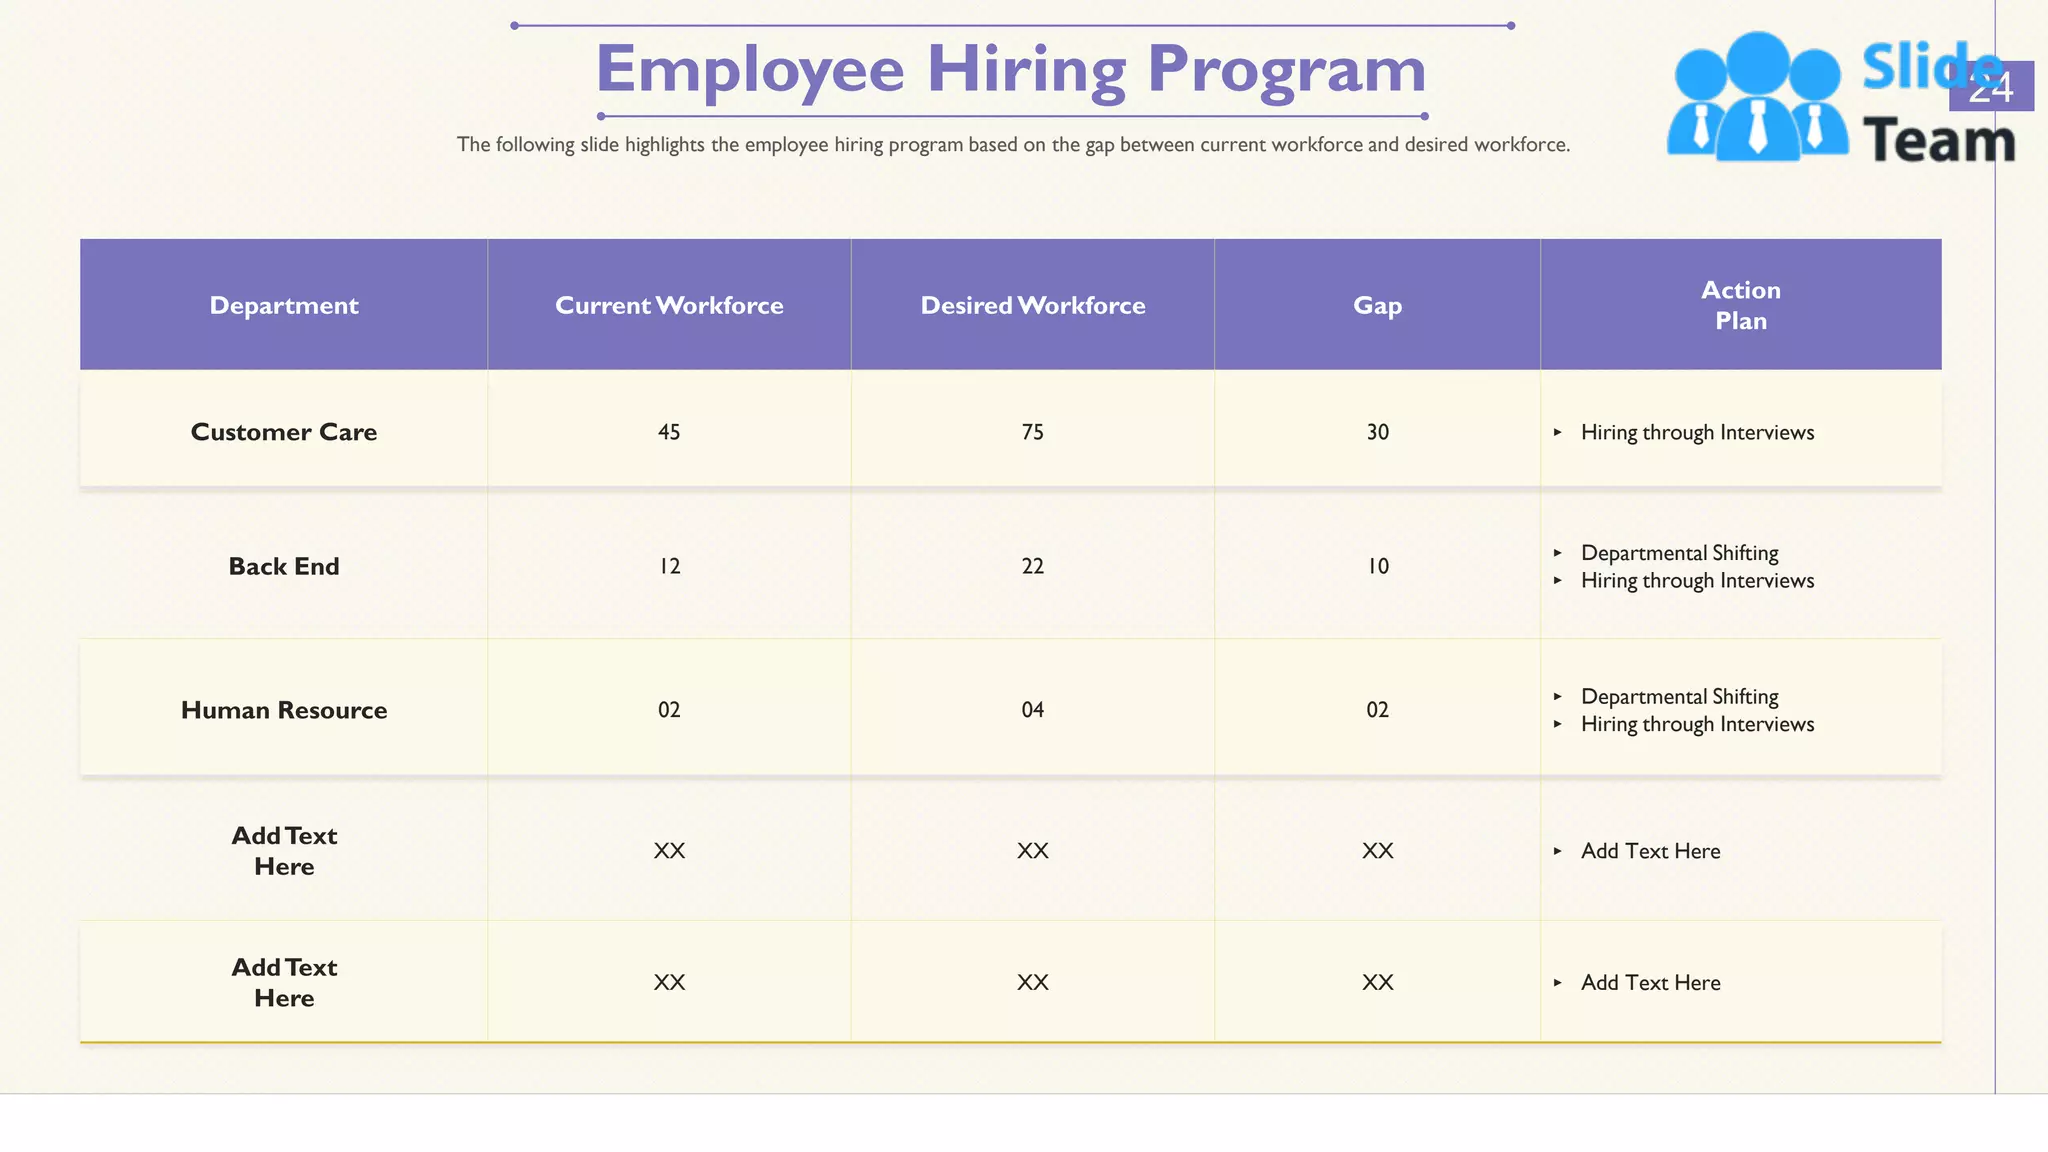
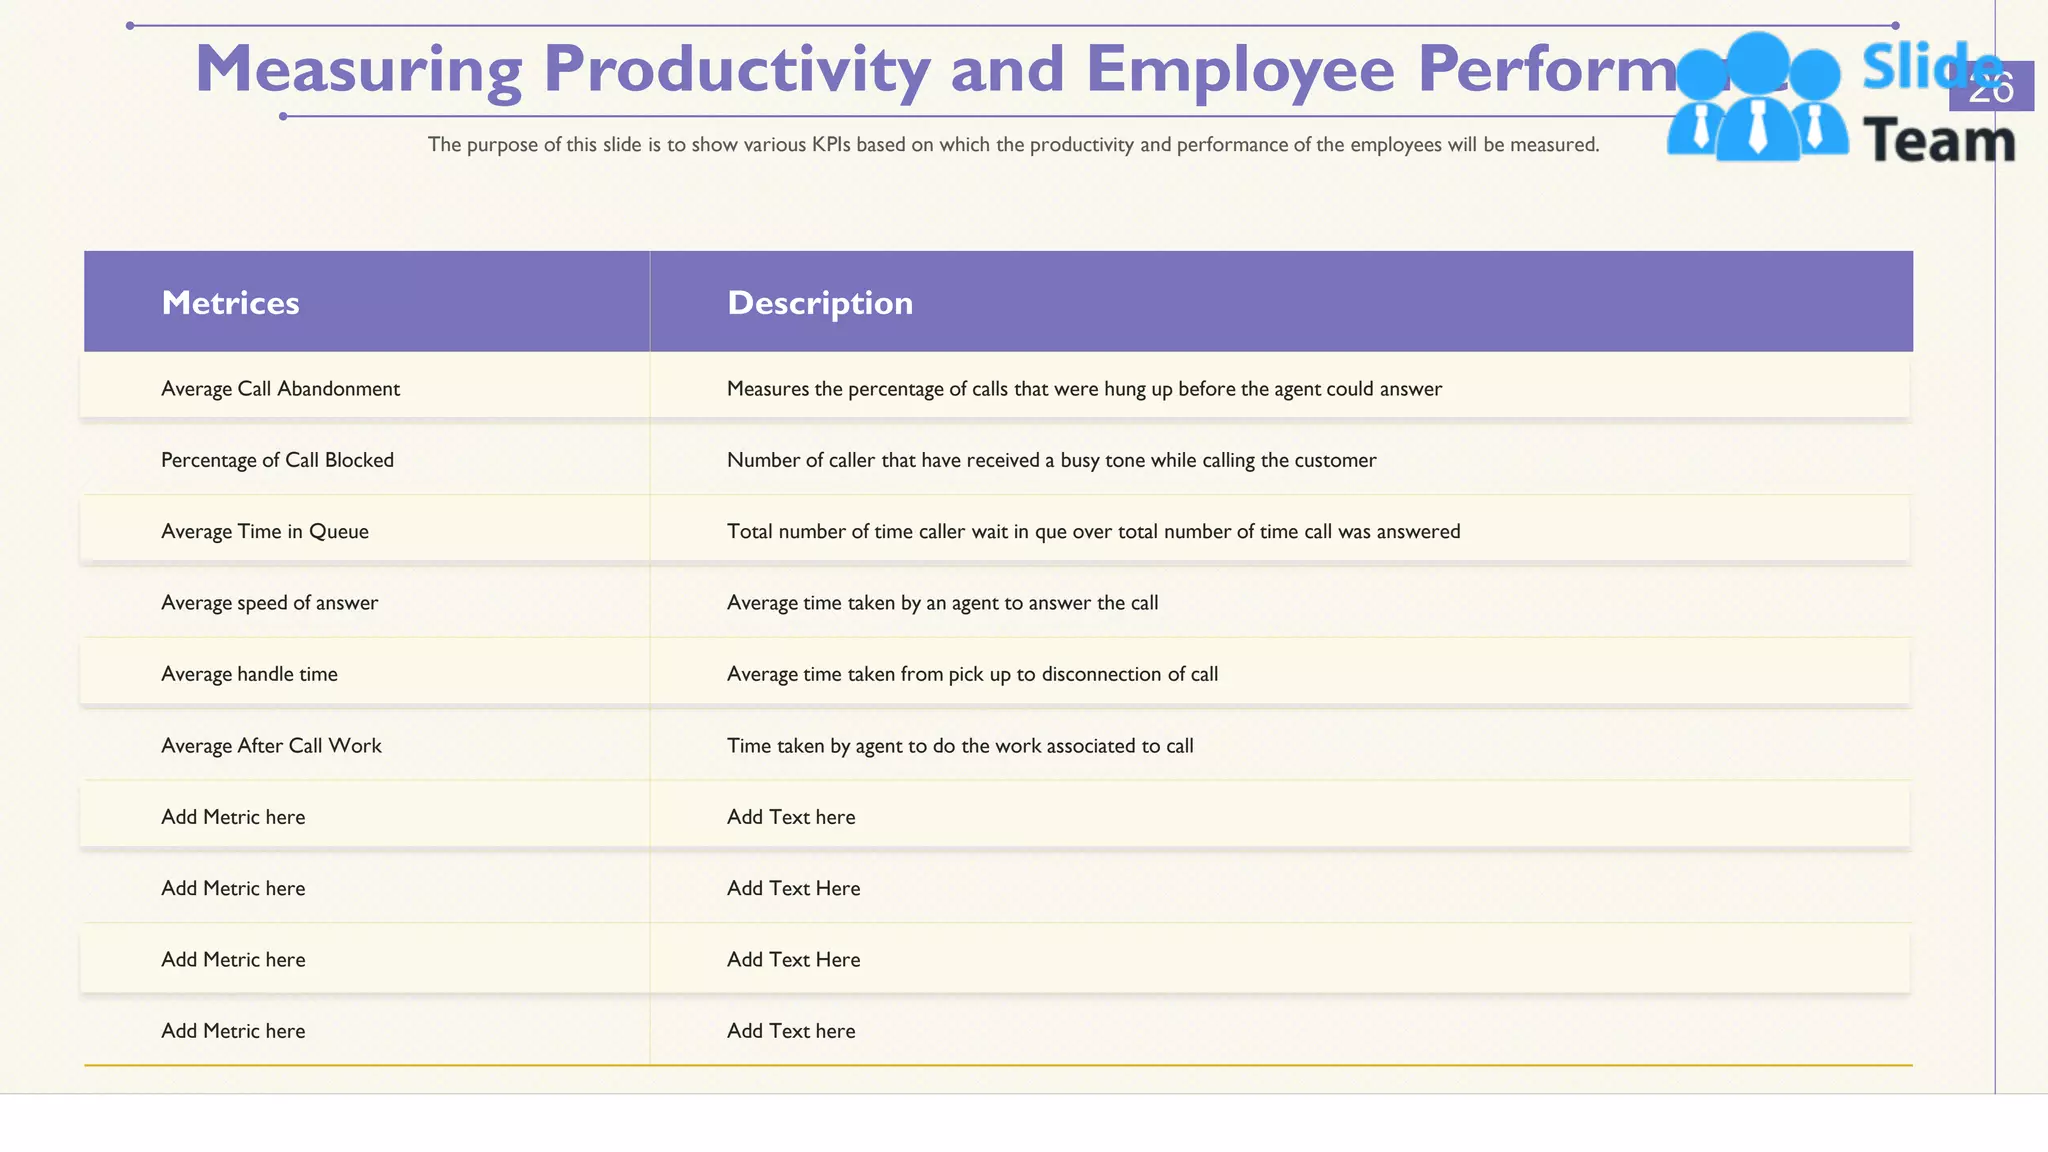
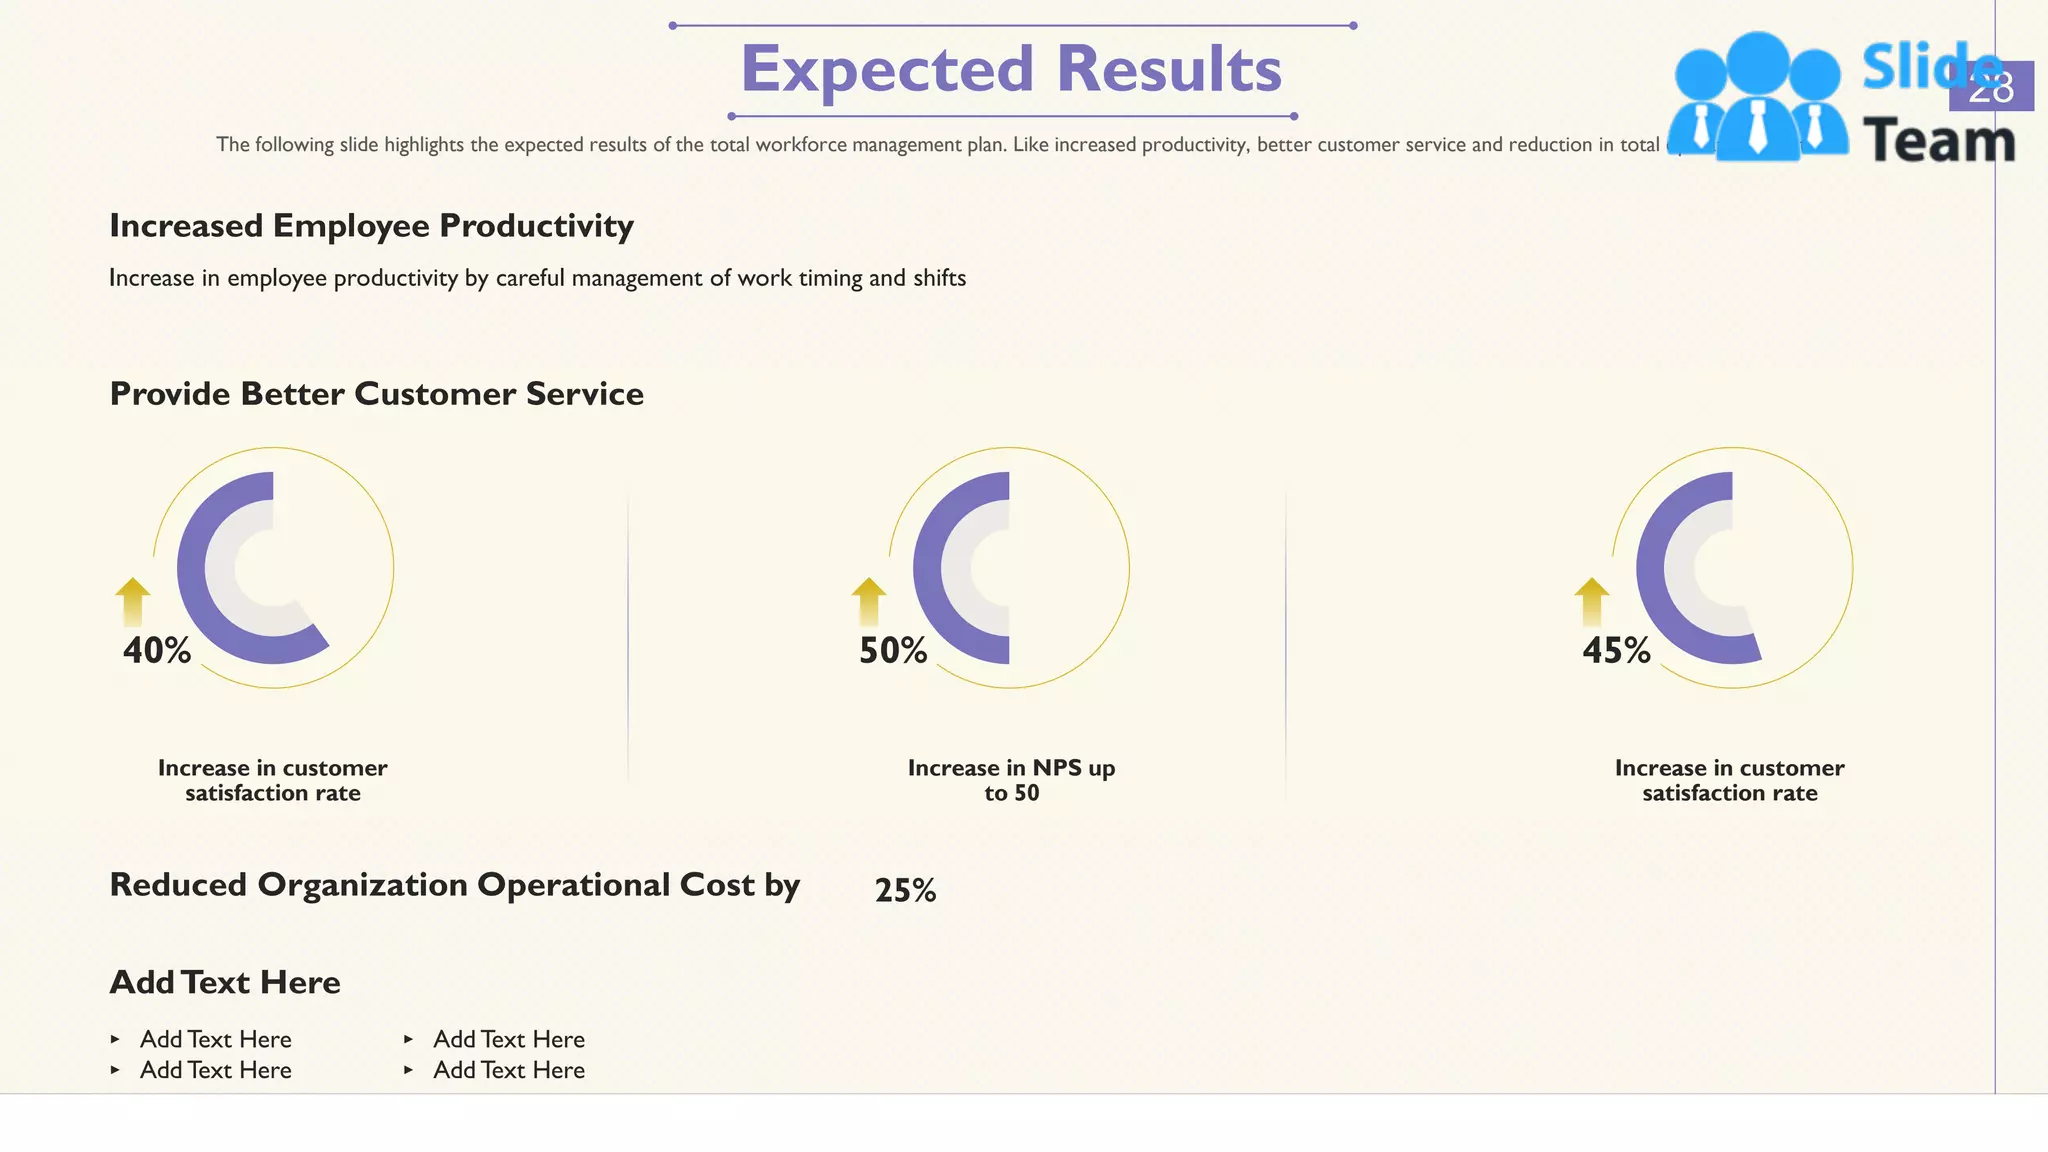
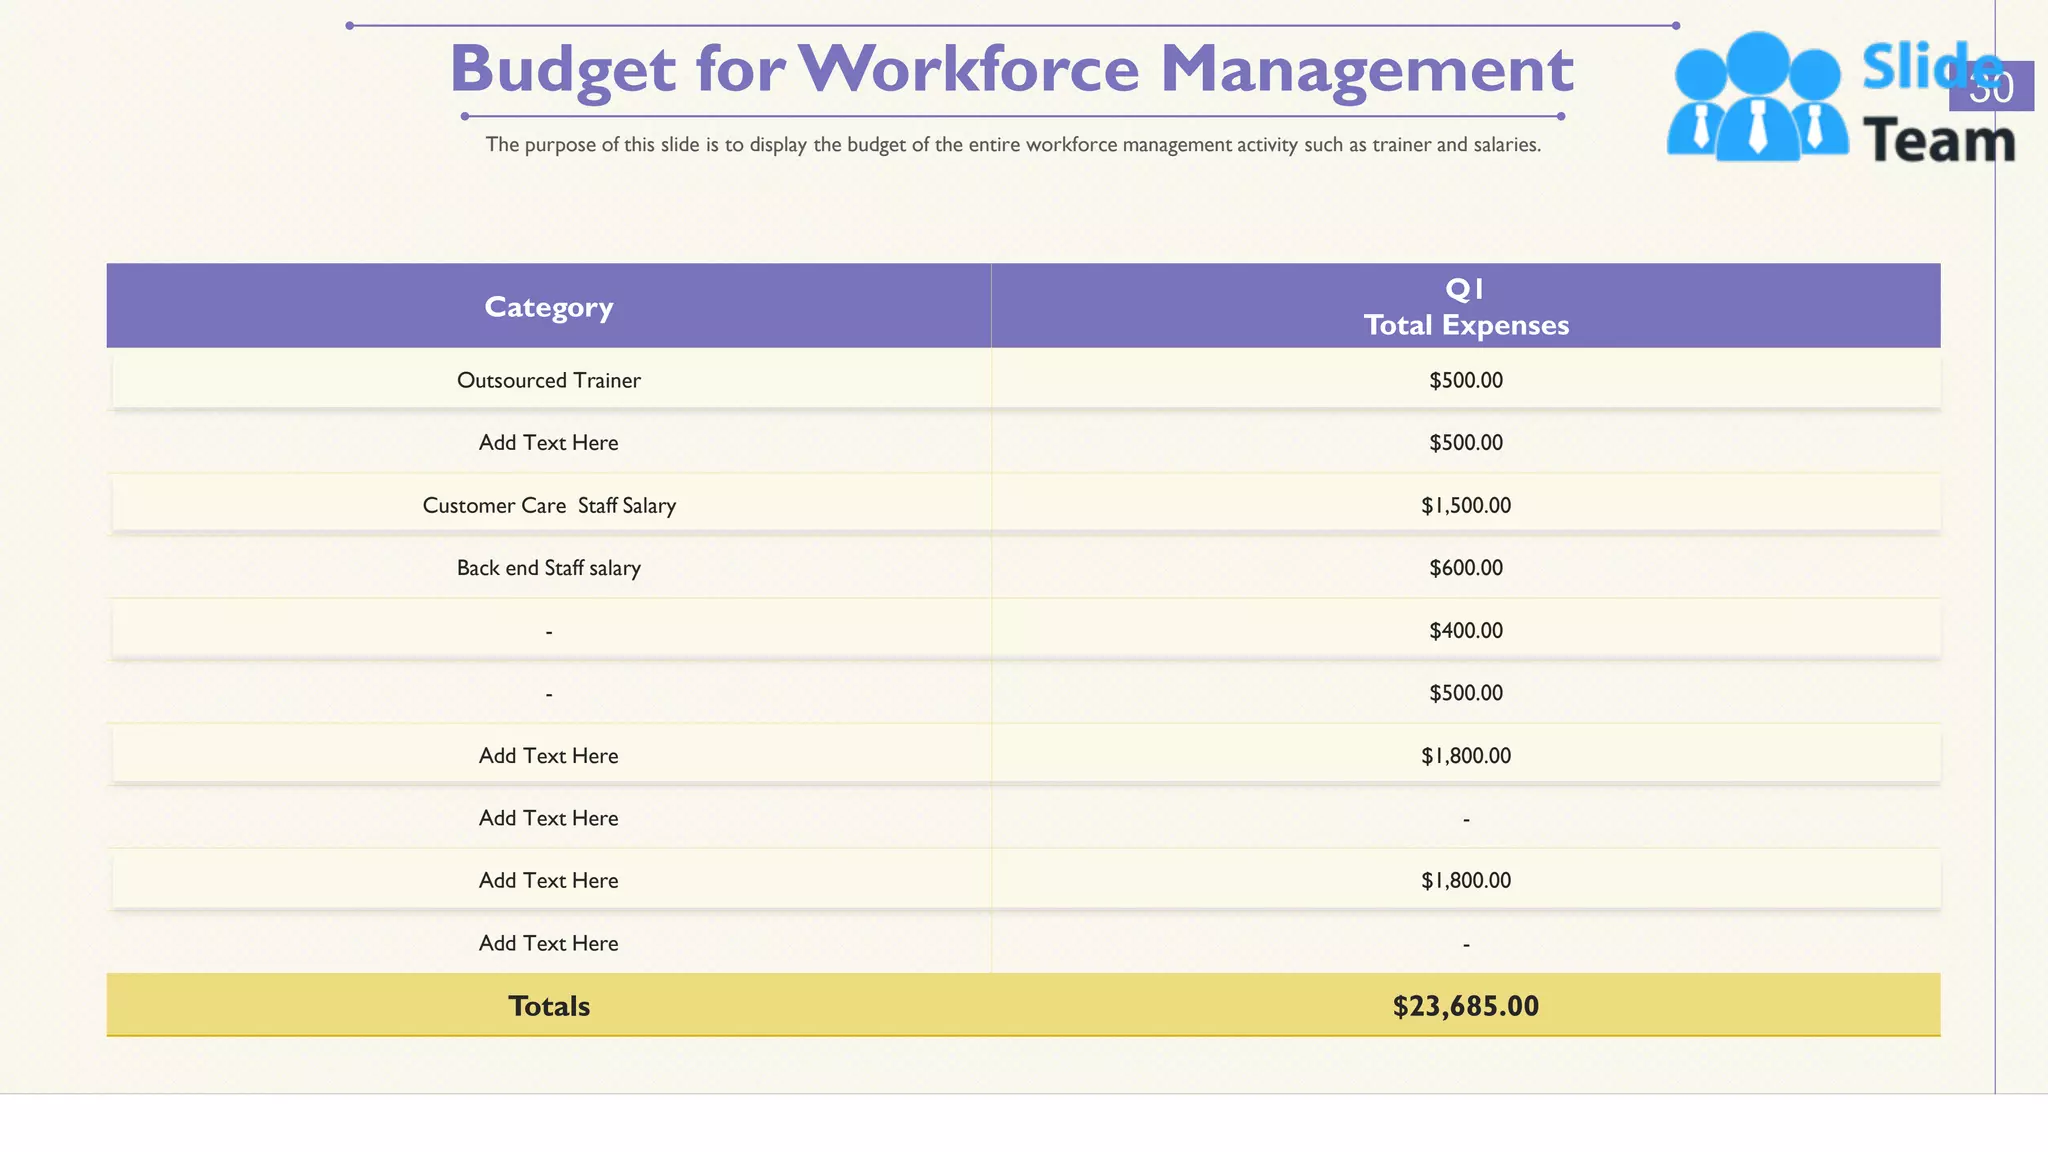
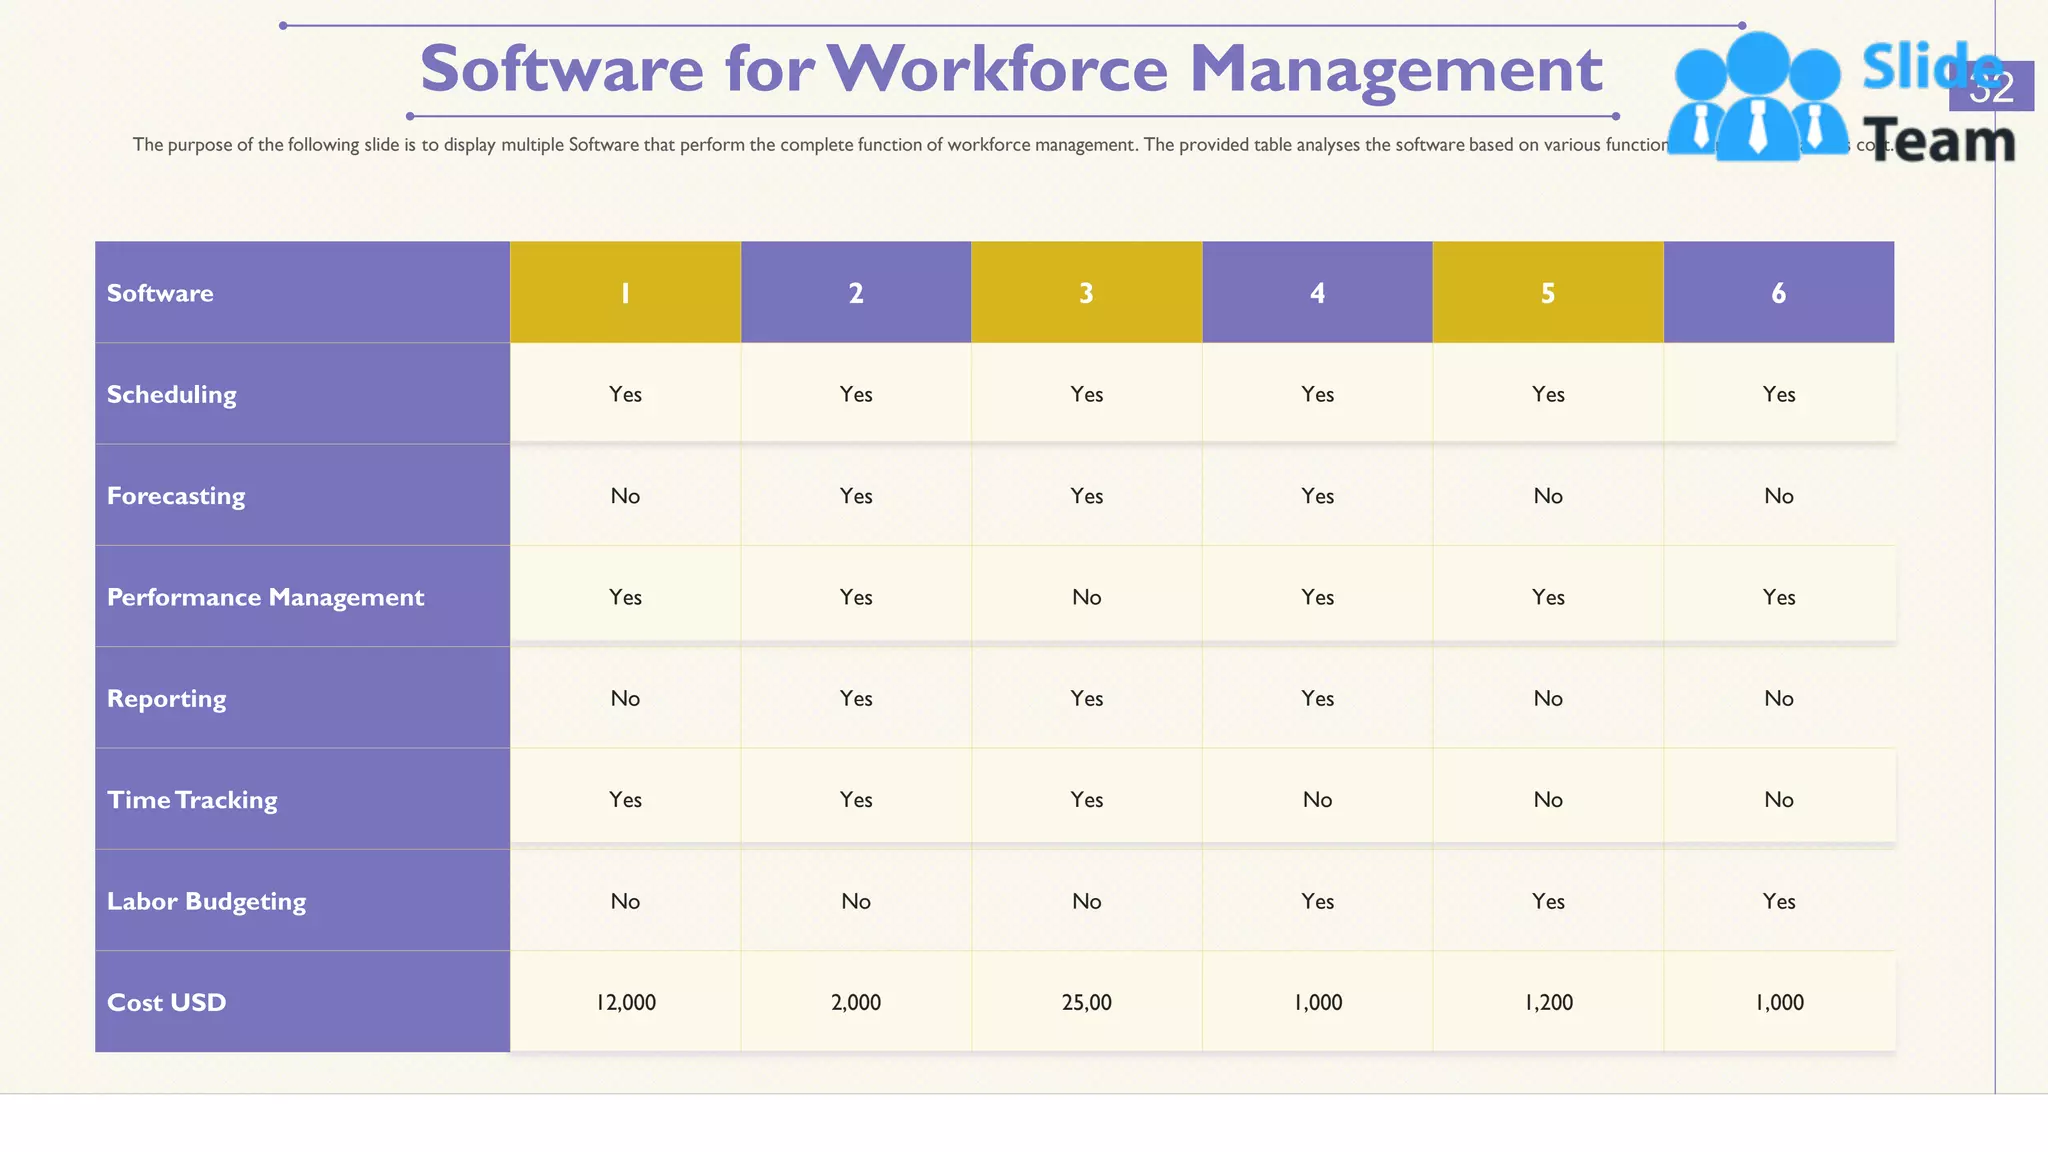
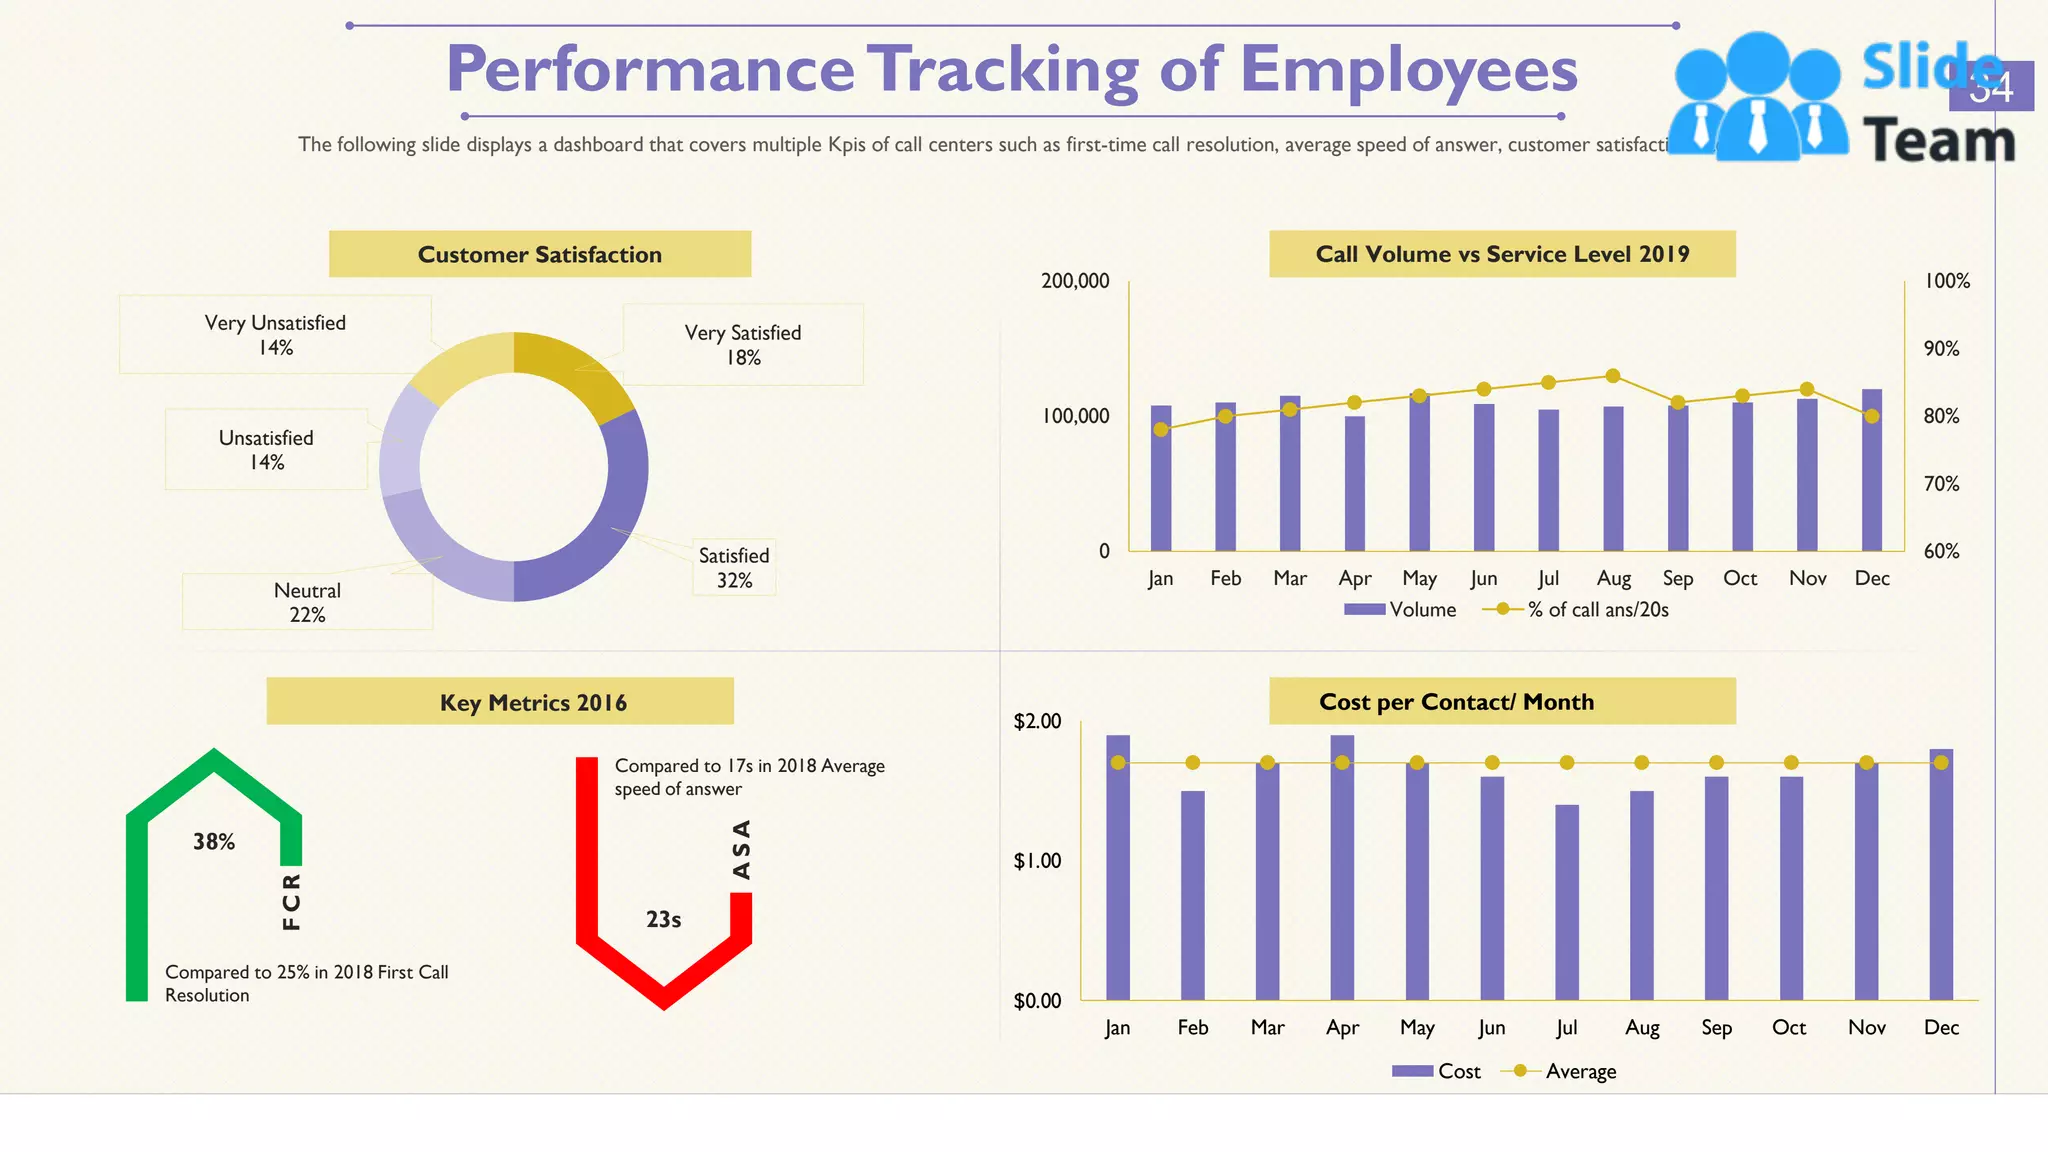
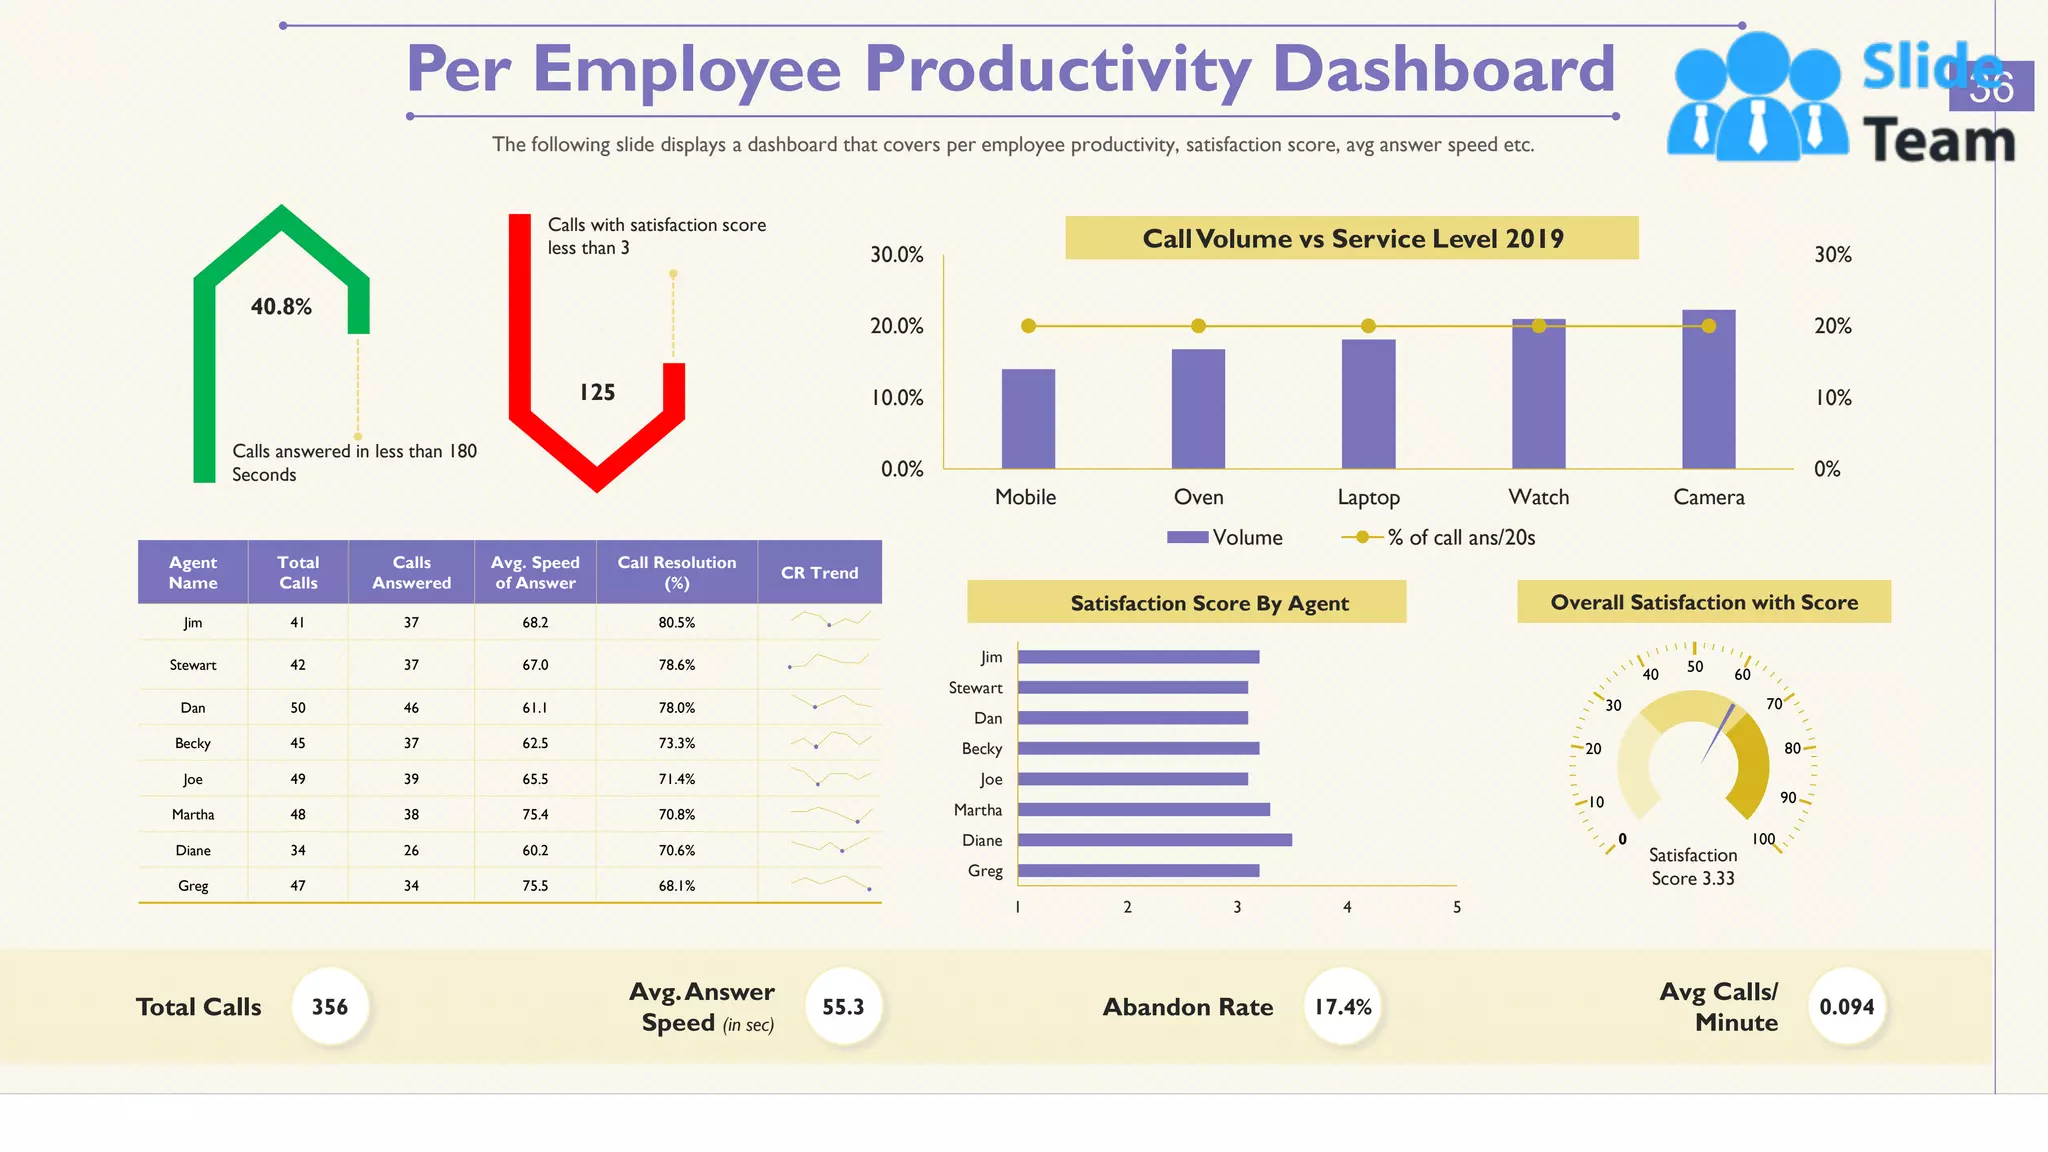


The document outlines a comprehensive workforce management plan for a call center, detailing goals like improving employee productivity, enhancing customer service, and reducing operational costs. It includes processes for analyzing the current workforce, forecasting needs, scheduling shifts, and implementing training programs. The budget, software options, and performance tracking metrics are also discussed to facilitate effective management and achieve organizational objectives.


![WFM Made easy (002)[3]](https://cdn.slidesharecdn.com/ss_thumbnails/62f603d8-e3d3-4ca0-a8b3-dceb949abf56-161212120540-thumbnail.jpg?width=640&height=640&fit=bounds)


![Moho Pro 14.4 Crack for MacOS Works Until 2050 [Latest] pptx](https://cdn.slidesharecdn.com/ss_thumbnails/softwareoverview-251207192639-797289c4-thumbnail.jpg?width=640&height=640&fit=bounds)

![Driver Easy Pro Key 7.1.0.2641 Full Mac Crack Free Activated Download [2026]....](https://cdn.slidesharecdn.com/ss_thumbnails/software-251207185324-b2fb71b4-thumbnail.jpg?width=640&height=640&fit=bounds)

![WinRAR Crack 7.13 Final Mac Keygen 2026 Download [Latest] Software.pptx](https://cdn.slidesharecdn.com/ss_thumbnails/software-251207185858-eb450678-thumbnail.jpg?width=640&height=640&fit=bounds)


![Chapter4_Initiation_of_Sediment_Motion_v2[1].pptx](https://cdn.slidesharecdn.com/ss_thumbnails/chapter4initiationofsedimentmotionv21-251208223747-f94ef163-thumbnail.jpg?width=640&height=640&fit=bounds)
