Download as PDF, PPTX


The document details a comprehensive workforce management strategy aimed at improving employee productivity, customer satisfaction, and reducing operational costs. It outlines processes for analyzing current workforce characteristics, forecasting future needs, scheduling shifts, and measuring employee performance using various metrics. Additionally, it includes training programs and budgets related to workforce management software and expected outcomes of the workforce management plan.
Introduction to the presentation on Workforce Management tailored for a specific company.
Goals include improving productivity, labor planning, operational costs, and attendance tracking.
Breakdown of topics covered in the presentation regarding workforce management processes.
Identifies goals like productivity improvement, customer service enhancement, and cost reduction.
Overview of workforce management, including goal setting, workforce analysis, and performance tracking.
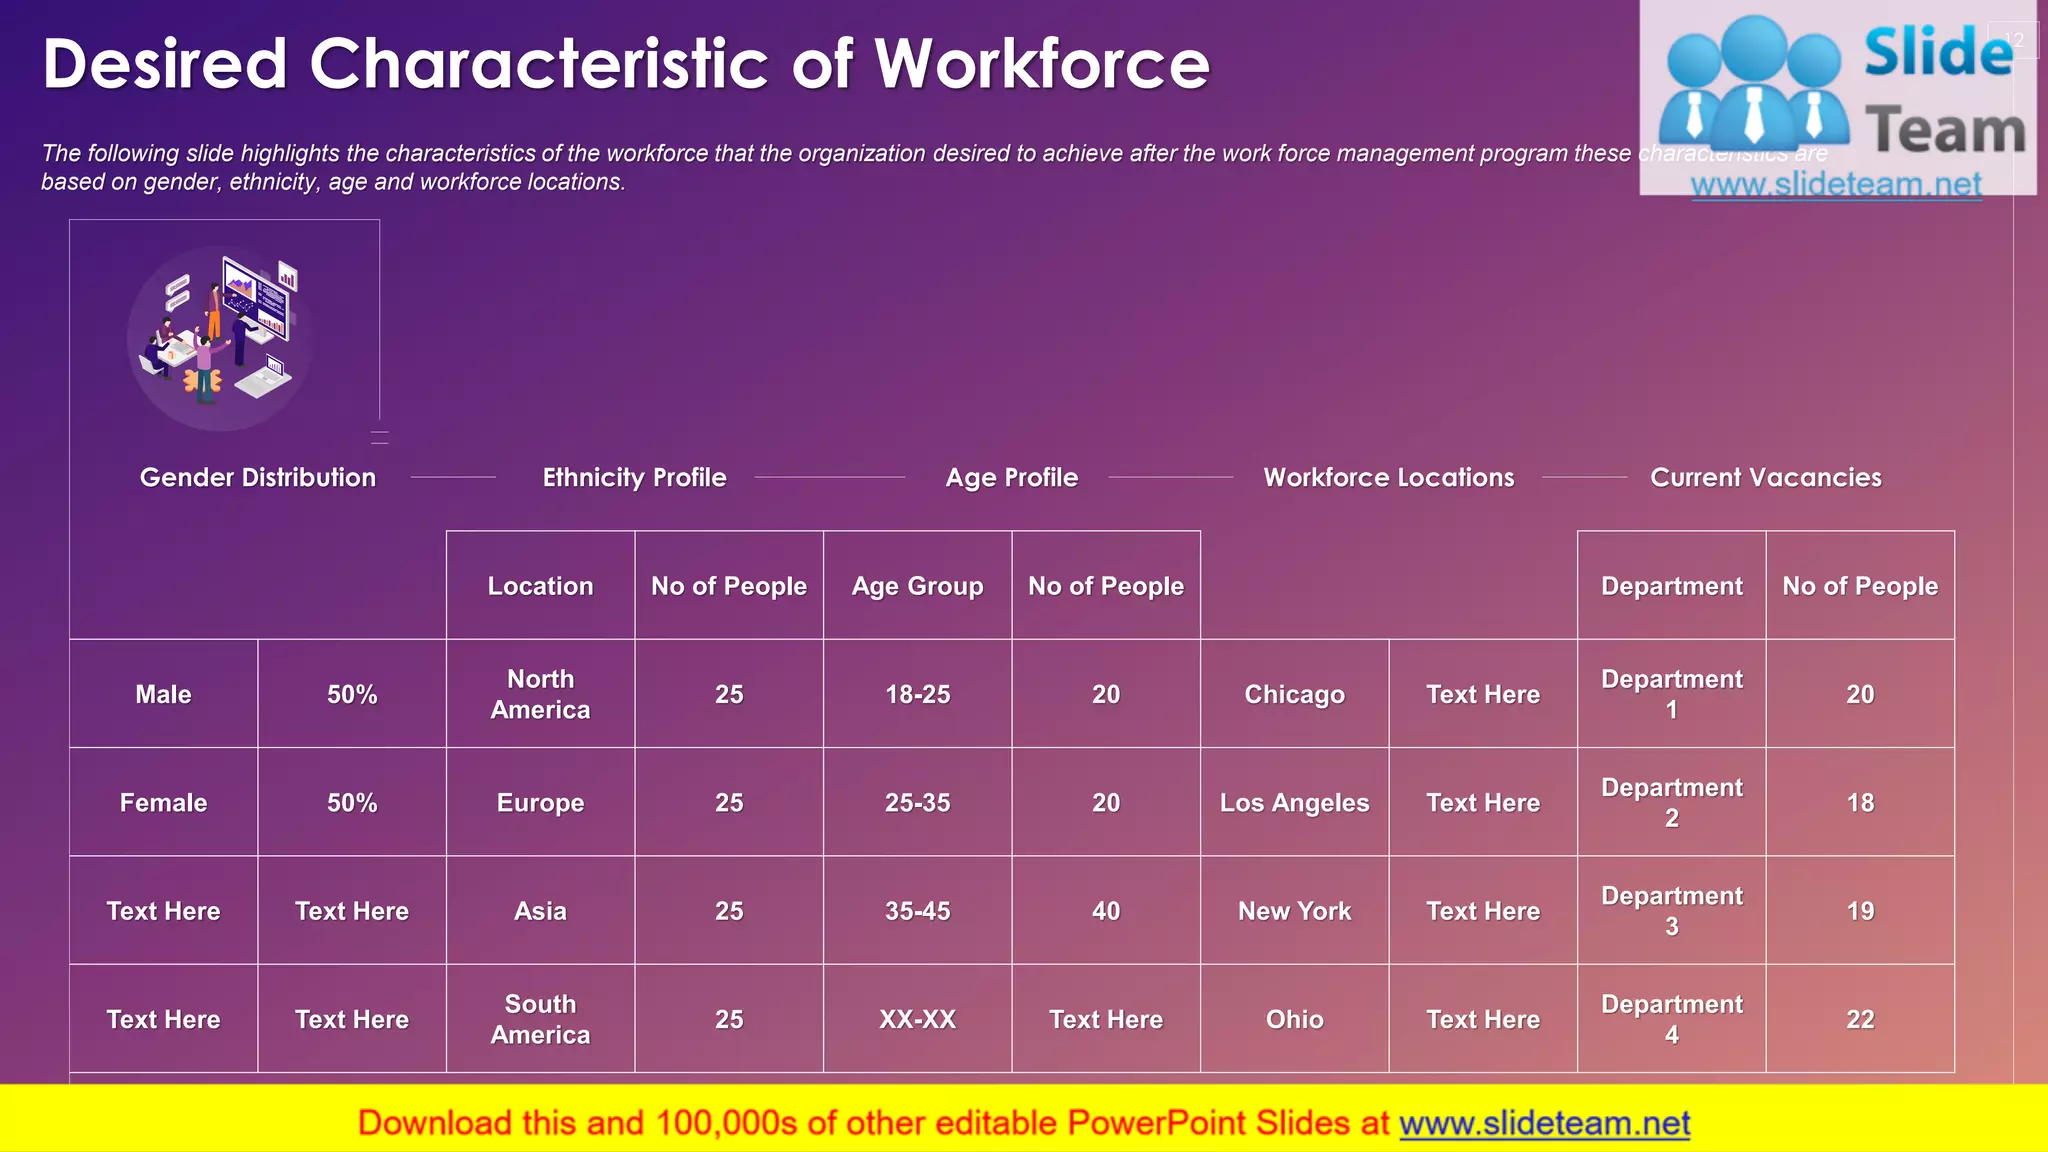
Analyzing workforce demographics including gender, age, and department distribution.
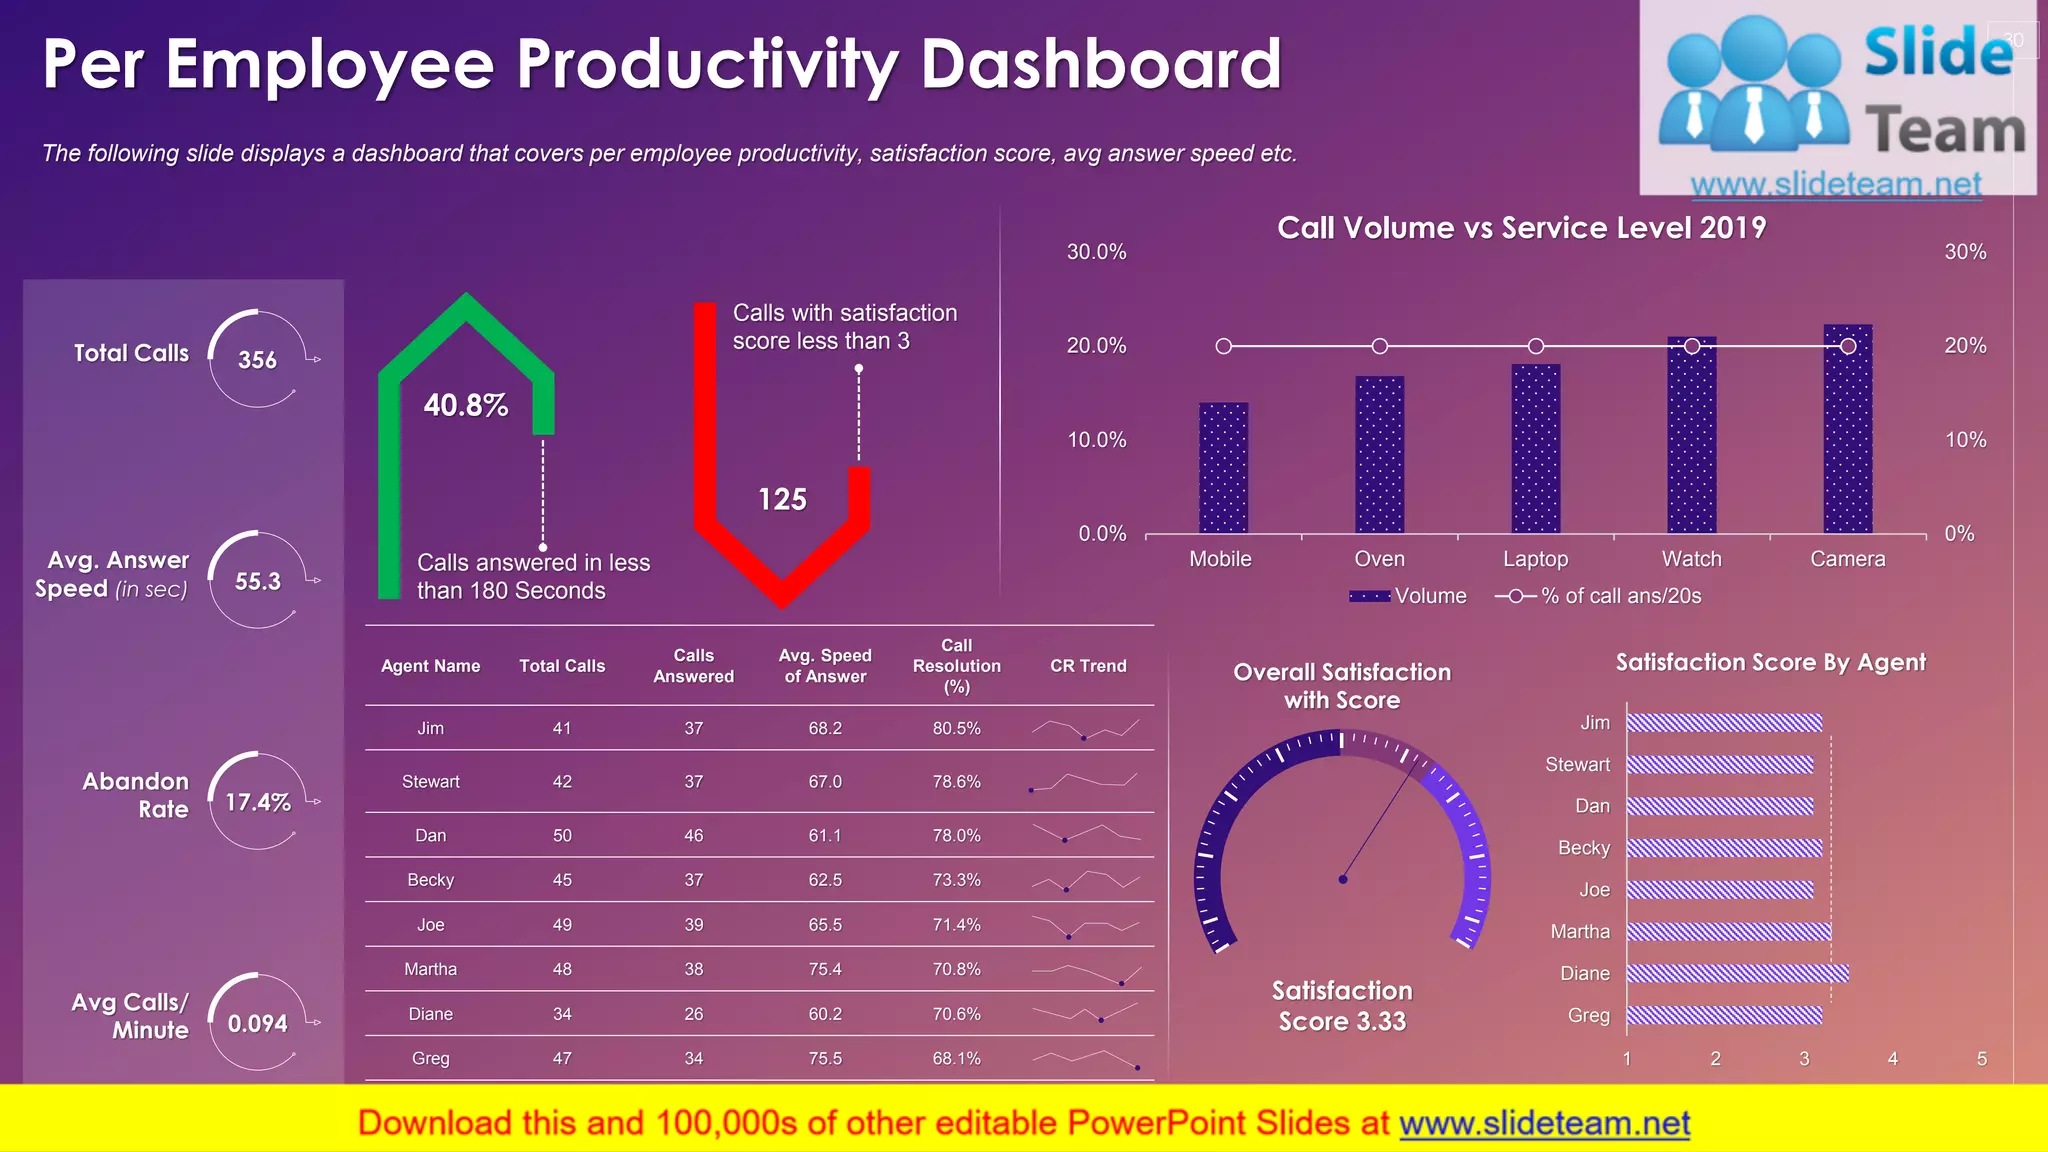
Metrics on average incoming calls, occupancy rates, and first response times with key takeaways.
Forecasting workforce characteristics and customer satisfaction data collection methods.
Analysis to identify current vs. desired workforce skill levels and necessary training.
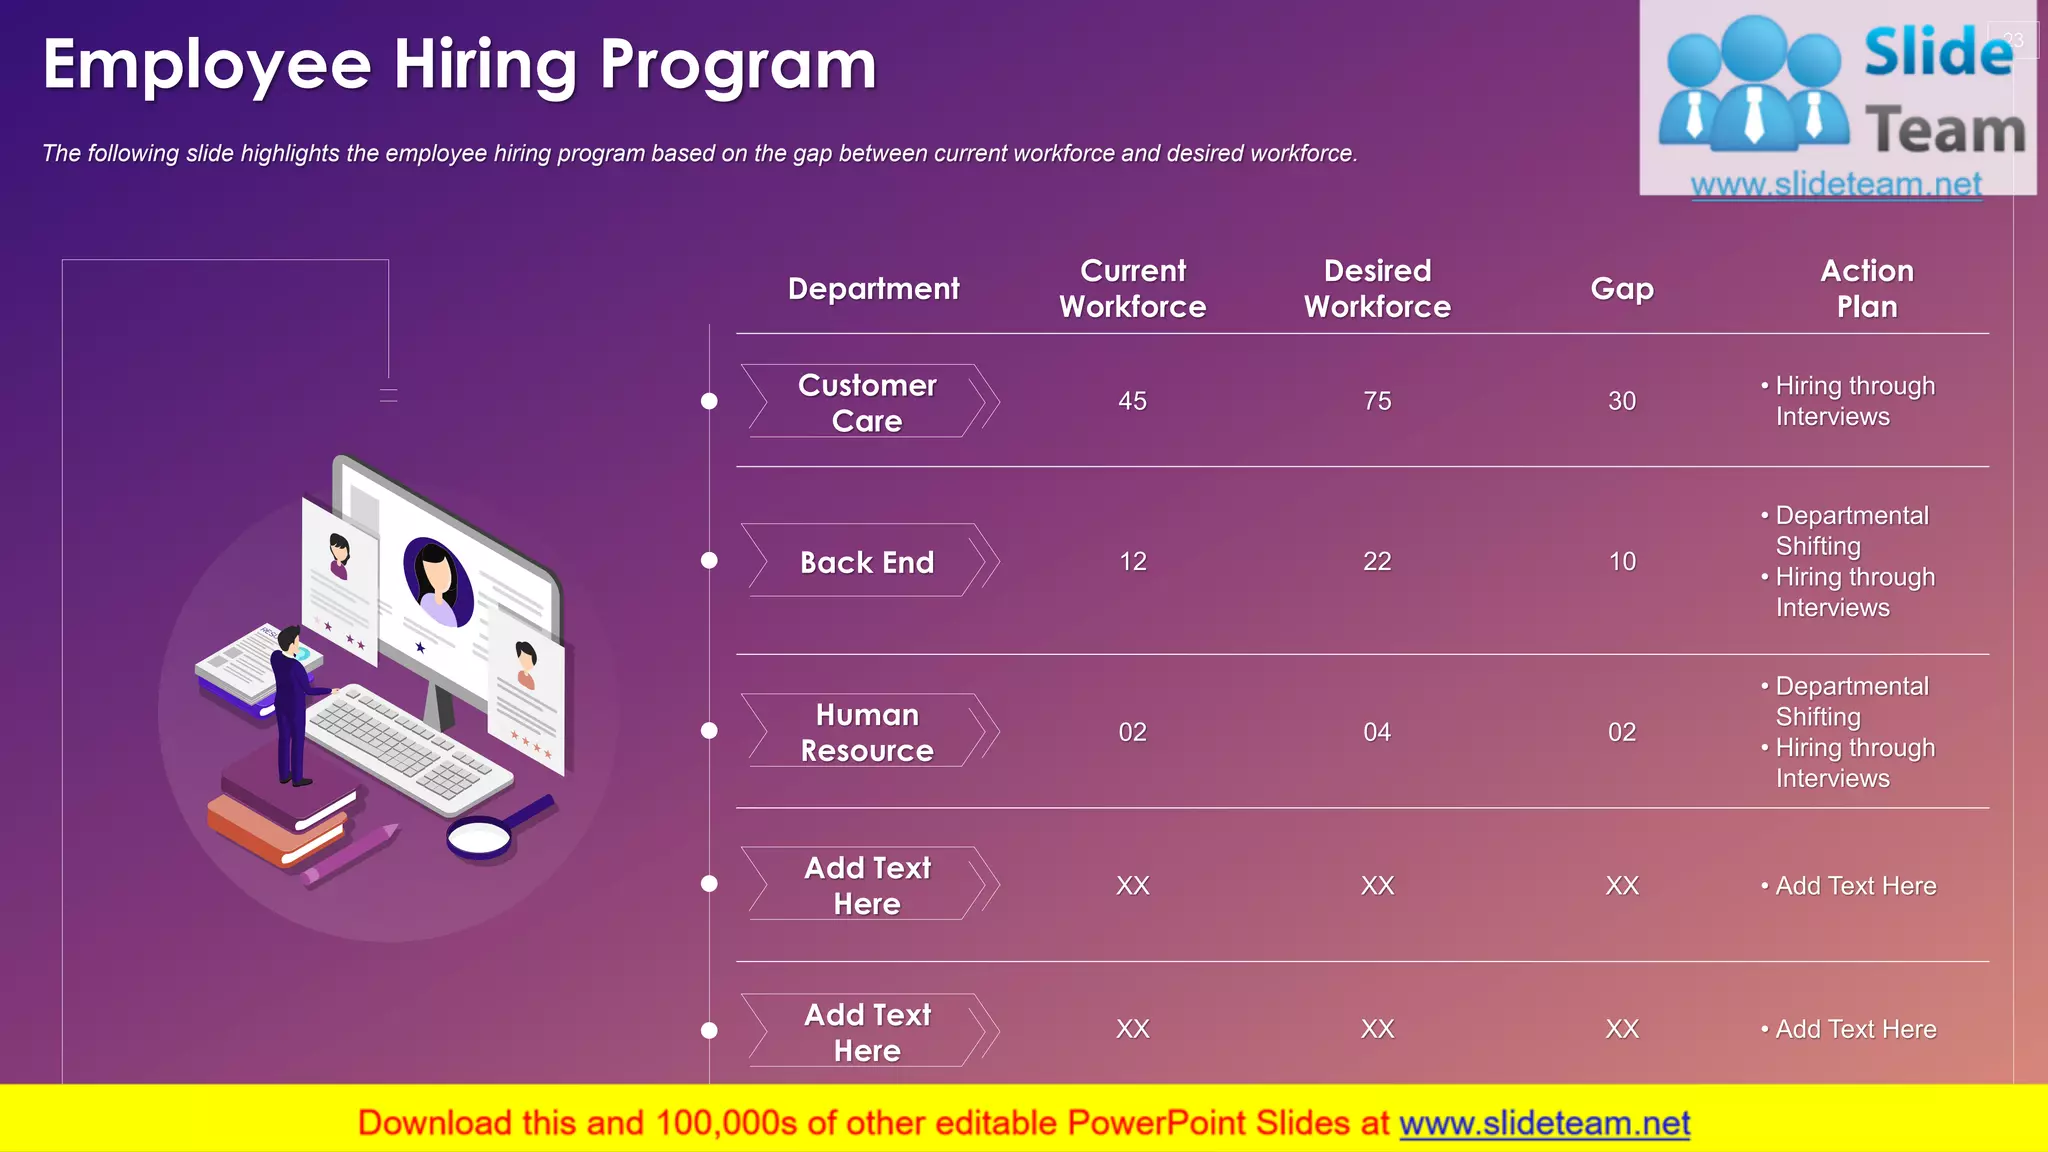
Strategies for shift scheduling, training programs, and hiring initiatives based on workforce analysis.
KPIs for measuring productivity, expected results from management, and associated budgeting.
Final slides with company information, team introduction, and a thank you message.
Column chart displaying sales percentages over fiscal years to highlight company growth.
Introduction of team members with designations for audience engagement.
Displays contact details and a thank you note inviting further engagement.


![[BEDROCK] Claude Prompt Engineering Techniques.pptx](https://cdn.slidesharecdn.com/ss_thumbnails/bedrockclaudepromptengineeringtechniques-231213183236-1d873607-thumbnail.jpg?width=640&height=640&fit=bounds)


