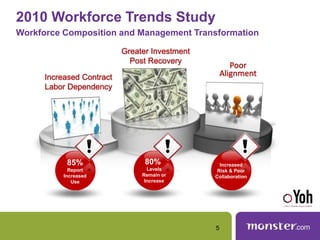
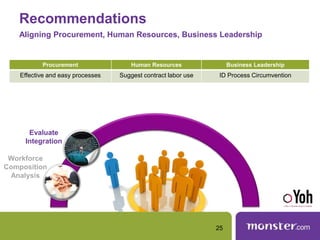
Workforce Composition
Transformation
Presented By:
Joel Capperella
Sr. VP Client Solutions
October 28, 2010
How the recession
has changed today’s workforce
Respondent Profile
Increased Dependency on Contract Labor
Post Recovery Forecast & Investments
Contract Labor Decision Criteria
Misalignment
Recommendations
Respondent Profile
Increased Dependency on Contract Labor
Post Recovery Forecast & Investments
Contract Labor Decision Criteria
Misalignment
Recommendations
Respondent Profile
Product
Manufacturing
Other
Health Care
Banking/Financial
Services
Consumer Products
High Tech
Professional
Services
Aerospace & Defense
Telecommunications
Life Science Media/Entertainment
Federal Government
Annual Revenue: > $750M
Disciplines: Business Leadership
Procurement
Human Resources
Nonemployees: 5% to 20%
Industries: High Tech
Consumer Products
Financial Services
Health Care
Life Sciences
Product Manufacturing
Telecom
Professional Services
Media / Entertainment
Public Sector
4
Increased Contract
Labor Dependency
Greater Investment
Post Recovery
Poor
Alignment
Increased
Risk & Poor
Collaboration
80%
Levels
Remain or
Increase
85%
Report
Increased
Use
2010 Workforce Trends Study
Workforce Composition and Management Transformation
5
Respondent Profile
Increased Dependency on Contract Labor
Post Recovery Forecast & Investments
Contract Labor Decision Criteria
Misalignment
Recommendations
Remained the
same
Increased by a
small percentage
Increased by over
5%
Decreased by a
small percentage
Decreased by
over 5%
Dramatic Dependency on Non-Employee
88.5%
Since September of 2008,
88.5% report the size of
their non-employee
workforce has either stayed
the same or INCREASED
7
Utilization of ‘non-employees’ either decrease or
introduces NO management complexity
Benefits of Non-employee Workforce
No Change
Decreases Labor
Related
Expense
Increases Labor
Related
Expense
0% 20% 40% 60% 80% 100%
No Change Decreases Mgt
Complexity
Increases Mgt.
Complexity
88.5% Overall labor related expense decreases or
remains consistent with increased use of ‘non-
employees’
83.5%
DECREASED management
COMPLEXITY and labor
related EXPENSES create
incentive to expand the
‘non-employee’ segment of
the workforce
0% 25% 50% 75% 100%
8
Respondent Profile
Increased Dependency on Contract Labor
Post Recovery Forecast & Investments
Contract Labor Decision Criteria
Misalignment
Recommendations
Recovery Yields Transformed Workforce
0%
10%
20%
30%
40%
50%
60%
70%
80%
90%
100%
Reported Non-employee use stays the same or increases Reported decrease dependency on non-employees
Strong economic
recovery will show
continued use and
INCREASES in the
non-employee
workforce
80%
Stays at Current Level
Small Increase
Increase > 5%
10
Increased Focus on ‘Non-employees’
0%
10%
20%
30%
40%
50%
60%
70%
Investments in non-employee Processes
No investment in non-employee processes
Increased
Employee
Engagement
Vendor
Consolidation
Improved
Employee
Communication
Include ‘Non-
Employees’ on
All Teams
Significant INVESTMENTS are
being made to improve the
management and effectiveness
of the ‘non-employee’ segment
of the workforce
63%
11
Respondent Profile
Increased Dependency on Contract Labor
Post Recovery Forecast & Investments
Contract Labor Decision Criteria
Misalignment
Recommendations
Consumer: Non-employee Decision
Priorities
0%
20%
40%
60%
80%
100%
Possess above
average skill or a
specific and unique
skill set
Can agree upon
specific service
level requirements
Affordability
Potential to become
an indispensible
contributor to the
team
Flexibility to end the
relationship as
business conditions
change
Previous working
relationship
59%
41%
35%
27%
22%
18%
30%
21%
31%
41% 54%
25%
12%
39% 35% 33% 25%
58%
Most Important Average Importance Least Important
13
Organization: Non-employee Decision
Priorities
0%
20%
40%
60%
80%
100%
Possess above
average skill or a
specific and unique
skill set
Affordability
Can agree upon
specific service
level requirements
Potential to become
an indispensible
contributor to the
team
Flexibility to end
the relationship as
business
conditions change
Previous working
relationship
54%
41%
36%
31%
26%
13%
31%
24%
29%
37% 54%
27%
16%
36% 35% 33%
21%
60%
Most Important Average Importance Least Important
14
Respondent Profile
Increased Dependency on Contract Labor
Post Recovery Forecast & Investments
Contract Labor Decision Criteria
Misalignment
Recommendations
Misalignment
Organizational and Business Priorities
CONSUMER ORGANIZATION
Quality Cost
Availability Availability
Cost Longevity
Longevity Flexibility
Flexibility Quality
Relationship Relationship
COST CENTRIC decision
making minimizes quality,
value, impact and integration
of the non-employee segment
of the workforce
16
Misalignment
Accountability and Risk Exposure
0%
10%
20%
30%
40%
50%
60%
70%
80%
Cost is the
overwhelming concern
over contracted labor
use
Accountability and
Risk currently not given
top priority
17
Misalignment
Loose Supply Chain Control
0%
10%
20%
30%
40%
50%
Procurement
Business Leadership
Business Controls
Procurement
Controls
STARTLING indicator of continued lack of control
over efficient acquisition of contracted labor
18
Misalignment
Poorly integrated collaboration
-5%
5%
15%
25%
35%
45%
55%
Human Resources
Hiring managers / Project
managers
Sourcing / Procurement
Finance
Influence over introducing
contracted labor into the workforce
rests with hiring managers and is
shared with human resources
19
Misalignment
Workforce Plans vs. Operational Plans
0%
10%
20%
30%
40%
50%
60%
70%
80%
90%
100%
Stays at
Current
Level
Small
Increase
Increase > 5%
60%
65%
70%
75%
80%
85%
90%
Human Resources Procurment
Workforce planning
appears to be
poorly aligned with
operational
planning
20
Human Resources Procurement
Misalignment
Isolated process investments
0%
10%
20%
30%
40%
50%
60%
70%
Increased
Employee
Engagement
Vendor
Consolidation
Improved
Employee
Communication
Include ‘Non-
employees’
on All Teams
63%
0% 15% 30% 45%
vendor consolidation
engagement
improved communications
Add more
make no changes
While
investments
are being made
they appear to
be isolated and
outweighed by
inaction
21
Misalignment
Poorly Identified Expectations
0%
5%
10%
15%
20%
25%
Procurement Business
Leadership
No change Decreases labor
related expense
Increases labor
related expense
0% 20% 40% 60% 80% 100%
88.5% Overall labor related expense decreases or remains
consistent with increased use of ‘non-employees’
The business does not have expectation of
cost savings when using contracted labor –
an opportunity for procurement to assist
22
Respondent Profile
Increased Dependency on Contract Labor
Post Recovery Forecast & Investments
Contract Labor Decision Criteria
Misalignment
Recommendations
Procurement Human Resources Business Leadership
Contract definition Workforce plan alignment Contract labor inventory
Recommendations
Aligning Procurement, Human Resources, Business Leadership
Workforce
Composition
Analysis
24
Recommendations
Aligning Procurement, Human Resources, Business Leadership
Workforce
Composition
Analysis
Evaluate
Integration
25
Procurement Human Resources Business Leadership
Effective and easy processes Suggest contract labor use ID Process Circumvention
Recommendations
Aligning Procurement, Human Resources, Business Leadership
Workforce
Composition
Analysis
Evaluate
Integration
Define Shared
Accountability
26
Procurement Human Resources Business Leadership
Cost to value metrics Job description consistency Communicate change in needs
Recommendations
Aligning Procurement, Human Resources, Business Leadership
Workforce
Composition
Analysis
Evaluate
Integration
Define Shared
Accountability
Evaluate Supply Chain
27
Procurement Human Resources Business Leadership
Summarize engaged suppliers Provide quality metrics Performance report history
Recommendations
Aligning Procurement, Human Resources, Business Leadership
Workforce
Composition
Analysis
Evaluate
Integration
Map Out
Processes
Define Shared
Accountability
Evaluate Supply Chain
28
Procurement Human Resources Business Leadership
ID acceptable flexibility Identify ‘best-use’ scenarios Adopt process suggestions
Recommendations
Aligning Procurement, Human Resources, Business Leadership
Workforce
Composition
Analysis
Evaluate
Integration
Map Out
Processes
Define Shared
Accountability
Evaluate Supply Chain
Risk
Mitigation
Strategies
29
Procurement Human Resources Business Leadership
Indemnity education Compliance checklist Communicate risk expectations
Workforce
Composition
Analysis
Evaluate
Integration
Map Out
Processes
Define Shared
Accountability
Evaluate Supply Chain
Educated and
Enable
Risk
Mitigation
Strategies
Recommendations
Aligning Procurement, Human Resources, Business Leadership
30
Procurement Human Resources Business Leadership
Quarterly Business Reviews
Increased Contract
Labor Dependency
Greater Investment
Post Recovery
Poor
Alignment
Increased
Risk & Poor
Collaboration
80%
Levels
Remain or
Increase
85%
Report
Increased
Use
2010 Workforce Trends Study
Workforce Composition and Management Transformation
31
32
WORKFORCE SOLUTIONS
Aerospace & Defense Engineering Federal Services Health Care
Life Sciences Information Technology Telecommunications
DELIVERY
Immediate Resource Needs Managed Services Recruitment Process Outsourcing
Vendor Management Systems Independent Contractor Compliance Payroll Services
www.twitter.com/joelcapperella
www.twitter.com/SeamlessWkfce
www.seamlessworkforce.com
Thank You & Questions

Workforce Composition Transformation

  • 1.
    Workforce Composition Transformation Presented By: JoelCapperella Sr. VP Client Solutions October 28, 2010 How the recession has changed today’s workforce
  • 2.
    Respondent Profile Increased Dependencyon Contract Labor Post Recovery Forecast & Investments Contract Labor Decision Criteria Misalignment Recommendations
  • 3.
    Respondent Profile Increased Dependencyon Contract Labor Post Recovery Forecast & Investments Contract Labor Decision Criteria Misalignment Recommendations
  • 4.
    Respondent Profile Product Manufacturing Other Health Care Banking/Financial Services ConsumerProducts High Tech Professional Services Aerospace & Defense Telecommunications Life Science Media/Entertainment Federal Government Annual Revenue: > $750M Disciplines: Business Leadership Procurement Human Resources Nonemployees: 5% to 20% Industries: High Tech Consumer Products Financial Services Health Care Life Sciences Product Manufacturing Telecom Professional Services Media / Entertainment Public Sector 4
  • 5.
    Increased Contract Labor Dependency GreaterInvestment Post Recovery Poor Alignment Increased Risk & Poor Collaboration 80% Levels Remain or Increase 85% Report Increased Use 2010 Workforce Trends Study Workforce Composition and Management Transformation 5
  • 6.
    Respondent Profile Increased Dependencyon Contract Labor Post Recovery Forecast & Investments Contract Labor Decision Criteria Misalignment Recommendations
  • 7.
    Remained the same Increased bya small percentage Increased by over 5% Decreased by a small percentage Decreased by over 5% Dramatic Dependency on Non-Employee 88.5% Since September of 2008, 88.5% report the size of their non-employee workforce has either stayed the same or INCREASED 7
  • 8.
    Utilization of ‘non-employees’either decrease or introduces NO management complexity Benefits of Non-employee Workforce No Change Decreases Labor Related Expense Increases Labor Related Expense 0% 20% 40% 60% 80% 100% No Change Decreases Mgt Complexity Increases Mgt. Complexity 88.5% Overall labor related expense decreases or remains consistent with increased use of ‘non- employees’ 83.5% DECREASED management COMPLEXITY and labor related EXPENSES create incentive to expand the ‘non-employee’ segment of the workforce 0% 25% 50% 75% 100% 8
  • 9.
    Respondent Profile Increased Dependencyon Contract Labor Post Recovery Forecast & Investments Contract Labor Decision Criteria Misalignment Recommendations
  • 10.
    Recovery Yields TransformedWorkforce 0% 10% 20% 30% 40% 50% 60% 70% 80% 90% 100% Reported Non-employee use stays the same or increases Reported decrease dependency on non-employees Strong economic recovery will show continued use and INCREASES in the non-employee workforce 80% Stays at Current Level Small Increase Increase > 5% 10
  • 11.
    Increased Focus on‘Non-employees’ 0% 10% 20% 30% 40% 50% 60% 70% Investments in non-employee Processes No investment in non-employee processes Increased Employee Engagement Vendor Consolidation Improved Employee Communication Include ‘Non- Employees’ on All Teams Significant INVESTMENTS are being made to improve the management and effectiveness of the ‘non-employee’ segment of the workforce 63% 11
  • 12.
    Respondent Profile Increased Dependencyon Contract Labor Post Recovery Forecast & Investments Contract Labor Decision Criteria Misalignment Recommendations
  • 13.
    Consumer: Non-employee Decision Priorities 0% 20% 40% 60% 80% 100% Possessabove average skill or a specific and unique skill set Can agree upon specific service level requirements Affordability Potential to become an indispensible contributor to the team Flexibility to end the relationship as business conditions change Previous working relationship 59% 41% 35% 27% 22% 18% 30% 21% 31% 41% 54% 25% 12% 39% 35% 33% 25% 58% Most Important Average Importance Least Important 13
  • 14.
    Organization: Non-employee Decision Priorities 0% 20% 40% 60% 80% 100% Possessabove average skill or a specific and unique skill set Affordability Can agree upon specific service level requirements Potential to become an indispensible contributor to the team Flexibility to end the relationship as business conditions change Previous working relationship 54% 41% 36% 31% 26% 13% 31% 24% 29% 37% 54% 27% 16% 36% 35% 33% 21% 60% Most Important Average Importance Least Important 14
  • 15.
    Respondent Profile Increased Dependencyon Contract Labor Post Recovery Forecast & Investments Contract Labor Decision Criteria Misalignment Recommendations
  • 16.
    Misalignment Organizational and BusinessPriorities CONSUMER ORGANIZATION Quality Cost Availability Availability Cost Longevity Longevity Flexibility Flexibility Quality Relationship Relationship COST CENTRIC decision making minimizes quality, value, impact and integration of the non-employee segment of the workforce 16
  • 17.
    Misalignment Accountability and RiskExposure 0% 10% 20% 30% 40% 50% 60% 70% 80% Cost is the overwhelming concern over contracted labor use Accountability and Risk currently not given top priority 17
  • 18.
    Misalignment Loose Supply ChainControl 0% 10% 20% 30% 40% 50% Procurement Business Leadership Business Controls Procurement Controls STARTLING indicator of continued lack of control over efficient acquisition of contracted labor 18
  • 19.
    Misalignment Poorly integrated collaboration -5% 5% 15% 25% 35% 45% 55% HumanResources Hiring managers / Project managers Sourcing / Procurement Finance Influence over introducing contracted labor into the workforce rests with hiring managers and is shared with human resources 19
  • 20.
    Misalignment Workforce Plans vs.Operational Plans 0% 10% 20% 30% 40% 50% 60% 70% 80% 90% 100% Stays at Current Level Small Increase Increase > 5% 60% 65% 70% 75% 80% 85% 90% Human Resources Procurment Workforce planning appears to be poorly aligned with operational planning 20 Human Resources Procurement
  • 21.
    Misalignment Isolated process investments 0% 10% 20% 30% 40% 50% 60% 70% Increased Employee Engagement Vendor Consolidation Improved Employee Communication Include‘Non- employees’ on All Teams 63% 0% 15% 30% 45% vendor consolidation engagement improved communications Add more make no changes While investments are being made they appear to be isolated and outweighed by inaction 21
  • 22.
    Misalignment Poorly Identified Expectations 0% 5% 10% 15% 20% 25% ProcurementBusiness Leadership No change Decreases labor related expense Increases labor related expense 0% 20% 40% 60% 80% 100% 88.5% Overall labor related expense decreases or remains consistent with increased use of ‘non-employees’ The business does not have expectation of cost savings when using contracted labor – an opportunity for procurement to assist 22
  • 23.
    Respondent Profile Increased Dependencyon Contract Labor Post Recovery Forecast & Investments Contract Labor Decision Criteria Misalignment Recommendations
  • 24.
    Procurement Human ResourcesBusiness Leadership Contract definition Workforce plan alignment Contract labor inventory Recommendations Aligning Procurement, Human Resources, Business Leadership Workforce Composition Analysis 24
  • 25.
    Recommendations Aligning Procurement, HumanResources, Business Leadership Workforce Composition Analysis Evaluate Integration 25 Procurement Human Resources Business Leadership Effective and easy processes Suggest contract labor use ID Process Circumvention
  • 26.
    Recommendations Aligning Procurement, HumanResources, Business Leadership Workforce Composition Analysis Evaluate Integration Define Shared Accountability 26 Procurement Human Resources Business Leadership Cost to value metrics Job description consistency Communicate change in needs
  • 27.
    Recommendations Aligning Procurement, HumanResources, Business Leadership Workforce Composition Analysis Evaluate Integration Define Shared Accountability Evaluate Supply Chain 27 Procurement Human Resources Business Leadership Summarize engaged suppliers Provide quality metrics Performance report history
  • 28.
    Recommendations Aligning Procurement, HumanResources, Business Leadership Workforce Composition Analysis Evaluate Integration Map Out Processes Define Shared Accountability Evaluate Supply Chain 28 Procurement Human Resources Business Leadership ID acceptable flexibility Identify ‘best-use’ scenarios Adopt process suggestions
  • 29.
    Recommendations Aligning Procurement, HumanResources, Business Leadership Workforce Composition Analysis Evaluate Integration Map Out Processes Define Shared Accountability Evaluate Supply Chain Risk Mitigation Strategies 29 Procurement Human Resources Business Leadership Indemnity education Compliance checklist Communicate risk expectations
  • 30.
    Workforce Composition Analysis Evaluate Integration Map Out Processes Define Shared Accountability EvaluateSupply Chain Educated and Enable Risk Mitigation Strategies Recommendations Aligning Procurement, Human Resources, Business Leadership 30 Procurement Human Resources Business Leadership Quarterly Business Reviews
  • 31.
    Increased Contract Labor Dependency GreaterInvestment Post Recovery Poor Alignment Increased Risk & Poor Collaboration 80% Levels Remain or Increase 85% Report Increased Use 2010 Workforce Trends Study Workforce Composition and Management Transformation 31
  • 32.
    32 WORKFORCE SOLUTIONS Aerospace &Defense Engineering Federal Services Health Care Life Sciences Information Technology Telecommunications DELIVERY Immediate Resource Needs Managed Services Recruitment Process Outsourcing Vendor Management Systems Independent Contractor Compliance Payroll Services www.twitter.com/joelcapperella www.twitter.com/SeamlessWkfce www.seamlessworkforce.com Thank You & Questions