This document outlines the key concepts and components of a wireless communications course, including:
- The 5 units that will be covered: wireless channels, cellular architecture, digital signaling for fading channels, multipath mitigation techniques, and multiple antenna techniques.
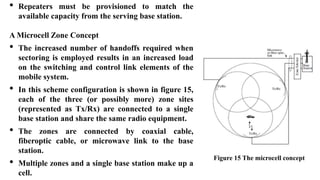
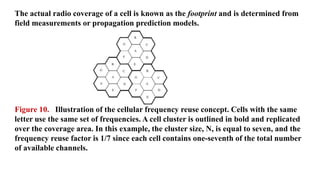
- An overview of the cellular architecture unit, which will cover topics like multiple access techniques, capacity calculations, cellular concepts, frequency reuse, channel assignment, handoff, interference and more.
- Information on the textbooks that will be used.
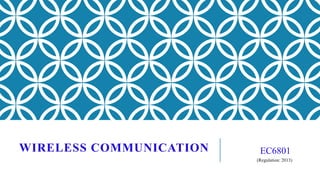
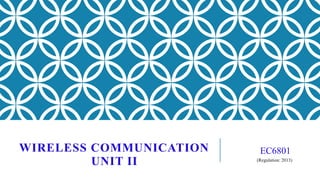
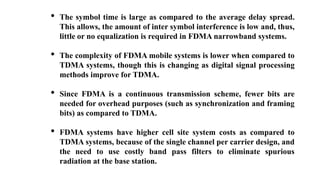
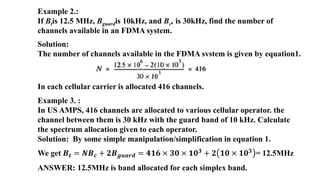
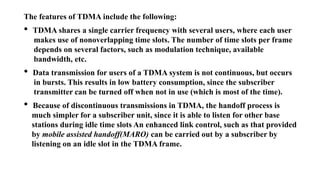
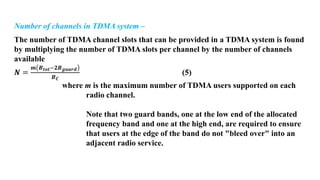
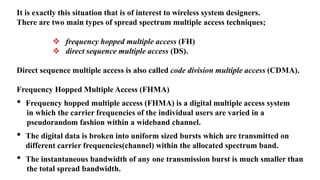
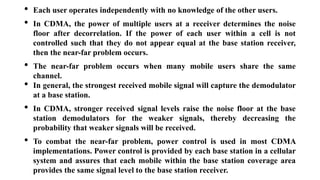
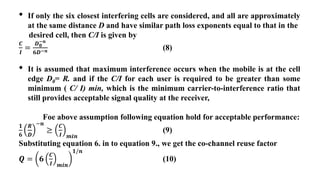
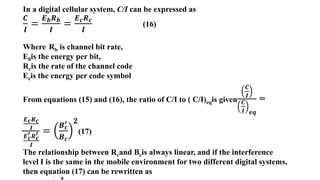
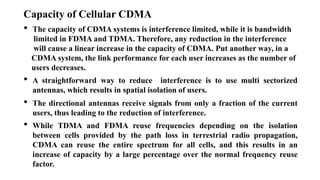
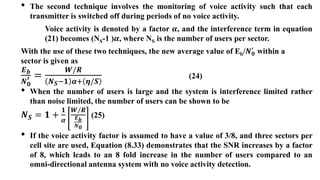
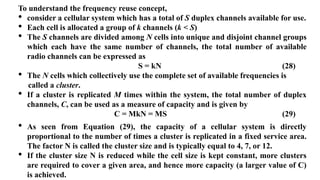
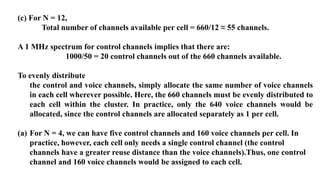
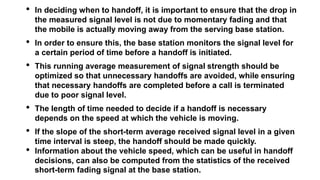
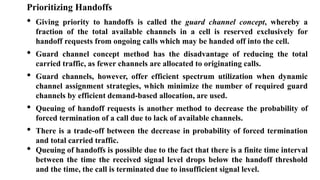
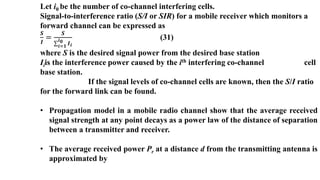
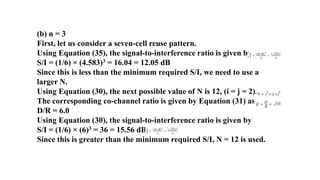
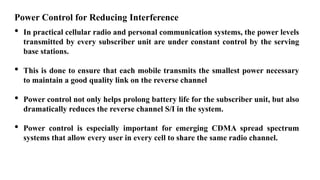
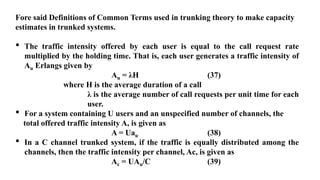
![• AT&T proposed the concept of a cellular mobile system to the FCC in 1968,
although technology was not available to implement cellular telephony until
the late 1970s.
• In 1983, the FCC (Federal Communications Commission) finally allocated 666
duplex channels (40 MHz of spectrum in the 800 MHz band, each channel
having a one-way bandwidth of 30kHz for a total spectrum occupancy of 60
kHz for each duplex channel) for the U.S. Advanced Mobile Phone System
(AMPS)
• AMPS was the first U.S. cellular telephone system, and was deployed in late
1983.
• In late 1991, the first U.S. Digital Cellular (USDC) system hardware was
installed in major U.S. cities.
• The USDC standard (Electronic Industry Association Interim Standard IS-54)
allows cellular operators to replace gracefully some single-user analog
channels with digital channels which .support three users in the same 30 kHz
bandwidth [EIA90].](https://image.slidesharecdn.com/wirelesscommunicationunit-2final-230913082738-34fbeb5d/85/WIRELESS-COMMUNICATION-Unit-2-Final-pptx-8-320.jpg)
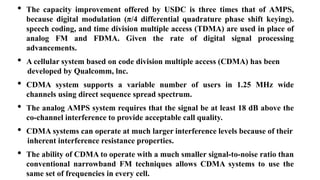
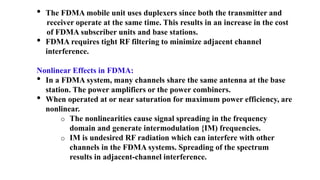
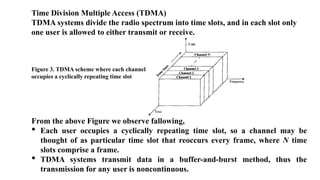
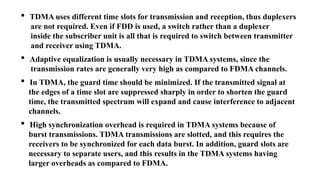
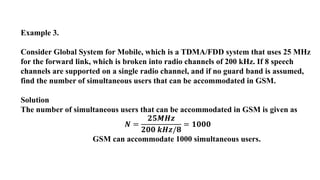
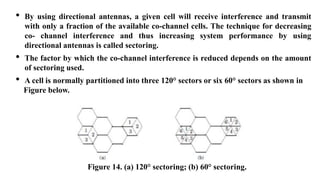
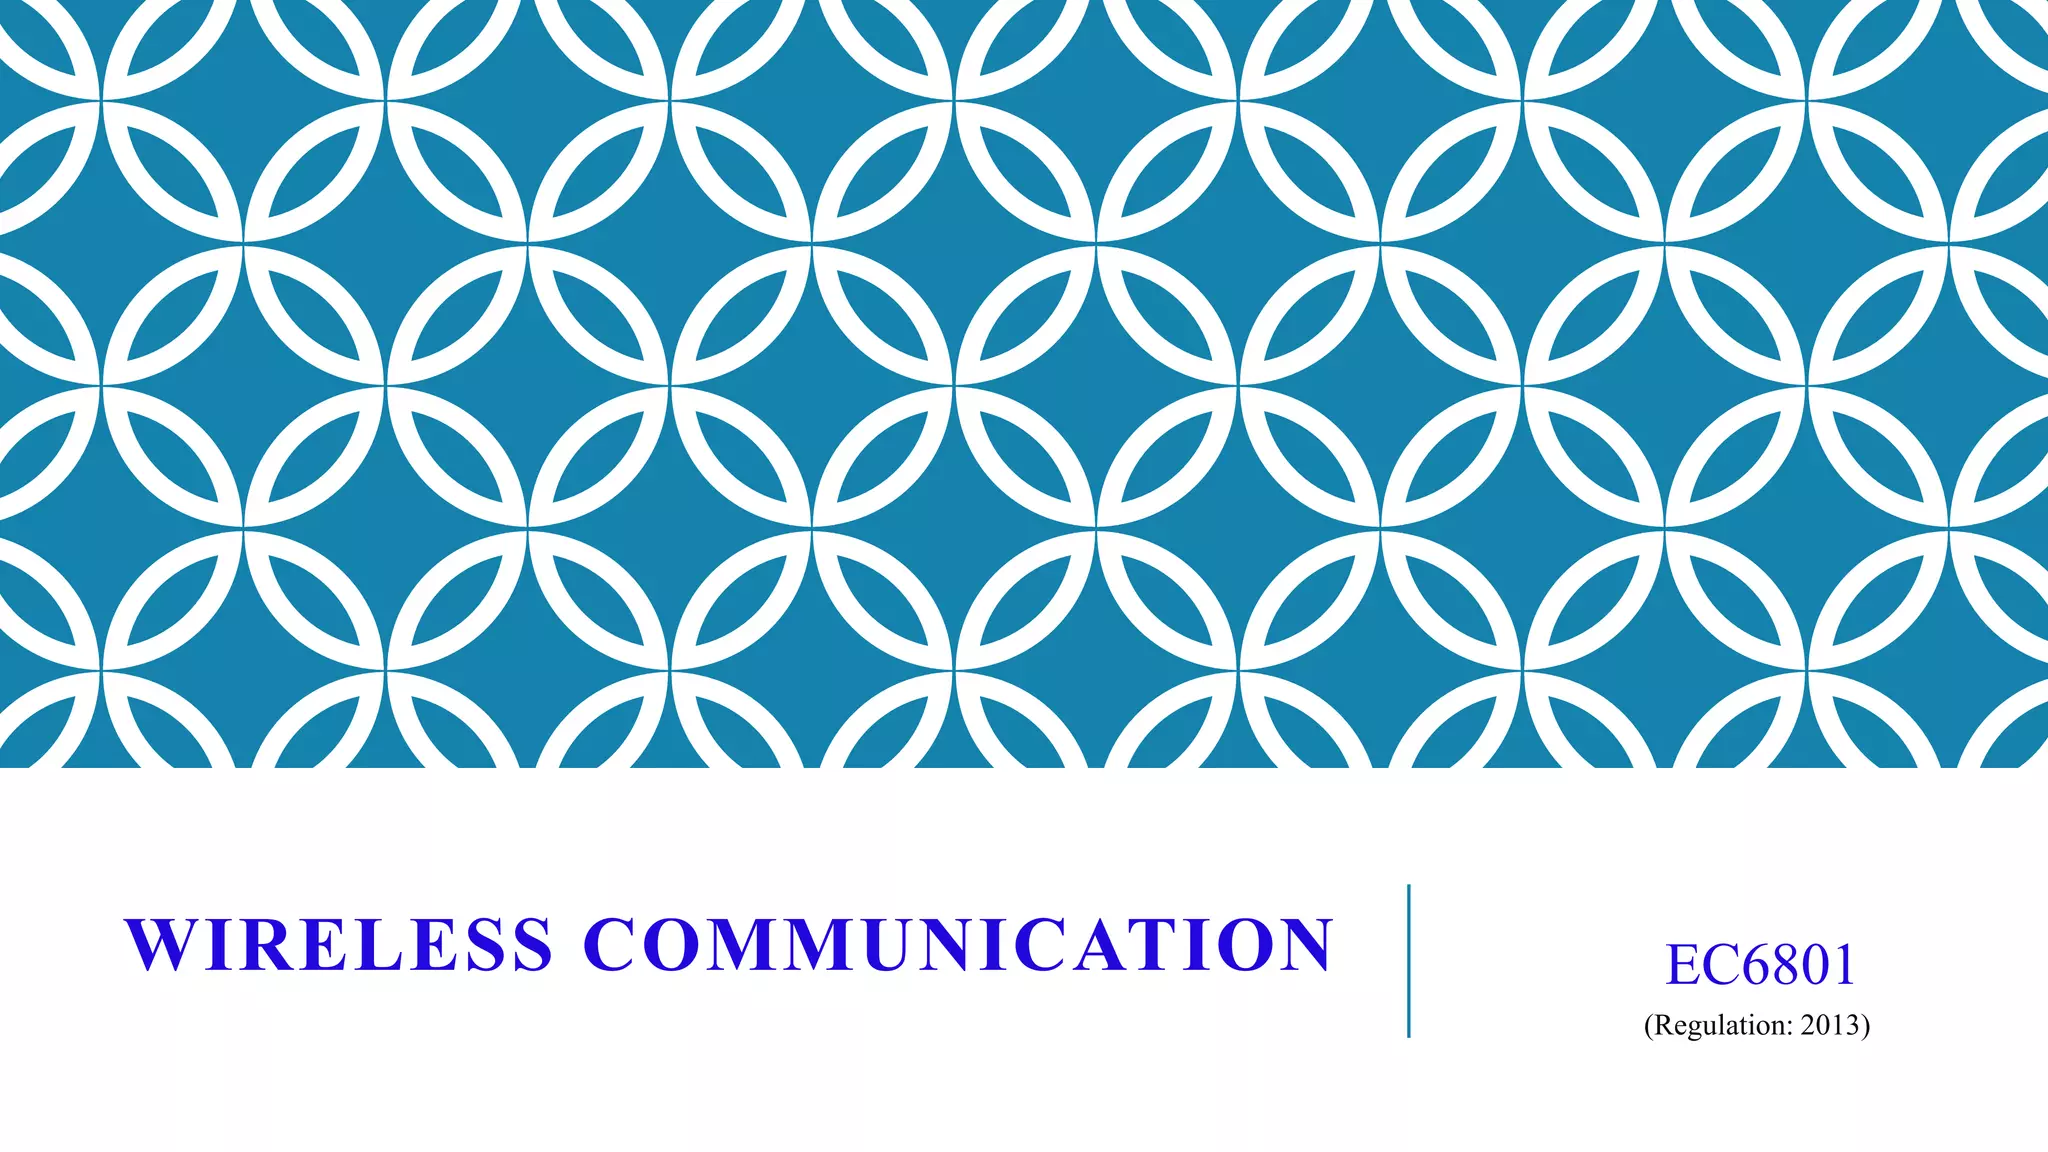
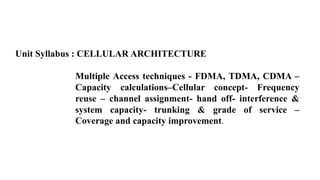
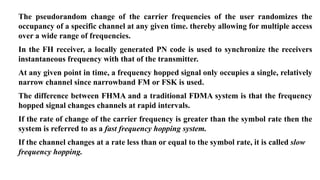
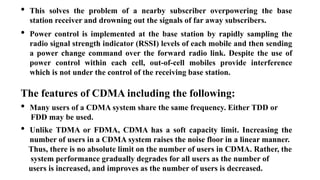
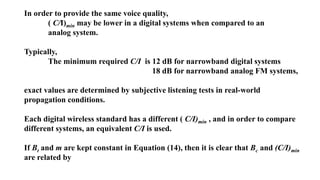
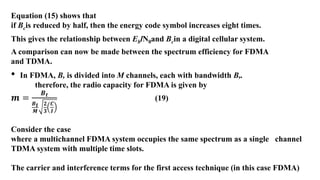
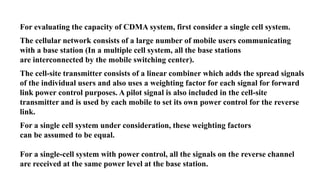
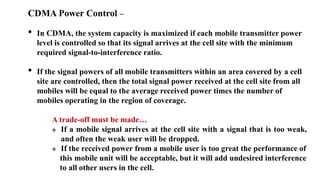
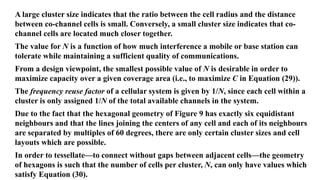
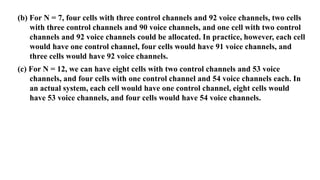
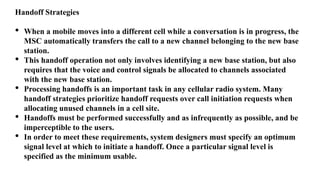
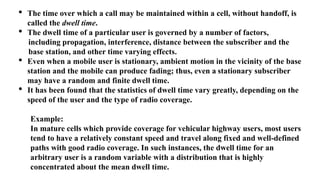
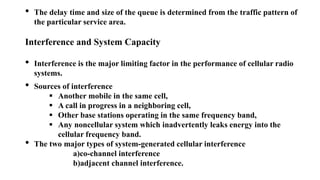
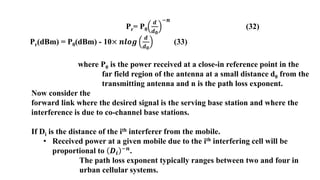
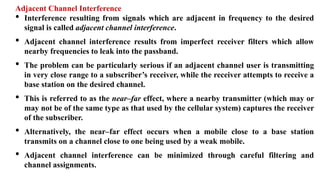
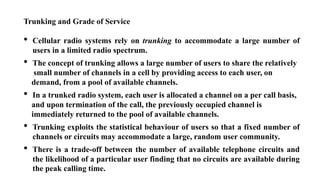
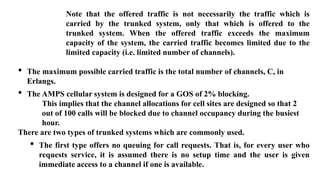
![Example 5
If a normal GSM time slot consists of 6 stop bit(also called trailing bits), 8.25 guard
bits, 26 training bits, and 2 traffic bursts of 58 bits of encrypted data which is
transmitted at 270.833 kbps. Find
(a) Number of overhead bits per frame, bOH
(b) Total number of bits/frame
(c) Frame rate
(d) Time duration of a slot
(e) Frame efficiency.
Solution
A time slot has 6 + 8.25 + 26 + 2(58) = 156.25 bits.
(a) Number of overhead bits per frame, b0H= 8(6) +8(8.25) +8(26) = 312 bits
(b) Number of bits/frame, 8 ×156.25 = 1250 bits/frame.
(c) Frame rate , 270.833 kbps/1250 bits/frame = 216.66 frame/sec
(d) Time duration of a slot, 156.25 × 1/270.833 kbps = 576.92 𝝁s
(e) Frame efficiency, 𝜼𝒇 =[1-(322/1250)] = 74.24%](https://image.slidesharecdn.com/wirelesscommunicationunit-2final-230913082738-34fbeb5d/85/WIRELESS-COMMUNICATION-Unit-2-Final-pptx-27-320.jpg)
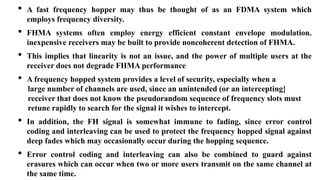
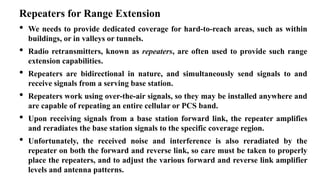
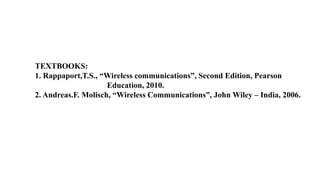
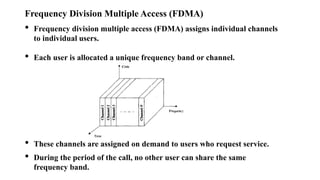
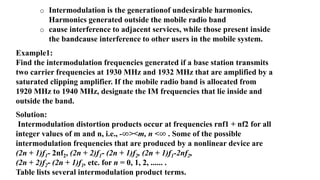
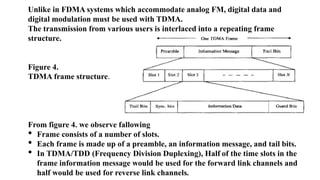
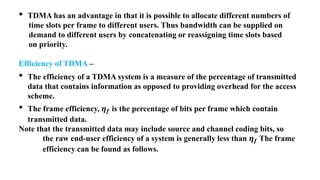
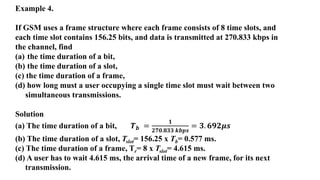
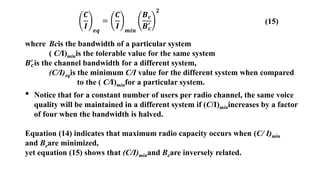
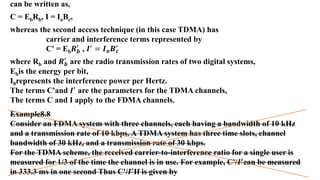
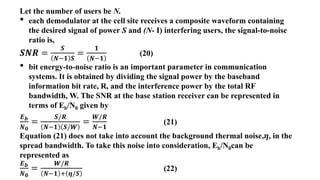
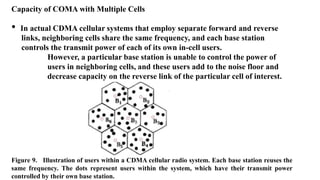
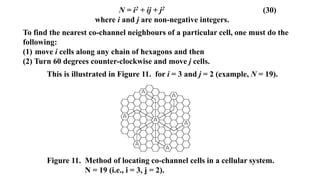
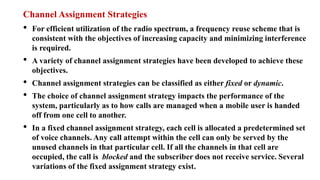
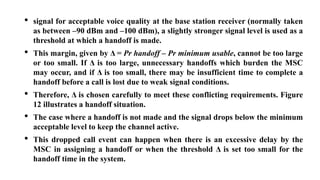
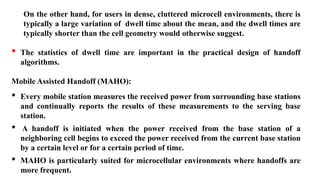
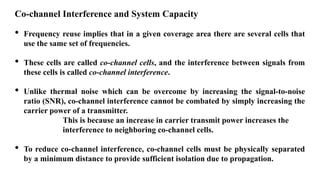
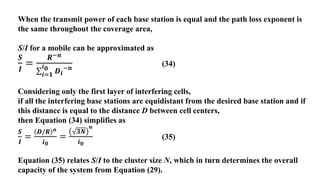
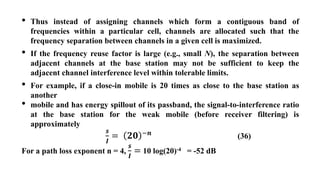
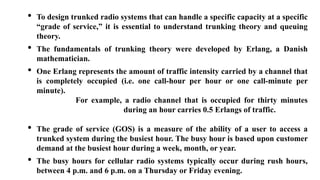
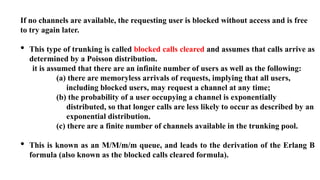
![The radio capacity of a cellular system is defined as
𝒎 =
𝑩𝒕
𝑩𝒄𝑵
radio channels/cell(11)
where m is the radio capacity metric
Btis the total allocated spectrum for the system
Bcis the channel bandwidth
N is the number of cells in a frequency reuse pattern
N is related to the co-channel reuse factor Q by
𝑸 = 𝟑𝑵 (12)
From Equations (10), (11), and (12), the radio capacity is given as
𝒎 =
𝑩𝒕
𝑩𝒄
𝑸𝟐
𝟑
=
𝑩𝒕
𝑩𝒄
𝟔
𝟑𝒏/𝟐
𝑪
𝑰 𝒎𝒊𝒏
𝟐/𝒏(13)
As per Lee [Lee89a], when n = 4 , the radio capacity is given by
m =
𝑩𝒕
𝑩𝒄
𝟐
𝟑
𝑪
𝑰 𝒎𝒊𝒏
radio channel/cell (14)](https://image.slidesharecdn.com/wirelesscommunicationunit-2final-230913082738-34fbeb5d/85/WIRELESS-COMMUNICATION-Unit-2-Final-pptx-42-320.jpg)
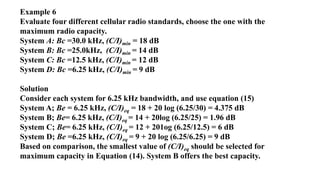
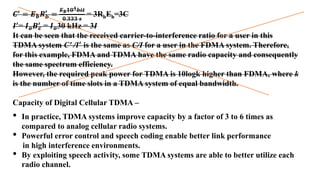
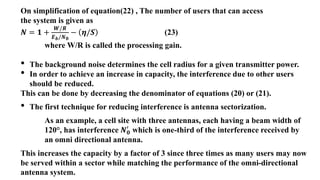
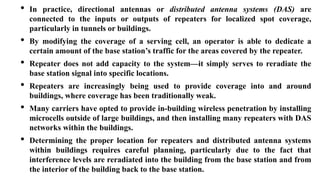
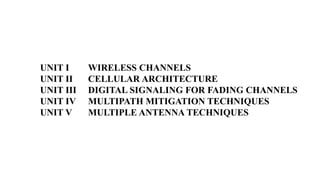
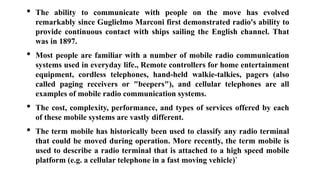
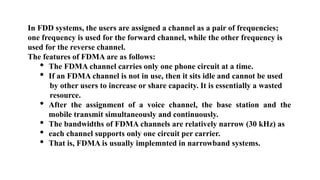
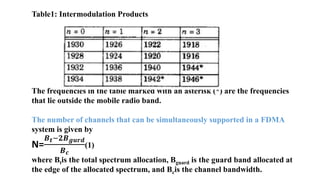
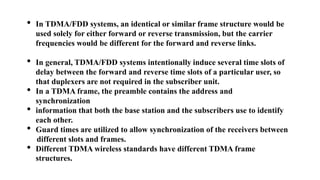
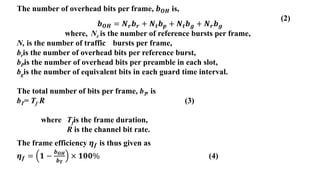
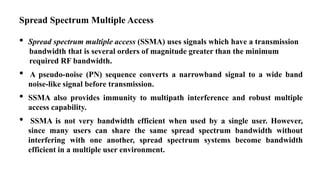
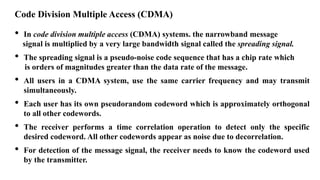
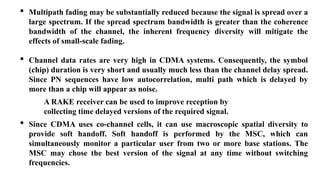
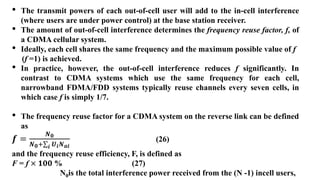
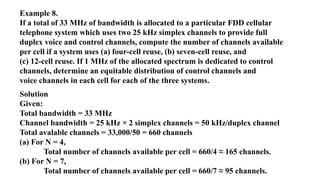
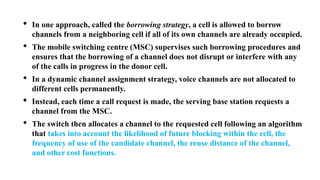
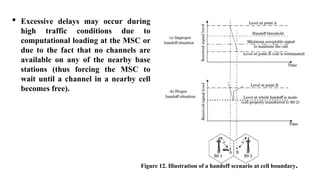
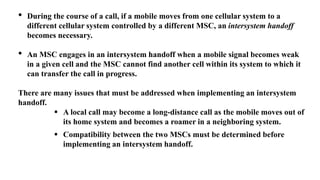
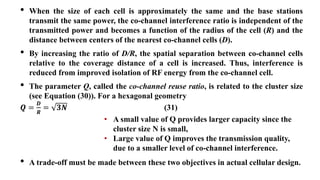
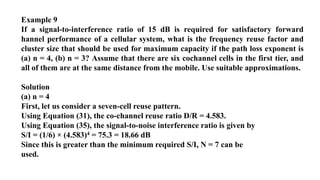
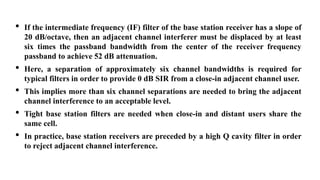
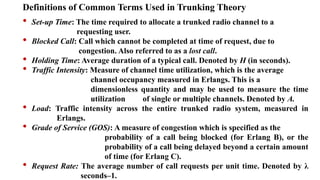
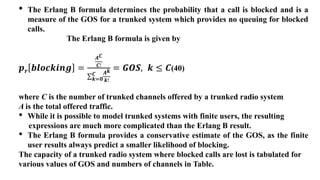
![Example 7
In IS-95 CDMA system, if W = 1.25 MHz, R = 9600 bps, and N=14 users
Calculate
(a) minimum acceptable Eb/ N0
(b) The maximum number of users that can be supported in a single-cell CDMA
system using
(a) omni-directional base station antennas and no voice activity detection
(b) 3-sectors at the base station and activity detection with a = 3/8.
Assume the system is interference limited.
Solution
(a) Using equation (21),
𝑬𝒃
𝑵𝟎
=
𝑾/𝑹
𝑵−𝟏
= (1.25×10⁶/9600 bps)/(14-1) =10 dB
b) Using equation (25) for each sector we can find NS = 1+
𝟏
𝟎.𝟑𝟕𝟓
[
𝟏.𝟐𝟓×𝟏𝟎𝟔/𝟗𝟔𝟎𝟎
𝟏𝟎
]= 35.7
The total number of users is given by 3NS , since three sectors exist within a cell;
therefore N = 3 x 35.7 = 107 users/ cell.](https://image.slidesharecdn.com/wirelesscommunicationunit-2final-230913082738-34fbeb5d/85/WIRELESS-COMMUNICATION-Unit-2-Final-pptx-56-320.jpg)
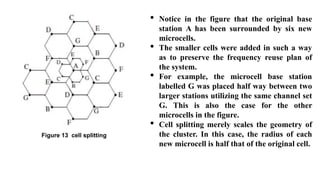
![• For the new cells to be smaller in size, the transmit power of these cells must be
reduced.
• The transmit power of the new cells with radius half that of the original cells can
be found by
examining the received power Prat the new and old cell boundaries and setting them
equal to each other. This is necessary to ensure that the frequency reuse plan for the
new microcells behaves exactly as for the original cells.
For Figure 13.
Pr[ at old cell boundary ] ∝ 𝑷𝒕𝟏𝑹−𝒏 (44)
and
Pr [ at new cell boundary ] ∝ 𝑷𝒕𝟐 𝑹/𝟐 −𝒏 (45)
where Pt1 and Pt2 are the transmit powers of the larger and smaller cell base
stations, respectively,
n is the path loss exponent.
If we take n = 4 and set the received powers equal to each
other, then
𝑷𝒕𝟐 =
𝑷𝒕𝟏
𝟏𝟔
(46)](https://image.slidesharecdn.com/wirelesscommunicationunit-2final-230913082738-34fbeb5d/85/WIRELESS-COMMUNICATION-Unit-2-Final-pptx-105-320.jpg)