


![J U LY / AU G U S T 2 014 | 23A NA L Y T I C S
of those actions. In his call for serious
ethical inquiry, Davis asserts that “Or-
ganizations realize that information has
value that can be extracted and turned
into new products…the ethical impact is
highly context-dependent. But to ignore
that there is an ethical impact is to court
an imbalance between the benefits of in-
novation and the detriment of risk.”
Especially, as Lanier would be quick
to add, “with technology itself enabling
the risk to be pushed off onto many, while
the benefits are captured by an ever
smaller few.”
As Packer reports, Amazon has giv-
en very little thought to the near-term
ethics or the long-term implications of
the way in which it has used its custom-
ers’ data to obtain its current level of
market power. But as Amazon’s current
battle [1] with publisher Hachette rages
on, with publishers, governments and
erstwhile business partners sure to fol-
low, it is clear that this particular story is
far from over.
As analytics professionals, neither is
ours. We have a significant stake in the
outcomes of these conversations about
ethics and the future. As such, we would
be wise to actively participate in those
conversations. At this particular moment,
we have considerable leverage to advo-
cate for a digital future that reflects our
own values.
The world of digital business – our
own personalized Siren Server – has
provided us with a massive, lucrative,
and free channel for our products and
services. Today’s digital enterprise de-
pends so much on our ever-expanding
ability to capture, transmit, store, inte-
grate and organize data, and our deep
capacity to use this data to summarize,
analyze, correlate, predict and optimize.
Through no fault of our own, we have
been bestowed with The Sexiest Job
of the 21st Century [2], and it is indeed
tempting to believe that we are an inte-
gral and indispensable part of the world
in which we live and work, and that we
always will be.
Turns out this is exactly what the pub-
lishers thought when Amazon first ap-
peared on the scene too. Beware: There
is no free lunch.
Vijay Mehrotra (vmehrotra@usfca.edu) is a
professor in the Department of Business Analytics
and Information Systems at the University of San
Francisco’s School of Management. He is also a
longtime member of INFORMS.
REFERENCES
1. For more on this, see http://www.nytimes.
com/2014/06/21/business/booksellers-score-
some-points-in-amazons-standoff-with-hachette.
html and http://www.latimes.com/books/
jacketcopy/la-et-jc-amazon-and-hachette-
explained-20140602-story.html#page=1.
2. http://hbr.org/2012/10/data-scientist-the-
sexiest-job-of-the-21st-century/ar/1](https://image.slidesharecdn.com/informsanalyticsjuy2014-151116051605-lva1-app6892/85/WHY-DO-SO-MANY-ANALYTICS-PROJECTS-STILL-FAIL-23-320.jpg)
![W W W. I N F O R M S . O R G24 | A N A LY T I C S - M AGA Z I N E . O R G
2014 is turning out to be an interesting year for
the healthcare industry. On the healthcare technology
front, this year has spurred 16 acquisitions since Jan.
1. State and federal government health insurance
exchanges finally started to operate at scale, offer-
ing affordable health insurance coverage to millions.
Twenty-six states and Washington, D.C., expanded
their Medicaid program as of May 2014, making a
large number of patients eligible for the safety net.
These are all good things that add to the success
of the Affordable Care Act (ACA), also known as
Obamacare.
At the same time we are just beginning to
see the impact of the new patient inflow on our
health system in the form of emergency room over-
crowding [1]. Opponents of the ACA argue that the
expansion of coverage without expanding the
primary care physician network across the nation
will lead to disaster. It remains to be seen which
way the pendulum will swing.
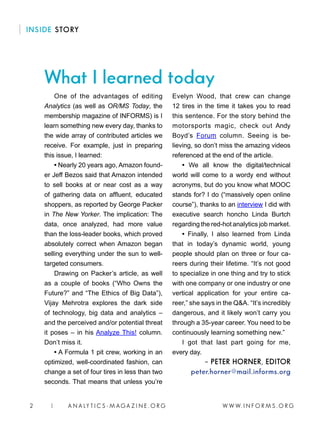
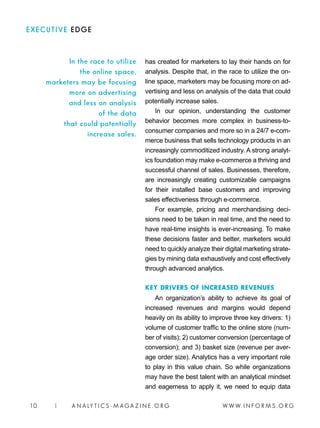
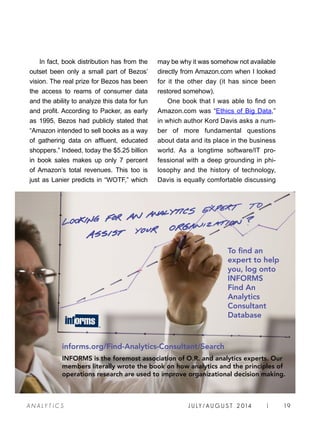
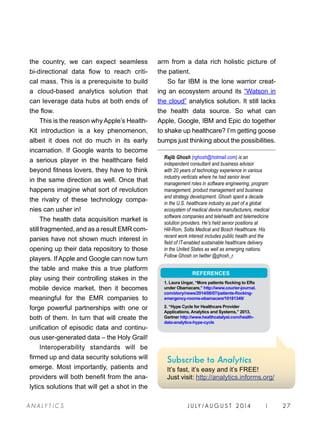
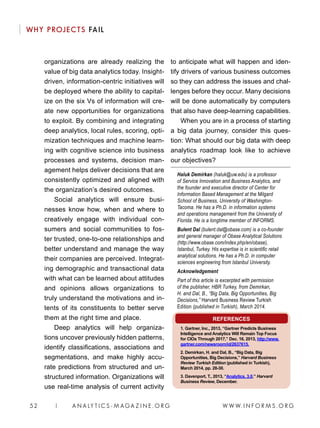
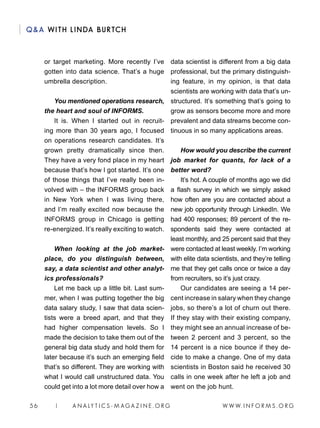
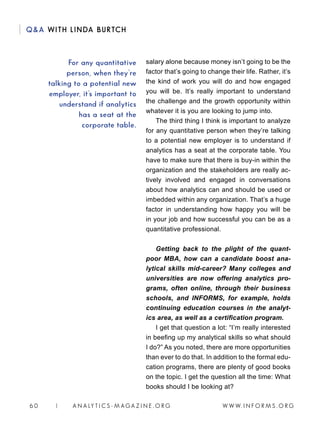
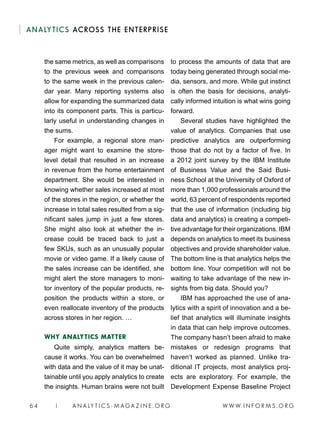
APPLE’S BIG SPLASH WITH HEALTHKIT
Meanwhile, Apple has released its HealthKit prod-
uct that connects multiple devices and apps. It has
shown promise to become the health data repository
BY RAJIB GHOSH
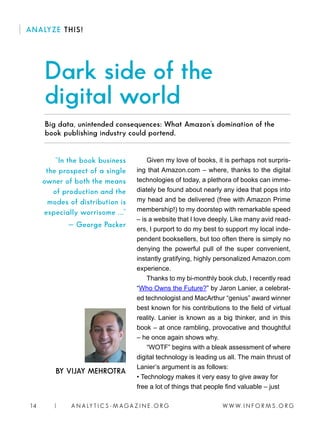
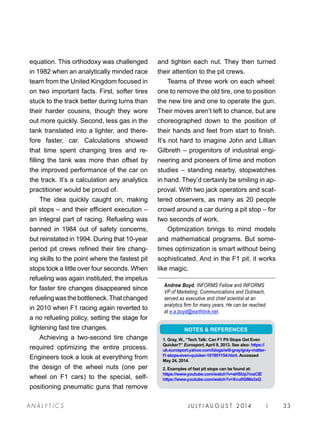
The two giants have
all the technology, talent
and financial firepower
needed to drive analytics
into the consumer health
space by enabling a
platform play for various
data generating devices
and apps.
HEALTHCARE ANALYTICS
Will Apple, Google
usher in new era in
healthcare analytics?](https://image.slidesharecdn.com/informsanalyticsjuy2014-151116051605-lva1-app6892/85/WHY-DO-SO-MANY-ANALYTICS-PROJECTS-STILL-FAIL-24-320.jpg)
![J U LY / AU G U S T 2 014 | 25A NA L Y T I C S
for consumers. In essence this was the promise
of the personal health record, or PHR, a promise
that rose to the peak of inflated expectation a few
years back and then fell to the trough of disillusion-
ment quite quickly [2]. But with Apple’s foray into
the space, this time it could be different.
The key promise, however, is the fusion of
data from multiple sources and use of analytics to
generate user-facing insights. The latter, howev-
er, is not there yet. In my last column I argued that
the true empowerment of the patient consumer
is waiting on the data fusion and analytics to
become mainstream. Consumers do not want
just a data repository like a PHR. They want
actionable information that PHR does not provide.
Apple’s announcement and subsequent ac-
tion may expedite the health data movement in
the right direction, but I am somewhat skeptical
regarding data liquidity in Apple’s “walled garden”
approach. Now that Apple has taken the lead
how far behind can Google be? Recently, Forbes
reported that Google is planning its own version
of a health platform. By the time this column goes
live we will know what Google is concealing up
its sleeves. These two giants have all the tech-
nology, talent and financial firepower needed to
drive analytics into the consumer health space
by enabling a platform play for various data
generating devices and apps.
Insights for the consumer, however, will come
at a price. As the insights with actionable consum-
er guidance increase, so too will the level of FDA
scrutiny, including requirement for mandatory FDA
approval. It is unclear how quickly Apple or Google
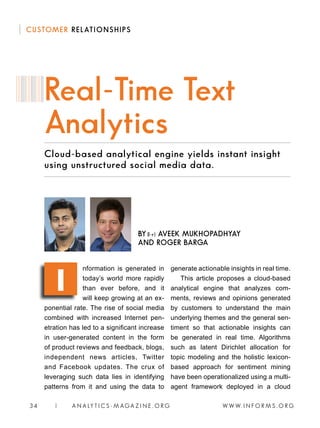
The key promise is
the fusion of data
from multiple sources
and use of analytics
to generate user-facing
insights. The latter,
however, is
not there yet.](https://image.slidesharecdn.com/informsanalyticsjuy2014-151116051605-lva1-app6892/85/WHY-DO-SO-MANY-ANALYTICS-PROJECTS-STILL-FAIL-25-320.jpg)


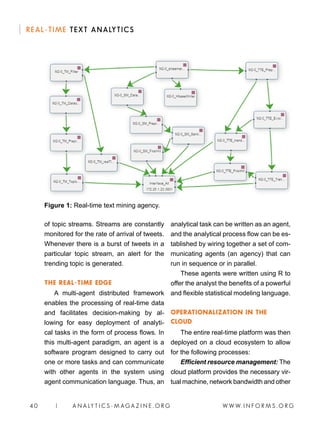
![W W W. I N F O R M S . O R G44 | A N A LY T I C S - M AGA Z I N E . O R G
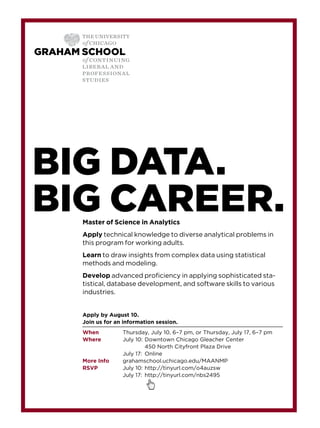
Key considerations for deep analytics on big data,
learning and insights.
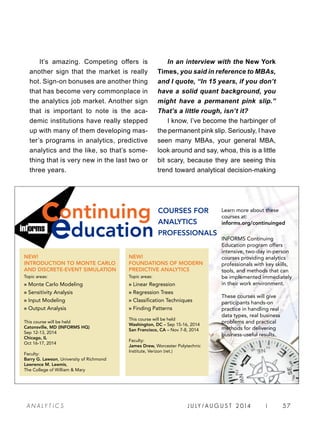
hat is big data? Big data,
which means many things
to many people, is not a
new technological fad. In
addition to providing innovative solu-
tions and operational insights to endur-
ing challenges and opportunities, big
data with deep analytics instigate new
ways to transform processes, organi-
zations, entire industries and even so-
ciety. Pushing the boundaries of deep
data analytics uncovers new insights
and opportunities, and “big” depends on
where you start and how you proceed.
Big data is not just “big.” The expo-
nentially growing volume of data is only
one of many characteristics that are of-
ten associated with big data, such as
variety, velocity, veracity and others (the
six Vs; see box).
According to Gartner Research,
the worldwide market for analytics
will remain the top focus for CIOs
through 2017 [1]. According to Gartner,
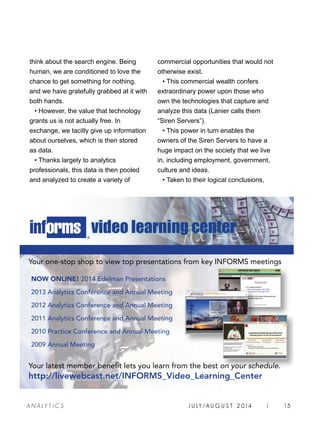
Why do so many
analytics projects fail?
BY (l-r) HALUK DEMIRKAN AND BULENT DAL
W
THE DATA ECONOMY](https://image.slidesharecdn.com/informsanalyticsjuy2014-151116051605-lva1-app6892/85/WHY-DO-SO-MANY-ANALYTICS-PROJECTS-STILL-FAIL-44-320.jpg)
![W W W. I N F O R M S . O R G46 | A N A LY T I C S - M AGA Z I N E . O R G
WHY PROJECTS FAIL
KEY CONSIDERATIONS FOR DEEP
ANALYTICS
We live in an era of big data. Whether
you work in financial services, consumer
goods, travel, transportation, health-
care, education, supply chain, logistics
or industrial products and professional
services, analytics are becoming a com-
petitive necessity for your organization.
But having big data – and even people
who can manipulate it successfully – is
not enough. Companies need managers
who can partner effectively with analysts
to ensure that their work yields better
strategic and tactical decisions.
Big data with deep analytics is a jour-
ney that helps organizations solve key
business issues and opportunities by
converting data into insights to influence
business actions and drive critical busi-
ness outcomes. As organizations try to
take advantage of the big data opportuni-
ty, they need not be overwhelmed by the
various challenges that might await them.
Managers will need to start their
journey by [2]:
Identifying clear business need and
value. Almost everything needs to be a
business rather than a technology solu-
tion. Before companies start collecting big
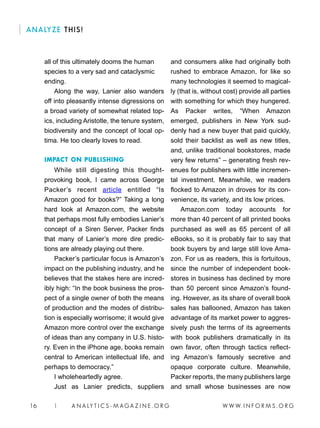
Going Deep Wide on big
data with deep analytics for
deep learning](https://image.slidesharecdn.com/informsanalyticsjuy2014-151116051605-lva1-app6892/85/WHY-DO-SO-MANY-ANALYTICS-PROJECTS-STILL-FAIL-46-320.jpg)

![W W W. I N F O R M S . O R G5 0 | A N A LY T I C S - M AGA Z I N E . O R G
WHY PROJECTS FAIL
Think about what information do I
collect today … and what analytics should
I perform that can benefit me and others.
New security and compliance
procedures to protect extreme-scale
data. In order to succeed with big data,
new processes must be developed that
recognize and protect the special nature
of extreme-scale data that may be large-
ly unexplored.
Be ready to support rapid growth.
Big data solutions can grow fast and ex-
ponentially. They can start as a pilot with
a few terabytes of data, then becomes
a petabyte very quickly. Since the same
data can be used different ways and re-
analyzed for new insights easily, nothing
ever gets deleted.
Funding must move out of IT for
big data success. Funding for these
projects should come from outside of the
CIO organization and move to a market-
ing or sales organization, for instance,
so that the business has a vested stake
in the game.
Create a road map that gradually
builds the skills of your organization.
It’s important to create a road map that
allows you to gradually build the required
skills within your staff, minimize risk and
capitalize on previous successes to gain
more support. In the organization, there
will be new roles and responsibilities such
as the data scientist, who possesses a
blend of skills that includes statistics, ap-
plied mathematics and computer science.
This is different than any current
decision support solution. With big
data, organizations should look for new
capabilities, such as: using advanced
analytics to uncover patterns previously
hidden; visualization and exploration to
help the business find more complete
answers, with new types and greater
volumes of data to best represent the
data to the user and highlight important
patterns to the human eye; enable oper-
ational decision-making with on-demand
stream data by making floor employees
into analytic consumers; and turn insight
into action to drive a decision – either
with a manual step or an automated pro-
cess. And most important be ready for
rapidly increasing benefits and complex-
ities from the six Vs.
WHAT IS NEXT IN THE DATA
ECONOMY?
Organizations have access to a
wealth of information, but they can’t get
value out of it because it is sitting in its
most raw form or in a semi-structured
or unstructured format [3]. As a result,
they don’t even know whether it’s worth
keeping.
So where is deep analytics for
deep learning headed in the next few
years? The exciting news is that many](https://image.slidesharecdn.com/informsanalyticsjuy2014-151116051605-lva1-app6892/85/WHY-DO-SO-MANY-ANALYTICS-PROJECTS-STILL-FAIL-50-320.jpg)

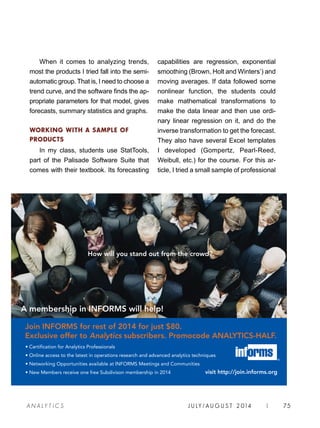
![W W W. I N F O R M S . O R G76 | A N A LY T I C S - M AGA Z I N E . O R G
FORECASTING
products from different categories, spe-
cifically Minitab, IBM SPSS and NCSS
on the “Non-Stop” movie data. IBM SPSS
falls into the automatic forecasting catego-
ry; Minitab and NCSS are semiautomatic
products. A caveat: This is not meant to be
a critical review of any product mentioned.
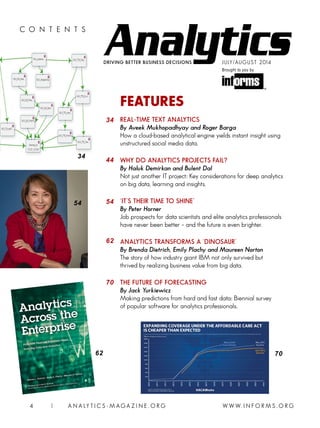
I let IBM SPSS first do the analysis of
the movie data via its automatic mode,
called “Expert Modeler” (i.e., choose the
model and its parameters and get the
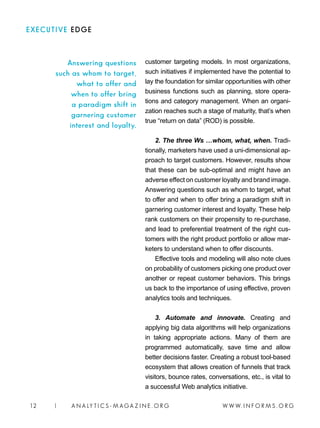
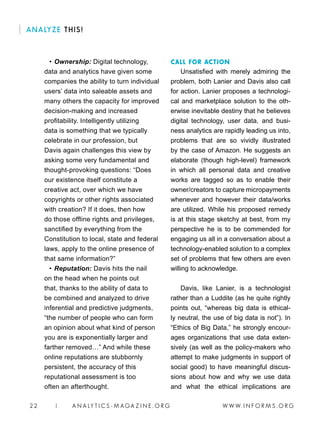
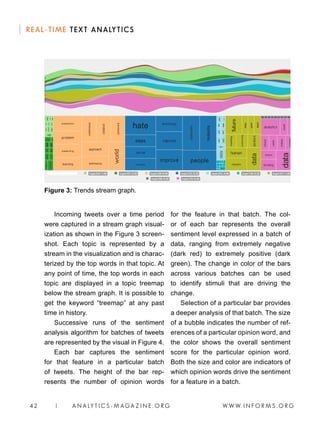
forecasts). Figure 4 shows superimposed
screen shots of IBM SPSS’ worksheet,
showing the “Non-Stop” daily domestic
box-office gross and the menu system
to start the automatic forecasting proce-
dure. The program then gave its recom-
mended model, Brown’s method for data
with linear trend, which uses one smooth-
ing constant to estimate the intercept and
slope of the fitted line (as compared to
Holt’s method, which uses two inde-
pendent smoothing constants) [1]. IBM
SPSS’ accompanying statistics, forecast
plot and additional output are shown in
Figure 5.
Figure 4. IBM SPSS
input worksheet (show-
ing the “Non-Stop”
movie daily box-office
returns).
Figure 5: IBM SPSS’ results of “automatic”
forecasting of the “Non-Stop” data.](https://image.slidesharecdn.com/informsanalyticsjuy2014-151116051605-lva1-app6892/85/WHY-DO-SO-MANY-ANALYTICS-PROJECTS-STILL-FAIL-76-320.jpg)
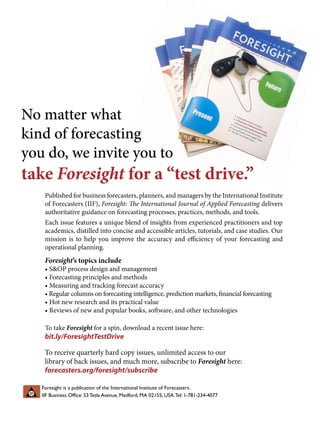
![W W W. I N F O R M S . O R G78 | A N A LY T I C S - M AGA Z I N E . O R G
FORECASTING
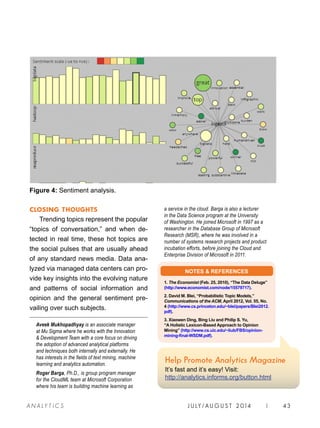
IBM SPSS does
have a curve fitting
feature, so I utilized
it and specified three
possible models to
be examined – the
linear, growth and
logistic curves. Fig-
ures 6 and 7 give
the resulting output
and plots for these
choices.
NCSS has, in
addition to the stan-
dard forecasting
procedures (Box-Jenkins and exponen-
tial smoothing models), an extensive list
of more than 20 nonlinear curve mod-
els under its menu label “Growth and
Other Models.” The user chooses a
model, and NCSS finds the appropriate
parameters for the particular data set.
I chose, for the “Non-Stop” data, the
“Logistic(4)” model [i.e., a logistic curve
with four parameters; there is a Logistic(3)
model available as well], and Figure 8
shows the NCSS’ output.
Minitab is a hybrid of a semi-auto-
matic and manual forecasting product. If
you specify that a Box-Jenkins model be
used, the software finds the appropriate
parameters for the model. However, if you
choose Winters’ method, Minitab requires
Figure 6: IBM SPSS’
fitted models for
three specified
growth curves.
Figure 7: IBM SPSS’ plot of the data and growth curves.](https://image.slidesharecdn.com/informsanalyticsjuy2014-151116051605-lva1-app6892/85/WHY-DO-SO-MANY-ANALYTICS-PROJECTS-STILL-FAIL-78-320.jpg)

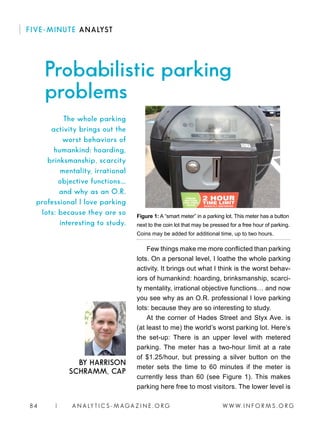
![J U LY / AU G U S T 2 014 | 85A NA L Y T I C S
a standard parking garage, which has a
flat $2 per hour fee which can be vali-
dated by the two “anchor” stores, mak-
ing it essentially free for most patrons
as well. While this is light and explorato-
ry, there is serious work going on with
parking problems [1].
In the sterile world of figures and
mathematics, this sounds like a reason-
able way to run a parking lot, and pa-
trons who miss the upstairs free parking
will simply renege and take the lower
level free parking. In reality, people
“mob” the upstairs portion in search of
“free parking.” My assistant and I had
observed this behavior over a num-
ber of weeks, and we were interested
in learning about the time parked cars
spent in the lot, with an eye for simple
metrics such as expected wait time for a
parking spot or the expected number of
cars “trolling” for a slot. This interest be-
came action (the key for any analysis),
and we chose 6:30 p.m. on a Thursday
evening – a time that we knew the park-
ing lot would be full – to collect data
BENEFITS OF CERTIFICATION
• Advances your career potential by setting you apart from the competition
• Drives personal satisfaction of accomplishing a key career milestone
• Helps improve your overall job performance by stressing continuing
professional development
• Recognizes that you have invested in your analytics career by pursuing
this rigorous credential
• Boosts your salary potential by being viewed as experienced analytics professional
• Shows competence in the principles and practices of analytics
APPLICATIONS
• Prepare to apply by reviewing Candidate
Handbook Study Guide Draft
• Arrange now to secure academic transcript
and confirmation of “soft skills” to send
to INFORMS
COMPUTER-BASED TESTING
It is now more convenient than ever to schedule
your CAP exam in more than 700 Kryterion test
centers in more than 100+ countries. To find the
location closest to you, check this site:
www.kryteriononline.com/host_locations/
QUESTIONS? certification@mail.informs.org
DOMAINS OF ANALYTICS PRACTICE
Domain Description Weight*
Business Problem (Question) Framing
Analytics Problem Framing
Data
Methodology (Approach) Selection
Model Building
Deployment
Life Cycle Management
*Percentage of questions in exam
I
II
III
IV
V
VI
VII
15%
17%
22%
15%
16%
9%
6%
100%
BECOME A CERTIFED ANALYTICS PROFESSIONAL
DON’T BE LEFT BEHIND.
www.informs.org/Build-Your-Career/Analytics-Certification](https://image.slidesharecdn.com/informsanalyticsjuy2014-151116051605-lva1-app6892/85/WHY-DO-SO-MANY-ANALYTICS-PROJECTS-STILL-FAIL-85-320.jpg)
![W W W. I N F O R M S . O R G86 | A N A LY T I C S - M AGA Z I N E . O R G
FIVE-MINUTE ANALYST
from the meters, which is displayed for
anyone who wishes to see.
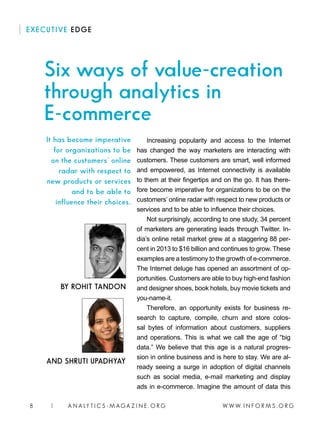
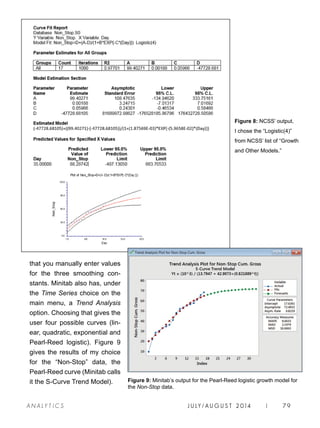
What we found was surprising.
We expected to see uncorrelated
parking lot data. We did not expect to
find many over-time parking spots. I
hoped that the data would be exponen-
tial – which would lead to nice, clean
analysis. What we discovered was, well,
a mess.
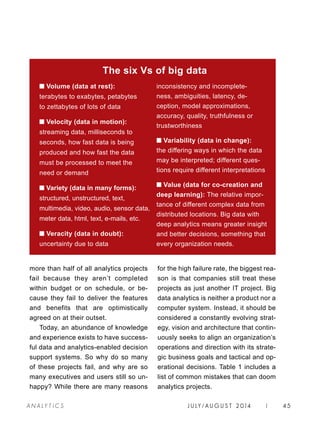
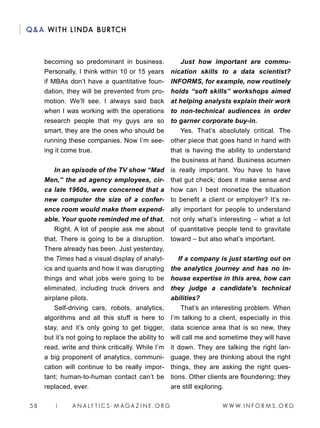
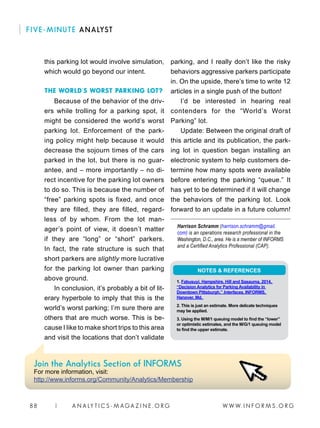
Of the 100 parking spots surveyed,
25 percent were “flashing” or over-time
(violation). Of the parking spots that
were not over-time, six showed times
over one hour, implying that the persons
parked there had in fact put money in the
meter. We are completely discarding the
possibility that someone would park in a
spot that had been previously occupied
but was not vacated, i.e., showing up
with 30 minutes remaining on meter and
not pressing the button/inserting coins. I
had hoped that the sojourn times would
be exponentially distributed, but that is a
case that is pretty difficult to make with
this dataset (see Figure 2).
Now, we don’t actually know how
many patrons have paid, or how many
have simply run over. However, there
are 100 parking spots considered, and
of these, six currently have clocks over
one hour. We can (crudely) estimate [2]
the true number of paid parking spots by
realizing that we are observing the last
hour of what may be a two-hour pro-
cess. Therefore, we think approximately
Figure 2: Histogram of raw parking meter data. Note the tri-modal nature of the data. “Overtime,” i.e.,
flashing parking meters are represented by -1 in the red-shaded oval and constitute the large bar at the
origin of the graph. Known paid parking meters are at the right and have a blue oval.](https://image.slidesharecdn.com/informsanalyticsjuy2014-151116051605-lva1-app6892/85/WHY-DO-SO-MANY-ANALYTICS-PROJECTS-STILL-FAIL-86-320.jpg)
![J U LY / AU G U S T 2 014 | 87A NA L Y T I C S
12 parking spots have been paid for at
any given time.
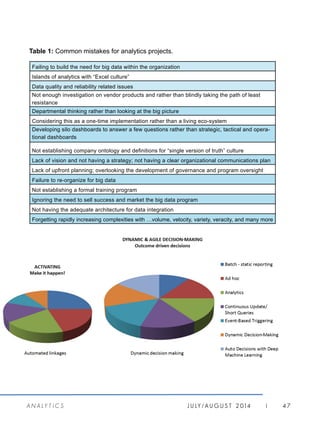
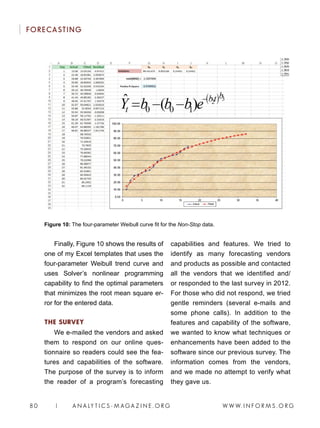
YES, BUT WHAT DOES IT ALL MEAN?
So in one sense, the distributions of
the data are irrelevant; there are 100
parking spots on average, and the aver-
age time that a parking spot is occupied
is some time greater than 27 minutes. If
we make the (not bad!) assumption that
the parking spots that run over are oc-
cupied for 90 minutes, then the average
occupancy is 43 minutes. In a lot with
100 spots, this means that on average,
Figure 3: Histogram of parking time remaining, less than 60 minutes. Approximately six of these data
points are actually spill over from “paying” customers.
one spot comes open every 30 seconds.
This doesn’t sound so bad. If we treat
the system as a queue, and use the
(observed) steady state cars waiting of
three, we can place a rough lower es-
timate [3] that a new car arrives every
30 seconds looking for a parking spot,
and that they have between a 15 per-
cent and 25 percent chance of finding
an open spot. These crude estimates,
however, do not agree very well with
observation, because they neglect the
“blocking” effect of other cars waiting
for spots to open up. A better analysis of](https://image.slidesharecdn.com/informsanalyticsjuy2014-151116051605-lva1-app6892/85/WHY-DO-SO-MANY-ANALYTICS-PROJECTS-STILL-FAIL-87-320.jpg)


The document discusses the significance of analytics in driving business decisions, particularly in e-commerce, where understanding customer behavior is crucial for success. It highlights key drivers of revenue growth, such as increasing customer traffic, conversion rates, and basket sizes, emphasizing the need for advanced analytics tools. Additionally, it reflects on the evolution of analytics practices and the changing dynamics of the digital marketing landscape.


