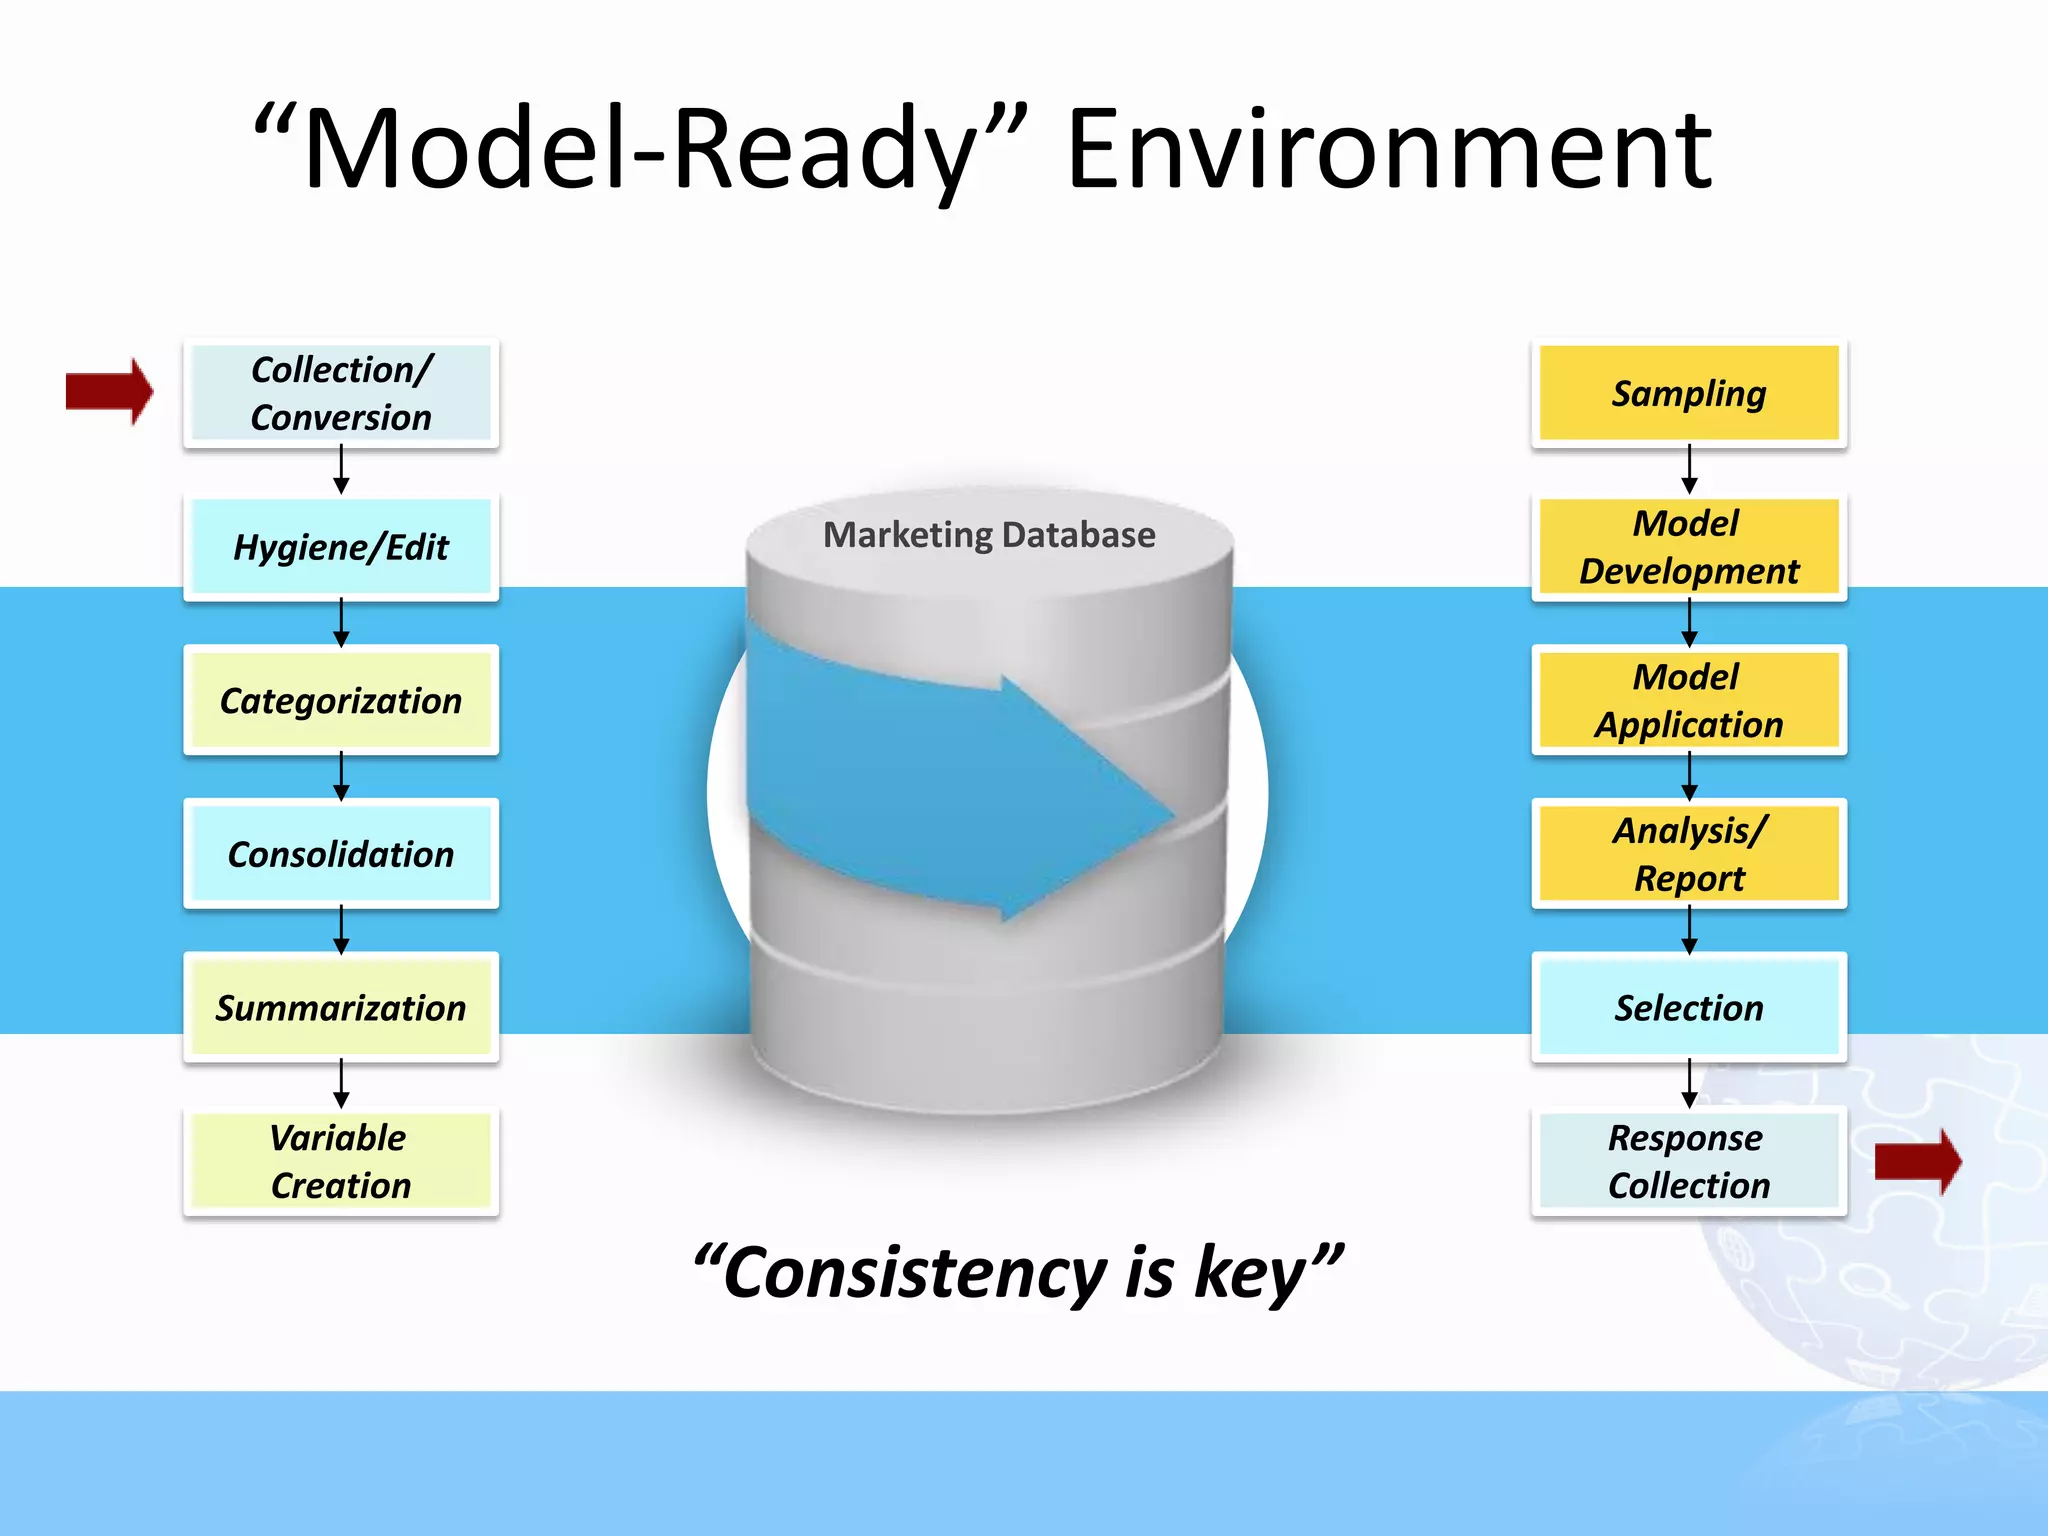
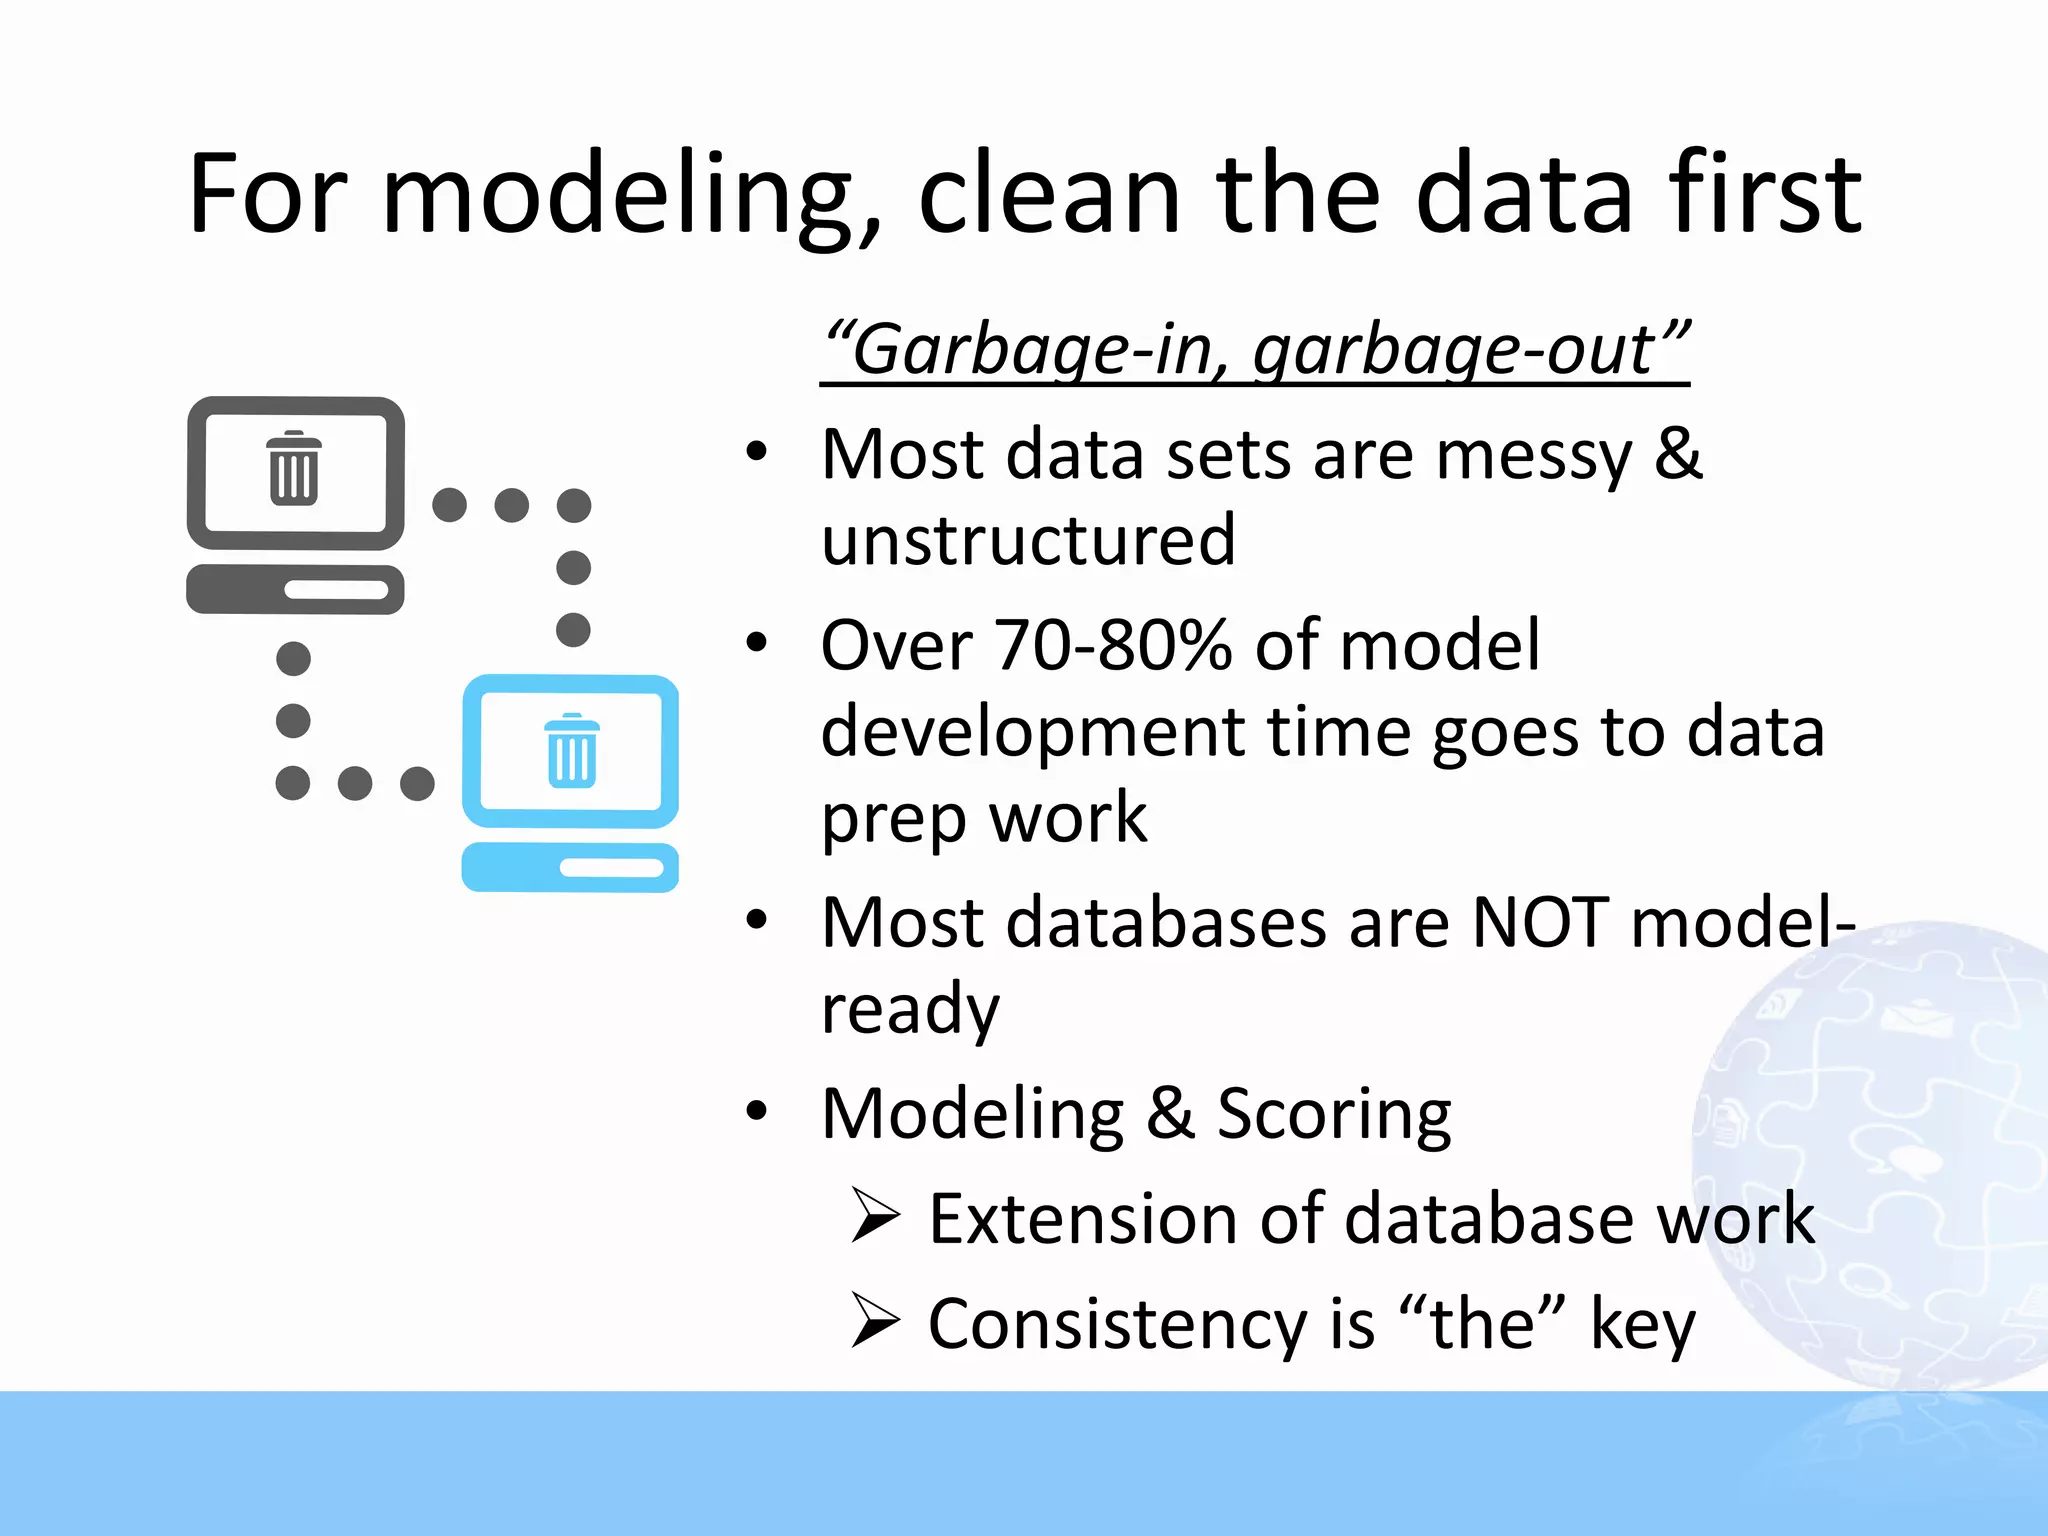
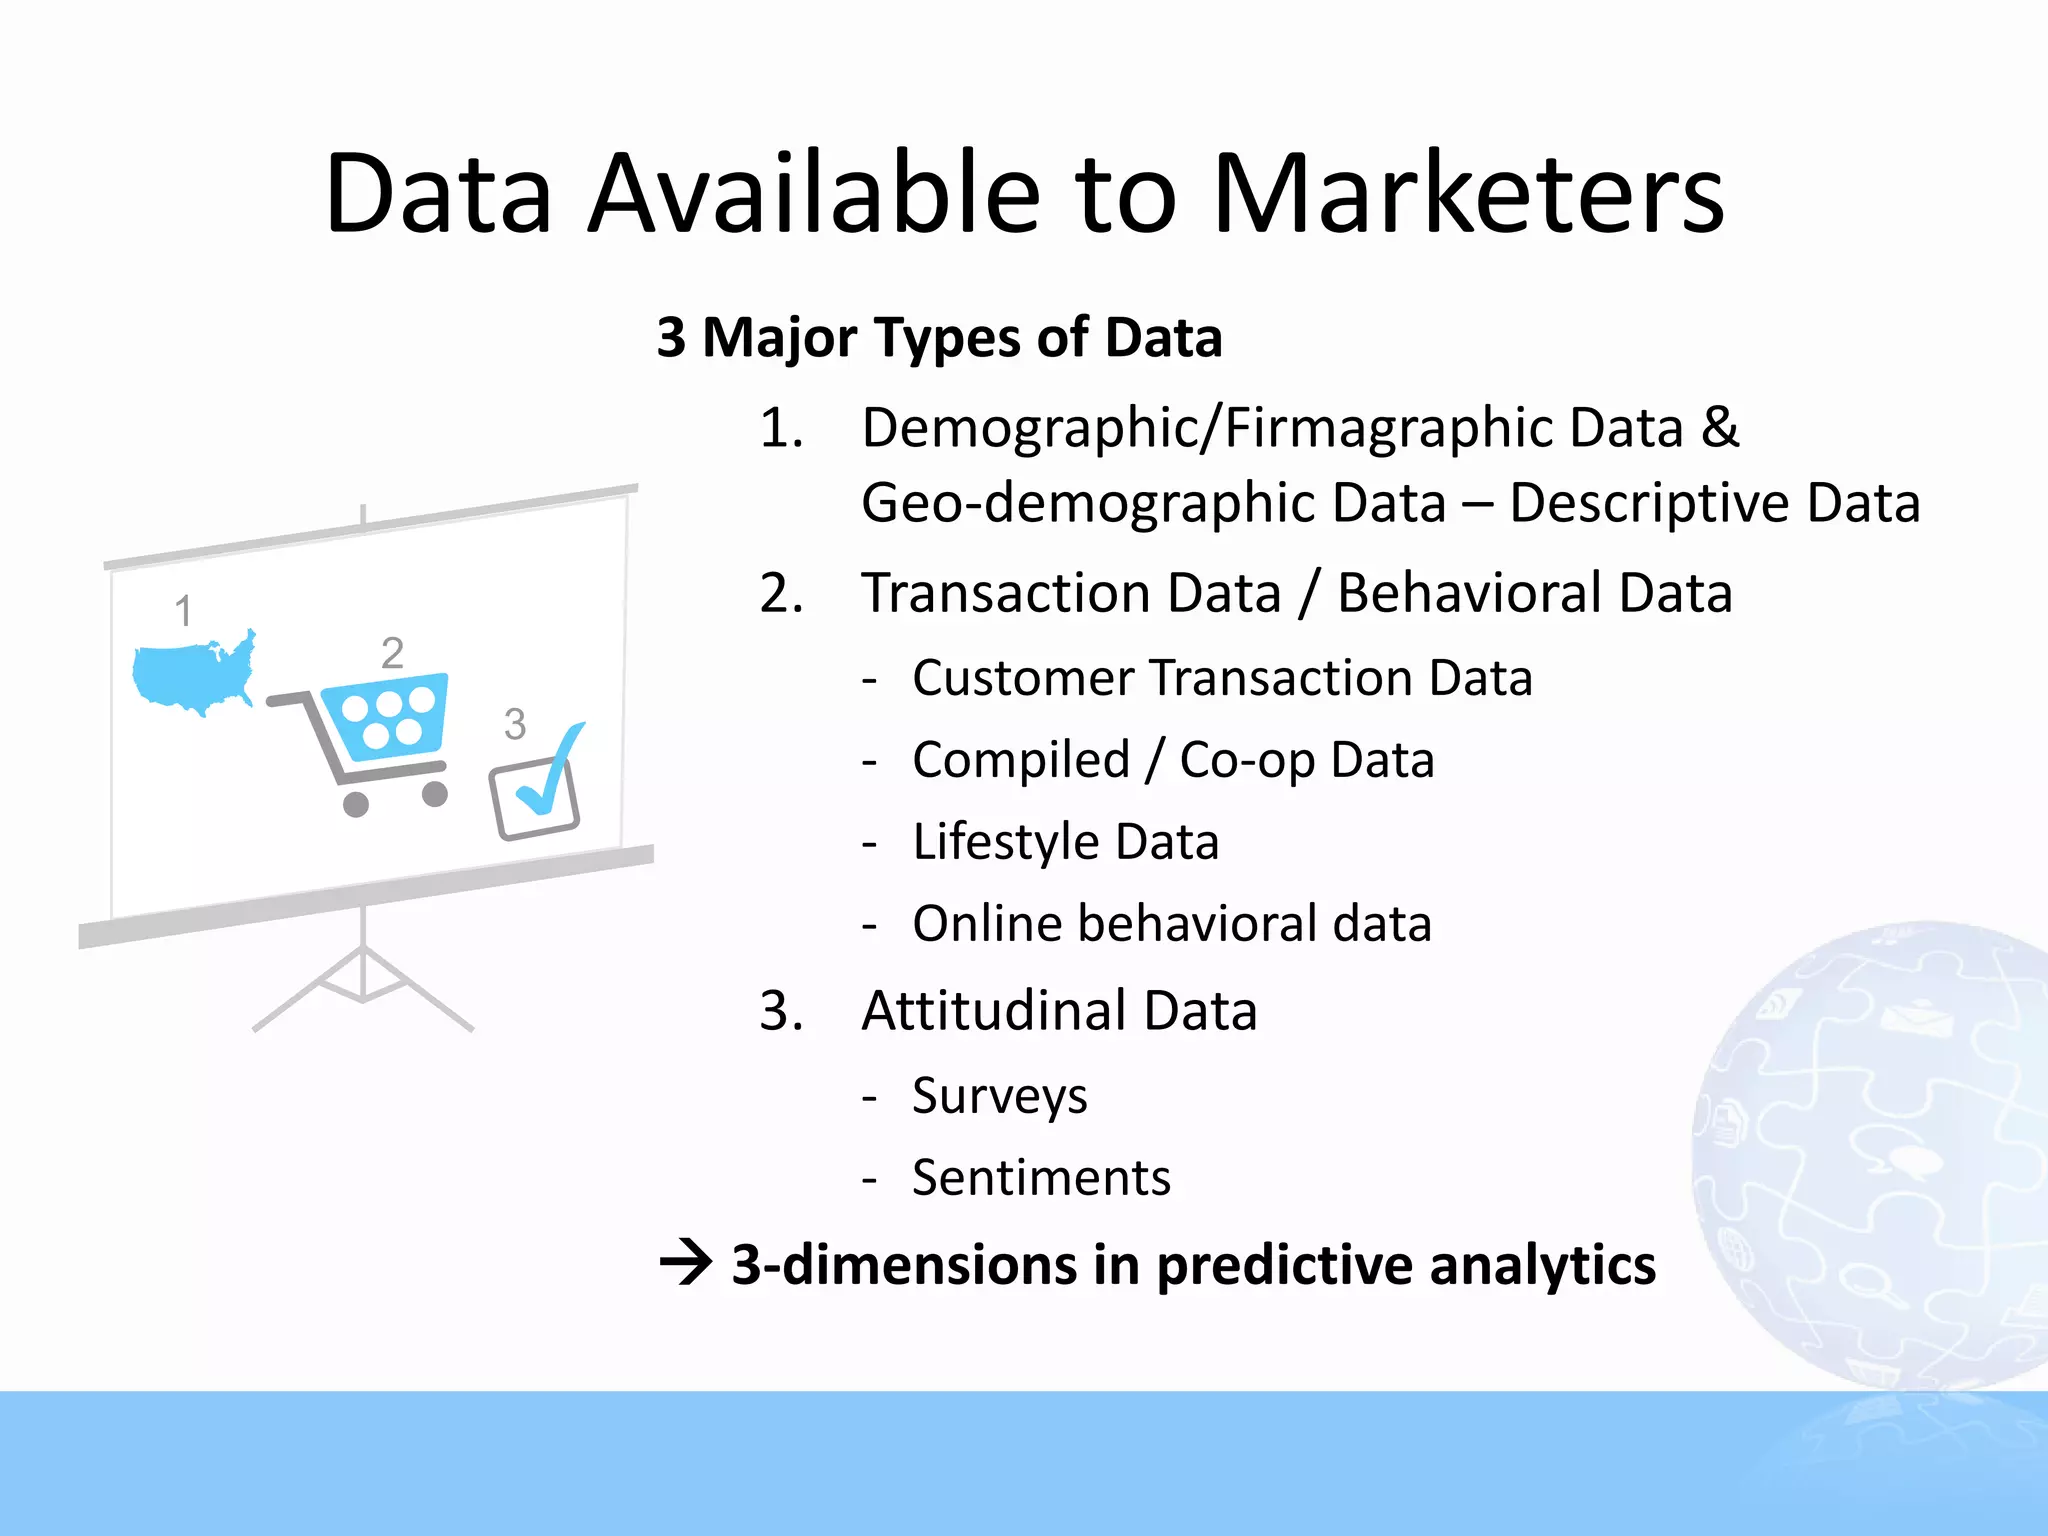
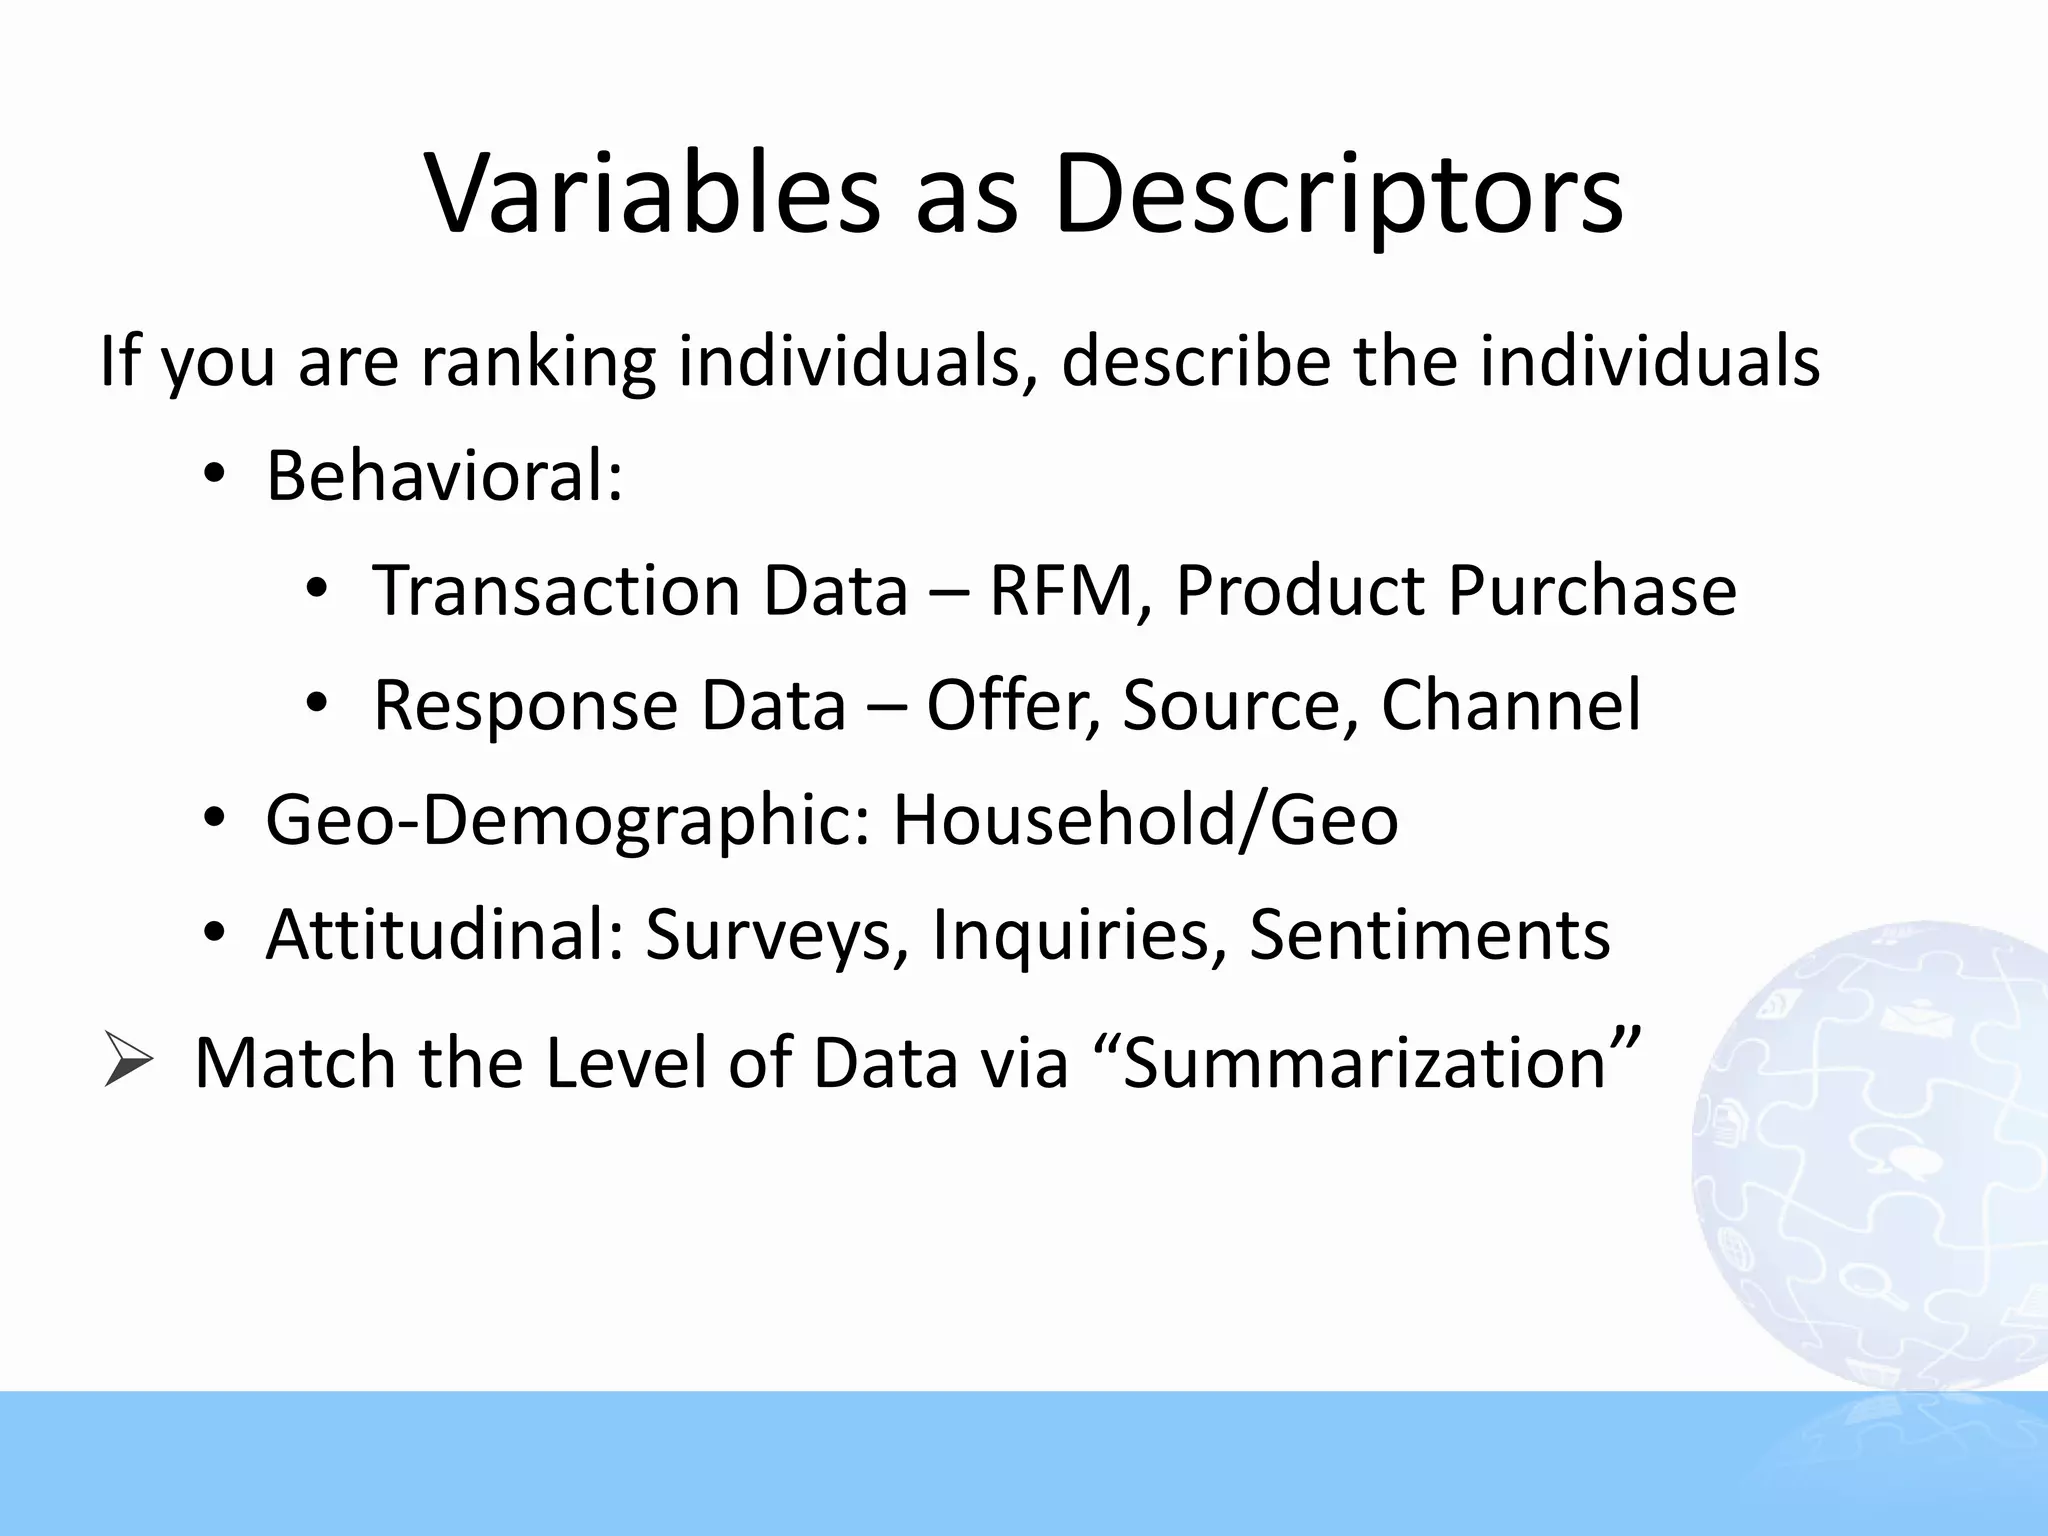
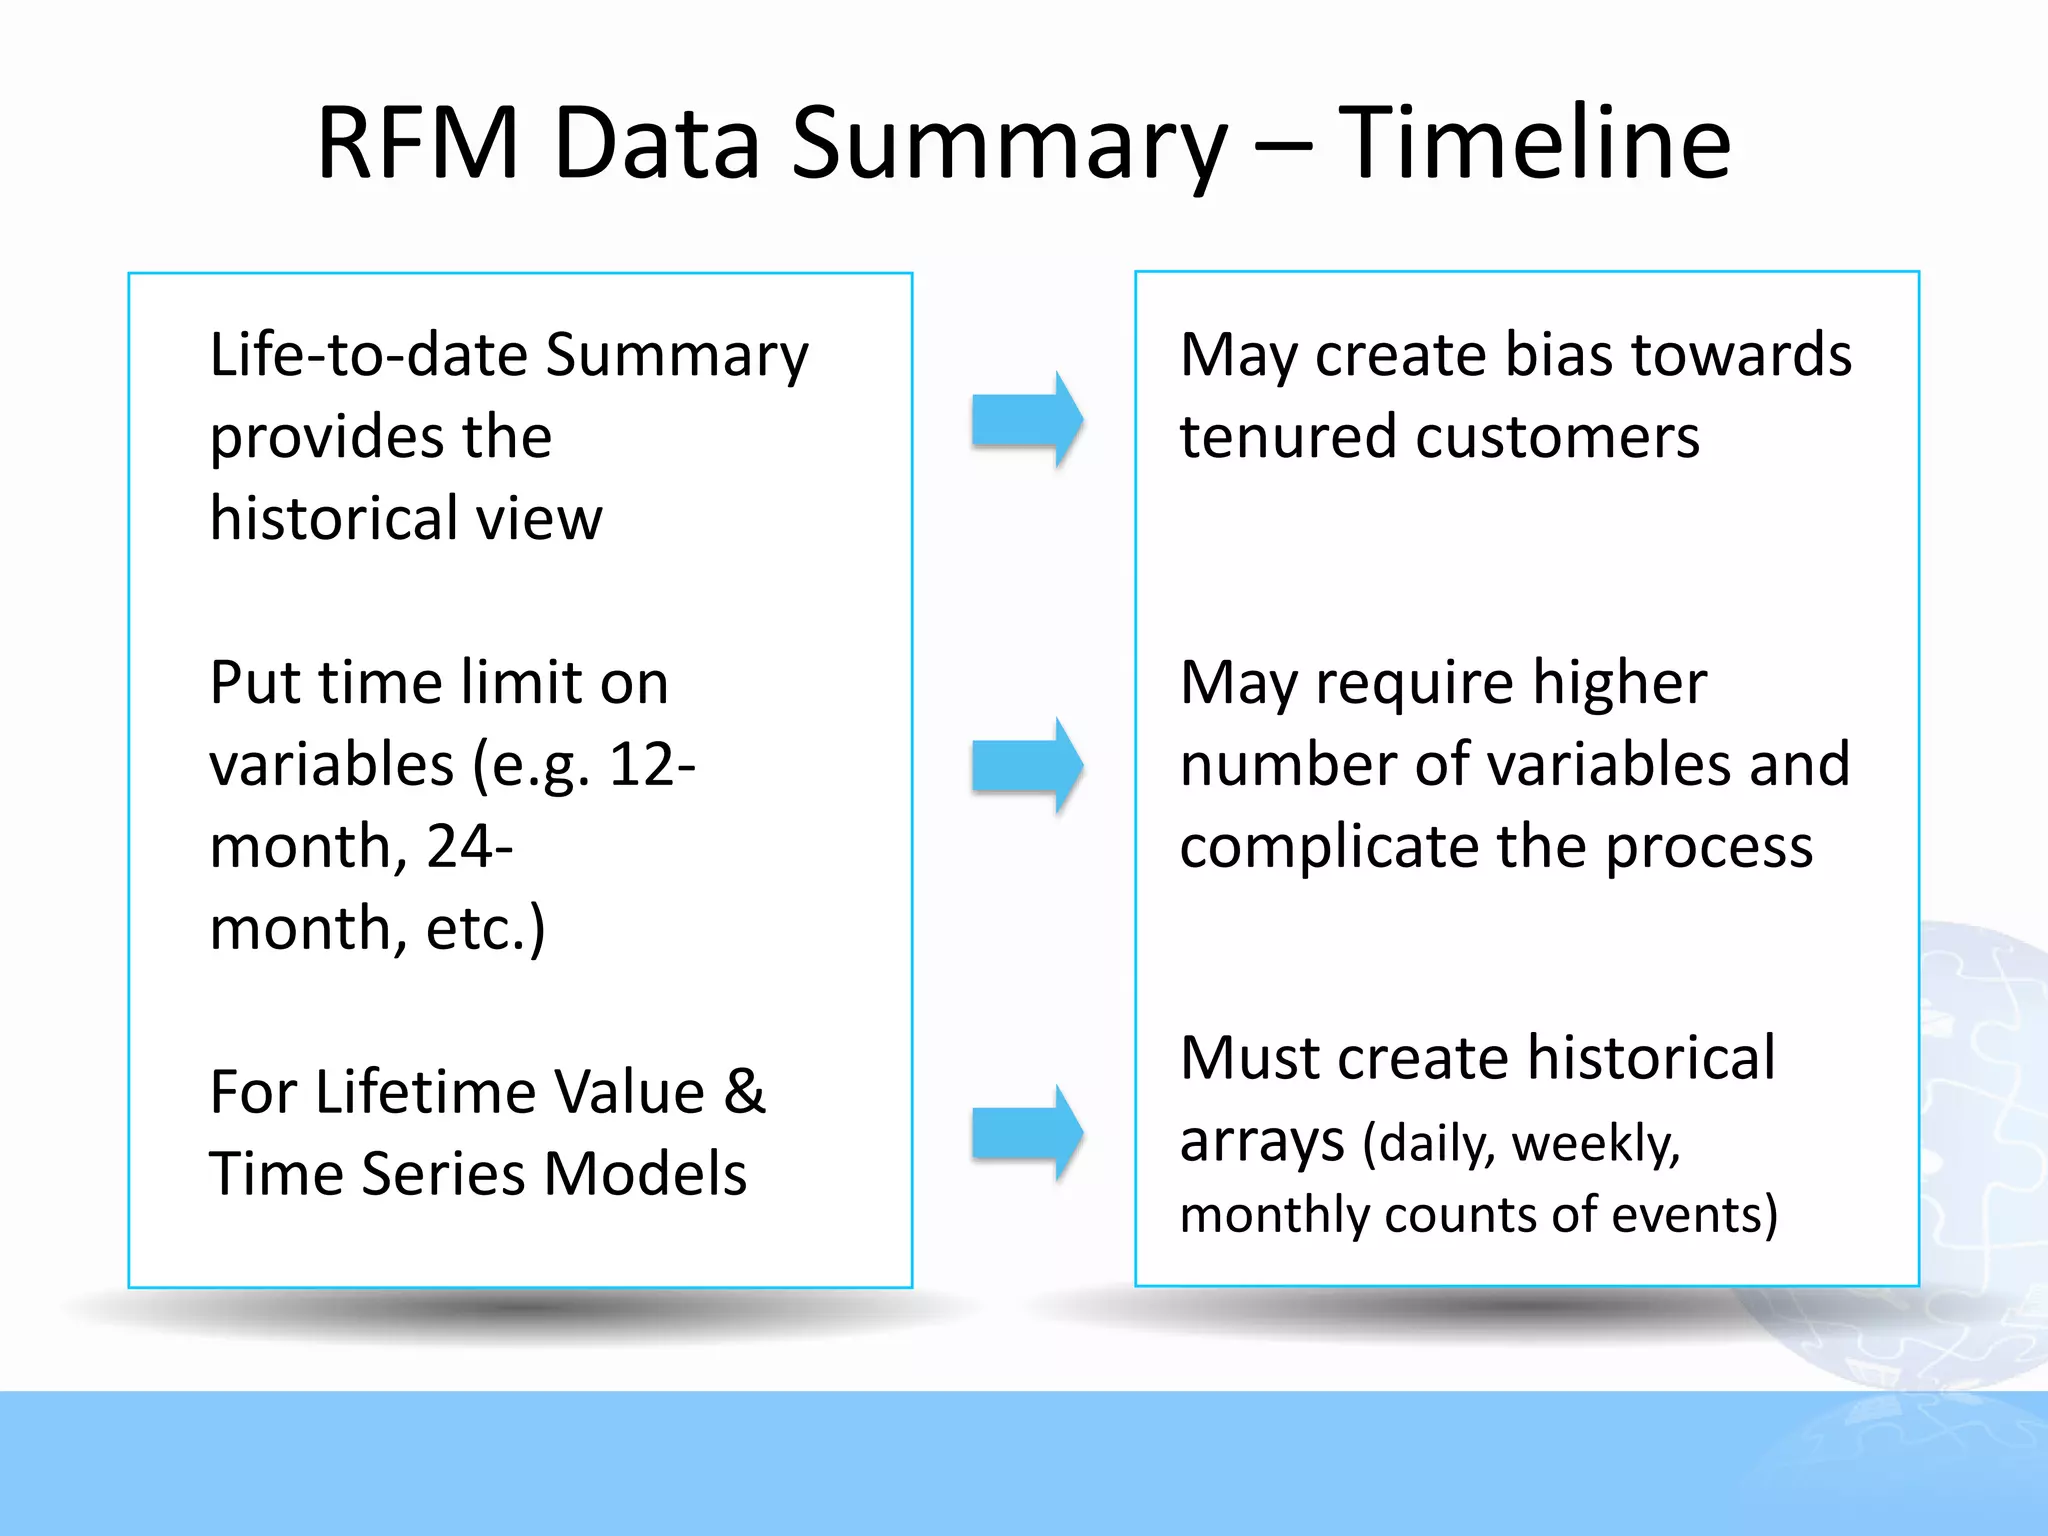
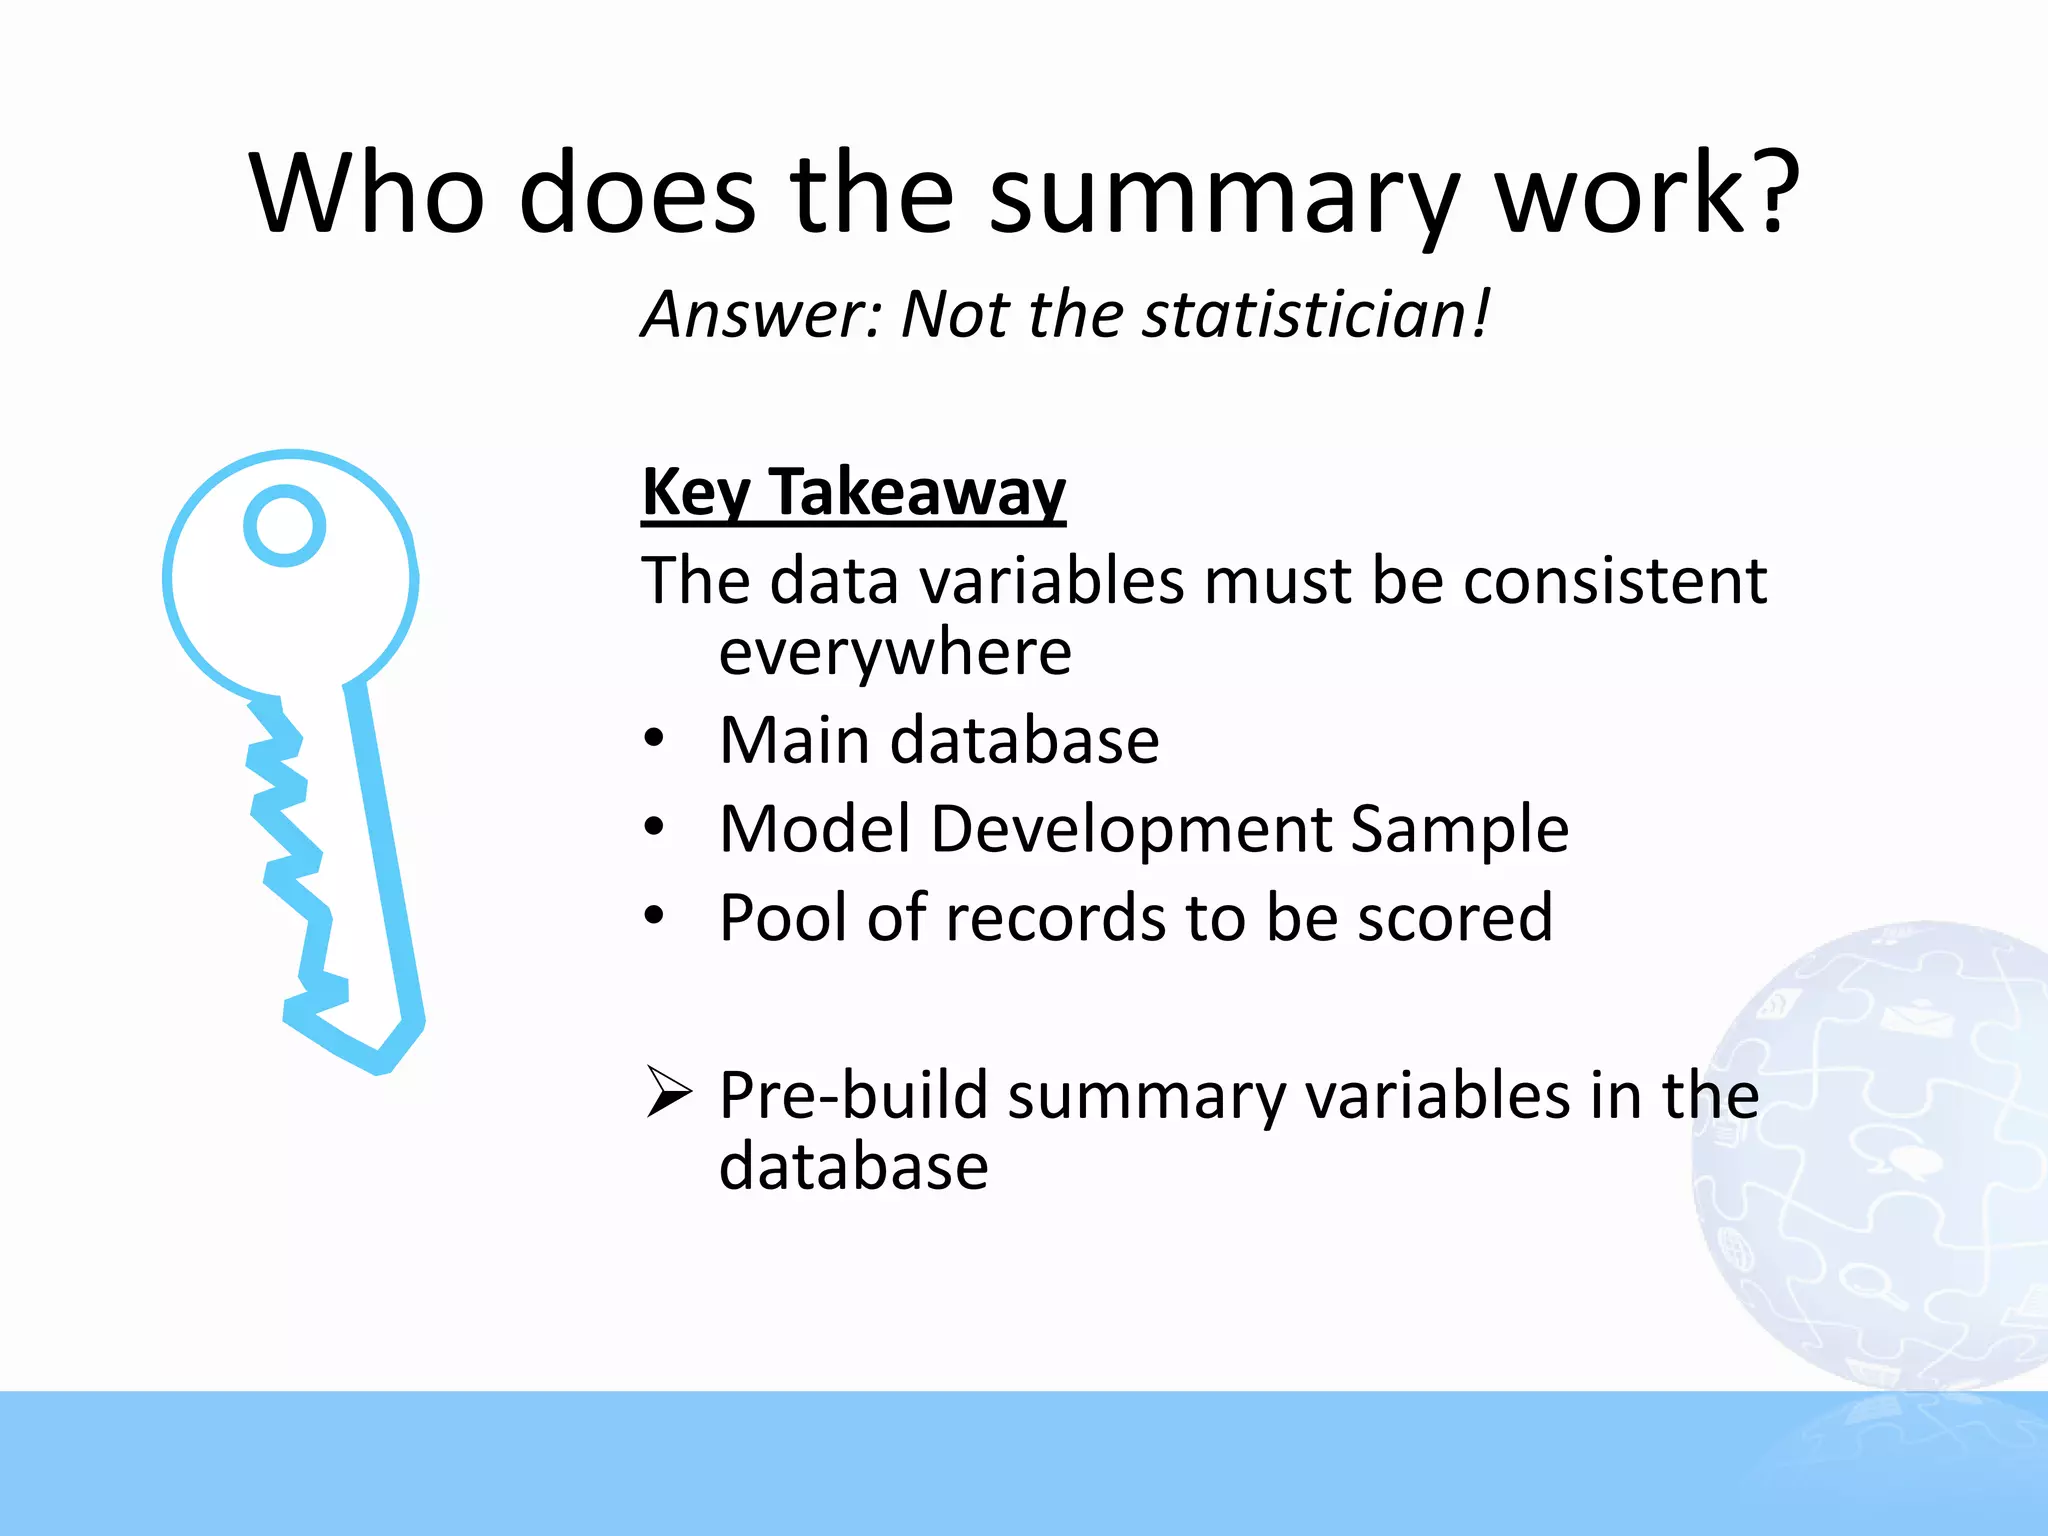
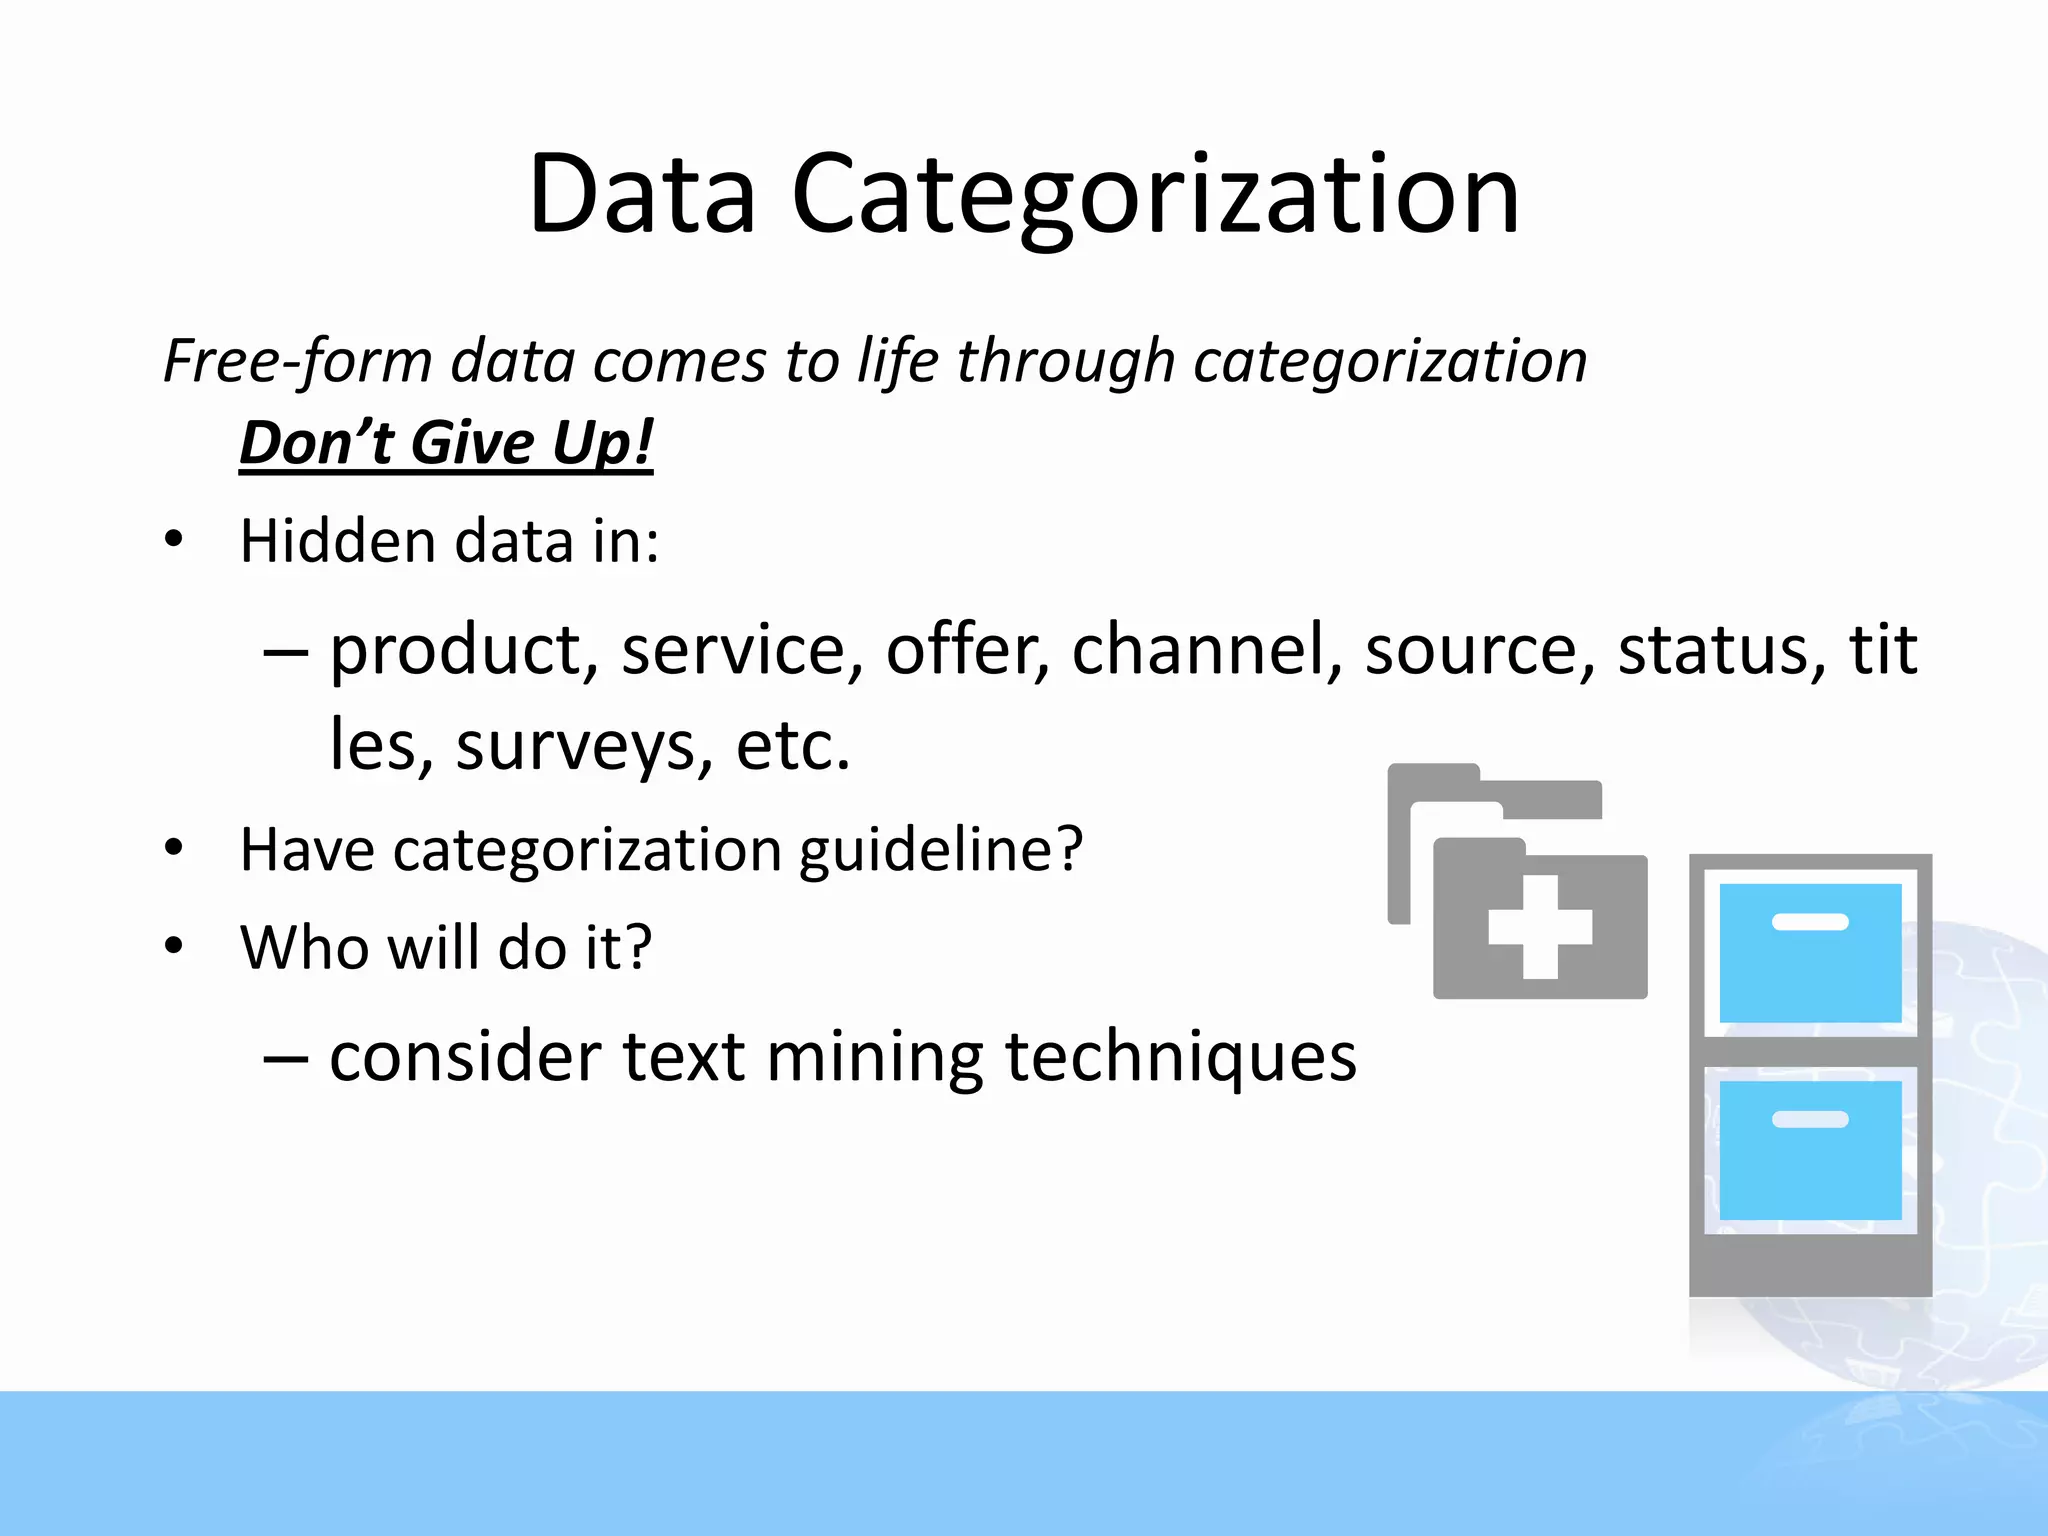
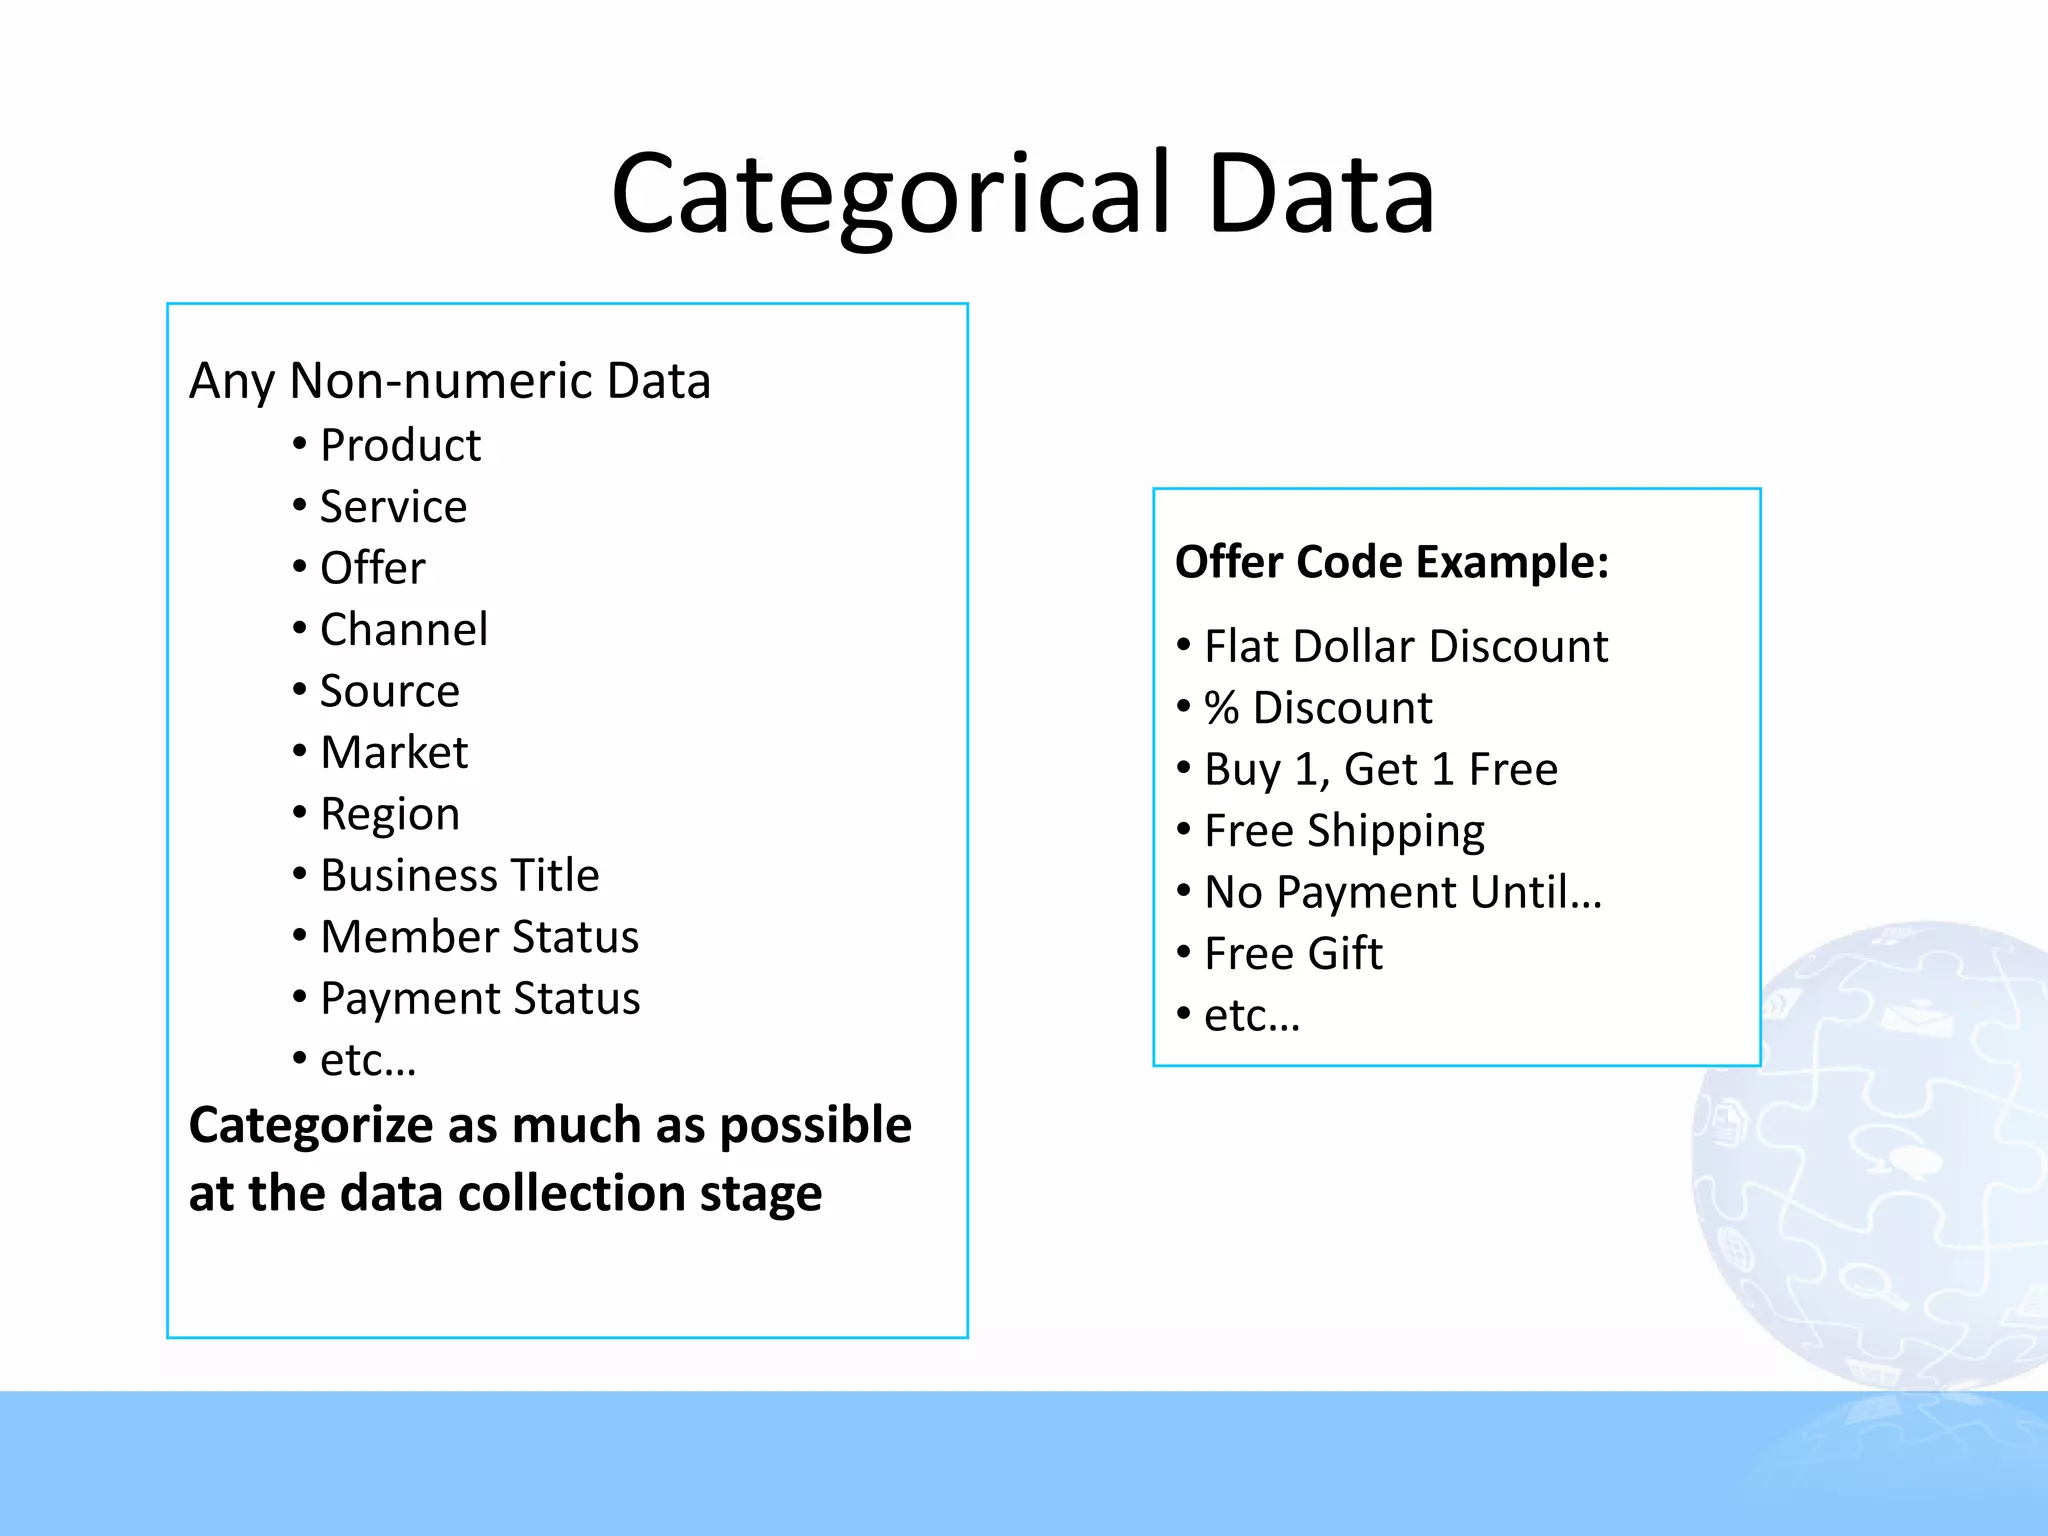
Model-Ready Marketing
      Database
Model-Ready Marketing Database
          Designing Databases for
          Advanced Analytics
What we will cover
• Marketing Database Philosophy
• Data Ingredients for Modeling
• Data Summarization
• Types of Variables
• Variable Design
• Scoring, QC and Storage
Data by the numbers
  • Database marketers must excel in:
         1.   Collection: size and speed matters
         2.   Refinement: get to the answers, not
              just ingredients
         3.   Delivery: for consumption by end-users
  • Marketing databases must provide “marketing
    answers” via advanced analytics, not just bits
    and pieces of data
  • Insight does not come from data, it is derived
    from data
Database marketing landscape
        • No guessing game – You MUST know your
          target
        • Vast amount of online & offline data collected
           But are they being used properly?
        • Analytics play a huge roles in prospecting &
          CRM
        • Short paced marketing cycle getting shorter
        • Huge difference between advanced marketers
          and those who are falling behind

        Winners are the ones who know how to wield
          the power of all available data faster.
Different types of analytics
“Analytics” means different things…
• BI (Business Intelligence) Reporting: Display of success metrics, dashboard
  reporting
• Descriptive Analytics: Profiling, segmentation, clustering
• Predictive Modeling: Response models, cloning Models, lifetime
  value, revenue models, etc.
• Optimization: Channel optimization, marketing spending
  analysis, econometrics models

Predictive Modeling for 1-to-1 Marketing
Why model?
• Increase Targeting Accuracy
• Reduce costs by contacting less/smart
• Stay relevant
• Consistent results
• Reveal hidden patterns in data
• Repeatable – key for automation
• Expandable
• “Supposedly” save time and effort
Why NOT model?

    • Universe is too small
    • Predictable data not available
    • 1-to-1 marketing channels
      not in plan
    • Tight budget
    • Lack of resources
Any pain implementing models?
         • Not easy to find “Best” customers
         • Modelers are fixing data all the time
         • Rely on a few popular variables
         • Always need more variables
         • Takes too long to build models and
           score
         • Inconsistencies shown when scored
         • Disappointing results
What does your database support?
           If you have a marketing database…
           • Order Fulfillment
           • Contact Management
           • Standard Reports
           • Ad hoc Reports and Queries
           • Name Selections
           • Response Analysis
           • But does it support modeling
              and scoring?
“Model-Ready” Environment
 Collection/
                                           Sampling
 Conversion

                     Marketing Database     Model
Hygiene/Edit
                                          Development

                                            Model
Categorization
                                          Application

                                           Analysis/
Consolidation
                                            Report


Summarization                              Selection


  Variable                                 Response
  Creation                                 Collection

                 “Consistency is key”
For modeling, clean the data first
               “Garbage-in, garbage-out”
           •   Most data sets are messy &
               unstructured
           •   Over 70-80% of model
               development time goes to data
               prep work
           •   Most databases are NOT model-
               ready
           •   Modeling & Scoring
                 Extension of database work
                 Consistency is “the” key
Why Front-end DP Important?
• Inexperienced analysts spend majority of time doing
  DP work
   – Modeling work at the last minute!
• Creative variables enhance
  models
• Inconsistent data creates a
  chain reaction to melt-
  downs
• Data append/match
  becomes ineffective
Define Analytical Goals
   • Rank & select prospect names
   • Cross-sell/Up-sell
   • Segment the universe for messaging
     strategy
   • Pinpoint attrition point
   • Assign lifetime values
   • Optimize media/channel spending
   • Create product packages
   • Project customer value
   • Detect fraud
Data Inventory
• “Modeling is making the best of what we know”
• Beyond obvious RFM data
• Get Deeper
   – Product/Service Level Data
   – Historical Data
   – Channel Data – Inbound & Outbound
   – Online activities, sentiments, unstructured data
• External Data
Data Available to Marketers
      3 Major Types of Data
         1. Demographic/Firmagraphic Data &
             Geo-demographic Data – Descriptive Data
         2. Transaction Data / Behavioral Data
             -   Customer Transaction Data
             -   Compiled / Co-op Data
             -   Lifestyle Data
             -   Online behavioral data
         3. Attitudinal Data
             - Surveys
             - Sentiments
       3-dimensions in predictive analytics
Create Data Menu
• Base it on Companywide Need-Analysis
• Ask the Analysts first
• What type of models are in the plan?
   –   Affinity/Look-alike Models
   –   Promotion/Response Models
   –   Time-series Models
   –   Attrition Models
• Consider non-analytical departments
• Maintain the ones that fit the objective
Data Menu (continued)
• Check the ingredients
   – What do you have today?
   – What can be bought?
   – What can be created?
• Cost – Can you afford to maintain it?
   – Storage/Platform – Consider the scoring
     part, too
   – Programming/Processing Time
   – Software
   – Update
   – External Data
Check Your Data Inventory
    Let’s start with what you have
    • Name & Address: Key to Geo/Demographic Data
    • Order Transaction Data: “RFM”, Payment
        Methods
    • Item/SKU Level Data: Products, Price, Units
    • Mailing/Response History: Source, Channel,
        Offer
    •   Life-to-Date/Past “X” Month Summary Data
    •   Customer Level Status Flags
    •   Surveys/Product Registration Forms
    •   Customer Communication History Data
    •   Social Media, click-through, page views

         Need Conversion, Categorization, &
           Summarization
Predictive Modeling is all about “Ranking”
• Ultimately, Models must properly “Rank”
                                                #1
   – Households
                                                   #2
   – Individuals
   – Products
• Determine the level of data accordingly
   – Relational databases won’t cut it
   – Must create “Descriptors” that fit the level that
     needs to be ranked
Variables as Descriptors
If you are ranking individuals, describe the individuals
    • Behavioral:
       • Transaction Data – RFM, Product Purchase
       • Response Data – Offer, Source, Channel
    • Geo-Demographic: Household/Geo
    • Attitudinal: Surveys, Inquiries, Sentiments
 Match the Level of Data via “Summarization”
Maximize the Power of Transaction Data
               • RFM Data must be Summarized
                 (or De-normalized)
               • Turn RFM data into individual /
                 household level “Descriptors”
               • Combine with essential
                 categorical variables
                 (e.g., product, offer, channel, et
                 c.)
Data Summarization – Matching the Level of Data
          Order Table
Cust ID   Order #   Order Date   $ Amount

000123    100011    2009-05-06   $199.99
                                                     Order Summary Table
000123    100128    2010-08-30    $50.49                  #                 First Order    Last Order
                                            Cust ID              $ Total
000123    103082    2011-12-21   $128.60               Orders                  Date           Date

003859    100036    2010-06-06    $43.99    000123      3       $379.08    2009-05-06     2011-12-21

003859    101658    2011-01-20    $43.99    003859      4       $251.42    2010-06-06     2012-02-18
003859    102189    2011-04-15   $119.45    004593      1       $354.72    2012-07-30     2012-07-30
003859    106458    2012-02-18    $43.99
                                            016899      1       $199.99    2011-07-14     2011-07-14
004593    104535    2012-07-30   $354.72
                                            019872      3       $688.58    2010-09-07     2012-03-12
016899    107296    2011-07-14   $199.99
019872    102982    2010-09-07   $128.60
019872    103826    2011-04-30   $499.99
019872    109056    2012-03-12    $59.99
Sample Variables after Summarization
 Before     After Summarization
            • Weeks since last online purchase
            • Years since member sign up
Recency
            • Days since last delinquent date
            • Months since last response date
            • Orders by offer type
            • Orders by product/service type
Frequency
            • Payments by pay method
            • Average days between transactions
            • Total $ past 24 months
            • Life-to-date spending
Monetary
            • Average dollars by channel
            • Average dollars by product type
RFM Data Summary – Timeline
Life-to-date Summary   May create bias towards
provides the           tenured customers
historical view

Put time limit on      May require higher
variables (e.g. 12-    number of variables and
month, 24-             complicate the process
month, etc.)

For Lifetime Value &   Must create historical
                       arrays (daily, weekly,
Time Series Models
                       monthly counts of events)
Who does the summary work?
      Answer: Not the statistician!

      Key Takeaway
      The data variables must be consistent
        everywhere
      • Main database
      • Model Development Sample
      • Pool of records to be scored

       Pre-build summary variables in the
        database
Data Categorization
Free-form data comes to life through categorization
   Don’t Give Up!
• Hidden data in:
   – product, service, offer, channel, source, status, tit
     les, surveys, etc.
• Have categorization guideline?
• Who will do it?
   – consider text mining techniques
Categorical Data
Any Non-numeric Data
    • Product
    • Service
    • Offer                      Offer Code Example:
    • Channel                    • Flat Dollar Discount
    • Source                     • % Discount
    • Market                     • Buy 1, Get 1 Free
    • Region                     • Free Shipping
    • Business Title             • No Payment Until…
    • Member Status              • Free Gift
    • Payment Status             • etc…
    • etc…
Categorize as much as possible
at the data collection stage
Categorization Guidelines
      • Be consistent throughout
        –   Survey Form
        –   Data Entry
        –   Inventory Database
        –   Data Collection & Compilation
        –   Summarization
        –   Modeling, and Scoring

      • Create “Code” structure
          NEVER allow free-form answers
Categorization Guidelines (Continued)
• Create Rules and DON’T
                                Training & Automation
  Deviate from them

• More specific the better      Combine them later

• But, don’t allow too many     Break into multiple
  variations (over 20) in one   codes if necessary
  code

• Don’t forget the end goal     Must be “relevant”
Data Hygiene & Data Append
• Data conversion
   – Create consistency
   – Standardization
   – Edit
   – Purge
• Cover all bases – PII & RFM Data
• Create rules and be consistent
PII – Gateway to External Data
         What is hidden behind simple name
           & address?
         • Standardize Name & Address first
            – Maintain PII (Personally Identifiable
              Information)
            – Hygiene via periodic NCOA and
              standardization
         • First & Last Name – Ethnic, Gender
         • Name, Address, Email –
           Demographic Data
         • Address – Geo-demographic,
           Census Data
         • Zip – County, Market Region, DMA
External Data
 Always consider buying data before
  collecting and building

   • Compiled Demographic /
     Firmagraphic Data
   • Behavioral / Transaction / Co-op
     Data
   • Attitudinal / Survey / Lifestyle Data
   • Census / Geo-Demographic Data
External Data Check List
• Test multiple data sources
   – Friendly variable definitions for analysts
   – Coverage/Match Rate
   – Price
   – Who will do the match & append?
• Learn about the data sources
   – What’s real and what’s imputed?
   – Don’t stop at Demographic: always add
     “Behavioral” data
Missing Values
Missing values are inevitable…
• For Numeric Data
   (e.g., $, Counters, Dates, etc.)
    – Incalculable vs. Data-append Non-matches
    – Missing is missing: DO NOT fill in with 0’s

• For Categorical Data (e.g., Codes, Text, etc.)
    – Leave room for “N/A”
       (e.g., blank, “N/A”, “0”, “.”, etc.)
    – Code “Non-matches” to external files
      differently

“Missing Data can be meaningful.”
More on missing data
• Agree on Imputation Rules
   – Do it upfront
   – Must be part of scoring codes
• Educate non-analysts
   – Hard to undo when combined with other values
   – Train data-append vendors
• Always check % missing
   – Development Sample vs. Life Databases
Scoring – database vs. sample
• Development Sample vs. Live Database
   – Database Structure
   – Variable List/Name
   – Variable Value
   – Imputation Assumption

  Lead to disasters if “anything” is different

• Do NOT play with model groups that are set in the
  development sample
Scoring QC & installment
Most troubles happen after the models are built…
Check:
•   Model Group Distributions
•   Variable distributions (values and indices)
•   Missing Values
•   Match rate for appended data
•   Scoring codes, including score breaks
•   Compare to previous runs – Check Deterioration
Set parameters for acceptable differences and Enforce
Score installment in the database
•   Plan ahead to store model scores in the database
•   Reserve space for future models
•   Store raw scores, not just model groups
•   Match the level
     – Household
     – Individual
     – Email
     – Product
Back-end Analysis
• Close the Loop Properly!
  1-to-1 MKT 101: “Learn from past campaigns”
• Must Plan ahead
   – No excuse for not doing it
   – Schedule ahead & Budget
   – Keep Historical Data
• Set Metrics Upfront
   – List Source
   – By Offer, Creative, Season, Product, etc.
Response Reports
• Start with “Canned” Reports from vendors
• Get ready to create “Custom” reports
   – Prioritize what you want
• Format and Delivery
• Timing and Interval
• Timeline to be covered (YTD, 12-mo, etc.)
Key ROI Metrics
Set ROI Metrics, such as:
• Open, Click-through, Conversion Rates
   – “Denominator” in each?
• Revenue
   – Per 1,000 mailed/calls
   – Per Order
   – Per Display, Email, Click-through, Conversion
• By
   – Source, Campaign, Time Period, Model Group, Offer, Creative,
     Targeting Criteria, Channel (in & outbound), Ad server,
     Publisher, Key word, Script, Daypart, etc.
• Key variables must reside in the database
   – Keep them in “ready-to-use” format
Where to Begin
• Spec it out
   – Project Goal
   – Data Source List (as detailed as possible)
   – Final Variable List
   – Project Flow:
      • Data Collection               • Development Sample
      • Conversion & Categorization   • Scoring
      • Summarization                 • Storage
      • Matching / Data Append        • Backend Analysis
Who will build the database?
        • In-house vs. Out-sourcing;
           Must consider
           – Platform
           – Programming
           – Staffing
           – Software
        • Cost it out
           – Don’t forget the update cost
        • Back to the analysts for variable list
          review
        • Don’t be shy and ask for help from
          consultants
Scope it out
• Know what you need, but don’t over do it
   “Modeling is making the best of what’s
    available”

• Take a phased approach
   – If budget is tight, start with low hanging fruits
   – Proof of concepts without full database
     commitment in the beginning
   – Maintain consistency
   – Keep Historical Data
Key Takeaways
• Don’t lose sight of long-term goals
• Maintain constant communication among
  key players
• Ensure consistent data every step of the
  way: From sampling to scoring
• Check every data source
• Match the levels of data (Data Summary)
• Don’t over-do it – employ phased approach
• Ask for help
Have More Questions? Visit Us at Booth #801.

Is Your Marketing Database "Model Ready"?

  • 1.
  • 2.
    Model-Ready Marketing Database Designing Databases for Advanced Analytics
  • 3.
    What we willcover • Marketing Database Philosophy • Data Ingredients for Modeling • Data Summarization • Types of Variables • Variable Design • Scoring, QC and Storage
  • 4.
    Data by thenumbers • Database marketers must excel in: 1. Collection: size and speed matters 2. Refinement: get to the answers, not just ingredients 3. Delivery: for consumption by end-users • Marketing databases must provide “marketing answers” via advanced analytics, not just bits and pieces of data • Insight does not come from data, it is derived from data
  • 5.
    Database marketing landscape • No guessing game – You MUST know your target • Vast amount of online & offline data collected  But are they being used properly? • Analytics play a huge roles in prospecting & CRM • Short paced marketing cycle getting shorter • Huge difference between advanced marketers and those who are falling behind Winners are the ones who know how to wield the power of all available data faster.
  • 6.
    Different types ofanalytics “Analytics” means different things… • BI (Business Intelligence) Reporting: Display of success metrics, dashboard reporting • Descriptive Analytics: Profiling, segmentation, clustering • Predictive Modeling: Response models, cloning Models, lifetime value, revenue models, etc. • Optimization: Channel optimization, marketing spending analysis, econometrics models Predictive Modeling for 1-to-1 Marketing
  • 7.
    Why model? • IncreaseTargeting Accuracy • Reduce costs by contacting less/smart • Stay relevant • Consistent results • Reveal hidden patterns in data • Repeatable – key for automation • Expandable • “Supposedly” save time and effort
  • 8.
    Why NOT model? • Universe is too small • Predictable data not available • 1-to-1 marketing channels not in plan • Tight budget • Lack of resources
  • 9.
    Any pain implementingmodels? • Not easy to find “Best” customers • Modelers are fixing data all the time • Rely on a few popular variables • Always need more variables • Takes too long to build models and score • Inconsistencies shown when scored • Disappointing results
  • 10.
    What does yourdatabase support? If you have a marketing database… • Order Fulfillment • Contact Management • Standard Reports • Ad hoc Reports and Queries • Name Selections • Response Analysis • But does it support modeling and scoring?
  • 11.
    “Model-Ready” Environment Collection/ Sampling Conversion Marketing Database Model Hygiene/Edit Development Model Categorization Application Analysis/ Consolidation Report Summarization Selection Variable Response Creation Collection “Consistency is key”
  • 12.
    For modeling, cleanthe data first “Garbage-in, garbage-out” • Most data sets are messy & unstructured • Over 70-80% of model development time goes to data prep work • Most databases are NOT model- ready • Modeling & Scoring  Extension of database work  Consistency is “the” key
  • 13.
    Why Front-end DPImportant? • Inexperienced analysts spend majority of time doing DP work – Modeling work at the last minute! • Creative variables enhance models • Inconsistent data creates a chain reaction to melt- downs • Data append/match becomes ineffective
  • 14.
    Define Analytical Goals • Rank & select prospect names • Cross-sell/Up-sell • Segment the universe for messaging strategy • Pinpoint attrition point • Assign lifetime values • Optimize media/channel spending • Create product packages • Project customer value • Detect fraud
  • 15.
    Data Inventory • “Modelingis making the best of what we know” • Beyond obvious RFM data • Get Deeper – Product/Service Level Data – Historical Data – Channel Data – Inbound & Outbound – Online activities, sentiments, unstructured data • External Data
  • 16.
    Data Available toMarketers 3 Major Types of Data 1. Demographic/Firmagraphic Data & Geo-demographic Data – Descriptive Data 2. Transaction Data / Behavioral Data - Customer Transaction Data - Compiled / Co-op Data - Lifestyle Data - Online behavioral data 3. Attitudinal Data - Surveys - Sentiments  3-dimensions in predictive analytics
  • 17.
    Create Data Menu •Base it on Companywide Need-Analysis • Ask the Analysts first • What type of models are in the plan? – Affinity/Look-alike Models – Promotion/Response Models – Time-series Models – Attrition Models • Consider non-analytical departments • Maintain the ones that fit the objective
  • 18.
    Data Menu (continued) •Check the ingredients – What do you have today? – What can be bought? – What can be created? • Cost – Can you afford to maintain it? – Storage/Platform – Consider the scoring part, too – Programming/Processing Time – Software – Update – External Data
  • 19.
    Check Your DataInventory Let’s start with what you have • Name & Address: Key to Geo/Demographic Data • Order Transaction Data: “RFM”, Payment Methods • Item/SKU Level Data: Products, Price, Units • Mailing/Response History: Source, Channel, Offer • Life-to-Date/Past “X” Month Summary Data • Customer Level Status Flags • Surveys/Product Registration Forms • Customer Communication History Data • Social Media, click-through, page views Need Conversion, Categorization, & Summarization
  • 20.
    Predictive Modeling isall about “Ranking” • Ultimately, Models must properly “Rank” #1 – Households #2 – Individuals – Products • Determine the level of data accordingly – Relational databases won’t cut it – Must create “Descriptors” that fit the level that needs to be ranked
  • 21.
    Variables as Descriptors Ifyou are ranking individuals, describe the individuals • Behavioral: • Transaction Data – RFM, Product Purchase • Response Data – Offer, Source, Channel • Geo-Demographic: Household/Geo • Attitudinal: Surveys, Inquiries, Sentiments  Match the Level of Data via “Summarization”
  • 22.
    Maximize the Powerof Transaction Data • RFM Data must be Summarized (or De-normalized) • Turn RFM data into individual / household level “Descriptors” • Combine with essential categorical variables (e.g., product, offer, channel, et c.)
  • 23.
    Data Summarization –Matching the Level of Data Order Table Cust ID Order # Order Date $ Amount 000123 100011 2009-05-06 $199.99 Order Summary Table 000123 100128 2010-08-30 $50.49 # First Order Last Order Cust ID $ Total 000123 103082 2011-12-21 $128.60 Orders Date Date 003859 100036 2010-06-06 $43.99 000123 3 $379.08 2009-05-06 2011-12-21 003859 101658 2011-01-20 $43.99 003859 4 $251.42 2010-06-06 2012-02-18 003859 102189 2011-04-15 $119.45 004593 1 $354.72 2012-07-30 2012-07-30 003859 106458 2012-02-18 $43.99 016899 1 $199.99 2011-07-14 2011-07-14 004593 104535 2012-07-30 $354.72 019872 3 $688.58 2010-09-07 2012-03-12 016899 107296 2011-07-14 $199.99 019872 102982 2010-09-07 $128.60 019872 103826 2011-04-30 $499.99 019872 109056 2012-03-12 $59.99
  • 24.
    Sample Variables afterSummarization Before After Summarization • Weeks since last online purchase • Years since member sign up Recency • Days since last delinquent date • Months since last response date • Orders by offer type • Orders by product/service type Frequency • Payments by pay method • Average days between transactions • Total $ past 24 months • Life-to-date spending Monetary • Average dollars by channel • Average dollars by product type
  • 25.
    RFM Data Summary– Timeline Life-to-date Summary May create bias towards provides the tenured customers historical view Put time limit on May require higher variables (e.g. 12- number of variables and month, 24- complicate the process month, etc.) For Lifetime Value & Must create historical arrays (daily, weekly, Time Series Models monthly counts of events)
  • 26.
    Who does thesummary work? Answer: Not the statistician! Key Takeaway The data variables must be consistent everywhere • Main database • Model Development Sample • Pool of records to be scored  Pre-build summary variables in the database
  • 27.
    Data Categorization Free-form datacomes to life through categorization Don’t Give Up! • Hidden data in: – product, service, offer, channel, source, status, tit les, surveys, etc. • Have categorization guideline? • Who will do it? – consider text mining techniques
  • 28.
    Categorical Data Any Non-numericData • Product • Service • Offer Offer Code Example: • Channel • Flat Dollar Discount • Source • % Discount • Market • Buy 1, Get 1 Free • Region • Free Shipping • Business Title • No Payment Until… • Member Status • Free Gift • Payment Status • etc… • etc… Categorize as much as possible at the data collection stage
  • 29.
    Categorization Guidelines • Be consistent throughout – Survey Form – Data Entry – Inventory Database – Data Collection & Compilation – Summarization – Modeling, and Scoring • Create “Code” structure  NEVER allow free-form answers
  • 30.
    Categorization Guidelines (Continued) •Create Rules and DON’T Training & Automation Deviate from them • More specific the better Combine them later • But, don’t allow too many Break into multiple variations (over 20) in one codes if necessary code • Don’t forget the end goal Must be “relevant”
  • 31.
    Data Hygiene &Data Append • Data conversion – Create consistency – Standardization – Edit – Purge • Cover all bases – PII & RFM Data • Create rules and be consistent
  • 32.
    PII – Gatewayto External Data What is hidden behind simple name & address? • Standardize Name & Address first – Maintain PII (Personally Identifiable Information) – Hygiene via periodic NCOA and standardization • First & Last Name – Ethnic, Gender • Name, Address, Email – Demographic Data • Address – Geo-demographic, Census Data • Zip – County, Market Region, DMA
  • 33.
    External Data  Alwaysconsider buying data before collecting and building • Compiled Demographic / Firmagraphic Data • Behavioral / Transaction / Co-op Data • Attitudinal / Survey / Lifestyle Data • Census / Geo-Demographic Data
  • 34.
    External Data CheckList • Test multiple data sources – Friendly variable definitions for analysts – Coverage/Match Rate – Price – Who will do the match & append? • Learn about the data sources – What’s real and what’s imputed? – Don’t stop at Demographic: always add “Behavioral” data
  • 35.
    Missing Values Missing valuesare inevitable… • For Numeric Data (e.g., $, Counters, Dates, etc.) – Incalculable vs. Data-append Non-matches – Missing is missing: DO NOT fill in with 0’s • For Categorical Data (e.g., Codes, Text, etc.) – Leave room for “N/A” (e.g., blank, “N/A”, “0”, “.”, etc.) – Code “Non-matches” to external files differently “Missing Data can be meaningful.”
  • 36.
    More on missingdata • Agree on Imputation Rules – Do it upfront – Must be part of scoring codes • Educate non-analysts – Hard to undo when combined with other values – Train data-append vendors • Always check % missing – Development Sample vs. Life Databases
  • 37.
    Scoring – databasevs. sample • Development Sample vs. Live Database – Database Structure – Variable List/Name – Variable Value – Imputation Assumption Lead to disasters if “anything” is different • Do NOT play with model groups that are set in the development sample
  • 38.
    Scoring QC &installment Most troubles happen after the models are built… Check: • Model Group Distributions • Variable distributions (values and indices) • Missing Values • Match rate for appended data • Scoring codes, including score breaks • Compare to previous runs – Check Deterioration Set parameters for acceptable differences and Enforce
  • 39.
    Score installment inthe database • Plan ahead to store model scores in the database • Reserve space for future models • Store raw scores, not just model groups • Match the level – Household – Individual – Email – Product
  • 40.
    Back-end Analysis • Closethe Loop Properly! 1-to-1 MKT 101: “Learn from past campaigns” • Must Plan ahead – No excuse for not doing it – Schedule ahead & Budget – Keep Historical Data • Set Metrics Upfront – List Source – By Offer, Creative, Season, Product, etc.
  • 41.
    Response Reports • Startwith “Canned” Reports from vendors • Get ready to create “Custom” reports – Prioritize what you want • Format and Delivery • Timing and Interval • Timeline to be covered (YTD, 12-mo, etc.)
  • 42.
    Key ROI Metrics SetROI Metrics, such as: • Open, Click-through, Conversion Rates – “Denominator” in each? • Revenue – Per 1,000 mailed/calls – Per Order – Per Display, Email, Click-through, Conversion • By – Source, Campaign, Time Period, Model Group, Offer, Creative, Targeting Criteria, Channel (in & outbound), Ad server, Publisher, Key word, Script, Daypart, etc. • Key variables must reside in the database – Keep them in “ready-to-use” format
  • 43.
    Where to Begin •Spec it out – Project Goal – Data Source List (as detailed as possible) – Final Variable List – Project Flow: • Data Collection • Development Sample • Conversion & Categorization • Scoring • Summarization • Storage • Matching / Data Append • Backend Analysis
  • 44.
    Who will buildthe database? • In-house vs. Out-sourcing; Must consider – Platform – Programming – Staffing – Software • Cost it out – Don’t forget the update cost • Back to the analysts for variable list review • Don’t be shy and ask for help from consultants
  • 45.
    Scope it out •Know what you need, but don’t over do it “Modeling is making the best of what’s available” • Take a phased approach – If budget is tight, start with low hanging fruits – Proof of concepts without full database commitment in the beginning – Maintain consistency – Keep Historical Data
  • 46.
    Key Takeaways • Don’tlose sight of long-term goals • Maintain constant communication among key players • Ensure consistent data every step of the way: From sampling to scoring • Check every data source • Match the levels of data (Data Summary) • Don’t over-do it – employ phased approach • Ask for help
  • 47.
    Have More Questions?Visit Us at Booth #801.