Why Analytics and to what level - By Novoniel Deb
•
0 likes•23 views
It's a very simple representation of how the benefits of Analytics can affect the business growth, even though the business is performing without it. See my other articles attached in my profile as well.
Report
Share
Report
Share
Recommended
"Planning Your Analytics Implementation" by Bachtiar Rifai (Kofera Technology)
Bachtiar is a tech startup & science enthusiast with more than 7 years experience in digital marketing, ecommerce, analytics and product development. Bachtiar has spend his career life as marketing leader at top ecommerce such as Lazada & Blanja.com. Currently Bachtiar develop a startup called Kofera, a technology company who provides Software as a Service (SaaS) marketing automation platform powered by Artificial Intelligence (AI) and machine learning. Established in 2016, Kofera helps companies build & optimize PPC campaign using machine learning algorithm to maximize business ROI. Kofera has helped many clients from various industries. Recently, Kofera received pra-series A funding lead by MDI Ventures and followed by Indosterling, DNC & Gunung Sewu.
***
This slide was shared at Tech in Asia Product Development Conference 2017 (PDC'17) on 9-10 August 2017.
Get more insightful updates from TIA by subscribing techin.asia/updateselalu
Accenture Big Data Expo
Strategy and implementation of a data Modernization Journey: strategy
Kjeld Stipsen
Winning in Today's Data-Centric Economy (Part 1)
First part of "Winning in Today's Data-Centric Economy"
How to make data actionable for business
This workshop was conducted at AdTech Bangalore where the speaker walked through how data can be made actionable for business.
The End Game for Data - HULU
Snowflake LA Meetup Group -
Hulu+Snowflake (Data Engineering Best Practices / Use cases)
August Tuesday 20th
Big Data Panel
Panelists from a large company, a small company and a software consulting firm will share insights on how their companies are tackling the arena of Big Data and how to leverage a variety of data sources for strategic decision-making.
"Data Informed vs Data Driven" by Casper Sermsuksan (Kulina)
Casper is currently the Head of Product & Growth at Kulina, an online food subscription service in Jakarta. Casper is responsible for driving product management and growth initiatives as well as leading marketing efforts. Previously, he led the product marketing teams at Product Madness in San Francisco. During his tenure at Product Madness, he helped the company's top app, Heart of Vegas achieve the record of $200M in annual revenue. Outside of his day-to-day work, he advises corporations and startups on product and growth, and writes frequently on Startup Grind, Mind the Product & Muzli. He graduated with a business degree from the University of Southern California in Los Angeles.
***
This slide was shared at Tech in Asia Product Development Conference 2017 (PDC'17) on 9-10 August 2017.
Get more insightful updates from TIA by subscribing techin.asia/updateselalu
Competitive Advantage from the Data Lake
Ron Bodkin, Founder and President of Think Big, a Teradata company, discussed how big data can give an organization a competitive advantage over its rivals during his presentation at the 2014 Chief Information Officer Leadership Forum in San Francisco on Oct. 28. In his presentation, Bodkin noted big data can be an asset for an organization, but only if an organization understands how to use it.
Today’s organizations often view data as part of either a “swamp” or a “reservoir,” Bodkin said. There is a lot of data that is readily available to organizations, Bodkin said, but those who merely keep it on hand without learning about its value could struggle. Instead, Bodkin noted organizations need to know how to implement data links properly to ensure that they can optimize their value: “I think it’s worth saying in implementing data links … we tend to see [mistakes] that we see a lot of organizations making that hold them back from achieving the potential.”
In addition, a cultural change is taking place in many organizations, Bodkin said, which is leading more organizations to focus on finding ways to get the most out of their data. Organizations that closely examine their internal data processes can take the necessary steps to ensure they can collect data and use it properly: “Even getting the technologies in place is just a starting point; they need to get adopted, they need to get integrated into people’s workforce and need to start to enable people to be successful with certain [measurements on] how they’re using them.”
- See more at: http://www.argylejournal.com/chief-information-officer/2014-chief-information-officer-leadership-forum-ron-bodkin-founder-and-president-think-big-a-teradata-company/#sthash.tETQQpz8.dpuf
Webinar: If Your Data Could Talk, What Story Would it Tell? Would it Be a Doc...
QueBIT Consulting November 2018 webinar: If your data could talk, what story would it tell? Would it be a documentary, a thriller, or horror story?
Operationalizing Data Science: The Right Architecture and Tools
In part one of this two-part series, you learned some of the common reasons enterprises struggle to turn insights into actions as well as a strategy for overcoming these challenges to successfully operationalize data science. In part two, it’s time to fill in the architectural and technological details of that strategy.
Pivotal Data Scientist Megha Agarwal will share the key ingredients to successfully put data science models in production and use them to drive actions in real-time. In this webinar, you will learn:
- Adopting extreme programming practices for data science
- Importance of working in a balanced team
- How to put and maintain machine learning models in production
- End-to-end pipeline design
Presenter: Megha Agarwal, Data Scientist
Five Pitfalls when Operationalizing Data Science and a Strategy for Success
Enterprise executives and IT teams alike know that data science is not optional, but struggle to benefit from it because the process takes too long and operationalizing models in applications can be hairy.
Join guest speaker, Forrester Research’s Mike Gualtieri and Pivotal’s Jeff Kelly and Dormain Drewitz for an interactive discussion about operationalizing data science in your business. In this webinar, the first of a two-part series, you will learn:
- The essential value of data science and the concept of perishable insights.
- Five common pitfalls of data science teams.
- How to dramatically increase the productivity of data scientists.
- The smooth hand-off steps required to operationalize data science models in enterprise applications.
Presenter : Guest Speakers Mike Gualtieri, Forrester, Dormain Drewitz and Jeff Kelly, Pivotal
Badgeville Summit, Engage 2012 - PRESENTATION: Insights & Analytics: The B...
MARTIN SCHNEIDER, Research Manager · 451 Research
KScope 14 Delivering Actionable Insight
Iain Curtain, Edgewater Ranzal senior consultant, presented "Delivering Actionable Insight - Using Visualization and Perception Techniques to Enhance User Understanding" at KScope14.
Beginner’s Primer on Business Intelligence
Beginner’s Primer on Business Intelligence
Business Intelligence is a set of process, architecture, technologies that converts the raw data into meaningful information which helps any business in making productive decision.
Business Intelligence directly affects the strategic and progressive decisions of any organization by making the use of historical data and facts. It also helps in analysing the data and explains the end users the nature of the business in the form of Reports, Graphs and Dashboards.
The session will cover the following topics:
-What is Business Intelligence
-Where does BI fit within an organization
-Advantages of BI systems
-Various types of BI users
-Various BI Tools
-Careers in BI
-Q & A
Follow Us For More Updates
Facebook Page https://www.facebook.com/CLTConsultin...
LinkedIn Page http://linkedin.com/company/cltcsi
Twitter Page https://twitter.com/CLTCSGLOBAL
YouTube Page https://www.youtube.com/channel/UCzqO...
Instagram Page https://www.instagram.com/clt_consult...
#businessintelligence #bi #bitool #oraclebi #otbi #oracle #cltconsulting
Big Data Analytics - Why it matters?
How the information or the data is handled? Which medium is used to handle it? Or how the data is processed and stored? This is where the term Big Data Analytics comes to play.
https://www.pelotongroup.com/services/big-data-analytics/
Big Data LDN 2018: FIGHTING DATA CHAOS: CONNECTING USERS TO DATA AT SCALE
Date: 13th November 2018
Location: Self-Service Analytics
Theatre Time: 12:30 - 13:00
Speaker: Joel McKelvey
Organisation: Looker
About: Companies that use data well are more efficient, effective, and profitable. Unfortunately, most organizations struggle to keep up with the changing supply of data — and the growing business demands for that data. The key is to connect data supply to data users in a way that scales, supports existing workflows, and serves as a foundation for the future.
This session will explore how to bring data to users where and when they need it without sacrificing data governance or unified metrics. This session will also present proven ways to build a data foundation for your organisation that can support future changes in both data supply and data demand.
Specifically, attendees will discover:
• The key considerations to driving the most value from data, including: self-service, governance, custom interfaces, modeling, and connections to existing business systems.
• How to provide users access to data in a way that naturally fits in their existing workflows and allows users to take immediate action.
• How companies like Deliveroo and King extract critical business insights from growing data and deliver those insights to their business users.
How to start thinking like a data scientist
Key insightsand relevance for managers on How to Start Thinking Like a Data Scientist by Thomas C. Redman
Search Driven Analytics - A New Approach for Data Discovery
Search to analyze your data (https://roosboard.com/)and generate a report immediately with the search-based dashboard.To know more about search analytic dashboard visit the above slides.
Big Data Introduction
What is this ‘Big Data’?
Introduction and Key words
Any secrets behind big data?
The 4V’s of Big Data
Big Data Analytics
What to do with this data?
Usefulness of Business Intelligence (BI)
Competency Snapshot: Decision making efficiency
It’s critical for organizations to formalize their approaches to maintaining and improving capabilities. The key is to use structured, objective third-party diagnostics that use a valid competency model coupled with manager assessments and self-assessments.
When the business needs intelligence (15Oct2014)
A talk on getting the organisation ready for business intelligence
More Related Content
What's hot
"Data Informed vs Data Driven" by Casper Sermsuksan (Kulina)
Casper is currently the Head of Product & Growth at Kulina, an online food subscription service in Jakarta. Casper is responsible for driving product management and growth initiatives as well as leading marketing efforts. Previously, he led the product marketing teams at Product Madness in San Francisco. During his tenure at Product Madness, he helped the company's top app, Heart of Vegas achieve the record of $200M in annual revenue. Outside of his day-to-day work, he advises corporations and startups on product and growth, and writes frequently on Startup Grind, Mind the Product & Muzli. He graduated with a business degree from the University of Southern California in Los Angeles.
***
This slide was shared at Tech in Asia Product Development Conference 2017 (PDC'17) on 9-10 August 2017.
Get more insightful updates from TIA by subscribing techin.asia/updateselalu
Competitive Advantage from the Data Lake
Ron Bodkin, Founder and President of Think Big, a Teradata company, discussed how big data can give an organization a competitive advantage over its rivals during his presentation at the 2014 Chief Information Officer Leadership Forum in San Francisco on Oct. 28. In his presentation, Bodkin noted big data can be an asset for an organization, but only if an organization understands how to use it.
Today’s organizations often view data as part of either a “swamp” or a “reservoir,” Bodkin said. There is a lot of data that is readily available to organizations, Bodkin said, but those who merely keep it on hand without learning about its value could struggle. Instead, Bodkin noted organizations need to know how to implement data links properly to ensure that they can optimize their value: “I think it’s worth saying in implementing data links … we tend to see [mistakes] that we see a lot of organizations making that hold them back from achieving the potential.”
In addition, a cultural change is taking place in many organizations, Bodkin said, which is leading more organizations to focus on finding ways to get the most out of their data. Organizations that closely examine their internal data processes can take the necessary steps to ensure they can collect data and use it properly: “Even getting the technologies in place is just a starting point; they need to get adopted, they need to get integrated into people’s workforce and need to start to enable people to be successful with certain [measurements on] how they’re using them.”
- See more at: http://www.argylejournal.com/chief-information-officer/2014-chief-information-officer-leadership-forum-ron-bodkin-founder-and-president-think-big-a-teradata-company/#sthash.tETQQpz8.dpuf
Webinar: If Your Data Could Talk, What Story Would it Tell? Would it Be a Doc...
QueBIT Consulting November 2018 webinar: If your data could talk, what story would it tell? Would it be a documentary, a thriller, or horror story?
Operationalizing Data Science: The Right Architecture and Tools
In part one of this two-part series, you learned some of the common reasons enterprises struggle to turn insights into actions as well as a strategy for overcoming these challenges to successfully operationalize data science. In part two, it’s time to fill in the architectural and technological details of that strategy.
Pivotal Data Scientist Megha Agarwal will share the key ingredients to successfully put data science models in production and use them to drive actions in real-time. In this webinar, you will learn:
- Adopting extreme programming practices for data science
- Importance of working in a balanced team
- How to put and maintain machine learning models in production
- End-to-end pipeline design
Presenter: Megha Agarwal, Data Scientist
Five Pitfalls when Operationalizing Data Science and a Strategy for Success
Enterprise executives and IT teams alike know that data science is not optional, but struggle to benefit from it because the process takes too long and operationalizing models in applications can be hairy.
Join guest speaker, Forrester Research’s Mike Gualtieri and Pivotal’s Jeff Kelly and Dormain Drewitz for an interactive discussion about operationalizing data science in your business. In this webinar, the first of a two-part series, you will learn:
- The essential value of data science and the concept of perishable insights.
- Five common pitfalls of data science teams.
- How to dramatically increase the productivity of data scientists.
- The smooth hand-off steps required to operationalize data science models in enterprise applications.
Presenter : Guest Speakers Mike Gualtieri, Forrester, Dormain Drewitz and Jeff Kelly, Pivotal
Badgeville Summit, Engage 2012 - PRESENTATION: Insights & Analytics: The B...
MARTIN SCHNEIDER, Research Manager · 451 Research
KScope 14 Delivering Actionable Insight
Iain Curtain, Edgewater Ranzal senior consultant, presented "Delivering Actionable Insight - Using Visualization and Perception Techniques to Enhance User Understanding" at KScope14.
Beginner’s Primer on Business Intelligence
Beginner’s Primer on Business Intelligence
Business Intelligence is a set of process, architecture, technologies that converts the raw data into meaningful information which helps any business in making productive decision.
Business Intelligence directly affects the strategic and progressive decisions of any organization by making the use of historical data and facts. It also helps in analysing the data and explains the end users the nature of the business in the form of Reports, Graphs and Dashboards.
The session will cover the following topics:
-What is Business Intelligence
-Where does BI fit within an organization
-Advantages of BI systems
-Various types of BI users
-Various BI Tools
-Careers in BI
-Q & A
Follow Us For More Updates
Facebook Page https://www.facebook.com/CLTConsultin...
LinkedIn Page http://linkedin.com/company/cltcsi
Twitter Page https://twitter.com/CLTCSGLOBAL
YouTube Page https://www.youtube.com/channel/UCzqO...
Instagram Page https://www.instagram.com/clt_consult...
#businessintelligence #bi #bitool #oraclebi #otbi #oracle #cltconsulting
Big Data Analytics - Why it matters?
How the information or the data is handled? Which medium is used to handle it? Or how the data is processed and stored? This is where the term Big Data Analytics comes to play.
https://www.pelotongroup.com/services/big-data-analytics/
Big Data LDN 2018: FIGHTING DATA CHAOS: CONNECTING USERS TO DATA AT SCALE
Date: 13th November 2018
Location: Self-Service Analytics
Theatre Time: 12:30 - 13:00
Speaker: Joel McKelvey
Organisation: Looker
About: Companies that use data well are more efficient, effective, and profitable. Unfortunately, most organizations struggle to keep up with the changing supply of data — and the growing business demands for that data. The key is to connect data supply to data users in a way that scales, supports existing workflows, and serves as a foundation for the future.
This session will explore how to bring data to users where and when they need it without sacrificing data governance or unified metrics. This session will also present proven ways to build a data foundation for your organisation that can support future changes in both data supply and data demand.
Specifically, attendees will discover:
• The key considerations to driving the most value from data, including: self-service, governance, custom interfaces, modeling, and connections to existing business systems.
• How to provide users access to data in a way that naturally fits in their existing workflows and allows users to take immediate action.
• How companies like Deliveroo and King extract critical business insights from growing data and deliver those insights to their business users.
How to start thinking like a data scientist
Key insightsand relevance for managers on How to Start Thinking Like a Data Scientist by Thomas C. Redman
Search Driven Analytics - A New Approach for Data Discovery
Search to analyze your data (https://roosboard.com/)and generate a report immediately with the search-based dashboard.To know more about search analytic dashboard visit the above slides.
Big Data Introduction
What is this ‘Big Data’?
Introduction and Key words
Any secrets behind big data?
The 4V’s of Big Data
Big Data Analytics
What to do with this data?
Usefulness of Business Intelligence (BI)
Competency Snapshot: Decision making efficiency
It’s critical for organizations to formalize their approaches to maintaining and improving capabilities. The key is to use structured, objective third-party diagnostics that use a valid competency model coupled with manager assessments and self-assessments.
What's hot (20)
"Data Informed vs Data Driven" by Casper Sermsuksan (Kulina)
"Data Informed vs Data Driven" by Casper Sermsuksan (Kulina)
Webinar: If Your Data Could Talk, What Story Would it Tell? Would it Be a Doc...
Webinar: If Your Data Could Talk, What Story Would it Tell? Would it Be a Doc...
Roadmap to data driven advice michael goedhart 1v0
Roadmap to data driven advice michael goedhart 1v0
Operationalizing Data Science: The Right Architecture and Tools
Operationalizing Data Science: The Right Architecture and Tools
Five Pitfalls when Operationalizing Data Science and a Strategy for Success
Five Pitfalls when Operationalizing Data Science and a Strategy for Success
Badgeville Summit, Engage 2012 - PRESENTATION: Insights & Analytics: The B...
Badgeville Summit, Engage 2012 - PRESENTATION: Insights & Analytics: The B...
Big Data LDN 2018: FIGHTING DATA CHAOS: CONNECTING USERS TO DATA AT SCALE
Big Data LDN 2018: FIGHTING DATA CHAOS: CONNECTING USERS TO DATA AT SCALE
Search Driven Analytics - A New Approach for Data Discovery
Search Driven Analytics - A New Approach for Data Discovery
Similar to Why Analytics and to what level - By Novoniel Deb
When the business needs intelligence (15Oct2014)
A talk on getting the organisation ready for business intelligence
Collaborate 2018: How to Get Cross Functional Reporting with an Enterprise Da...
Many organizations not only lack the ability to look at their data across the organization as whole, but often have no lens into the metrics that they need to report against or manage the business of their own departments.
How beneficial would it be to have a central data information repository – we call it an Enterprise Data Warehouse – from which to retrieve accurate data from across all aspects of your business? This presentation explains how this, and more, can be a reality for your business, in a relatively short amount of time.
Stop the madness - Never doubt the quality of BI again using Data Governance
Does this sound familiar?
"Are you sure those numbers are right?"
"Why are your numbers different than theirs?"
We've all heard it and had that gut wrenching feeling of doubt that comes with uncertainty around the quality of the numbers.
Stop the madness! Presented in Dunwoody on April 18 by industry leading expert Mary Levins who discusseses what it takes to successfully take control of your data using the Data Governance Framework. This framework is proven to improve the quality of your BI solutions.
Mary is the founder of Sierra Creek Consulting
Unlocking the value in your data
Stuart Edwards, Principal Consultant of hut4 Data Science, shares his experiences of wrangling the broad range of data sources available to the collections industry.
Further information about this topic can be found in this article in the IMA Agent magazine:
http://www.imal.com.au/eAGENT/eagentv51i02/index.html
Web sparkle analytics
This is the exciting world of Data Analytics. And the good part is, it is for all.
Whether you have a small to medium enterprise or a large one, you can benefit from data analysis. Here’s how.
Data Analytics/ Business Intelligence is a method of analyzing historical data to make informed decisions and predict future results.
Its strength lies in the ability to drill down from summary data – whether it is graphed or not.
Big Data LDN 2017: Weeks of Analysis in Minutes With Integrated Machine Learning
Date: 15th November 2017
Location: Self-Service Analytics Theatre
Time: 13:10 - 13:40
Speaker: Alvin Chan
Organisation: AVORA
Web sparkle analytics
This is the exciting world of Data Analytics. And the good part is, it is for all.
Whether you have a small to medium enterprise or a large one, you can benefit from data analysis. Here’s how.
Data Analytics/ Business Intelligence is a method of analyzing historical data to make informed decisions and predict future results.
Its strength lies in the ability to drill down from summary data – whether it is graphed or not.
Analytics helps you answer questions about your business
It helps you get a bird’s eye-view of your business, across branches, businesses.
From the top-view to drill-down to the smallest detail possible.
An example would be drilling down on sales figures, starting with year, then drilling down to a particular quarter, and then to a month(s) within that quarter
Corrective actions at the right places at the right time
For more details contact:
Web sparkle analytics
Data Analytics/ Business Intelligence is a method of analyzing historical data to make informed decisions and predict future results.
Its strength lies in the ability to drill down from summary data – whether it is graphed or not.
Analytics helps you answer questions about your business
It helps you get a bird’s eye-view of your business, across branches, businesses.
From the top-view to drill-down to the smallest detail possible.
An example would be drilling down on sales figures, starting with year, then drilling down to a particular quarter, and then to a month(s) within that quarter
Corrective actions at the right places at the right time
Data and Strategy: Cultivating Their Relationship
As presented at Calgary Compass, presented by AFP Calgary
What is Big Data?
Presented by Daniel Ling and Magnus Ebbesson at Findability Day, 14th of June 2012 in Stockholm.
Business Agility Must Be Based on a New Flexible and Agile Data Approach
Access to full webinar: Business Agility Must Be Based on a New Flexible and Agile Data Approach (session 4) - http://goo.gl/x6fr5h
Obtaining a deeper understanding of your customers’ needs, contextual marketing, and overall business intelligence and agility, depend on accurate, timely, and relevant data. This data needs to be collected from muliple internal and external sources and subsequently combined, refined, and fueled into a diverse portfolio of business intelligence and process applications.
According to Holger Kisker Ph.D., companies today need a flexible data management architecture to cope with both traditional and emerging sources of data (in any structure), advanced data analytics to extract deeper business insights, and efficient ways to deliver these insights as information or data services for better business decisions. To achieve this, they need a data virtualization layer that makes all data available as needed.
"How To Build and Lead a Winning Data Team" by Cahyo Listyanto (Bizzy.co.id)
Cahyo is a data geek, gamer and comic nerd.
Excel and Database are his favorite since his middle school.
Having graduated from a Vocational High School of Informatics and Technology
made him able to start his career early and led many DWH BI projects at his early 20.
He currently leading a data team in bizzy.co.id as the Head of Data Analytics.
Previously he worked for Microsoft Indonesia as Data Platform Technology Specialist where he provides strategic technical leadership supporting Microsoft customers and partners to adopt, deploy, and support solutions based on SQL Server and Data Platform related technologies.
***
This slide was shared at Tech in Asia Product Development Conference 2017 (PDC'17) on 9-10 August 2017.
Get more insightful updates from TIA by subscribing techin.asia/updateselalu
Going Beyond ‘What Success Looks Like’ – Using Data to Achieve Successful Pro...
Going Beyond ‘What Success Looks Like’ – Using Data to Achieve Successful Pro...Jamie Clouting (CSPO)
Delivering value is at the heart of the Business Analyst role, but how easy is it to identify tangible value and prove the success of a project or program?
In agile projects we’ll often define a “definition of done” or ask the question “what does success look like”. At LateRooms.com, we’ve developed a toolkit for our Business Analysts to support the business in using data to define what success looks like, and track it throughout the project lifecycle.
This presentation will look at the ways LateRooms.com collects, analyses and uses data to better define the problem space, setup up KPI driven Critical Success Factors and present Benefits Realisation.Similar to Why Analytics and to what level - By Novoniel Deb (20)
Collaborate 2018: How to Get Cross Functional Reporting with an Enterprise Da...
Collaborate 2018: How to Get Cross Functional Reporting with an Enterprise Da...
Stop the madness - Never doubt the quality of BI again using Data Governance
Stop the madness - Never doubt the quality of BI again using Data Governance
Big Data LDN 2017: Weeks of Analysis in Minutes With Integrated Machine Learning
Big Data LDN 2017: Weeks of Analysis in Minutes With Integrated Machine Learning
Data Refinement: The missing link between data collection and decisions
Data Refinement: The missing link between data collection and decisions
Business Agility Must Be Based on a New Flexible and Agile Data Approach
Business Agility Must Be Based on a New Flexible and Agile Data Approach
"How To Build and Lead a Winning Data Team" by Cahyo Listyanto (Bizzy.co.id)
"How To Build and Lead a Winning Data Team" by Cahyo Listyanto (Bizzy.co.id)
Going Beyond ‘What Success Looks Like’ – Using Data to Achieve Successful Pro...
Going Beyond ‘What Success Looks Like’ – Using Data to Achieve Successful Pro...
Recently uploaded
Adjusting primitives for graph : SHORT REPORT / NOTES
Graph algorithms, like PageRank Compressed Sparse Row (CSR) is an adjacency-list based graph representation that is
Multiply with different modes (map)
1. Performance of sequential execution based vs OpenMP based vector multiply.
2. Comparing various launch configs for CUDA based vector multiply.
Sum with different storage types (reduce)
1. Performance of vector element sum using float vs bfloat16 as the storage type.
Sum with different modes (reduce)
1. Performance of sequential execution based vs OpenMP based vector element sum.
2. Performance of memcpy vs in-place based CUDA based vector element sum.
3. Comparing various launch configs for CUDA based vector element sum (memcpy).
4. Comparing various launch configs for CUDA based vector element sum (in-place).
Sum with in-place strategies of CUDA mode (reduce)
1. Comparing various launch configs for CUDA based vector element sum (in-place).
The affect of service quality and online reviews on customer loyalty in the E...
Journal of Management and Creative Business.published book./
一比一原版(CBU毕业证)卡普顿大学毕业证如何办理
CBU毕业证offer【微信95270640】《卡普顿大学毕业证书》《QQ微信95270640》学位证书电子版:在线制作卡普顿大学毕业证成绩单GPA修改(制作CBU毕业证成绩单CBU文凭证书样本)、卡普顿大学毕业证书与成绩单样本图片、《CBU学历证书学位证书》、卡普顿大学毕业证案例毕业证书制作軟體、在线制作加拿大硕士学历证书真实可查.
如果您是以下情况,我们都能竭诚为您解决实际问题:【公司采用定金+余款的付款流程,以最大化保障您的利益,让您放心无忧】
1、在校期间,因各种原因未能顺利毕业,拿不到官方毕业证+微信95270640
2、面对父母的压力,希望尽快拿到卡普顿大学卡普顿大学毕业证成绩单;
3、不清楚流程以及材料该如何准备卡普顿大学卡普顿大学毕业证成绩单;
4、回国时间很长,忘记办理;
5、回国马上就要找工作,办给用人单位看;
6、企事业单位必须要求办理的;
面向美国乔治城大学毕业留学生提供以下服务:
【★卡普顿大学卡普顿大学毕业证成绩单毕业证、成绩单等全套材料,从防伪到印刷,从水印到钢印烫金,与学校100%相同】
【★真实使馆认证(留学人员回国证明),使馆存档可通过大使馆查询确认】
【★真实教育部认证,教育部存档,教育部留服网站可查】
【★真实留信认证,留信网入库存档,可查卡普顿大学卡普顿大学毕业证成绩单】
我们从事工作十余年的有着丰富经验的业务顾问,熟悉海外各国大学的学制及教育体系,并且以挂科生解决毕业材料不全问题为基础,为客户量身定制1对1方案,未能毕业的回国留学生成功搭建回国顺利发展所需的桥梁。我们一直努力以高品质的教育为起点,以诚信、专业、高效、创新作为一切的行动宗旨,始终把“诚信为主、质量为本、客户第一”作为我们全部工作的出发点和归宿点。同时为海内外留学生提供大学毕业证购买、补办成绩单及各类分数修改等服务;归国认证方面,提供《留信网入库》申请、《国外学历学位认证》申请以及真实学籍办理等服务,帮助众多莘莘学子实现了一个又一个梦想。
专业服务,请勿犹豫联系我
如果您真实毕业回国,对于学历认证无从下手,请联系我,我们免费帮您递交
诚招代理:本公司诚聘当地代理人员,如果你有业余时间,或者你有同学朋友需要,有兴趣就请联系我
你赢我赢,共创双赢
你做代理,可以帮助卡普顿大学同学朋友
你做代理,可以拯救卡普顿大学失足青年
你做代理,可以挽救卡普顿大学一个个人才
你做代理,你将是别人人生卡普顿大学的转折点
你做代理,可以改变自己,改变他人,给他人和自己一个机会道银边山娃摸索着扯了扯灯绳小屋顿时一片刺眼的亮瞅瞅床头的诺基亚山娃苦笑着摇了摇头连他自己都感到奇怪居然又睡到上午点半掐指算算随父亲进城已一个多星期了山娃几乎天天起得这么迟在乡下老家暑假五点多山娃就醒来在爷爷奶奶嘁嘁喳喳的忙碌声中一骨碌爬起把牛驱到后龙山再从莲塘里采回一蛇皮袋湿漉漉的莲蓬也才点多点半早就吃过早餐玩耍去了山娃的家在闽西山区依山傍水山清水秀门前潺潺流淌的蜿蜒小溪一直都是山娃和小伙伴们盛试
Algorithmic optimizations for Dynamic Levelwise PageRank (from STICD) : SHORT...
Techniques to optimize the pagerank algorithm usually fall in two categories. One is to try reducing the work per iteration, and the other is to try reducing the number of iterations. These goals are often at odds with one another. Skipping computation on vertices which have already converged has the potential to save iteration time. Skipping in-identical vertices, with the same in-links, helps reduce duplicate computations and thus could help reduce iteration time. Road networks often have chains which can be short-circuited before pagerank computation to improve performance. Final ranks of chain nodes can be easily calculated. This could reduce both the iteration time, and the number of iterations. If a graph has no dangling nodes, pagerank of each strongly connected component can be computed in topological order. This could help reduce the iteration time, no. of iterations, and also enable multi-iteration concurrency in pagerank computation. The combination of all of the above methods is the STICD algorithm. [sticd] For dynamic graphs, unchanged components whose ranks are unaffected can be skipped altogether.
Malana- Gimlet Market Analysis (Portfolio 2)
A market analysys on Spotify's parent Podcast company Gimlet.
一比一原版(爱大毕业证书)爱丁堡大学毕业证如何办理
毕业原版【微信:41543339】【(爱大毕业证书)爱丁堡大学毕业证】【微信:41543339】成绩单、外壳、offer、留信学历认证(永久存档真实可查)采用学校原版纸张、特殊工艺完全按照原版一比一制作(包括:隐形水印,阴影底纹,钢印LOGO烫金烫银,LOGO烫金烫银复合重叠,文字图案浮雕,激光镭射,紫外荧光,温感,复印防伪)行业标杆!精益求精,诚心合作,真诚制作!多年品质 ,按需精细制作,24小时接单,全套进口原装设备,十五年致力于帮助留学生解决难题,业务范围有加拿大、英国、澳洲、韩国、美国、新加坡,新西兰等学历材料,包您满意。
【我们承诺采用的是学校原版纸张(纸质、底色、纹路),我们拥有全套进口原装设备,特殊工艺都是采用不同机器制作,仿真度基本可以达到100%,所有工艺效果都可提前给客户展示,不满意可以根据客户要求进行调整,直到满意为止!】
【业务选择办理准则】
一、工作未确定,回国需先给父母、亲戚朋友看下文凭的情况,办理一份就读学校的毕业证【微信41543339】文凭即可
二、回国进私企、外企、自己做生意的情况,这些单位是不查询毕业证真伪的,而且国内没有渠道去查询国外文凭的真假,也不需要提供真实教育部认证。鉴于此,办理一份毕业证【微信41543339】即可
三、进国企,银行,事业单位,考公务员等等,这些单位是必需要提供真实教育部认证的,办理教育部认证所需资料众多且烦琐,所有材料您都必须提供原件,我们凭借丰富的经验,快捷的绿色通道帮您快速整合材料,让您少走弯路。
留信网认证的作用:
1:该专业认证可证明留学生真实身份
2:同时对留学生所学专业登记给予评定
3:国家专业人才认证中心颁发入库证书
4:这个认证书并且可以归档倒地方
5:凡事获得留信网入网的信息将会逐步更新到个人身份内,将在公安局网内查询个人身份证信息后,同步读取人才网入库信息
6:个人职称评审加20分
7:个人信誉贷款加10分
8:在国家人才网主办的国家网络招聘大会中纳入资料,供国家高端企业选择人才
留信网服务项目:
1、留学生专业人才库服务(留信分析)
2、国(境)学习人员提供就业推荐信服务
3、留学人员区块链存储服务
→ 【关于价格问题(保证一手价格)】
我们所定的价格是非常合理的,而且我们现在做得单子大多数都是代理和回头客户介绍的所以一般现在有新的单子 我给客户的都是第一手的代理价格,因为我想坦诚对待大家 不想跟大家在价格方面浪费时间
对于老客户或者被老客户介绍过来的朋友,我们都会适当给一些优惠。
选择实体注册公司办理,更放心,更安全!我们的承诺:客户在留信官方认证查询网站查询到认证通过结果后付款,不成功不收费!
Unleashing the Power of Data_ Choosing a Trusted Analytics Platform.pdf
In this guide, we'll explore the key considerations and features to look for when choosing a Trusted analytics platform that meets your organization's needs and delivers actionable intelligence you can trust.
06-04-2024 - NYC Tech Week - Discussion on Vector Databases, Unstructured Dat...
06-04-2024 - NYC Tech Week - Discussion on Vector Databases, Unstructured Data and AI
Round table discussion of vector databases, unstructured data, ai, big data, real-time, robots and Milvus.
A lively discussion with NJ Gen AI Meetup Lead, Prasad and Procure.FYI's Co-Found
做(mqu毕业证书)麦考瑞大学毕业证硕士文凭证书学费发票原版一模一样
原版定制【Q微信:741003700】《(mqu毕业证书)麦考瑞大学毕业证硕士文凭证书》【Q微信:741003700】成绩单 、雅思、外壳、留信学历认证永久存档查询,采用学校原版纸张、特殊工艺完全按照原版一比一制作(包括:隐形水印,阴影底纹,钢印LOGO烫金烫银,LOGO烫金烫银复合重叠,文字图案浮雕,激光镭射,紫外荧光,温感,复印防伪)行业标杆!精益求精,诚心合作,真诚制作!多年品质 ,按需精细制作,24小时接单,全套进口原装设备,十五年致力于帮助留学生解决难题,业务范围有加拿大、英国、澳洲、韩国、美国、新加坡,新西兰等学历材料,包您满意。
【业务选择办理准则】
一、工作未确定,回国需先给父母、亲戚朋友看下文凭的情况,办理一份就读学校的毕业证【Q微信741003700】文凭即可
二、回国进私企、外企、自己做生意的情况,这些单位是不查询毕业证真伪的,而且国内没有渠道去查询国外文凭的真假,也不需要提供真实教育部认证。鉴于此,办理一份毕业证【微信741003700】即可
三、进国企,银行,事业单位,考公务员等等,这些单位是必需要提供真实教育部认证的,办理教育部认证所需资料众多且烦琐,所有材料您都必须提供原件,我们凭借丰富的经验,快捷的绿色通道帮您快速整合材料,让您少走弯路。
留信网认证的作用:
1:该专业认证可证明留学生真实身份
2:同时对留学生所学专业登记给予评定
3:国家专业人才认证中心颁发入库证书
4:这个认证书并且可以归档倒地方
5:凡事获得留信网入网的信息将会逐步更新到个人身份内,将在公安局网内查询个人身份证信息后,同步读取人才网入库信息
6:个人职称评审加20分
7:个人信誉贷款加10分
8:在国家人才网主办的国家网络招聘大会中纳入资料,供国家高端企业选择人才
【关于价格问题(保证一手价格)】
我们所定的价格是非常合理的,而且我们现在做得单子大多数都是代理和回头客户介绍的所以一般现在有新的单子 我给客户的都是第一手的代理价格,因为我想坦诚对待大家 不想跟大家在价格方面浪费时间
对于老客户或者被老客户介绍过来的朋友,我们都会适当给一些优惠。
一比一原版(UIUC毕业证)伊利诺伊大学|厄巴纳-香槟分校毕业证如何办理
UIUC毕业证offer【微信95270640】☀《伊利诺伊大学|厄巴纳-香槟分校毕业证购买》GoogleQ微信95270640《UIUC毕业证模板办理》加拿大文凭、本科、硕士、研究生学历都可以做,二、业务范围:
★、全套服务:毕业证、成绩单、化学专业毕业证书伪造《伊利诺伊大学|厄巴纳-香槟分校大学毕业证》Q微信95270640《UIUC学位证书购买》
(诚招代理)办理国外高校毕业证成绩单文凭学位证,真实使馆公证(留学回国人员证明)真实留信网认证国外学历学位认证雅思代考国外学校代申请名校保录开请假条改GPA改成绩ID卡
1.高仿业务:【本科硕士】毕业证,成绩单(GPA修改),学历认证(教育部认证),大学Offer,,ID,留信认证,使馆认证,雅思,语言证书等高仿类证书;
2.认证服务: 学历认证(教育部认证),大使馆认证(回国人员证明),留信认证(可查有编号证书),大学保录取,雅思保分成绩单。
3.技术服务:钢印水印烫金激光防伪凹凸版设计印刷激凸温感光标底纹镭射速度快。
办理伊利诺伊大学|厄巴纳-香槟分校伊利诺伊大学|厄巴纳-香槟分校毕业证offer流程:
1客户提供办理信息:姓名生日专业学位毕业时间等(如信息不确定可以咨询顾问:我们有专业老师帮你查询);
2开始安排制作毕业证成绩单电子图;
3毕业证成绩单电子版做好以后发送给您确认;
4毕业证成绩单电子版您确认信息无误之后安排制作成品;
5成品做好拍照或者视频给您确认;
6快递给客户(国内顺丰国外DHLUPS等快读邮寄)
-办理真实使馆公证(即留学回国人员证明)
-办理各国各大学文凭(世界名校一对一专业服务,可全程监控跟踪进度)
-全套服务:毕业证成绩单真实使馆公证真实教育部认证。让您回国发展信心十足!
(详情请加一下 文凭顾问+微信:95270640)欢迎咨询!的鬼地方父亲的家在高楼最底屋最下面很矮很黑是很不显眼的地下室父亲的家安在别人脚底下须绕过高楼旁边的垃圾堆下八个台阶才到父亲的家很狭小除了一张单人床和一张小方桌几乎没有多余的空间山娃一下子就联想起学校的男小便处山娃很想笑却怎么也笑不出来山娃很迷惑父亲的家除了一扇小铁门连窗户也没有墓穴一般阴森森有些骇人父亲的城也便成了山娃的城父亲的家也便成了山娃的家父亲让山娃呆在屋里做作业看电视最多只能在门口透透气间
一比一原版(Coventry毕业证书)考文垂大学毕业证如何办理
毕业原版【微信:41543339】【(Coventry毕业证书)考文垂大学毕业证】【微信:41543339】成绩单、外壳、offer、留信学历认证(永久存档真实可查)采用学校原版纸张、特殊工艺完全按照原版一比一制作(包括:隐形水印,阴影底纹,钢印LOGO烫金烫银,LOGO烫金烫银复合重叠,文字图案浮雕,激光镭射,紫外荧光,温感,复印防伪)行业标杆!精益求精,诚心合作,真诚制作!多年品质 ,按需精细制作,24小时接单,全套进口原装设备,十五年致力于帮助留学生解决难题,业务范围有加拿大、英国、澳洲、韩国、美国、新加坡,新西兰等学历材料,包您满意。
【我们承诺采用的是学校原版纸张(纸质、底色、纹路),我们拥有全套进口原装设备,特殊工艺都是采用不同机器制作,仿真度基本可以达到100%,所有工艺效果都可提前给客户展示,不满意可以根据客户要求进行调整,直到满意为止!】
【业务选择办理准则】
一、工作未确定,回国需先给父母、亲戚朋友看下文凭的情况,办理一份就读学校的毕业证【微信41543339】文凭即可
二、回国进私企、外企、自己做生意的情况,这些单位是不查询毕业证真伪的,而且国内没有渠道去查询国外文凭的真假,也不需要提供真实教育部认证。鉴于此,办理一份毕业证【微信41543339】即可
三、进国企,银行,事业单位,考公务员等等,这些单位是必需要提供真实教育部认证的,办理教育部认证所需资料众多且烦琐,所有材料您都必须提供原件,我们凭借丰富的经验,快捷的绿色通道帮您快速整合材料,让您少走弯路。
留信网认证的作用:
1:该专业认证可证明留学生真实身份
2:同时对留学生所学专业登记给予评定
3:国家专业人才认证中心颁发入库证书
4:这个认证书并且可以归档倒地方
5:凡事获得留信网入网的信息将会逐步更新到个人身份内,将在公安局网内查询个人身份证信息后,同步读取人才网入库信息
6:个人职称评审加20分
7:个人信誉贷款加10分
8:在国家人才网主办的国家网络招聘大会中纳入资料,供国家高端企业选择人才
留信网服务项目:
1、留学生专业人才库服务(留信分析)
2、国(境)学习人员提供就业推荐信服务
3、留学人员区块链存储服务
→ 【关于价格问题(保证一手价格)】
我们所定的价格是非常合理的,而且我们现在做得单子大多数都是代理和回头客户介绍的所以一般现在有新的单子 我给客户的都是第一手的代理价格,因为我想坦诚对待大家 不想跟大家在价格方面浪费时间
对于老客户或者被老客户介绍过来的朋友,我们都会适当给一些优惠。
选择实体注册公司办理,更放心,更安全!我们的承诺:客户在留信官方认证查询网站查询到认证通过结果后付款,不成功不收费!
The Building Blocks of QuestDB, a Time Series Database
Talk Delivered at Valencia Codes Meetup 2024-06.
Traditionally, databases have treated timestamps just as another data type. However, when performing real-time analytics, timestamps should be first class citizens and we need rich time semantics to get the most out of our data. We also need to deal with ever growing datasets while keeping performant, which is as fun as it sounds.
It is no wonder time-series databases are now more popular than ever before. Join me in this session to learn about the internal architecture and building blocks of QuestDB, an open source time-series database designed for speed. We will also review a history of some of the changes we have gone over the past two years to deal with late and unordered data, non-blocking writes, read-replicas, or faster batch ingestion.
一比一原版(Bradford毕业证书)布拉德福德大学毕业证如何办理
原版定制【微信:41543339】【(Bradford毕业证书)布拉德福德大学毕业证】【微信:41543339】成绩单、外壳、offer、留信学历认证(永久存档真实可查)采用学校原版纸张、特殊工艺完全按照原版一比一制作(包括:隐形水印,阴影底纹,钢印LOGO烫金烫银,LOGO烫金烫银复合重叠,文字图案浮雕,激光镭射,紫外荧光,温感,复印防伪)行业标杆!精益求精,诚心合作,真诚制作!多年品质 ,按需精细制作,24小时接单,全套进口原装设备,十五年致力于帮助留学生解决难题,业务范围有加拿大、英国、澳洲、韩国、美国、新加坡,新西兰等学历材料,包您满意。
【我们承诺采用的是学校原版纸张(纸质、底色、纹路),我们拥有全套进口原装设备,特殊工艺都是采用不同机器制作,仿真度基本可以达到100%,所有工艺效果都可提前给客户展示,不满意可以根据客户要求进行调整,直到满意为止!】
【业务选择办理准则】
一、工作未确定,回国需先给父母、亲戚朋友看下文凭的情况,办理一份就读学校的毕业证【微信41543339】文凭即可
二、回国进私企、外企、自己做生意的情况,这些单位是不查询毕业证真伪的,而且国内没有渠道去查询国外文凭的真假,也不需要提供真实教育部认证。鉴于此,办理一份毕业证【微信41543339】即可
三、进国企,银行,事业单位,考公务员等等,这些单位是必需要提供真实教育部认证的,办理教育部认证所需资料众多且烦琐,所有材料您都必须提供原件,我们凭借丰富的经验,快捷的绿色通道帮您快速整合材料,让您少走弯路。
留信网认证的作用:
1:该专业认证可证明留学生真实身份
2:同时对留学生所学专业登记给予评定
3:国家专业人才认证中心颁发入库证书
4:这个认证书并且可以归档倒地方
5:凡事获得留信网入网的信息将会逐步更新到个人身份内,将在公安局网内查询个人身份证信息后,同步读取人才网入库信息
6:个人职称评审加20分
7:个人信誉贷款加10分
8:在国家人才网主办的国家网络招聘大会中纳入资料,供国家高端企业选择人才
留信网服务项目:
1、留学生专业人才库服务(留信分析)
2、国(境)学习人员提供就业推荐信服务
3、留学人员区块链存储服务
→ 【关于价格问题(保证一手价格)】
我们所定的价格是非常合理的,而且我们现在做得单子大多数都是代理和回头客户介绍的所以一般现在有新的单子 我给客户的都是第一手的代理价格,因为我想坦诚对待大家 不想跟大家在价格方面浪费时间
对于老客户或者被老客户介绍过来的朋友,我们都会适当给一些优惠。
选择实体注册公司办理,更放心,更安全!我们的承诺:客户在留信官方认证查询网站查询到认证通过结果后付款,不成功不收费!
Chatty Kathy - UNC Bootcamp Final Project Presentation - Final Version - 5.23...
SlideShare Description for "Chatty Kathy - UNC Bootcamp Final Project Presentation"
Title: Chatty Kathy: Enhancing Physical Activity Among Older Adults
Description:
Discover how Chatty Kathy, an innovative project developed at the UNC Bootcamp, aims to tackle the challenge of low physical activity among older adults. Our AI-driven solution uses peer interaction to boost and sustain exercise levels, significantly improving health outcomes. This presentation covers our problem statement, the rationale behind Chatty Kathy, synthetic data and persona creation, model performance metrics, a visual demonstration of the project, and potential future developments. Join us for an insightful Q&A session to explore the potential of this groundbreaking project.
Project Team: Jay Requarth, Jana Avery, John Andrews, Dr. Dick Davis II, Nee Buntoum, Nam Yeongjin & Mat Nicholas
Learn SQL from basic queries to Advance queries
Dive into the world of data analysis with our comprehensive guide on mastering SQL! This presentation offers a practical approach to learning SQL, focusing on real-world applications and hands-on practice. Whether you're a beginner or looking to sharpen your skills, this guide provides the tools you need to extract, analyze, and interpret data effectively.
Key Highlights:
Foundations of SQL: Understand the basics of SQL, including data retrieval, filtering, and aggregation.
Advanced Queries: Learn to craft complex queries to uncover deep insights from your data.
Data Trends and Patterns: Discover how to identify and interpret trends and patterns in your datasets.
Practical Examples: Follow step-by-step examples to apply SQL techniques in real-world scenarios.
Actionable Insights: Gain the skills to derive actionable insights that drive informed decision-making.
Join us on this journey to enhance your data analysis capabilities and unlock the full potential of SQL. Perfect for data enthusiasts, analysts, and anyone eager to harness the power of data!
#DataAnalysis #SQL #LearningSQL #DataInsights #DataScience #Analytics
Levelwise PageRank with Loop-Based Dead End Handling Strategy : SHORT REPORT ...
Abstract — Levelwise PageRank is an alternative method of PageRank computation which decomposes the input graph into a directed acyclic block-graph of strongly connected components, and processes them in topological order, one level at a time. This enables calculation for ranks in a distributed fashion without per-iteration communication, unlike the standard method where all vertices are processed in each iteration. It however comes with a precondition of the absence of dead ends in the input graph. Here, the native non-distributed performance of Levelwise PageRank was compared against Monolithic PageRank on a CPU as well as a GPU. To ensure a fair comparison, Monolithic PageRank was also performed on a graph where vertices were split by components. Results indicate that Levelwise PageRank is about as fast as Monolithic PageRank on the CPU, but quite a bit slower on the GPU. Slowdown on the GPU is likely caused by a large submission of small workloads, and expected to be non-issue when the computation is performed on massive graphs.
一比一原版(Dalhousie毕业证书)达尔豪斯大学毕业证如何办理
原版定制【微信:41543339】【(Dalhousie毕业证书)达尔豪斯大学毕业证】【微信:41543339】成绩单、外壳、offer、留信学历认证(永久存档真实可查)采用学校原版纸张、特殊工艺完全按照原版一比一制作(包括:隐形水印,阴影底纹,钢印LOGO烫金烫银,LOGO烫金烫银复合重叠,文字图案浮雕,激光镭射,紫外荧光,温感,复印防伪)行业标杆!精益求精,诚心合作,真诚制作!多年品质 ,按需精细制作,24小时接单,全套进口原装设备,十五年致力于帮助留学生解决难题,业务范围有加拿大、英国、澳洲、韩国、美国、新加坡,新西兰等学历材料,包您满意。
【我们承诺采用的是学校原版纸张(纸质、底色、纹路),我们拥有全套进口原装设备,特殊工艺都是采用不同机器制作,仿真度基本可以达到100%,所有工艺效果都可提前给客户展示,不满意可以根据客户要求进行调整,直到满意为止!】
【业务选择办理准则】
一、工作未确定,回国需先给父母、亲戚朋友看下文凭的情况,办理一份就读学校的毕业证【微信41543339】文凭即可
二、回国进私企、外企、自己做生意的情况,这些单位是不查询毕业证真伪的,而且国内没有渠道去查询国外文凭的真假,也不需要提供真实教育部认证。鉴于此,办理一份毕业证【微信41543339】即可
三、进国企,银行,事业单位,考公务员等等,这些单位是必需要提供真实教育部认证的,办理教育部认证所需资料众多且烦琐,所有材料您都必须提供原件,我们凭借丰富的经验,快捷的绿色通道帮您快速整合材料,让您少走弯路。
留信网认证的作用:
1:该专业认证可证明留学生真实身份
2:同时对留学生所学专业登记给予评定
3:国家专业人才认证中心颁发入库证书
4:这个认证书并且可以归档倒地方
5:凡事获得留信网入网的信息将会逐步更新到个人身份内,将在公安局网内查询个人身份证信息后,同步读取人才网入库信息
6:个人职称评审加20分
7:个人信誉贷款加10分
8:在国家人才网主办的国家网络招聘大会中纳入资料,供国家高端企业选择人才
留信网服务项目:
1、留学生专业人才库服务(留信分析)
2、国(境)学习人员提供就业推荐信服务
3、留学人员区块链存储服务
→ 【关于价格问题(保证一手价格)】
我们所定的价格是非常合理的,而且我们现在做得单子大多数都是代理和回头客户介绍的所以一般现在有新的单子 我给客户的都是第一手的代理价格,因为我想坦诚对待大家 不想跟大家在价格方面浪费时间
对于老客户或者被老客户介绍过来的朋友,我们都会适当给一些优惠。
选择实体注册公司办理,更放心,更安全!我们的承诺:客户在留信官方认证查询网站查询到认证通过结果后付款,不成功不收费!
Recently uploaded (20)
Adjusting primitives for graph : SHORT REPORT / NOTES
Adjusting primitives for graph : SHORT REPORT / NOTES
The affect of service quality and online reviews on customer loyalty in the E...
The affect of service quality and online reviews on customer loyalty in the E...
Algorithmic optimizations for Dynamic Levelwise PageRank (from STICD) : SHORT...
Algorithmic optimizations for Dynamic Levelwise PageRank (from STICD) : SHORT...
Unleashing the Power of Data_ Choosing a Trusted Analytics Platform.pdf
Unleashing the Power of Data_ Choosing a Trusted Analytics Platform.pdf
06-04-2024 - NYC Tech Week - Discussion on Vector Databases, Unstructured Dat...
06-04-2024 - NYC Tech Week - Discussion on Vector Databases, Unstructured Dat...
Best best suvichar in gujarati english meaning of this sentence as Silk road ...
Best best suvichar in gujarati english meaning of this sentence as Silk road ...
The Building Blocks of QuestDB, a Time Series Database
The Building Blocks of QuestDB, a Time Series Database
Chatty Kathy - UNC Bootcamp Final Project Presentation - Final Version - 5.23...
Chatty Kathy - UNC Bootcamp Final Project Presentation - Final Version - 5.23...
Levelwise PageRank with Loop-Based Dead End Handling Strategy : SHORT REPORT ...
Levelwise PageRank with Loop-Based Dead End Handling Strategy : SHORT REPORT ...
Why Analytics and to what level - By Novoniel Deb
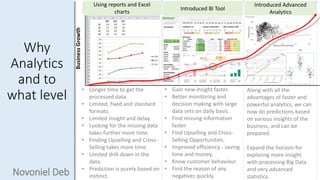
- 1. • Longer time to get the processed data. • Limited, fixed and standard formats. • Limited insight and delay. • Looking for the missing data takes further more time. • Finding Upselling and Cross- Selling takes more time. • Limited drill-down in the data. • Prediction is purely based on instinct. Introduced BI Tool Introduced Advanced Analytics • Gain new insight faster. • Better monitoring and decision making with large data sets on daily basis. • Find missing information faster. • Find Upselling and Cross- Selling Opportunities. • Improved efficiency - saving time and money. • Know customer behaviour. • Find the reason of any negatives quickly. BusinessGrowth Along with all the advantages of faster and powerful analytics, we can now do predictions based on various insights of the business, and can be prepared. Expand the horizon for exploring more insight with processing Big Data and very advanced statistics. Why Analytics and to what level Novoniel Deb Using reports and Excel charts