Download as PDF, PPTX

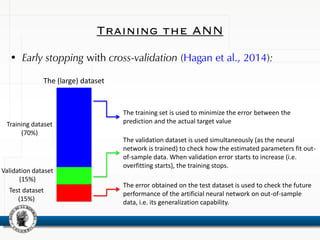
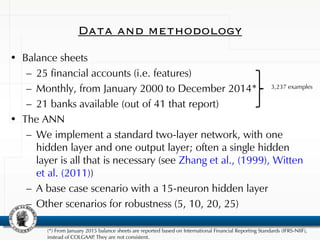
![Introduction
Explanatory Modeling
• The aim is to test a causal theory (traditional
econometrics)
• Requires building an underlying causal
structure (a theoretical prior)
• Need to work on expected role of variables
Predictive Modeling
• The aim is to predict or classify successfully
• No need to build an underlying causal
structure (a theoretical prior)
• No need to delve into the expected role of
the variables
Machine LearningEconometrics
Varian, H. (2014):
• […] econometrics is concerned with detecting and summarizing relationships in data,
with regression analysis as its prevalent tool.
• […] machine learning methods –such as artificial neural networks- are concerned with
developing high-performance computer systems that can provide useful predictions,
namely out-of-sample predictions.](https://image.slidesharecdn.com/cleonnnoct2016-161028142544/85/Whose-Balance-Sheet-is-this-Neural-Networks-for-Banks-Pattern-Recognition-13-320.jpg)
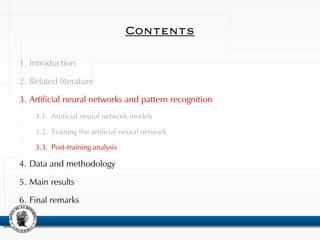
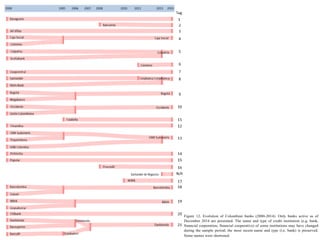
![Set
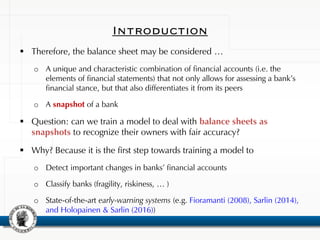
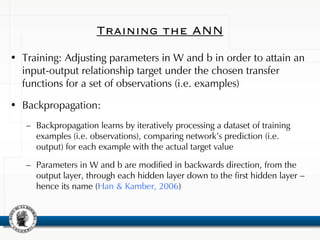
Misclassification (Average and standard deviation, %)
5 neurons 10 neurons 15 neurons 20 neurons 25 neurons
Training
19.75%
[15.37%]
3.41%
[9.84%]
0.61%
[0.43%]
0.15%
[0.29%]
0.10%
[0.23%]
Validation
20.99%
[15.23%]
4.86%
[9.87%]
1.64%
[0.81%]
1.00%
[0.70%]
0.91%
[0.72%]
Test
21.53%
[15.44%]
5.19%
[9.86%]
1.72%
[0.80%]
1.23%
[0.66%]
0.94%
[0.63%]
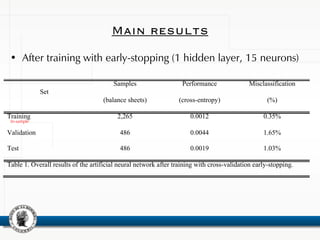
Table 2. Overall average results of the artificial neural network after training with cross-validation early-
stopping. The average and standard deviation (in brackets) is estimated on 100 independent training
processes.
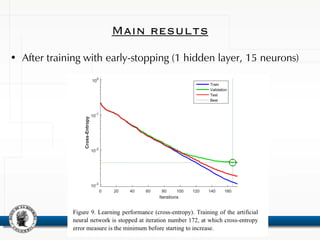
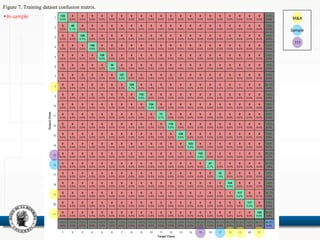
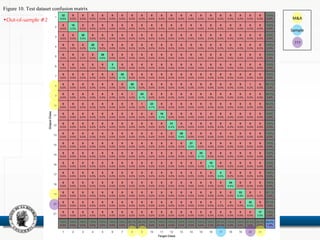
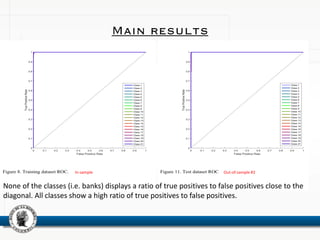
Main results
In-sample](https://image.slidesharecdn.com/cleonnnoct2016-161028142544/85/Whose-Balance-Sheet-is-this-Neural-Networks-for-Banks-Pattern-Recognition-43-320.jpg)

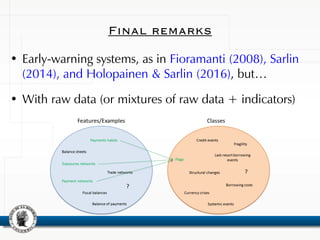

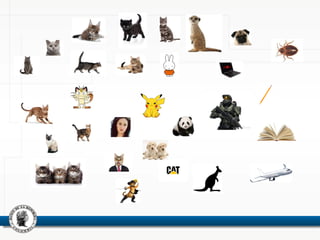
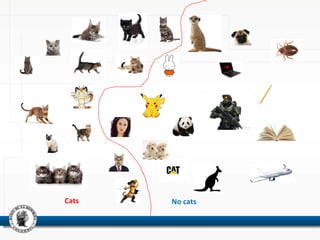
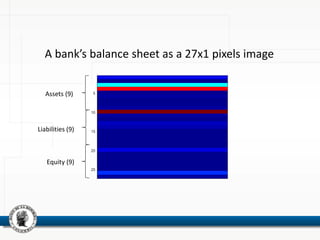
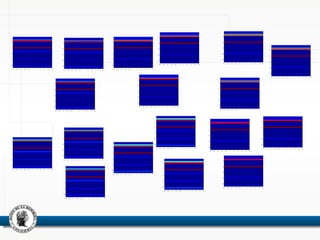
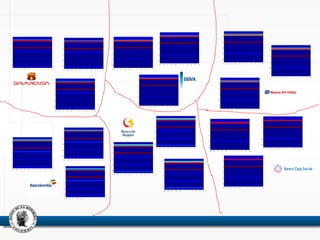
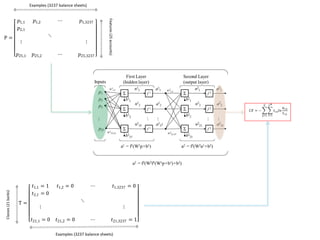
This document discusses using neural networks to perform pattern recognition on banks' balance sheets. It proposes representing each balance sheet as a 27x1 pixel image and training a neural network to identify which bank each balance sheet belongs to. This could help detect important changes in banks' financial accounts over time and classify banks by risk level. The document reviews related literature on using neural networks for financial data analysis and pattern recognition. It argues that working with raw balance sheet data, rather than selected financial ratios, may provide more useful information for classification. The goal is to determine if neural networks can accurately recognize the owners of balance sheets presented as images.