SlideShare a Scribd company logo
1 of 23
Business Analytics
“Go down deep enough into anything and you will find Mathematics”. Dean Schlicter
What is analysed
Every organization across the world uses performance measures such as :
 Market share
 Profitability
 Sales growth
 Return on investment (ROI)
 Customer satisfaction
and so on for quantifying, monitoring, benchmarking, and improving its performance.
KPI
It is important for organizations to understand the association between key
performance indicators (KPIs) and factors that have a significant impact on the
KPIs for effective management
How it is analyzed
 Analytics is a body of knowledge consisting of statistical, mathematical, and
operations research techniques; artificial intelligence techniques such as
machine learning and deep learning algorithms; data collection and storage;
data management processes such as data extraction, transformation, and
loading (ETL); and computing and big data technologies such as Hadoop,
Spark, and Hive that create value by developing actionable items from data.
Why?
 Two primary macro-level objectives of analytics are problem solving and
decision making.
 Analytics helps organizations to create value by solving problems effectively
and assisting in decision making.
 Today, analytics is used as a competitive strategy by many organizations such
as Amazon, Apple, General Electric, Google, Facebook and Procter and
Gamble who use analytics to create products and solutions.
Some references
 Marshall (2016) and MacKenzie et al. (2013) reported that Amazon’s
recommender systems resulted in a sales increase of 35%.
 Davenport and Harris (2007) and Hopkins et al. (2010) reported that there
was a high correlation between use of analytics and business performance.
They claimed that the majority of high performers (measured in terms of
profit, shareholder return and revenue, etc.) strategically apply analytics in
their daily operations, as compared to low performers.
Why?
 Herbert Simon (bounded rationality)
 Travelling Salesman Problem of 
Why?
In 2015, through their Vasanthapura kitchen in Bangalore, approximately 84000
school children from 650 schools in South Bangalore were provided mid-day
meals. Providing high quality food at an affordable price is one of the challenges
faced by Akshaya Patra.
The Vasanthapura kitchen used 35 vehicles to distribute the cooked food. To
minimize the cost of distribution, they need to solve a complex vehicle routing
problem (VRP).
To simplify this problem, assume that they divide the number of schools equally
among the vehicles; each vehicle would then have to deliver food to
approximately 20 schools (few vehicles are kept as standby). For each vehicle,
we need to find the best route. This problem can be formulated as a TSP with a
solution space of 20 factorial (20! =2.4329 × 10¹⁸).
Why?
 Or think about:
 Montey Hall Problem**
 ** last slide
Why?
 Because BA is Good for all sizes(akshay patra by the way is small to medium
and Walmart is equivalent to GDP of 28th country in the world)
 The human mind lacks the ability to choose the right decisions due to the
complexity of the problems that the organizations are facing and the limited
time available for decision making.
 Even ERP was enabled to perform Analytics(SAP HANA)
Level of Decision Making
A typical DDDM Process uses the following steps :
1. Identify the problem or opportunity for value creation.
2. Identify sources of data (primary as well secondary data sources).
3. Pre-process the data for issues such as missing and incorrect data. Generate
derived variables and transform the data if necessary. Prepare the data for
analytics model building.
4. Divide the data sets into subsets training and validation data sets.
5. Build analytical models and identify the best model(s) using model
performance in validation data.
6. Implement Solution/Decision/Develop Product.
Levels…….
 BA helps from the Bottom of pyramid (i.e. solution of trivial problem) and to
the top (i.e. handling strategy)
Types
 Business analytics can be grouped into three types:
 descriptive analytics
 predictive analytics, and
 prescriptive analytics.
Descriptive Analytics
 Descriptive analytics is the simplest form of analytics that mainly uses simple
descriptive statistics, data visualization techniques, and business related
queries to understand past data.
 One of the primary objectives of descriptive analytics is innovative ways of
data summarization. Descriptive analytics is used for understanding the
trends in past data which can be useful for generating insights.
 The next Figure shows visualization of relationship break-ups reported in
Facebook.
Jan Feb March - - -july - - Dec
DA
 The fact that there is a significant increase in breakups during December we
can deduce
 the following insights (or possibilities):
 1. There will be more traffic to online dating sites during December/January.
 2. There will be greater demand for relationship counsellors and lawyers.
 3. There will be greater demand for housing and the housing prices are likely
to increase in
 December/January.
 4. There will be greater demand for household items.
 5. People would like to forget the past, so they might change the brand of
beer they drink.
Examples of DA
 The following are a few examples of insights obtained using descriptive analytics reported in
literature:
 1. Most shoppers turn towards the right side when they enter a retail store (Underhill, 2009, pages
 77−79). Retailers keep products with higher profit on the right side of the store since most people
 turn right.
 2. Married men who kiss their wife before going to work live longer, earn more and get into less
 number of accidents as compared to those who do not (Foer, 2006).
 3. Correlated with Facebook relationship breakups, divorces spike in January. According to
 Caroline Kent (2015), January 3 is nicknamed ‘divorce day’.
 4. Men are more reluctant to use coupons as compared to women (Hu and Jasper, 2004). While
sending coupons, retailers should target female shoppers as they are more likely to use coupons.
 Classic
 JON SNOW(Cholera using DV) Snow established that water contamination was the main source of
cholera.
Predictive Analytics
If you torture the data long enough, it will confess.
Ronald Coase
It aims to predict the probability of occurrence of a future event such as,
 Customer churn,
 Employee attrition
 Forecasting demand for products/services
 Loan defaults,
 Fraudulent transactions,
 Insurance claim, and
 Stock market fluctuations.
Examples
 Irrespective of the type of business, organizations would like to forecast the
demand for their products or services and understand the causes of demand
fluctuations. The use of predictive analytics can reveal relationships that were
previously unknown and are not intuitive.
 The use of predictive analytics:
 Polyphonic HMI Predicts whether a song will be a hit using machine learning
algorithms. Their product ‘Hit Song Science’ uses mathematical and statistical
techniques to predict the success of a song on a scale of 1 to 10 (Anon, 2003).
 Amazon.com Uses predictive analytics to recommend products to their customers.
It is reported that 35% of Amazon’s sales is achieved through their recommender
system (Siegel, 2013, MacKinzie et al., 2013).
 Netflix Predicts which movie their customer is likely to watch next (Greene, 2006).
75% of what customer watch at Netflix is from product recommendations
(MacKinzie et al., 2013
Prescriptive Analytics
 Prescriptive analytics is the highest level of analytics capability which is used for choosing
optimal actions once an organization gains insights through descriptive and predictive
analytics.
 In many cases, prescriptive analytics is solved as a separate optimization problem.
Prescriptive analytics assists users in finding the optimal solution to a problem or in making
the right choice/decision among several alternatives.
 Operations Research (OR) techniques form the core of prescriptive analytics. Apart from
operations research techniques, machine learning algorithms, meta heuristics, and advanced
statistical models are used in prescriptive analytics.

Predictive Analytics
 The most frequently used predictive analytics techniques are regression,
logistic regression, classification trees, forecasting, K-nearest neighbours,
Markov chains, random forest, boosting, and neural networks.
 The frequently used tools in prescriptive analytics are linear programming,
integer programming, multi-criteria decision-making models such as goal
programming and analytic hierarchy process, combinatorial optimization,
non-linear programming, and meta-heuristics
BA VS BI
 BI is a set of systems and technologies used by enterprises to visualize and
share operational business data. BI can reveal trends and patterns in data
that would otherwise remain obscure. Enterprises can use the reporting and
visualization capabilities of BI to operate more efficiently and obtain valuable
insights.
 BA is the use of historical business data and statistical models to better
predict why things happen within a business. These models can help
determine causality and make predictions about future events. BA is more
about statistical extrapolation than static analysis.

Gate1 Gate2 Gate3 Stay Switch
Goat Car Goat Goat Car
Car Goat Goat Car Goat
Goat Goat Car Goat Car
Suppose you select gate 1(you cant see what is inside). An item is shown to you by
monty from any one of the gate 2 and gate 3(definitely he will show you goat). You have
to decide whether to stay with the door or switch. Always switching is better with 2/3
probability

More Related Content

Similar to Intro.pptx

5.Data Analytics.pptx
5.Data Analytics.pptx5.Data Analytics.pptx
5.Data Analytics.pptxAbhitazKhan
 
what is ..how to process types and methods involved in data analysis
what is ..how to process types and methods involved in data analysiswhat is ..how to process types and methods involved in data analysis
what is ..how to process types and methods involved in data analysisData analysis ireland
 
Data strategy - The Business Game Changer
Data strategy - The Business Game ChangerData strategy - The Business Game Changer
Data strategy - The Business Game ChangerAmit Pishe
 
Machine Learning for Business - Eight Best Practices for Getting Started
Machine Learning for Business - Eight Best Practices for Getting StartedMachine Learning for Business - Eight Best Practices for Getting Started
Machine Learning for Business - Eight Best Practices for Getting StartedBhupesh Chaurasia
 
Business Analytics
Business AnalyticsBusiness Analytics
Business AnalyticsKim Moore
 
Analytic Strategy Value Map
Analytic Strategy Value MapAnalytic Strategy Value Map
Analytic Strategy Value MapJaap Vink
 
BUSINESS_INTELLIGENT_AND_ANALYTICS.pptx
BUSINESS_INTELLIGENT_AND_ANALYTICS.pptxBUSINESS_INTELLIGENT_AND_ANALYTICS.pptx
BUSINESS_INTELLIGENT_AND_ANALYTICS.pptxobaroadewale
 
Is Your Company Braced Up for handling Big Data
Is Your Company Braced Up for handling Big DataIs Your Company Braced Up for handling Big Data
Is Your Company Braced Up for handling Big Datahimanshu13jun
 
Data Analytics for E-Commerce: Driving Growth with Expert Training
Data Analytics for E-Commerce: Driving Growth with Expert TrainingData Analytics for E-Commerce: Driving Growth with Expert Training
Data Analytics for E-Commerce: Driving Growth with Expert TrainingUncodemy
 
Simplify our analytics strategy
Simplify our analytics strategySimplify our analytics strategy
Simplify our analytics strategysaurabh sethia
 
Business intelligence and analytics
Business intelligence and analyticsBusiness intelligence and analytics
Business intelligence and analyticsYogesh Supekar
 
Unit 1 pptx.pptx
Unit 1 pptx.pptxUnit 1 pptx.pptx
Unit 1 pptx.pptxrekhabawa2
 
Data Analysis Methods 101 - Turning Raw Data Into Actionable Insights
Data Analysis Methods 101 - Turning Raw Data Into Actionable InsightsData Analysis Methods 101 - Turning Raw Data Into Actionable Insights
Data Analysis Methods 101 - Turning Raw Data Into Actionable InsightsDataSpace Academy
 

Similar to Intro.pptx (20)

Machine learning
Machine learningMachine learning
Machine learning
 
5.Data Analytics.pptx
5.Data Analytics.pptx5.Data Analytics.pptx
5.Data Analytics.pptx
 
BA_CEC.pptx
BA_CEC.pptxBA_CEC.pptx
BA_CEC.pptx
 
what is ..how to process types and methods involved in data analysis
what is ..how to process types and methods involved in data analysiswhat is ..how to process types and methods involved in data analysis
what is ..how to process types and methods involved in data analysis
 
Sas business analytics
Sas   business analyticsSas   business analytics
Sas business analytics
 
Data strategy - The Business Game Changer
Data strategy - The Business Game ChangerData strategy - The Business Game Changer
Data strategy - The Business Game Changer
 
Machine Learning for Business - Eight Best Practices for Getting Started
Machine Learning for Business - Eight Best Practices for Getting StartedMachine Learning for Business - Eight Best Practices for Getting Started
Machine Learning for Business - Eight Best Practices for Getting Started
 
Business Analytics
Business AnalyticsBusiness Analytics
Business Analytics
 
What is analytics
What is analyticsWhat is analytics
What is analytics
 
Analytic Strategy Value Map
Analytic Strategy Value MapAnalytic Strategy Value Map
Analytic Strategy Value Map
 
BUSINESS_INTELLIGENT_AND_ANALYTICS.pptx
BUSINESS_INTELLIGENT_AND_ANALYTICS.pptxBUSINESS_INTELLIGENT_AND_ANALYTICS.pptx
BUSINESS_INTELLIGENT_AND_ANALYTICS.pptx
 
HR analytics
HR analyticsHR analytics
HR analytics
 
Is Your Company Braced Up for handling Big Data
Is Your Company Braced Up for handling Big DataIs Your Company Braced Up for handling Big Data
Is Your Company Braced Up for handling Big Data
 
Business Analytics.pptx
Business Analytics.pptxBusiness Analytics.pptx
Business Analytics.pptx
 
Data Analytics for E-Commerce: Driving Growth with Expert Training
Data Analytics for E-Commerce: Driving Growth with Expert TrainingData Analytics for E-Commerce: Driving Growth with Expert Training
Data Analytics for E-Commerce: Driving Growth with Expert Training
 
Business intelligence
Business intelligenceBusiness intelligence
Business intelligence
 
Simplify our analytics strategy
Simplify our analytics strategySimplify our analytics strategy
Simplify our analytics strategy
 
Business intelligence and analytics
Business intelligence and analyticsBusiness intelligence and analytics
Business intelligence and analytics
 
Unit 1 pptx.pptx
Unit 1 pptx.pptxUnit 1 pptx.pptx
Unit 1 pptx.pptx
 
Data Analysis Methods 101 - Turning Raw Data Into Actionable Insights
Data Analysis Methods 101 - Turning Raw Data Into Actionable InsightsData Analysis Methods 101 - Turning Raw Data Into Actionable Insights
Data Analysis Methods 101 - Turning Raw Data Into Actionable Insights
 

Recently uploaded

PKS-TGC-1084-630 - Stage 1 Proposal.pptx
PKS-TGC-1084-630 - Stage 1 Proposal.pptxPKS-TGC-1084-630 - Stage 1 Proposal.pptx
PKS-TGC-1084-630 - Stage 1 Proposal.pptxPramod Kumar Srivastava
 
毕业文凭制作#回国入职#diploma#degree澳洲中央昆士兰大学毕业证成绩单pdf电子版制作修改#毕业文凭制作#回国入职#diploma#degree
毕业文凭制作#回国入职#diploma#degree澳洲中央昆士兰大学毕业证成绩单pdf电子版制作修改#毕业文凭制作#回国入职#diploma#degree毕业文凭制作#回国入职#diploma#degree澳洲中央昆士兰大学毕业证成绩单pdf电子版制作修改#毕业文凭制作#回国入职#diploma#degree
毕业文凭制作#回国入职#diploma#degree澳洲中央昆士兰大学毕业证成绩单pdf电子版制作修改#毕业文凭制作#回国入职#diploma#degreeyuu sss
 
꧁❤ Greater Noida Call Girls Delhi ❤꧂ 9711199171 ☎️ Hard And Sexy Vip Call
꧁❤ Greater Noida Call Girls Delhi ❤꧂ 9711199171 ☎️ Hard And Sexy Vip Call꧁❤ Greater Noida Call Girls Delhi ❤꧂ 9711199171 ☎️ Hard And Sexy Vip Call
꧁❤ Greater Noida Call Girls Delhi ❤꧂ 9711199171 ☎️ Hard And Sexy Vip Callshivangimorya083
 
Effects of Smartphone Addiction on the Academic Performances of Grades 9 to 1...
Effects of Smartphone Addiction on the Academic Performances of Grades 9 to 1...Effects of Smartphone Addiction on the Academic Performances of Grades 9 to 1...
Effects of Smartphone Addiction on the Academic Performances of Grades 9 to 1...limedy534
 
04242024_CCC TUG_Joins and Relationships
04242024_CCC TUG_Joins and Relationships04242024_CCC TUG_Joins and Relationships
04242024_CCC TUG_Joins and Relationshipsccctableauusergroup
 
VIP High Class Call Girls Jamshedpur Anushka 8250192130 Independent Escort Se...
VIP High Class Call Girls Jamshedpur Anushka 8250192130 Independent Escort Se...VIP High Class Call Girls Jamshedpur Anushka 8250192130 Independent Escort Se...
VIP High Class Call Girls Jamshedpur Anushka 8250192130 Independent Escort Se...Suhani Kapoor
 
办理(Vancouver毕业证书)加拿大温哥华岛大学毕业证成绩单原版一比一
办理(Vancouver毕业证书)加拿大温哥华岛大学毕业证成绩单原版一比一办理(Vancouver毕业证书)加拿大温哥华岛大学毕业证成绩单原版一比一
办理(Vancouver毕业证书)加拿大温哥华岛大学毕业证成绩单原版一比一F La
 
DBA Basics: Getting Started with Performance Tuning.pdf
DBA Basics: Getting Started with Performance Tuning.pdfDBA Basics: Getting Started with Performance Tuning.pdf
DBA Basics: Getting Started with Performance Tuning.pdfJohn Sterrett
 
9711147426✨Call In girls Gurgaon Sector 31. SCO 25 escort service
9711147426✨Call In girls Gurgaon Sector 31. SCO 25 escort service9711147426✨Call In girls Gurgaon Sector 31. SCO 25 escort service
9711147426✨Call In girls Gurgaon Sector 31. SCO 25 escort servicejennyeacort
 
Industrialised data - the key to AI success.pdf
Industrialised data - the key to AI success.pdfIndustrialised data - the key to AI success.pdf
Industrialised data - the key to AI success.pdfLars Albertsson
 
Kantar AI Summit- Under Embargo till Wednesday, 24th April 2024, 4 PM, IST.pdf
Kantar AI Summit- Under Embargo till Wednesday, 24th April 2024, 4 PM, IST.pdfKantar AI Summit- Under Embargo till Wednesday, 24th April 2024, 4 PM, IST.pdf
Kantar AI Summit- Under Embargo till Wednesday, 24th April 2024, 4 PM, IST.pdfSocial Samosa
 
9654467111 Call Girls In Munirka Hotel And Home Service
9654467111 Call Girls In Munirka Hotel And Home Service9654467111 Call Girls In Munirka Hotel And Home Service
9654467111 Call Girls In Munirka Hotel And Home ServiceSapana Sha
 
Data Science Jobs and Salaries Analysis.pptx
Data Science Jobs and Salaries Analysis.pptxData Science Jobs and Salaries Analysis.pptx
Data Science Jobs and Salaries Analysis.pptxFurkanTasci3
 
GA4 Without Cookies [Measure Camp AMS]
GA4 Without Cookies [Measure Camp AMS]GA4 Without Cookies [Measure Camp AMS]
GA4 Without Cookies [Measure Camp AMS]📊 Markus Baersch
 
Call Girls In Dwarka 9654467111 Escorts Service
Call Girls In Dwarka 9654467111 Escorts ServiceCall Girls In Dwarka 9654467111 Escorts Service
Call Girls In Dwarka 9654467111 Escorts ServiceSapana Sha
 
Call Girls in Defence Colony Delhi 💯Call Us 🔝8264348440🔝
Call Girls in Defence Colony Delhi 💯Call Us 🔝8264348440🔝Call Girls in Defence Colony Delhi 💯Call Us 🔝8264348440🔝
Call Girls in Defence Colony Delhi 💯Call Us 🔝8264348440🔝soniya singh
 
Beautiful Sapna Vip Call Girls Hauz Khas 9711199012 Call /Whatsapps
Beautiful Sapna Vip  Call Girls Hauz Khas 9711199012 Call /WhatsappsBeautiful Sapna Vip  Call Girls Hauz Khas 9711199012 Call /Whatsapps
Beautiful Sapna Vip Call Girls Hauz Khas 9711199012 Call /Whatsappssapnasaifi408
 
Dubai Call Girls Wifey O52&786472 Call Girls Dubai
Dubai Call Girls Wifey O52&786472 Call Girls DubaiDubai Call Girls Wifey O52&786472 Call Girls Dubai
Dubai Call Girls Wifey O52&786472 Call Girls Dubaihf8803863
 

Recently uploaded (20)

PKS-TGC-1084-630 - Stage 1 Proposal.pptx
PKS-TGC-1084-630 - Stage 1 Proposal.pptxPKS-TGC-1084-630 - Stage 1 Proposal.pptx
PKS-TGC-1084-630 - Stage 1 Proposal.pptx
 
毕业文凭制作#回国入职#diploma#degree澳洲中央昆士兰大学毕业证成绩单pdf电子版制作修改#毕业文凭制作#回国入职#diploma#degree
毕业文凭制作#回国入职#diploma#degree澳洲中央昆士兰大学毕业证成绩单pdf电子版制作修改#毕业文凭制作#回国入职#diploma#degree毕业文凭制作#回国入职#diploma#degree澳洲中央昆士兰大学毕业证成绩单pdf电子版制作修改#毕业文凭制作#回国入职#diploma#degree
毕业文凭制作#回国入职#diploma#degree澳洲中央昆士兰大学毕业证成绩单pdf电子版制作修改#毕业文凭制作#回国入职#diploma#degree
 
꧁❤ Greater Noida Call Girls Delhi ❤꧂ 9711199171 ☎️ Hard And Sexy Vip Call
꧁❤ Greater Noida Call Girls Delhi ❤꧂ 9711199171 ☎️ Hard And Sexy Vip Call꧁❤ Greater Noida Call Girls Delhi ❤꧂ 9711199171 ☎️ Hard And Sexy Vip Call
꧁❤ Greater Noida Call Girls Delhi ❤꧂ 9711199171 ☎️ Hard And Sexy Vip Call
 
Effects of Smartphone Addiction on the Academic Performances of Grades 9 to 1...
Effects of Smartphone Addiction on the Academic Performances of Grades 9 to 1...Effects of Smartphone Addiction on the Academic Performances of Grades 9 to 1...
Effects of Smartphone Addiction on the Academic Performances of Grades 9 to 1...
 
04242024_CCC TUG_Joins and Relationships
04242024_CCC TUG_Joins and Relationships04242024_CCC TUG_Joins and Relationships
04242024_CCC TUG_Joins and Relationships
 
VIP High Class Call Girls Jamshedpur Anushka 8250192130 Independent Escort Se...
VIP High Class Call Girls Jamshedpur Anushka 8250192130 Independent Escort Se...VIP High Class Call Girls Jamshedpur Anushka 8250192130 Independent Escort Se...
VIP High Class Call Girls Jamshedpur Anushka 8250192130 Independent Escort Se...
 
办理(Vancouver毕业证书)加拿大温哥华岛大学毕业证成绩单原版一比一
办理(Vancouver毕业证书)加拿大温哥华岛大学毕业证成绩单原版一比一办理(Vancouver毕业证书)加拿大温哥华岛大学毕业证成绩单原版一比一
办理(Vancouver毕业证书)加拿大温哥华岛大学毕业证成绩单原版一比一
 
DBA Basics: Getting Started with Performance Tuning.pdf
DBA Basics: Getting Started with Performance Tuning.pdfDBA Basics: Getting Started with Performance Tuning.pdf
DBA Basics: Getting Started with Performance Tuning.pdf
 
9711147426✨Call In girls Gurgaon Sector 31. SCO 25 escort service
9711147426✨Call In girls Gurgaon Sector 31. SCO 25 escort service9711147426✨Call In girls Gurgaon Sector 31. SCO 25 escort service
9711147426✨Call In girls Gurgaon Sector 31. SCO 25 escort service
 
E-Commerce Order PredictionShraddha Kamble.pptx
E-Commerce Order PredictionShraddha Kamble.pptxE-Commerce Order PredictionShraddha Kamble.pptx
E-Commerce Order PredictionShraddha Kamble.pptx
 
Industrialised data - the key to AI success.pdf
Industrialised data - the key to AI success.pdfIndustrialised data - the key to AI success.pdf
Industrialised data - the key to AI success.pdf
 
Kantar AI Summit- Under Embargo till Wednesday, 24th April 2024, 4 PM, IST.pdf
Kantar AI Summit- Under Embargo till Wednesday, 24th April 2024, 4 PM, IST.pdfKantar AI Summit- Under Embargo till Wednesday, 24th April 2024, 4 PM, IST.pdf
Kantar AI Summit- Under Embargo till Wednesday, 24th April 2024, 4 PM, IST.pdf
 
9654467111 Call Girls In Munirka Hotel And Home Service
9654467111 Call Girls In Munirka Hotel And Home Service9654467111 Call Girls In Munirka Hotel And Home Service
9654467111 Call Girls In Munirka Hotel And Home Service
 
Data Science Jobs and Salaries Analysis.pptx
Data Science Jobs and Salaries Analysis.pptxData Science Jobs and Salaries Analysis.pptx
Data Science Jobs and Salaries Analysis.pptx
 
GA4 Without Cookies [Measure Camp AMS]
GA4 Without Cookies [Measure Camp AMS]GA4 Without Cookies [Measure Camp AMS]
GA4 Without Cookies [Measure Camp AMS]
 
Call Girls In Dwarka 9654467111 Escorts Service
Call Girls In Dwarka 9654467111 Escorts ServiceCall Girls In Dwarka 9654467111 Escorts Service
Call Girls In Dwarka 9654467111 Escorts Service
 
Call Girls in Defence Colony Delhi 💯Call Us 🔝8264348440🔝
Call Girls in Defence Colony Delhi 💯Call Us 🔝8264348440🔝Call Girls in Defence Colony Delhi 💯Call Us 🔝8264348440🔝
Call Girls in Defence Colony Delhi 💯Call Us 🔝8264348440🔝
 
Call Girls in Saket 99530🔝 56974 Escort Service
Call Girls in Saket 99530🔝 56974 Escort ServiceCall Girls in Saket 99530🔝 56974 Escort Service
Call Girls in Saket 99530🔝 56974 Escort Service
 
Beautiful Sapna Vip Call Girls Hauz Khas 9711199012 Call /Whatsapps
Beautiful Sapna Vip  Call Girls Hauz Khas 9711199012 Call /WhatsappsBeautiful Sapna Vip  Call Girls Hauz Khas 9711199012 Call /Whatsapps
Beautiful Sapna Vip Call Girls Hauz Khas 9711199012 Call /Whatsapps
 
Dubai Call Girls Wifey O52&786472 Call Girls Dubai
Dubai Call Girls Wifey O52&786472 Call Girls DubaiDubai Call Girls Wifey O52&786472 Call Girls Dubai
Dubai Call Girls Wifey O52&786472 Call Girls Dubai
 

Intro.pptx

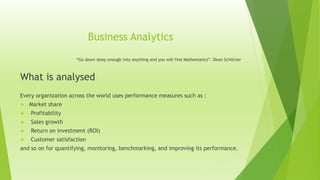
  • 1. Business Analytics “Go down deep enough into anything and you will find Mathematics”. Dean Schlicter What is analysed Every organization across the world uses performance measures such as :  Market share  Profitability  Sales growth  Return on investment (ROI)  Customer satisfaction and so on for quantifying, monitoring, benchmarking, and improving its performance.
  • 2. KPI It is important for organizations to understand the association between key performance indicators (KPIs) and factors that have a significant impact on the KPIs for effective management
  • 3. How it is analyzed  Analytics is a body of knowledge consisting of statistical, mathematical, and operations research techniques; artificial intelligence techniques such as machine learning and deep learning algorithms; data collection and storage; data management processes such as data extraction, transformation, and loading (ETL); and computing and big data technologies such as Hadoop, Spark, and Hive that create value by developing actionable items from data.
  • 4. Why?  Two primary macro-level objectives of analytics are problem solving and decision making.  Analytics helps organizations to create value by solving problems effectively and assisting in decision making.  Today, analytics is used as a competitive strategy by many organizations such as Amazon, Apple, General Electric, Google, Facebook and Procter and Gamble who use analytics to create products and solutions.
  • 5. Some references  Marshall (2016) and MacKenzie et al. (2013) reported that Amazon’s recommender systems resulted in a sales increase of 35%.  Davenport and Harris (2007) and Hopkins et al. (2010) reported that there was a high correlation between use of analytics and business performance. They claimed that the majority of high performers (measured in terms of profit, shareholder return and revenue, etc.) strategically apply analytics in their daily operations, as compared to low performers.
  • 6. Why?  Herbert Simon (bounded rationality)  Travelling Salesman Problem of 
  • 7. Why? In 2015, through their Vasanthapura kitchen in Bangalore, approximately 84000 school children from 650 schools in South Bangalore were provided mid-day meals. Providing high quality food at an affordable price is one of the challenges faced by Akshaya Patra. The Vasanthapura kitchen used 35 vehicles to distribute the cooked food. To minimize the cost of distribution, they need to solve a complex vehicle routing problem (VRP). To simplify this problem, assume that they divide the number of schools equally among the vehicles; each vehicle would then have to deliver food to approximately 20 schools (few vehicles are kept as standby). For each vehicle, we need to find the best route. This problem can be formulated as a TSP with a solution space of 20 factorial (20! =2.4329 × 10¹⁸).
  • 8. Why?  Or think about:  Montey Hall Problem**  ** last slide
  • 9. Why?  Because BA is Good for all sizes(akshay patra by the way is small to medium and Walmart is equivalent to GDP of 28th country in the world)  The human mind lacks the ability to choose the right decisions due to the complexity of the problems that the organizations are facing and the limited time available for decision making.  Even ERP was enabled to perform Analytics(SAP HANA)
  • 10. Level of Decision Making A typical DDDM Process uses the following steps : 1. Identify the problem or opportunity for value creation. 2. Identify sources of data (primary as well secondary data sources). 3. Pre-process the data for issues such as missing and incorrect data. Generate derived variables and transform the data if necessary. Prepare the data for analytics model building. 4. Divide the data sets into subsets training and validation data sets. 5. Build analytical models and identify the best model(s) using model performance in validation data. 6. Implement Solution/Decision/Develop Product.
  • 11. Levels…….  BA helps from the Bottom of pyramid (i.e. solution of trivial problem) and to the top (i.e. handling strategy)
  • 12. Types  Business analytics can be grouped into three types:  descriptive analytics  predictive analytics, and  prescriptive analytics.
  • 13. Descriptive Analytics  Descriptive analytics is the simplest form of analytics that mainly uses simple descriptive statistics, data visualization techniques, and business related queries to understand past data.  One of the primary objectives of descriptive analytics is innovative ways of data summarization. Descriptive analytics is used for understanding the trends in past data which can be useful for generating insights.  The next Figure shows visualization of relationship break-ups reported in Facebook.
  • 14. Jan Feb March - - -july - - Dec
  • 15. DA  The fact that there is a significant increase in breakups during December we can deduce  the following insights (or possibilities):  1. There will be more traffic to online dating sites during December/January.  2. There will be greater demand for relationship counsellors and lawyers.  3. There will be greater demand for housing and the housing prices are likely to increase in  December/January.  4. There will be greater demand for household items.  5. People would like to forget the past, so they might change the brand of beer they drink.
  • 16. Examples of DA  The following are a few examples of insights obtained using descriptive analytics reported in literature:  1. Most shoppers turn towards the right side when they enter a retail store (Underhill, 2009, pages  77−79). Retailers keep products with higher profit on the right side of the store since most people  turn right.  2. Married men who kiss their wife before going to work live longer, earn more and get into less  number of accidents as compared to those who do not (Foer, 2006).  3. Correlated with Facebook relationship breakups, divorces spike in January. According to  Caroline Kent (2015), January 3 is nicknamed ‘divorce day’.  4. Men are more reluctant to use coupons as compared to women (Hu and Jasper, 2004). While sending coupons, retailers should target female shoppers as they are more likely to use coupons.  Classic  JON SNOW(Cholera using DV) Snow established that water contamination was the main source of cholera.
  • 17. Predictive Analytics If you torture the data long enough, it will confess. Ronald Coase It aims to predict the probability of occurrence of a future event such as,  Customer churn,  Employee attrition  Forecasting demand for products/services  Loan defaults,  Fraudulent transactions,  Insurance claim, and  Stock market fluctuations.
  • 18. Examples  Irrespective of the type of business, organizations would like to forecast the demand for their products or services and understand the causes of demand fluctuations. The use of predictive analytics can reveal relationships that were previously unknown and are not intuitive.  The use of predictive analytics:  Polyphonic HMI Predicts whether a song will be a hit using machine learning algorithms. Their product ‘Hit Song Science’ uses mathematical and statistical techniques to predict the success of a song on a scale of 1 to 10 (Anon, 2003).  Amazon.com Uses predictive analytics to recommend products to their customers. It is reported that 35% of Amazon’s sales is achieved through their recommender system (Siegel, 2013, MacKinzie et al., 2013).  Netflix Predicts which movie their customer is likely to watch next (Greene, 2006). 75% of what customer watch at Netflix is from product recommendations (MacKinzie et al., 2013
  • 19. Prescriptive Analytics  Prescriptive analytics is the highest level of analytics capability which is used for choosing optimal actions once an organization gains insights through descriptive and predictive analytics.  In many cases, prescriptive analytics is solved as a separate optimization problem. Prescriptive analytics assists users in finding the optimal solution to a problem or in making the right choice/decision among several alternatives.  Operations Research (OR) techniques form the core of prescriptive analytics. Apart from operations research techniques, machine learning algorithms, meta heuristics, and advanced statistical models are used in prescriptive analytics. 
  • 20. Predictive Analytics  The most frequently used predictive analytics techniques are regression, logistic regression, classification trees, forecasting, K-nearest neighbours, Markov chains, random forest, boosting, and neural networks.  The frequently used tools in prescriptive analytics are linear programming, integer programming, multi-criteria decision-making models such as goal programming and analytic hierarchy process, combinatorial optimization, non-linear programming, and meta-heuristics
  • 21. BA VS BI  BI is a set of systems and technologies used by enterprises to visualize and share operational business data. BI can reveal trends and patterns in data that would otherwise remain obscure. Enterprises can use the reporting and visualization capabilities of BI to operate more efficiently and obtain valuable insights.  BA is the use of historical business data and statistical models to better predict why things happen within a business. These models can help determine causality and make predictions about future events. BA is more about statistical extrapolation than static analysis. 
  • 22.
  • 23. Gate1 Gate2 Gate3 Stay Switch Goat Car Goat Goat Car Car Goat Goat Car Goat Goat Goat Car Goat Car Suppose you select gate 1(you cant see what is inside). An item is shown to you by monty from any one of the gate 2 and gate 3(definitely he will show you goat). You have to decide whether to stay with the door or switch. Always switching is better with 2/3 probability