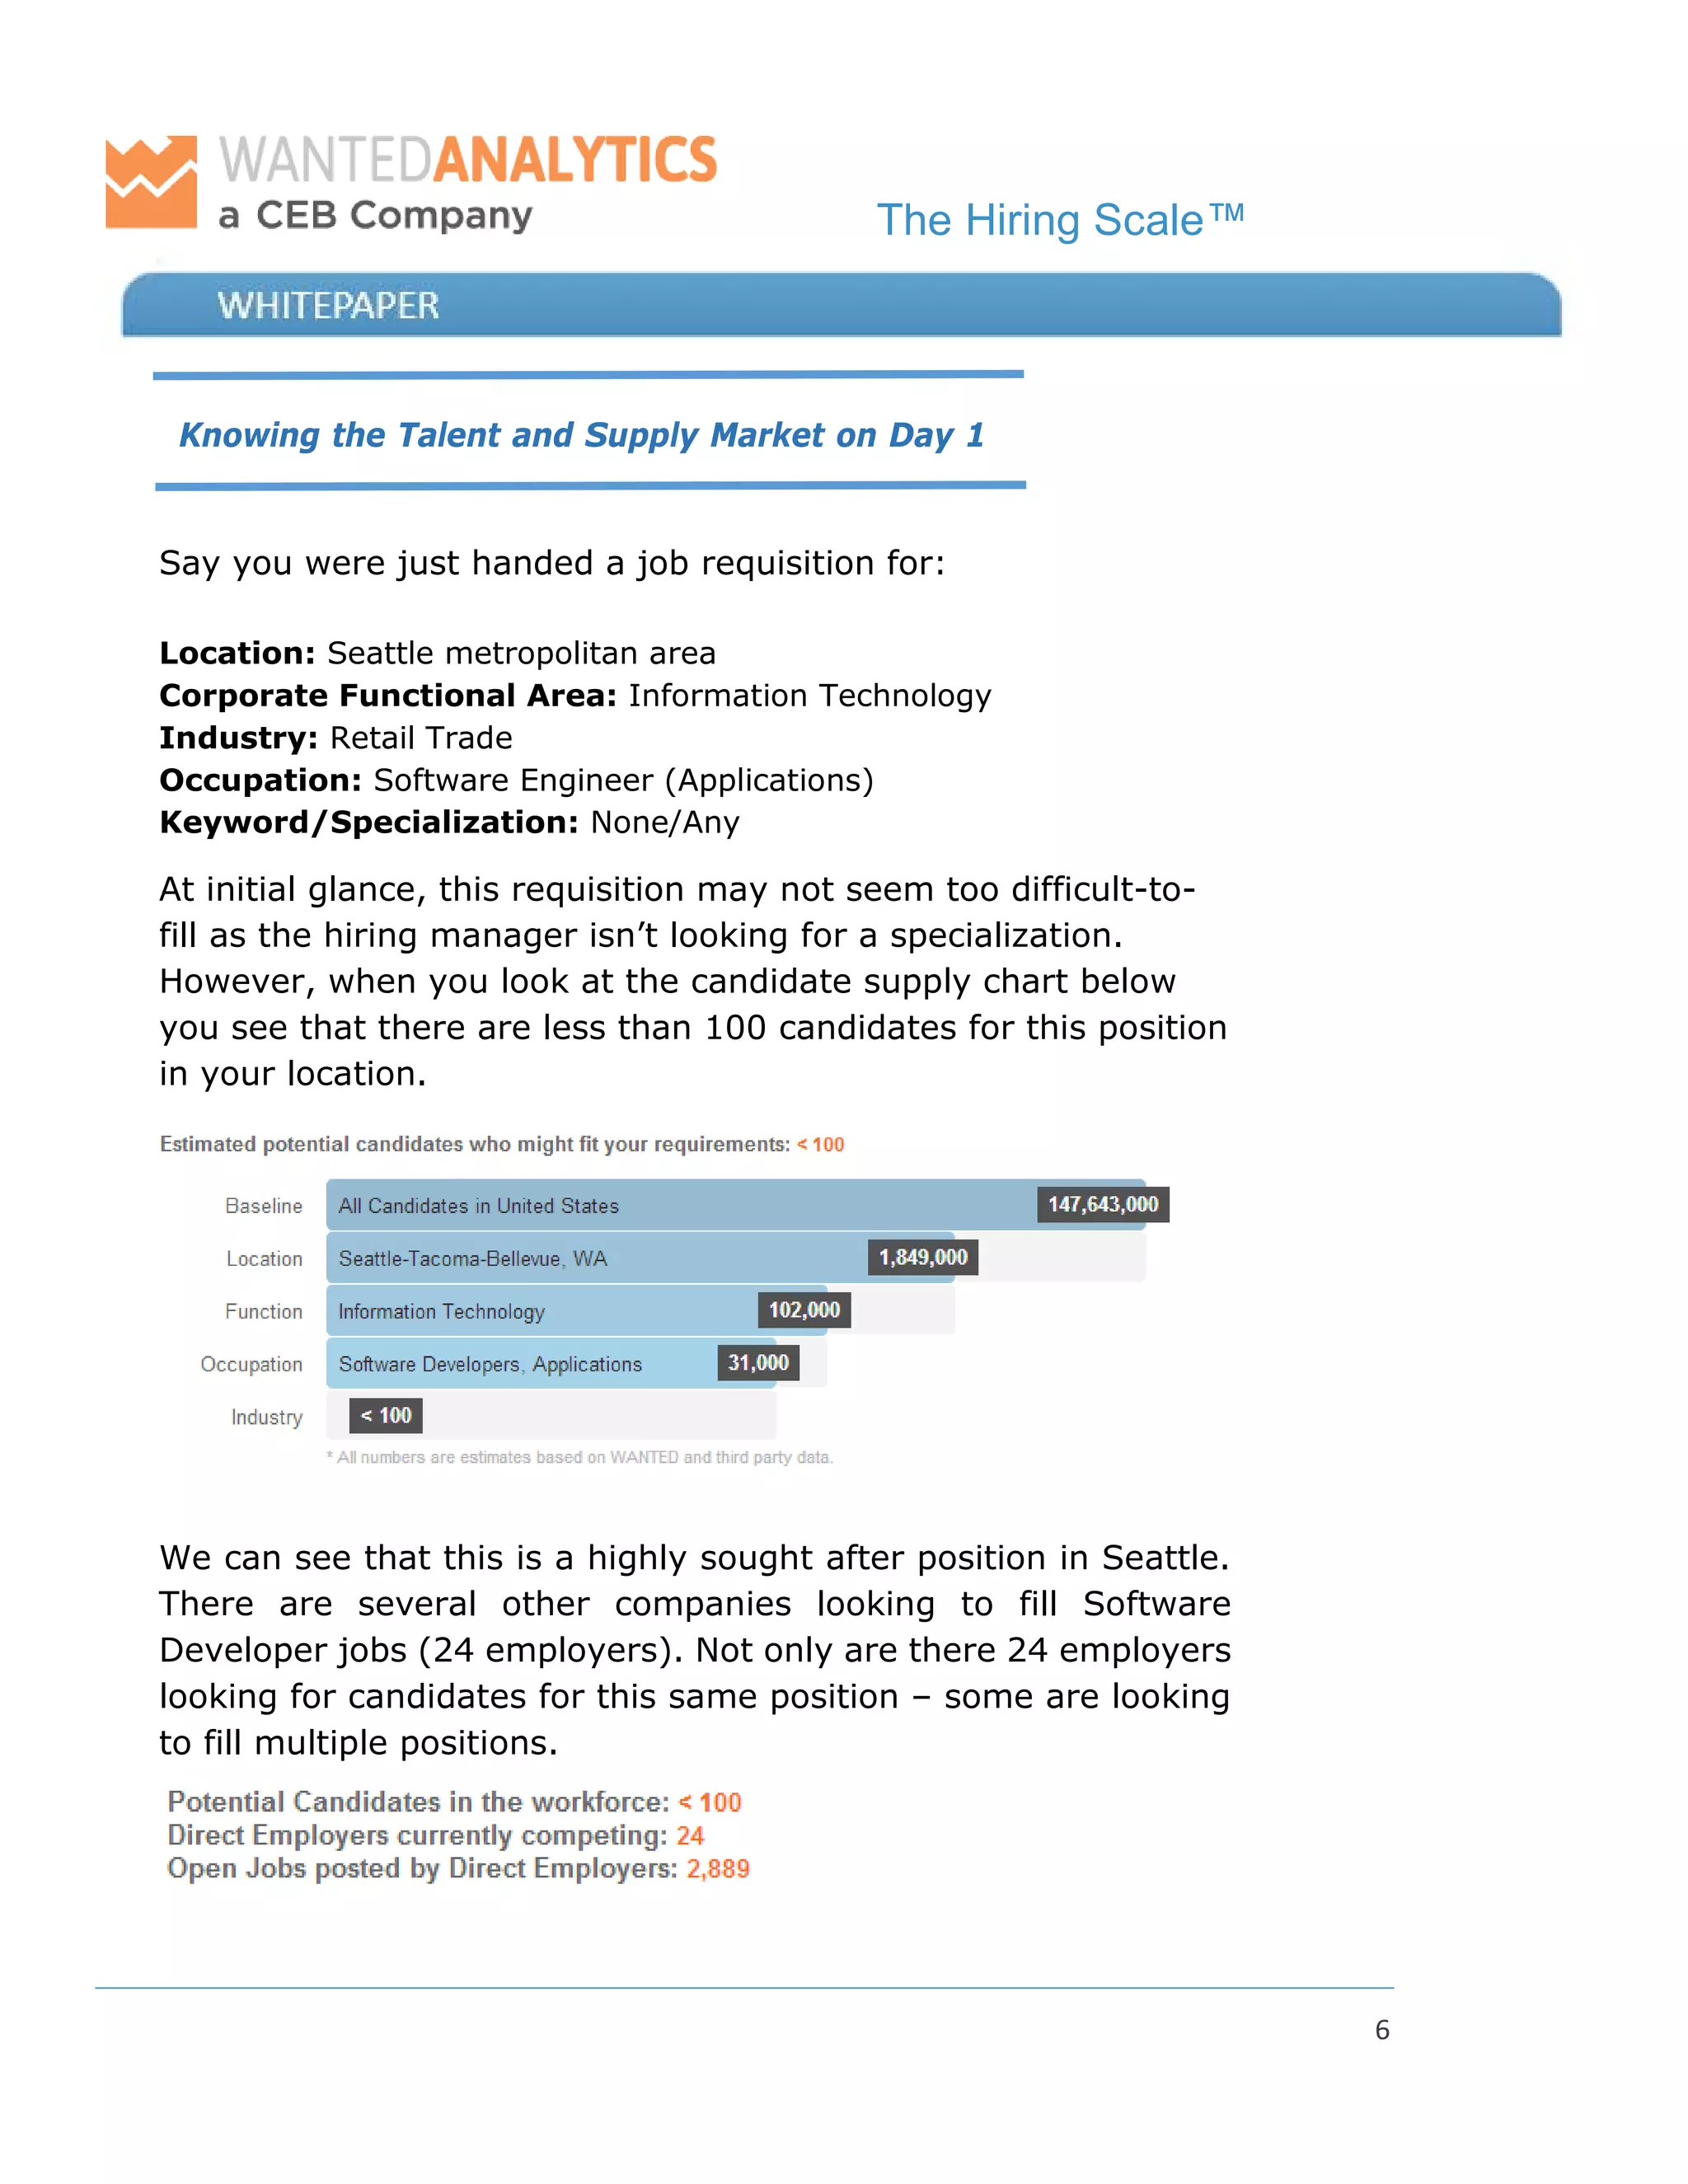
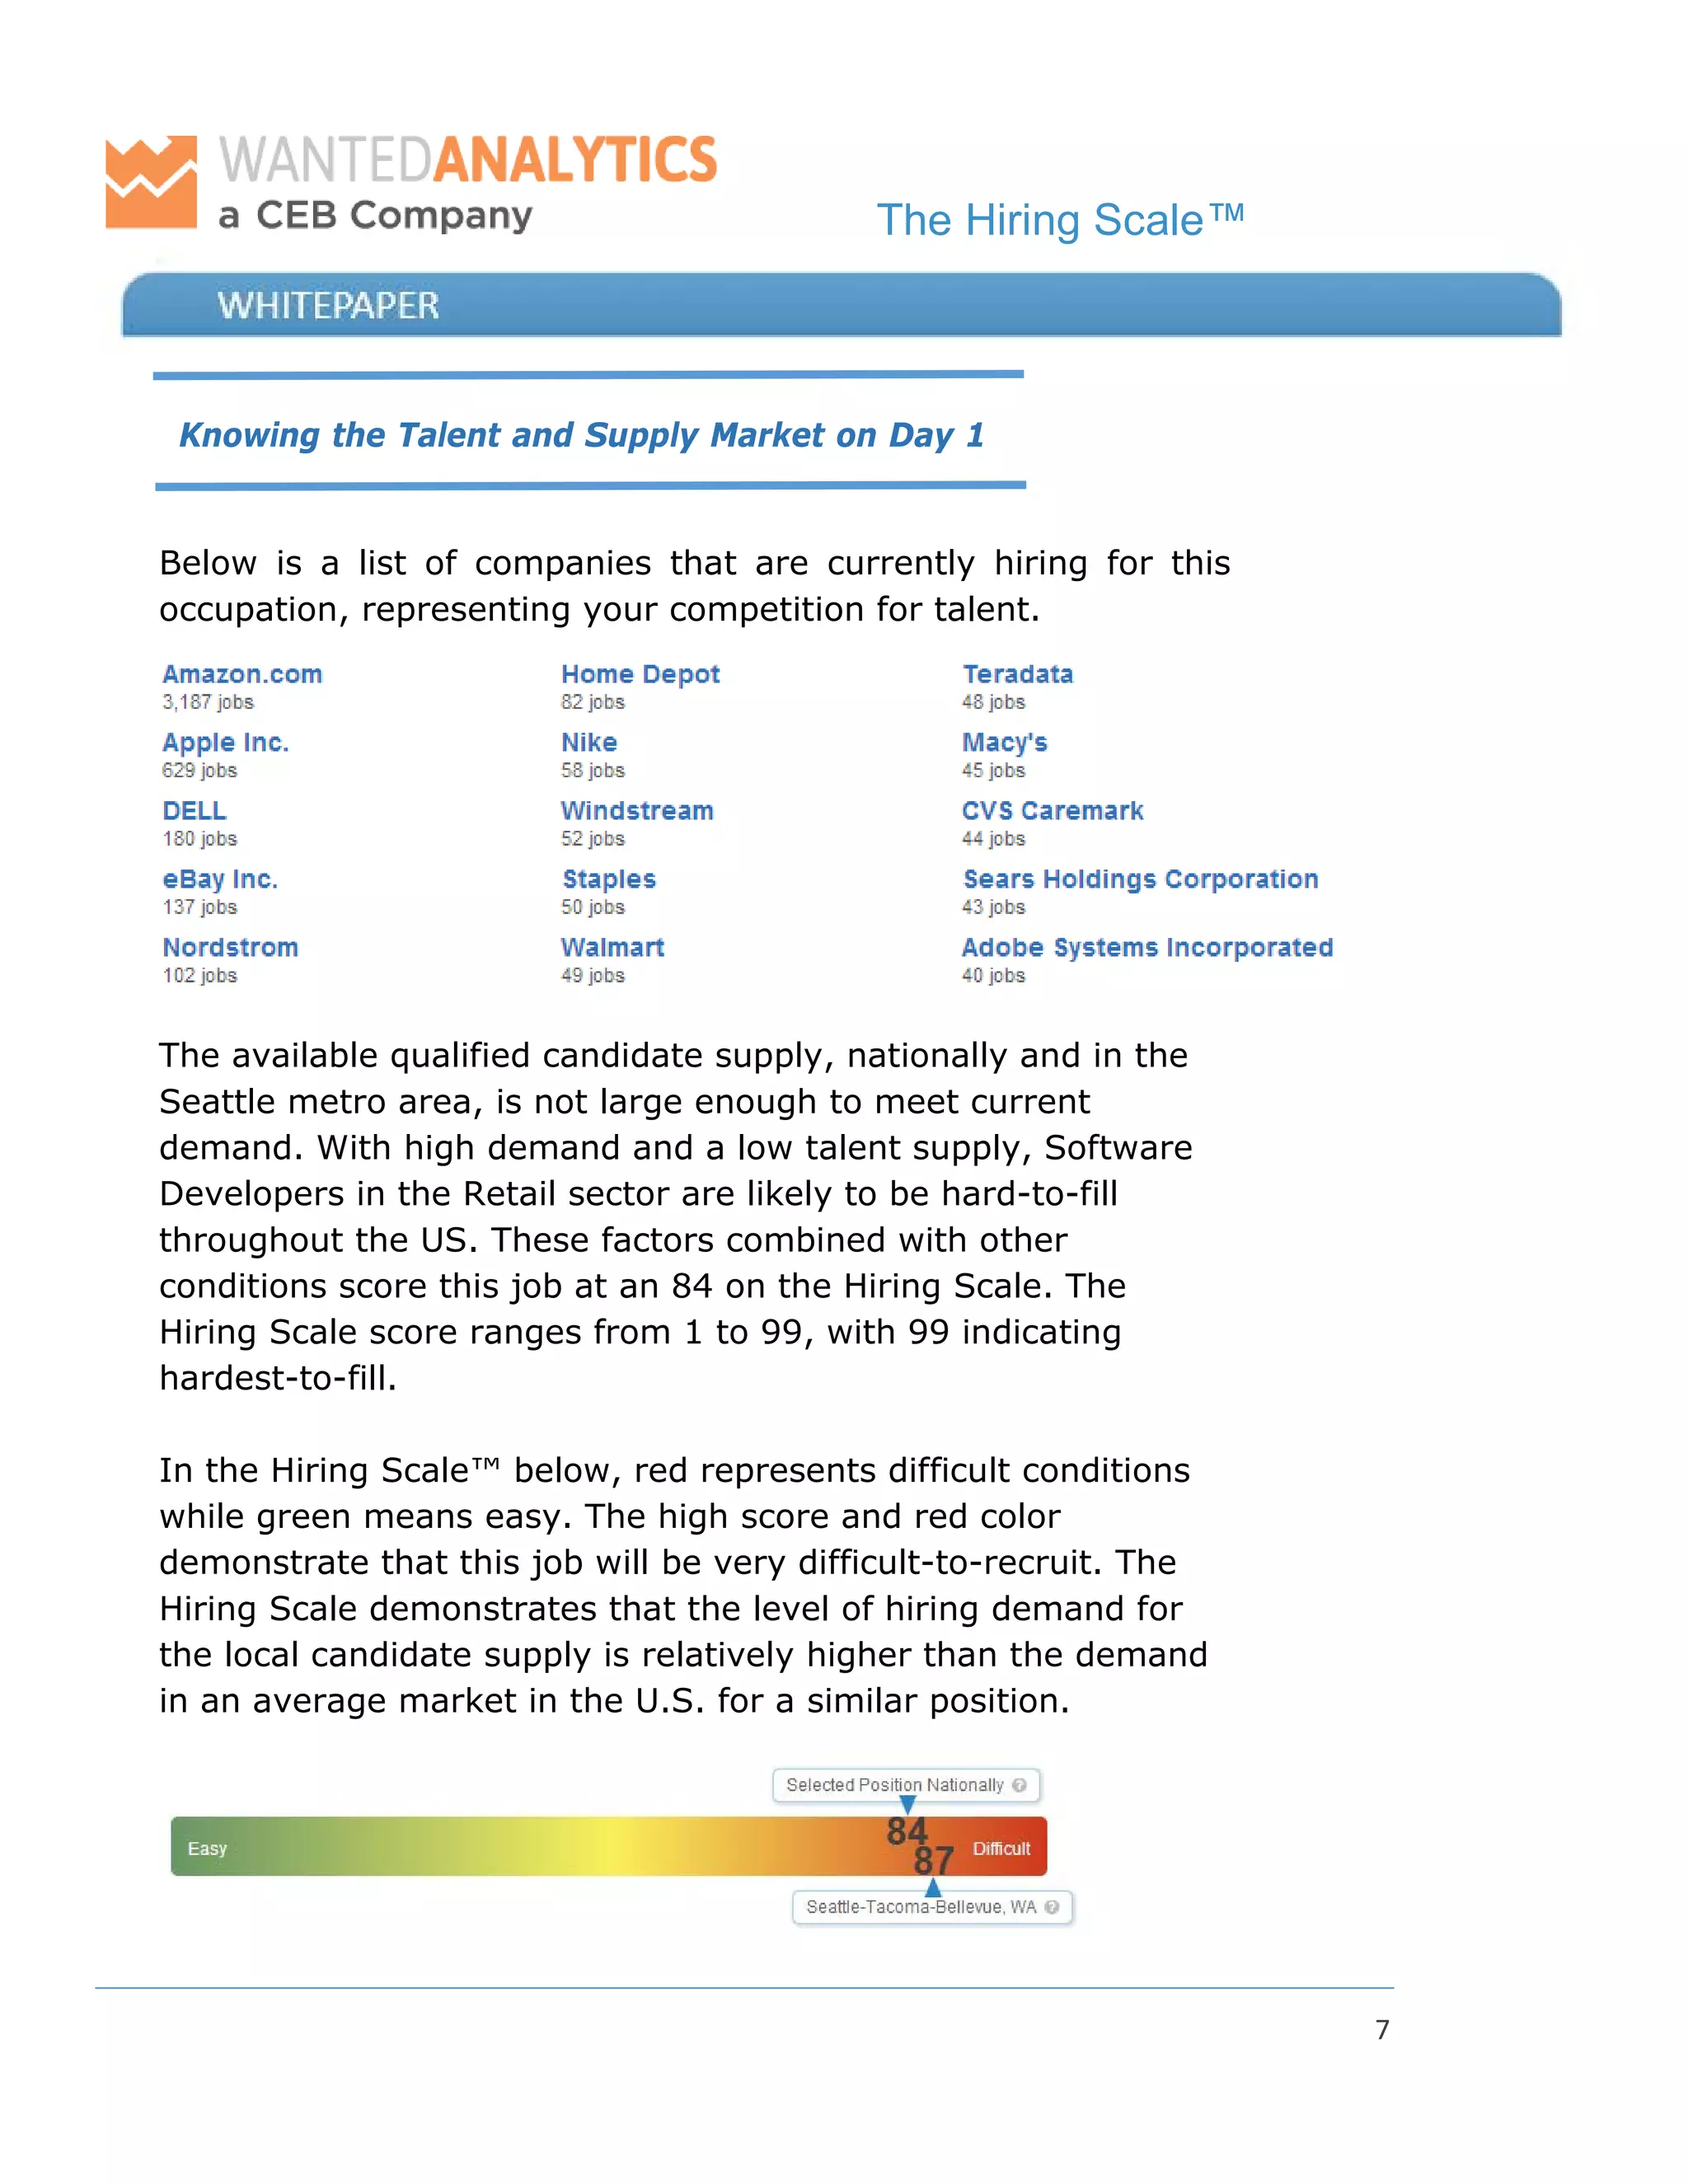
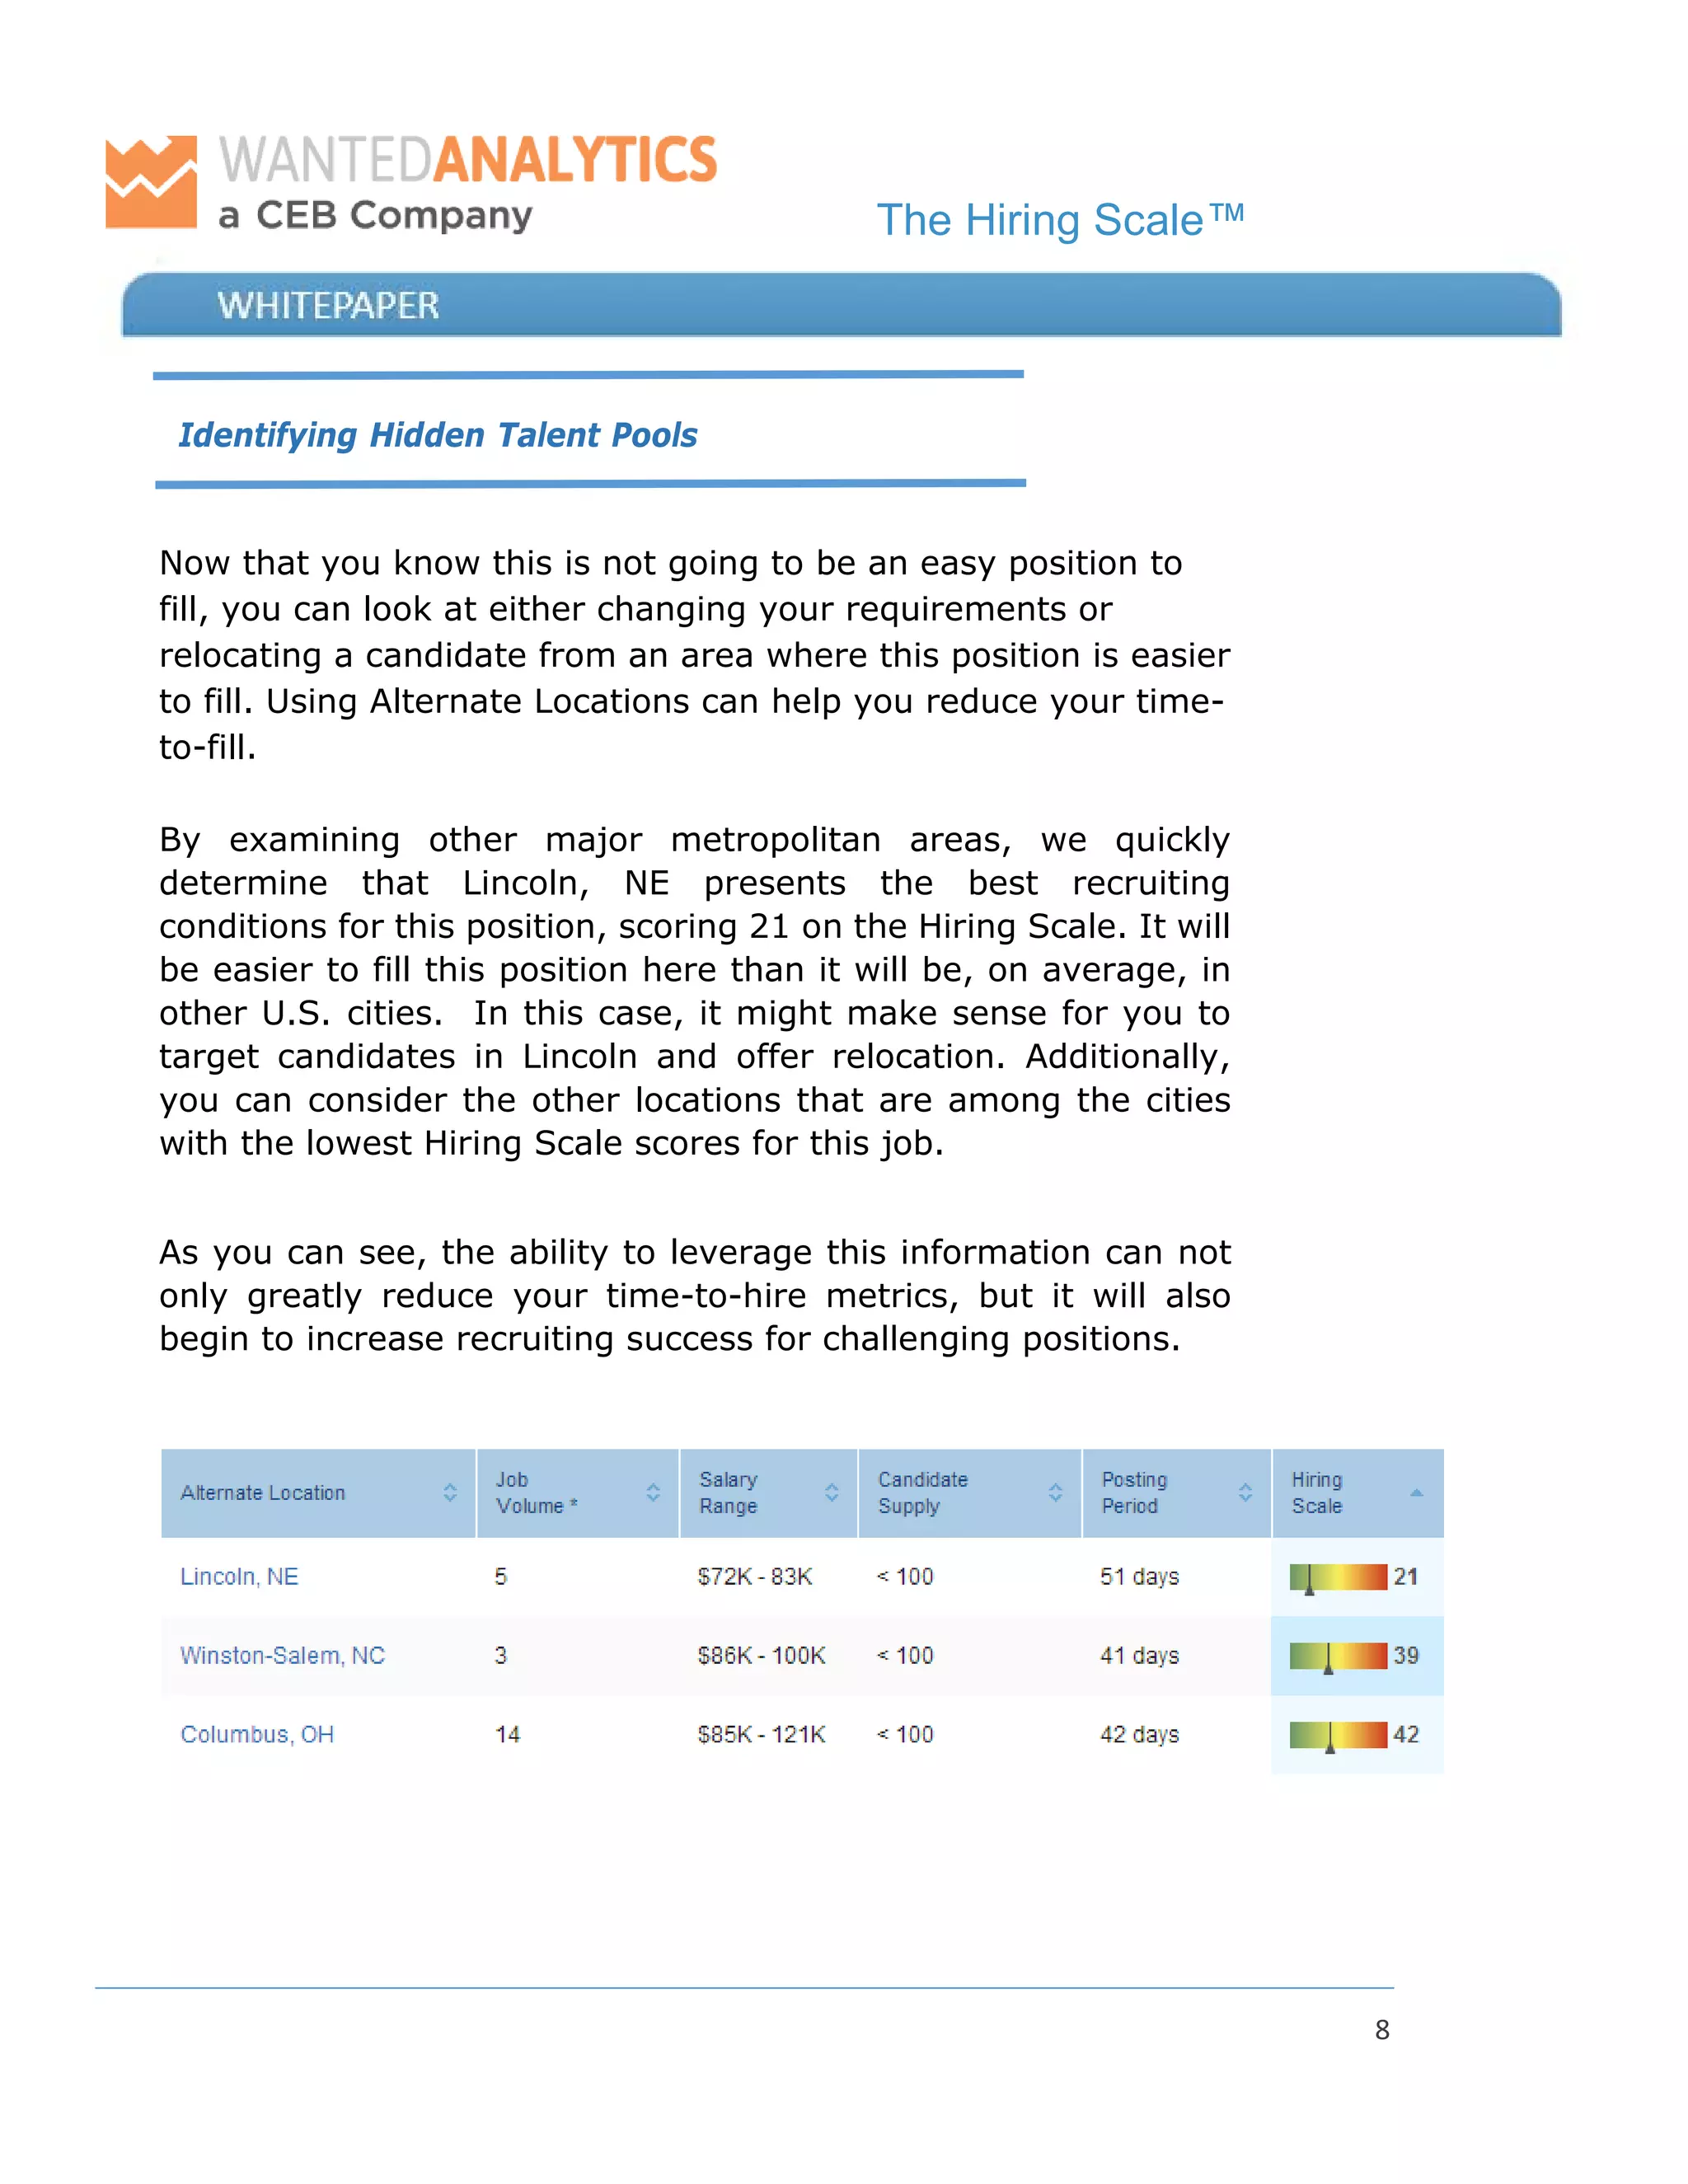
1
The Hiring Scale™: Reduce Your Recruiting
Costs and Increase Your Success Rate
Introduction
About 20% of jobs are difficult to fill, based on data from
WANTED Analytics, a CEB Company. On top of the current
challenges in recruiting, ERE’s State of Recruiting Survey shows
that 30% of Recruiters expect hiring difficulty to increase in
2015. The length of time it takes to fill a job and the cost-per-
hire will also increase. If you’re recruiting for technical,
manufacturing, skilled trades, healthcare, transportation, and
engineering jobs, you already know recruiting is likely to be
difficult. Add specialized skills, like evolving technology, and
filling open seats becomes even more challenging.
This whitepaper describes how HR professionals use hiring
demand and talent supply data to make strategic business
decisions and address their workforce problems.
The Hiring Scale™
2
Copyright Notice:
All data, tables or reports attached are protected under U.S.,
Canadian and international copyright laws and treaties:
Copyright © 2015 WANTED Analytics, a CEB Company.
Various trademarks and tradenames referenced herein
are the property of their respective owners.
It is strictly forbidden for any party other than the holder of
the copyright, or its affiliates, to: reproduce this work in copies;
display this copyrighted work publicly; prepare derivative works
based upon this work; distribute copies of this work to the
public by sale or other transfer of ownership; distribute copies
of this work to the public by rental, lease, or lending.
Disclaimer:
WANTED Analytics has made and will make reasonable efforts to
ensure that its data and analysis are complete and accurate.
However, WANTED Analytics does not warrant their
completeness or accuracy and does not warrant that the
Subscriber's use of the Services will be uninterrupted or error
free, or that the results obtained will be useful or will satisfy
the Subscribers requirements.
WANTED Analytics makes no other warranties or
representations of any kind, either express or implied,
including but not limited to, warranties of design,
merchantability or fitness for a particular purpose, non‐
infringement, or arising from a course of dealing, usage or
trade practice.
The Hiring Scale™
3
The Requisition
Imagine that you were handed a job requisition two months ago.
You’ve spent sixty days hitting your usual go-to sources and
combing through databases of candidates, but the position is
unfilled and you find yourself struggling. Why is this job so hard-
to-fill? Are there other companies looking to fill similar positions?
Are there enough candidates out there to fill these positions?
What if you had a simple chart that could tell you the difficulty
of filling any position? Perhaps, a number score that compares
the difficulty of filling your position in your area and across the
US? If you had initially seen that this position would be
challenging to fill on day one, how would your recruiting
strategy have been different?
The Hiring Scale™
4
Connecting Supply & Demand
At an extremely basic level, filling a job is a function of supply
(the number of qualified candidates available) and demand (the
number of open positions.) Of course, much more goes into filling
positions, like the number of employers currently hiring, local
unemployment rates, pay level offered for the position, average
job board posting time, and job board quality.
However, at a basic level, comparing candidate supply and hiring
demand gives you a baseline understanding of how challenging
a position will be to fill. The combination of low supply and high
demand guarantees that the position will be hard-to-fill. Hard-
to-fill positions will not only cost the business more in terms of
compensation, but they will take Recruiters more time and effort
to fill.
Once you know the challenges in filling a position, you can
develop a strategy to fill the position in the most time-effective
(and cost-effective) manner.
The Hiring Scale™
5
Measuring Supply & Demand
We arrive at a measure of candidate supply by estimating the
number and type of employees that are currently in the active
workforce. The supply numbers combine data from the Bureau
of Labor Statistics’ annual Occupational Employment Survey with
WANTED Analytics’ proprietary algorithm. By combining these
data-sets, we can build an accurate picture of just how many
people there are in a location based upon their occupation, job
title, and industry.
When you measure supply — the number of people capable of
filling a position — you start by defining the geographical area
that you are interested in, and then refine your requirements. As
you refine the requirements for the position in more detail, the
number of suitable candidates begins to decrease.
The volume of candidates (supply) is only the first part of the
equation – hiring demand is another piece. “Demand” starts with
employers – the “buyers” who are looking for employees. How
much demand is there?
Since 2005, WANTED Analytics has been collecting and saving
every online job advertisement that has appeared on job boards
and corporate recruitment sites. By tracking every online ad that
has been posted, WANTED Analytics can measure the level of
demand for any occupation, by any company in any location in
the United States, at any time.
The Hiring Scale™
6
Knowing the Talent and Supply Market on Day 1
Say you were just handed a job requisition for:
Location: Seattle metropolitan area
Corporate Functional Area: Information Technology
Industry: Retail Trade
Occupation: Software Engineer (Applications)
Keyword/Specialization: None/Any
At initial glance, this requisition may not seem too difficult-to-
fill as the hiring manager isn’t looking for a specialization.
However, when you look at the candidate supply chart below
you see that there are less than 100 candidates for this position
in your location.
We can see that this is a highly sought after position in Seattle.
There are several other companies looking to fill Software
Developer jobs (24 employers). Not only are there 24 employers
looking for candidates for this same position – some are looking
to fill multiple positions.
The Hiring Scale™
7
Knowing the Talent and Supply Market on Day 1
Below is a list of companies that are currently hiring for this
occupation, representing your competition for talent.
The available qualified candidate supply, nationally and in the
Seattle metro area, is not large enough to meet current
demand. With high demand and a low talent supply, Software
Developers in the Retail sector are likely to be hard-to-fill
throughout the US. These factors combined with other
conditions score this job at an 84 on the Hiring Scale. The
Hiring Scale score ranges from 1 to 99, with 99 indicating
hardest-to-fill.
In the Hiring Scale™ below, red represents difficult conditions
while green means easy. The high score and red color
demonstrate that this job will be very difficult-to-recruit. The
Hiring Scale demonstrates that the level of hiring demand for
the local candidate supply is relatively higher than the demand
in an average market in the U.S. for a similar position.
The Hiring Scale™
8
Identifying Hidden Talent Pools
Now that you know this is not going to be an easy position to
fill, you can look at either changing your requirements or
relocating a candidate from an area where this position is easier
to fill. Using Alternate Locations can help you reduce your time-
to-fill.
By examining other major metropolitan areas, we quickly
determine that Lincoln, NE presents the best recruiting
conditions for this position, scoring 21 on the Hiring Scale. It will
be easier to fill this position here than it will be, on average, in
other U.S. cities. In this case, it might make sense for you to
target candidates in Lincoln and offer relocation. Additionally,
you can consider the other locations that are among the cities
with the lowest Hiring Scale scores for this job.
As you can see, the ability to leverage this information can not
only greatly reduce your time-to-hire metrics, but it will also
begin to increase recruiting success for challenging positions.
The Hiring Scale™
9
In a commercial economy when supply and demand get out of
balance, too much supply means pricing is likely to fall and too
much demand means prices are likely to rise. When supply and
demand are in balance, then prices are stable.
The same rules of supply and demand operate in the talent
marketplace. When there is too much demand for skill,
employers have to not only pay more to the employee, but also
expend more effort and time to find that candidate. In other
words, prices — or salaries plus time and effort — go up. And
when there is too much supply — more candidates than there
are jobs — cost (salaries plus time and effort) goes down.
As someone working in the talent marketplace, you have
probably noticed this. During the dot-com era, there was
excessive demand for technical workers who understood how to
program for the Internet. That was a period of excessive demand
for limited supply. It was a good time to be a programmer
working for a dot-com, yet a challenge for companies looking to
fill open positions.
On the other hand, if you were trained as an auto manufacturing
assembly line worker, the last twenty years have shown what
happens when there is more supply than demand. There are not
enough jobs for auto workers in places like Detroit—too much
supply and not enough demand. A Recruiter in Detroit who
receives this job requisition would experience less difficulty
finding candidates to fill this position than a Recruiter who was
looking for technical workers during the dot-com era.
Talent Marketplace in terms of supply and demand can help you
make better decisions faster. This is a form of “business
intelligence.”
The Hiring Scale™
10
Hiring Scale Factors
Once we get over these basic equations of “supply” and
“demand” situations, we then look at other market factors. This
enables the Hiring Scale to become more dependent on real-
time and dynamic local market-place environments.
The other factors that contribute to the Hiring Scale scores are
as follows:
i) Employer Counts: If there are more employers competing to
fill similar positions in the same market at the same time, you
will see a higher level of difficulty in the Hiring Scale.
ii) Unemployment Rates: Every month, the unemployment
rates in local markets change. The higher the rate of
unemployment, the easier it is to find candidates as there are
likely more people looking for jobs. The lower the
unemployment rate, the more challenging it is likely to be for
Recruiters to find candidates.
iii) Salary Level: The pay advertised in a posting, when
compared to the estimated salary modeled by WANTED
Analytics, will influence the Hiring Scale™ Scores. The higher
the salary, the easier it will be to attract candidates.
Conversely, the lower the salary, the more challenging it may
be to attract candidates.
The Hiring Scale™
11
Hiring Scale Factors
iv) Average Posting Period: The length of time a job ad is
posted is also taken into consideration. Some job ads remain on
job boards longer than average because employers experience
difficulties in getting sufficient and suitable candidates. If a
particular occupation tends be listed for a longer period of time
then the position is likely to be more challenging to fill.
v) Job Board Source: Finally, there are differences in quality
among job boards. Some job boards only take paid job ads and
have a national reach, while some are free, and others are local
or regional with a smaller reach. Not all job ads should be
viewed the same way since reach and quality of the job board
audience are not always the same.
All of these factors are considered in calculating the Hiring
Scale so that it is robust, dynamic, and real-time. The Hiring
Scale is recalculated in real-time as new job ads come on the
market and old job ads are removed.
The Hiring Scale™
12
Conclusion
We have described in this paper a new way to look at the talent
marketplace by using hiring demand and talent supply data to
make strategic business decisions and address workforce
problems. The interplay between supply and demand that
drives the market directly impacts decisions about how you will
spend your time or advise your clients. This is the kind of
“business intelligence” that increases the credibility and value
of all professionals working in this industry.
ABOUT THE HIRING SCALE™
The Hiring Scale™ offers detailed insight into the supply and
demand for workers of any type in the United States. It creates
a simple supply and demand measurement that allows Recruiters
to:
 Easily identify positions with a limited supply of candidates
 Discover which companies are competing for the same
candidates
 Recognize the specific strengths and weaknesses in the
current recruiting strategy for a specific job requisition or
locale
 Improve productivity and dramatically cut time-to-hire
metrics by removing the guesswork from the process
The Hiring Scale™
13
ABOUT WANTED Analytics™
In November 2015, WANTED Analytics became a CEB company. CEB (NYSE:
CEB) is a best practice insight and technology company that partners with its
customers to develop innovative solutions that unlock their potential and help
them grow. When fully integrated, the WANTED Analytics and CEB Talent
Strategy & Analytics offerings will help businesses leverage talent intelligence for
more impactful recruiting and workforce planning.
WANTED Analytics™ combines real-time, global business intelligence with
years of hiring demand and talent supply data to help make better strategic
business decisions.
WANTED Analytics is also the exclusive data provider for The Conference
Board’s Help Wanted OnLine Data Series®, the monthly economic
indicator of Hiring Demand in the United States.
WANTED Analytics began collecting detailed Hiring Demand data in October
2002, and currently maintains a database of more than one billion unique job
listings.

Whitepaper_HiringScale_2014 - Updated

  • 1.
    1 The Hiring Scale™:Reduce Your Recruiting Costs and Increase Your Success Rate Introduction About 20% of jobs are difficult to fill, based on data from WANTED Analytics, a CEB Company. On top of the current challenges in recruiting, ERE’s State of Recruiting Survey shows that 30% of Recruiters expect hiring difficulty to increase in 2015. The length of time it takes to fill a job and the cost-per- hire will also increase. If you’re recruiting for technical, manufacturing, skilled trades, healthcare, transportation, and engineering jobs, you already know recruiting is likely to be difficult. Add specialized skills, like evolving technology, and filling open seats becomes even more challenging. This whitepaper describes how HR professionals use hiring demand and talent supply data to make strategic business decisions and address their workforce problems.
  • 2.
    The Hiring Scale™ 2 CopyrightNotice: All data, tables or reports attached are protected under U.S., Canadian and international copyright laws and treaties: Copyright © 2015 WANTED Analytics, a CEB Company. Various trademarks and tradenames referenced herein are the property of their respective owners. It is strictly forbidden for any party other than the holder of the copyright, or its affiliates, to: reproduce this work in copies; display this copyrighted work publicly; prepare derivative works based upon this work; distribute copies of this work to the public by sale or other transfer of ownership; distribute copies of this work to the public by rental, lease, or lending. Disclaimer: WANTED Analytics has made and will make reasonable efforts to ensure that its data and analysis are complete and accurate. However, WANTED Analytics does not warrant their completeness or accuracy and does not warrant that the Subscriber's use of the Services will be uninterrupted or error free, or that the results obtained will be useful or will satisfy the Subscribers requirements. WANTED Analytics makes no other warranties or representations of any kind, either express or implied, including but not limited to, warranties of design, merchantability or fitness for a particular purpose, non‐ infringement, or arising from a course of dealing, usage or trade practice.
  • 3.
    The Hiring Scale™ 3 TheRequisition Imagine that you were handed a job requisition two months ago. You’ve spent sixty days hitting your usual go-to sources and combing through databases of candidates, but the position is unfilled and you find yourself struggling. Why is this job so hard- to-fill? Are there other companies looking to fill similar positions? Are there enough candidates out there to fill these positions? What if you had a simple chart that could tell you the difficulty of filling any position? Perhaps, a number score that compares the difficulty of filling your position in your area and across the US? If you had initially seen that this position would be challenging to fill on day one, how would your recruiting strategy have been different?
  • 4.
    The Hiring Scale™ 4 ConnectingSupply & Demand At an extremely basic level, filling a job is a function of supply (the number of qualified candidates available) and demand (the number of open positions.) Of course, much more goes into filling positions, like the number of employers currently hiring, local unemployment rates, pay level offered for the position, average job board posting time, and job board quality. However, at a basic level, comparing candidate supply and hiring demand gives you a baseline understanding of how challenging a position will be to fill. The combination of low supply and high demand guarantees that the position will be hard-to-fill. Hard- to-fill positions will not only cost the business more in terms of compensation, but they will take Recruiters more time and effort to fill. Once you know the challenges in filling a position, you can develop a strategy to fill the position in the most time-effective (and cost-effective) manner.
  • 5.
    The Hiring Scale™ 5 MeasuringSupply & Demand We arrive at a measure of candidate supply by estimating the number and type of employees that are currently in the active workforce. The supply numbers combine data from the Bureau of Labor Statistics’ annual Occupational Employment Survey with WANTED Analytics’ proprietary algorithm. By combining these data-sets, we can build an accurate picture of just how many people there are in a location based upon their occupation, job title, and industry. When you measure supply — the number of people capable of filling a position — you start by defining the geographical area that you are interested in, and then refine your requirements. As you refine the requirements for the position in more detail, the number of suitable candidates begins to decrease. The volume of candidates (supply) is only the first part of the equation – hiring demand is another piece. “Demand” starts with employers – the “buyers” who are looking for employees. How much demand is there? Since 2005, WANTED Analytics has been collecting and saving every online job advertisement that has appeared on job boards and corporate recruitment sites. By tracking every online ad that has been posted, WANTED Analytics can measure the level of demand for any occupation, by any company in any location in the United States, at any time.
  • 6.
    The Hiring Scale™ 6 Knowingthe Talent and Supply Market on Day 1 Say you were just handed a job requisition for: Location: Seattle metropolitan area Corporate Functional Area: Information Technology Industry: Retail Trade Occupation: Software Engineer (Applications) Keyword/Specialization: None/Any At initial glance, this requisition may not seem too difficult-to- fill as the hiring manager isn’t looking for a specialization. However, when you look at the candidate supply chart below you see that there are less than 100 candidates for this position in your location. We can see that this is a highly sought after position in Seattle. There are several other companies looking to fill Software Developer jobs (24 employers). Not only are there 24 employers looking for candidates for this same position – some are looking to fill multiple positions.
  • 7.
    The Hiring Scale™ 7 Knowingthe Talent and Supply Market on Day 1 Below is a list of companies that are currently hiring for this occupation, representing your competition for talent. The available qualified candidate supply, nationally and in the Seattle metro area, is not large enough to meet current demand. With high demand and a low talent supply, Software Developers in the Retail sector are likely to be hard-to-fill throughout the US. These factors combined with other conditions score this job at an 84 on the Hiring Scale. The Hiring Scale score ranges from 1 to 99, with 99 indicating hardest-to-fill. In the Hiring Scale™ below, red represents difficult conditions while green means easy. The high score and red color demonstrate that this job will be very difficult-to-recruit. The Hiring Scale demonstrates that the level of hiring demand for the local candidate supply is relatively higher than the demand in an average market in the U.S. for a similar position.
  • 8.
    The Hiring Scale™ 8 IdentifyingHidden Talent Pools Now that you know this is not going to be an easy position to fill, you can look at either changing your requirements or relocating a candidate from an area where this position is easier to fill. Using Alternate Locations can help you reduce your time- to-fill. By examining other major metropolitan areas, we quickly determine that Lincoln, NE presents the best recruiting conditions for this position, scoring 21 on the Hiring Scale. It will be easier to fill this position here than it will be, on average, in other U.S. cities. In this case, it might make sense for you to target candidates in Lincoln and offer relocation. Additionally, you can consider the other locations that are among the cities with the lowest Hiring Scale scores for this job. As you can see, the ability to leverage this information can not only greatly reduce your time-to-hire metrics, but it will also begin to increase recruiting success for challenging positions.
  • 9.
    The Hiring Scale™ 9 Ina commercial economy when supply and demand get out of balance, too much supply means pricing is likely to fall and too much demand means prices are likely to rise. When supply and demand are in balance, then prices are stable. The same rules of supply and demand operate in the talent marketplace. When there is too much demand for skill, employers have to not only pay more to the employee, but also expend more effort and time to find that candidate. In other words, prices — or salaries plus time and effort — go up. And when there is too much supply — more candidates than there are jobs — cost (salaries plus time and effort) goes down. As someone working in the talent marketplace, you have probably noticed this. During the dot-com era, there was excessive demand for technical workers who understood how to program for the Internet. That was a period of excessive demand for limited supply. It was a good time to be a programmer working for a dot-com, yet a challenge for companies looking to fill open positions. On the other hand, if you were trained as an auto manufacturing assembly line worker, the last twenty years have shown what happens when there is more supply than demand. There are not enough jobs for auto workers in places like Detroit—too much supply and not enough demand. A Recruiter in Detroit who receives this job requisition would experience less difficulty finding candidates to fill this position than a Recruiter who was looking for technical workers during the dot-com era. Talent Marketplace in terms of supply and demand can help you make better decisions faster. This is a form of “business intelligence.”
  • 10.
    The Hiring Scale™ 10 HiringScale Factors Once we get over these basic equations of “supply” and “demand” situations, we then look at other market factors. This enables the Hiring Scale to become more dependent on real- time and dynamic local market-place environments. The other factors that contribute to the Hiring Scale scores are as follows: i) Employer Counts: If there are more employers competing to fill similar positions in the same market at the same time, you will see a higher level of difficulty in the Hiring Scale. ii) Unemployment Rates: Every month, the unemployment rates in local markets change. The higher the rate of unemployment, the easier it is to find candidates as there are likely more people looking for jobs. The lower the unemployment rate, the more challenging it is likely to be for Recruiters to find candidates. iii) Salary Level: The pay advertised in a posting, when compared to the estimated salary modeled by WANTED Analytics, will influence the Hiring Scale™ Scores. The higher the salary, the easier it will be to attract candidates. Conversely, the lower the salary, the more challenging it may be to attract candidates.
  • 11.
    The Hiring Scale™ 11 HiringScale Factors iv) Average Posting Period: The length of time a job ad is posted is also taken into consideration. Some job ads remain on job boards longer than average because employers experience difficulties in getting sufficient and suitable candidates. If a particular occupation tends be listed for a longer period of time then the position is likely to be more challenging to fill. v) Job Board Source: Finally, there are differences in quality among job boards. Some job boards only take paid job ads and have a national reach, while some are free, and others are local or regional with a smaller reach. Not all job ads should be viewed the same way since reach and quality of the job board audience are not always the same. All of these factors are considered in calculating the Hiring Scale so that it is robust, dynamic, and real-time. The Hiring Scale is recalculated in real-time as new job ads come on the market and old job ads are removed.
  • 12.
    The Hiring Scale™ 12 Conclusion Wehave described in this paper a new way to look at the talent marketplace by using hiring demand and talent supply data to make strategic business decisions and address workforce problems. The interplay between supply and demand that drives the market directly impacts decisions about how you will spend your time or advise your clients. This is the kind of “business intelligence” that increases the credibility and value of all professionals working in this industry. ABOUT THE HIRING SCALE™ The Hiring Scale™ offers detailed insight into the supply and demand for workers of any type in the United States. It creates a simple supply and demand measurement that allows Recruiters to:  Easily identify positions with a limited supply of candidates  Discover which companies are competing for the same candidates  Recognize the specific strengths and weaknesses in the current recruiting strategy for a specific job requisition or locale  Improve productivity and dramatically cut time-to-hire metrics by removing the guesswork from the process
  • 13.
    The Hiring Scale™ 13 ABOUTWANTED Analytics™ In November 2015, WANTED Analytics became a CEB company. CEB (NYSE: CEB) is a best practice insight and technology company that partners with its customers to develop innovative solutions that unlock their potential and help them grow. When fully integrated, the WANTED Analytics and CEB Talent Strategy & Analytics offerings will help businesses leverage talent intelligence for more impactful recruiting and workforce planning. WANTED Analytics™ combines real-time, global business intelligence with years of hiring demand and talent supply data to help make better strategic business decisions. WANTED Analytics is also the exclusive data provider for The Conference Board’s Help Wanted OnLine Data Series®, the monthly economic indicator of Hiring Demand in the United States. WANTED Analytics began collecting detailed Hiring Demand data in October 2002, and currently maintains a database of more than one billion unique job listings.