The CMO Survey - Highlights and Insights Report - Spring 2024
(White paper) weda 32 dredge seminar, a non nuclear density meter and mass flow system for dredging slurries
1. Proceedings, WEDA XXXII Technical Conference & TAMU 43 Dredging Seminar
A NON-NUCLEAR DENSITY METER & MASS FLOW
SYSTEM FOR DREDGING SLURRIES
R. H. Batey¹
ABSTRACT
This paper describes a continuous in-line Density Meter, primarily used for dredging and similar slurries in pipe sizes typically
from 50mm – 1000mm (2” to 40”) diameter. It is used for wet density or % dry solids.
The density meter is bi-directional and incorporates linear, accurate and direct sensing of mass per unit volume. It is a refreshing
alternative to costly and hazardous nuclear techniques, which hitherto have been the only practical choice available. The Density
Meter is vibration insensitive, environmentally friendly, buriable on land and roll compensated for dredging at sea. It is simple and
safe, so there are no expensive precautions or disposal of sources, no specialized safety officers, no wipe tests, and no third party
surveys necessary, resulting in significant savings per year.
The slurry is continuously weighed using a high resolution mass transducer as it passes through an obstruction free, flow tube,
which defines the continuous calibrated volume. The flow tube is flexible, such that the slurry mass is accurately transferred to the
mass transducer. However, the deflection is so small that the system is virtually solid state. The flow tube is of optimal length to
provide a true representation of the slurry being measured. The mass transducer interrogates the slurry mass 110 times per second
to ensure accurate and repeatable sensing, with fast response time. The flow tube also provides the necessary straight length of
upstream pipe for volumetric flow meters used for mass flow metering.
The Density Meter flow tube is surrounded by a pressure chamber, which is a safety artifice and contains media in the event of
flow tube failure. The flow tube is suspended on a stainless steel rope running inside the full length of the pressure chamber. The
pressure chamber contains flanges, which are bolted to the process flanges of the mating pipes.
The mass transducer provides a signal to a remote microprocessor based transmitter. Uniquely, at the push of a button diagnosis
with NIST traceable density calibration and verification is accomplished, without the need for test weights. Display, analog and
digital communications are available.
Keywords: Mass transducer, vibration insensitive, media noise, pink noise, externally induced vibration, solid state, flow tube,
time constant, suspension rope.
ALTERNATIVE SENSING TECHNIQUES
The vast majority of continuous density measurement of slurries is done with nuclear sensors, whereby a gamma ray is emitted
through a metal wall and across a thin diameter of a pipe through which the media is flowing. The inside diameter of the pipe may
be suitably lined to improve its service life. Diametrically opposite the gamma ray emitter is a scintillator devise, which converts
the gamma ray to brief light flashes. The light flashes are sent to a photomultiplier, which amplifies and converts them to electronic
pulses. The frequency of the pulses is a measure of radiation intensity.
Since the density of the media affects the absorption of radiation, the frequency of the pulses is inversely proportional to the
density of the media, and is non-linear. Electronic signal conditioning provides a
linearized electrical output.
______________________________
¹ Director of Engineering, SCIAM Worldwide, 7380 Sand Lake Road, Suite 500, Orlando, FL 32819, USA,
T 407 505 4513, e mail rbatey@SCIAMworldwide.com
Such devises are relatively low in radiation levels, typically10 microSieverts/h, which is approximately the same as medical X-
rays. Despite these relatively low levels, world-wide restrictions, security and safety standards are strictly imposed on such nuclear
sensing techniques. Special training must be given to handlers, special regular testing is necessary, and trained safety officers are
often employed by companies using them. When installed on a mobile skid or dredger, special permission must be sought in order
to re-locate the skid or dredger. The basic high cost of nuclear sensing techniques, including the cost of safety measures, source
transportation or disposal, storage security, and the potential health hazard, makes nuclear density sensing unpopular. However,
until now there does not appear to be a non-nuclear, practical alternative of adequate accuracy and insensitivity to vibration sought
2. by users. The high cost of dredging, requires a density sensor having a good resolution, accuracy < ± 1% of full scale, with a
repeatability of < 0.5%, regardless of media noise or externally induced vibration.
Another form of density measurement embodies a vibrating tube or fork, the variation in frequency of which is proportional to the
density of the contacting media. However, these are limited to relatively small pipe sizes and liquids. They are impractical for use
with dredging slurry, due to large pipe size requirements in the industry and the rapid erosion such media imposes on the vibrating
parts.
Coriolis flow meters directly measure the mass flow of the media flowing through a thin wall bent pipe, which is caused to vibrate.
By measuring the frequency phase shift at each end of the bent pipe, a proportional mass flow rate is obtained. These meters may
have a separate density output. However, they are impractical for measuring dredging slurries since the thin wall bent pipe would
erode within weeks, or days.
Ultrasonic density sensing techniques have also been used, whereby ultrasonic waves are passed from an emitter to a receiver
diametrically opposite in a spool piece in a pipeline. A strong echo is received with low percentage solids or density, but as they
the density increases the signal weakens. As such, density is a measurement of the strength of the ultrasonic echo. Typically with
dredging slurries, the signal has to be damped significantly and the net result is not a true average of the density. In practice, above
10% solids the signal requires so much dampening that often the errors are unacceptable.
Other devices measure slurry density by sensing the phase difference of microwaves passing through the slurry compared to water
as a reference. However, reliable microwave differential phase techniques are limited to media with reasonably consistent electrical
permittivity (or dielectric constant) and conductivity, such as waste water, foods and paper slurry. The natural characteristics of
dredging and inorganic slurry have such large variation in these electrical criteria that microwave techniques have very limited
application.
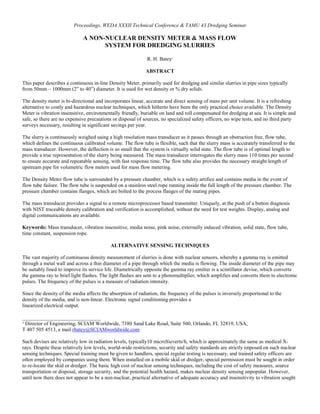
It should be noted that ultrasonic, microwave and nuclear density sensing devices have only a relatively small column of sensing
area across the pipe diameter. The remaining cross section of the pipe is ignored. Such techniques give different results in the
horizontal plane to when the meters are installed in the vertical plane, due to solids settlement and media stratification. They rely
on a homogenous media cross section. Furthermore, they have no sensing in a length upstream and downstream of the point of
measurement. In consequence, the media measured is not necessarily representative of a larger volume of it, which can result in
puzzling errors. See Figure 1.
WEDA 32 and TAMU 43
Figure 1. Errors result from not sensing adequate cross section and length
3. COMMON ART LINEAR INSTRUMENTS
Mechanical means of sensing density have been tried in the form of continuously weighing the pipe line containing the flowing
media. However, unacceptable errors were hitherto predominantly caused by media noise and externally induced vibration, as well
as inadequate compensation for temperature change.
Two common art types of linear instruments below have been used in attempts to measure density by measuring the deflection of a
flexible pipe caused by variation in weight of the media flowing through it.
Zero Order Linear Instruments
These provide an output proportional to the input at all times in accordance with the equation:
y(t) = kx(t)
where y = output signal, x = input displacement. Both these parameters are a function of time t, related by a static gain constant k.
An example of this is the common strain gauge. The strain gauge is typically bonded to ceramic or metal substratum and has a high
natural frequency. The change in its electrical resistance is proportional to the input measurement of the strain applied to it. This
has been commonly applied to continuous weight measurement of solids on a conveyor belt, whereby the output responding
immediately to external plant vibration is reduced by a suitable form of electronic damping.
Such devices then act as a first order linear instrument. They have limited accuracy, resolution and range, since such devices have a
high natural frequency, well above the natural frequency range of externally induced vibration and media noise. shows how an
unacceptable effect, normally caused by externally induced plant vibration or media noise. The output signal is particularly
affected over the first 20% of the response time, known as the Time Constant period T of a natural logarithmic function. Even with
a substantial 10 minute response time (5T), also known as dampening time, unacceptable errors occur over the Time Constant
period. Furthermore, such long response times are undesirable, since a substantial amount of often very expensive slurry can pass
without variations being measured.
WEDA 32 and TAMU 43
4. Figure 2. Undesirable vibration errors despite substantial damping
First Order Linear Instruments
These provide an output given by a classical non-homogenous first order linear differential equation
Т. [dy(t)/dt] + y(t) = k.x(t)
Т = the time constant of the instrument.
Common art first order linear sensors, such as those incorporating relatively large displacement diaphragms or movements with
damped outputs, provide improved external vibration and media noise insensitivity over zero order instruments since their natural
frequency is normally lower and the vibration energy is somewhat absorbed. Also the sensing displacements of such first order
instruments are relatively large compared to the double amplitude of the vibration applied to them. However, as in Figure 2, the
output response of first order linear instruments occurring particularly in the initial steep rise of the natural logarithmic function is
still adversely affected by external vibration and media noise.
Linear displacement sensors (LVDT sensors) are classical first order linear sensor systems. However, their use is not applicable in
the Density Meter described herein, since the deflection of the flexible flow tube is typically measured in thousandths of an inch
(hundredths of a millimeter) and is virtually solid state.
With first order linear sensors the initial condition y(0) = 0 the solution is given by the classical natural logarithm e function
(-t / Т)
y(t) = k [1 – e ] where the initial rate of change of y(t) at t = 0 is k / Т
Response of first order instrument to a step function where k = 1.5 and Т = 1
After time t = Т the equation becomes
y(T) = k(1 – 1/e) = 0.632k
After a time y(t) approaches the value of the static gain k. If T is small the instrument response time is fast. If T is large the
instrument response time is slow.
Common art electronics, known as RLC circuits, incorporate resistance, inductive and capacitive techniques to dampen electrical
output. However, these are normally only effective from 20% - 100% of the response time. The first 20% of the response time,
defining an initial time constant period, contains a steep rise in output, and again is susceptible to the effects of external sources of
vibration and media noise. This causes instability in the output signal and display. More advanced signal damping, incorporates
digital filter techniques, but these are normally only suitable for frequencies in excess of externally induced vibration and media
noise. One such advanced filter technique is known as Finite Duration Impulse Response FIR (Reference: Kobayashi, M., Kuruso,
S., Ohnishi, h., Tasaki, R., Yamazaki, T.). This appears to achieve a type of critical damped condition, but only at frequencies >
100 Hz. Plant induced frequencies and media noise of liquids and slurry in a pipe have frequencies normally < 100Hz, and can
commonly occur as low as 0.25 Hz. In this reference it is admitted that at such frequencies, “It is practically impossible to separate
the measured signal from the noise.” Various algorithms have been consequently developed in an attempt to detect and account for
lower frequency disturbances (References Kameoka, K. et al, Lee, W.G. et al, Ono, T.). However, such algorithms have had
limited success when used with liquid and slurry in pipe lines. These references are more applicable to conveyor belt weighing
machines with predictable loads occurring at regular time periods. Flowing liquids and slurry in a pipe, compared to media
transported on a conveyor belt, induce a wider variety of relatively low frequencies, typically 0.25 - 100 Hz. The Density Meter
described herein teaches a different approach to achieve critical or over-damped conditions, while still having an acceptable
response time.
In summary, zero and first order linear sensors, often incorporating small displacement diaphragms, or strain gauges fixed to a stiff
metallic or ceramic substratum, have a natural frequency significantly higher than typically 200 Hz, which is higher than the
normal maximum natural frequency of externally generated vibrations and media noise. Consequently, such high natural
frequency sensors cannot respond effectively to the lower external induced vibration and media noise, and vibration compensation
cannot be suitably accomplished.
5. A NEW TECHNOLOGY
Dredging engineers have always sought the simplest and most accurate method of measuring the density of slurry. The most direct
method would be to continuously weigh a calibrated volume. But the unpopular nuclear techniques have been almost exclusively
used, since the biggest problem with weighing has always been the effect of externally induced vibration and media noise
superimposed on the weigh signal. A new technology Density Meter, known as a SCIAM Density Meter, has overcome these
problems and more (Reference: www.SCIAMworldwide.com)
As a preamble, an understanding of ‘externally induced vibration and media noise’ is beneficial. Normal externally induced
vibration, such as from pumps and other machinery, as well as noise from such media as liquids, slurries and sludge flowing in a
pipe, is described as predominantly ‘pink noise’. Every day examples of pink noise is that generated by sand running through an
egg timer, by a multitude of vehicles traveling over a bridge, or by a distant ocean roar. It is understood that most pink noise in this
respect is in a frequency range up to 1000Hz, although in the application of a SCIAM Density Meter, concern is primarily with
frequencies 0.25 to 100 Hz. Figure 3 shows a typical periodogram of such pink noise, with typical magnitudes of 30 dB at various
periodic times. Random pink noise has a typical trend of decreasing by 3 dB per octave, and the decibel magnitude is proportional
to 1/f, where frequency f is presented on a logarithmic scale.
WEDA 32 and TAMU 43
Figure 3. Periodogram of Pink Noise
Second Order Linear SCIAM Density Meter
The SCIAM Density Meter provides an output which is given by a classical non-homogenous second order linear differential
equation
d²y(t) / dt² + 2ρ.ω.dy(t) / dt + ω² .y(t) = k.ω² .x(t)
where ρ is the damping factor and ω is the natural frequency of the SCIAM Density Meter. The input of a second order linear
instrument oscillates about its position of equilibrium, typically restrained by a spring or, in the case of a SCIAM Density Meter,
by the stainless steel rope, upon which the flow tube is suspended. The natural frequency ω is the frequency of these oscillations.
The restraint of the stainless steel suspension rope opposes these oscillations with a force proportional to the rate of change of the
vibration forces caused by internal media noise and external vibration applied to the SCIAM density Meter. The damping factor ρ
determines the force in opposition to the oscillation frequency.
6. A simple example of a second order linear instrument is a U-tube manometer for measuring differential pressure. Due to
measurement noise the liquid in the manometer tends to oscillate from side to side at a frequency determined primarily by the
weight of the liquid. Here the damping is normally caused by the liquid viscosity and friction between the liquid and the U-tube
walls. Although in appearance a U-tube manometer is nothing like a SCIAM Density Meter, the second order sensing techniques
are similar, except uniquely the amplitude of oscillation in a SCIAM Density Meter is so small it is virtually solid state.
With initial conditions y(0) = 0, then dy(0) / dt = 0 and the response time depends on the damping factor ρ.
Figure 4 shows a graph of y(t) for various values of ρ
An undamped condition is achieved with ρ = 0 and y(t) oscillates as shown, with period 2πω
Under-damping is achieved with ρ = 0.3, k = 1, ω = 1
Critical damping is achieved with ρ = 1, k = 1, ω = 1
Over-damping is achieved with ρ = 3, k = 1, ω = 1
Optimum damping is achieved with ρ = 0.7, k = 1, ω = 1
WEDA 32 and TAMU 43
Figure 4. Response of a second order SCIAM Density Meter to a step function
The values of ρ are achieved in two basic ways: a) by the low natural frequency internal design of the SCIAM Density Meter,
including a virtual solid state mass transducer, and b) by remote SCIAM Density Meter electronics incorporating appropriate
algorithm conditioning, which respond to and compensate for frequencies 0.25 – 100 Hz, programmable at the various ρ values
given above.
The remote SCIAM Density Meter electronics is programmable for optimum, critical and over-damping algorithms, to
accommodate damping factor ρ values between 0.8 and 3, as shown in Figure 4. The response time is typically 5 to 15 seconds
(time constant 1 – 3 seconds) and generally acceptable to industrial users in the mining, dredging and sewage treatment industries.
However, should special applications requiring faster time constants occur, the SCIAM Density Meter can have time constants
down to 45 milliseconds.
7. CONSTRUCTION AND THEORY
The overall construction of the SCIAM Density Meter is shown in Figure 5.
WEDA 32 and TAMU
43
Figure 5. Construction of a SCIAM Density Meter
Since the Density Meter is bi-directional, dredging slurry enters the Rubber Flow Tube at either end. The slurry runs continuously
through the Flow Tube.
At the longitudinal center portion of the Flow Tube there is a ‘C’ Clamp arrangement, which embraces virtually the complete Flow
Tube circumference. This ensures the internal diameter of the Flow Tube remains the same at internal pressures normally up to 10
bar g (150 psig) and results in a negligible pressure error coefficient. Higher pressures are available.
A peg on the underside of the bottom-most ‘C’ Clamp communicates with the ‘solid state ’Mass Transducer. The measurement of
the mass of the Flow Tube and the slurry flowing within it is a measure of its density. An electrical cable from the Mass
Transducer passes through a pressure tight cable connector to the remote electronics transmitter. The transmitter both powers the
Mass Transducer and accepts a signal from it, and converts the signal to a 4-20mA proportional output. It also provides a wide
variety of communication networks.
The term ‘mass’ is used, rather than weight, since the Mass Transducer is so sensitive that the remote transmitter may be
programmed to accommodate variation in earth’s gravitational force, with reference to major cities throughout the world. This
allows the SCIAM Density Meter to be calibrated anywhere in the world with gravity compensation to be made in accordance with
the nearest major city of installation.
The Rubber Flow Tube is of a special composite construction. It has typically a wall thickness of 25mm (1”). The outer half of the
wall is a relatively hard rubber, reinforced with several layers of polyester ply. For vacuum conditions a metal spiral is molded into
the outer wall. The inner half of the wall is normally a natural gum rubber. It is particularly soft with high resistance to erosion and
suitable for the vast majority of dredging and similar slurries. The Flow Tube is also designed to be as lightweight and flexible as
possible so that the mass of the slurry flowing through it is adequately transferred to the mass transducer. A stiff and heavy Flow
Tube would compromise accuracy, resolution and fast time constant.
8. The Rubber Flow Tube is suspended on a stainless steel Suspension Rope. This Rope is in tension to provide the second order
linear function of the SCIAM Density Meter. The Tensioning Bolts at each end of the density meter provides a force to oppose
both media noise and externally induced vibration forces proportional to their rate of change. The Rope also embodies a method to
temperature compensate for media and ambient temperatures, dependent on its length and angle to the horizontal axis. The tension
in the stainless steel Suspension Rope is far greater than the Flow Tube and also provides a much better repeatable elasticity than
would be obtained solely from the Rubber Flow Tube.
The deflection of the Flow Tube and Suspension rope may be described as virtually solid state, it being typically measured in
hundredths of a millimeter (thousands of an inch) for full scale measurement. It is fundamentally important for relatively high
tensional forces to be applied to the Suspension Ropes in order to achieve displacement repeatability of typically < ± 0.2% of
reading. At the same time the Suspension Rope must suitably support the Flow Tube and allow optimum ease of deflection due to
change of media density. However, the angle of suspension of the Suspension Rope to the longitudinal axis of the Flow Tube must
be as small as practical. This is illustrated in the art of mechanical statics, whereby classical Lami’s Theorem teaches that when 3
forces act on a point, the magnitude of each is proportional to the geometrical sine of the angle opposite each force. From this it
can be shown with reference to Figure 6, that when an angle θ is relatively small, a force vector CD applied to Point C is
correspondingly small compared to the tensional forces in Suspension Rope.
WEDA 32 and TAMU
43
Figure 6. Magnitude of forces acting on the Mass Transducer
The force vectors CA and CB represent the tensional forces in Suspension Rope. The force vector CD represents the total
compressive force, and hence displacement, which is applied to the Mass Transducer. Such an embodiment allows the
displacement of the Flow Tube to be caused significantly by the density of the media inside, to a lesser extent by the weight of the
Flow Tube itself, and to still lesser extent, by the relatively small mass of the Suspension Rope. Additionally, it has been shown
that this arrangement has an inherent relatively low natural frequency and able to absorb induced pink noise up to 200 Hz.
From Lami’s Theorem in mechanical statics and reference to Figure 6
_A_ = B_ = _ C_
sin α sin β sin λ
By example, for an angle θ = 2º, which is typical for the angle of the Suspension Rope to the longitudinal axis of the Flow Tube,
angle λ = 176º and angles β and α = 92º then:
sin λ = 0.0698 and sin α and β = 0.9994
then Force C = (0.20 / 0.88) B = 0.0698 B
Accordingly, the compressive force vector CD approximates to and typifies 0.07 of the tensional force applied to Suspension Rope.
This allows a small change in media density to be resolved by the Mass Transducer, while the high tension in the Suspension Rope
assures good repeatability.
9. The deflection of the Flow Tube is determined by simple variation in the length cubed and diameter D raised to the power 4 of the
Suspension Rope. Accordingly, small changes Suspension Rope length and diameter have significant influence on the deflection
applied on the Mass Transducer.
An Adjustment Spring Assembly provides for a series of tension springs to help support the weight of the Flow Tube, or raise its
weight to remove the Mass transducer. Alternatively, compression springs are provided to overcome Flow Tube stiffness, as
required dependent on SCIAM Density Meter size or range of slurry specific gravity (sg). The sg ranges are normally increments
of 0.500 from 1.000 to 4.000. The SCIAM Density Meter sizes normally range from 50mm to 1000mm ( 2” to 40”).
Life expectancy of the Flow Tube ranges typically from 5 years with highly abrasive slurries to as much as 20 years for with clay
slurry. The Rotary Flange at each end of the Rubber Flow tube allows for rotating the entire Flow Tube to allow even erosion on its
internal diameter, which increases service life.
Without preventative maintenance, when the service life of the Flow tube is finally reached it will burst. However, the Pressure
Chamber is designed to contain the media under full working pressure. The Mass Transducer will provide a sudden electrical
failure warning. Recommended spares are relatively low cost, comprising a spare Mass Transducer and Flow Tube. These can be
simply replaced on job-site by unbolting the appropriate Pressure Chamber Flanges.
Temperature Compensation
In its basic form, temperature compensation is achieved by the stainless steel Suspension Rope expanding with increase in ambient
or media temperature to compensate for the lowering of the modulus of elasticity of the Rubber Flow Tube. As such, the
Suspension Rope increases the upward supporting force on the Rubber Flow Tube to compensate for the apparent increased weight
on the Mass Transducer due to lower stiffness. Conversely, with lowering of ambient or media temperature the Suspension Ropes
reduces in length to compensate for the increase in modulus of elasticity of the Rubber Flow tube.
Correct compensation was empirically determined by the length of the Pressure Chamber, the diameter and length of the
Suspension Rope, as well as its angle to the longitudinal axis to the Rubber Flow Tube. Accordingly, the temperature error
coefficient is ± 0.0014% of span per ºC (± 0.0008% per °F).
Vibration Compensation
Due to the low natural frequency of the Flow Tube and Suspension Rope, the SCIAM Density Meter absorbs a significant amount
of energy from media noise and externally induced vibration. However, it is also necessary to compensate for these vibration forces
in the remote transmitter electronics.
Figure 7 shows typical pink noise from the media and externally induced vibration superimposed on the true density signal. The
remote transmitter contains an algorithm which interrogates the pink noise at 110 times per second and calculates the average
values for pink noise periods both above and below the true density signal. It then averages these positive and negative values to
provide the true density signal.
WEDA 32 and TAMU
43
Figure 7. Compensation for vibration at 110 Hz
10. SOURCES OF ERROR
Figure 8 provides the major sources of error in the SCIAM Density Meter. The errors are based on a 2 σ standard deviation, with
the resultant error is based on the square root of the sum of the squares of the component errors, resulting in a 95% confidence
level.
Externally induced plant vibration and media noise < ± 0.1 %
Temperature Coefficient Error 0.0014% per °C over 30°C < ± 0.04 %
Tilt in 2 planes over ± 20° to horizontal < ± 0.2 %
Mass transducer and remote transmitter accuracy < ± 0.1 %
Pressure error coefficient < ± 0.1 %
Velocity coefficient error from 0.03 – 10 m/s (1 – 30 fps) Negligible
Typical Flow Tube erosion effect on calibrated volume < + 0.1 %
Root of sum of squares of component errors < ± 0.285
Figure 8. Sources of error
COST SAVINGS
Figure 9 provides both typical initial cost and operating cost comparisons between a SCIAM Density Meter and a nuclear density
meter.
WEDA 32 and TAMU
43
Figure 9. SCIAM Density Meter savings compared to a nuclear device
11. A further survey was done on dredgers on the Hudson River in USA (Reference: Baier, J.L., Douglas, W.S., Gimello, R.J., Lodge,
J.). The various costs of dredging are comprehensively provided in this reference, but a typical example is provided in Figure 10.
The realizable savings are based on the accuracy of the SCIAM Density Meter given in Figure 8.
Average cost of dredging Co
Average dredged volume per day 8500 yard³ per dredger
Average dredged volume per 360 day year 3.06 million yard³ per dredger
Cost per year $150 million per year per dredger
Nuclear density meter typical overall accuracy 2%
Cost of Ambiguity $3.0 million per year
SCIAM Density Meter typical overall accuracy 0.285%
Cost of Ambiguity $427,500
Savings realized by SCIAM DM3 $2,572,500 per dredger
Figure 10. Typical cost savings realized per dredger on the Hudson River
MASS FLOW MEASUREMENT
Density meters are often used in pipelines in series with a magnetic flow meter. These flow meters operate on the principle of
Faraday’s Law, where a conductor passing through an electromagnetic field generates a Voltage proportional to the velocity of the
conductor. The slurry is the conductor. Faraday’s Law assures that the generated Voltage is unaffected by variation in media
density, and as such volumetric flow is measured. When the magnetic flow meter electrical output is multiplied by a linear density
meter electrical output, an output is provided proportional to the mass flow of the media. Wet or dry mass flow is a fundamental
requirement of the dredging industry. Since dry mass is what payment is based upon, the system is often scaled in terms of dry
totalized and dry rate of mass flow of the media. The density meter may be scaled in % dry solids. The SCIAM Density Meter is
well adapted here, as shown in Figure 11.
WEDA 32 and TAMU
43
Figure 11. SCIAM Density Meter in a mass flow system
Such a mass flow installation is shown in the photograph in Figure 12 (reference: Dupont Maxville Mine, Starke, Florida, USA).
This application is measures dredged zircon concentrate in a 400mm (16”) diameter SCIAM Density Meter, used with magnetic
flow meter. Zircon concentrate has particularly abrasive particles. With a normal velocity around 3 m/s (10 fps), already millions
of tons have successfully passed through the SCIAM Density Meter. With the installation of a SCIAM Density Meter the benefits
are improved mass flow accuracy, reliability and significantly reduced maintenance burden.
12. WEDA 32 and TAMU
43
Figure 12. Mass Flow Installation
Another novel mass flow application for SCIAM Density Meters is when used with a vortex velocity sensing type of clamp-on
ultrasonic flow meter (Reference: www.cidra.com). This identifies vortices in the slurry and measures their velocity by a series of
sensors placed along the external longitudinal axis of an existing pipe. Unlike a magnetic flow meter it can measure both
electrically conductive and non-conductive media. This vortex velocity sensing technique is independent of media density.
Consequently, like a magnetic flow meter, it is a volumetric flow device and may be used for mass flow measurement when
coupled with a Density Meter. However, a major advantage of this particular ultrasonic flow meter is that it can measure entrained
gas in the media using a separate ‘time of flight’ ultrasonic technique, so that accurate mass flow of media with entrained gas is
possible.
CONCLUSIONS
The SCIAM Density Meter is the first viable and ‘green’ alternative to nuclear density meters for measurement of dredging slurry.
Importantly and uniquely, it accounts for variation in density in the complete cross section of the pipe, as well as in a sufficient
length of media upstream and downstream of a sensing transducer, such that the measurement within the apparatus is significantly
representative of that media.
The major problems to direct and continuous weighing of the media have been overcome by the SCIAM Density Meter
technology, which results in improved accuracy, resolution and reliability, with faster response time and significant reduction in
maintenance and operational costs.
Used with magnetic flow meters, the SCIAM Density Meter measures wet or dry mass flow rate and totals, with wet density or %
dry solids with considerable advantages over the hitherto employed nuclear techniques. Similarly, when used with vortex velocity
type ultrasonic flow meters, for the first time slurry with entrained gas may be measured, including those which may be non-
conductive.
Since direct weight is sensed, an extra benefit is that continuous density is now be traceable to the USA National Institute of
Standards and Technology (NIST) and other international standards.
REFERENCES
Baier, J.L., New Jersey Department of Environmental Protection, Douglas, W.S., New Jersey Department of Transportation,
Gimello, R.J., New Jersey Department of Transportation, Lodge, J., Hudson River Foundation. “Comprehensive Strategy for
Managing Contaminated Dredged Materials in the Ports of New York and New Jersey.”
http:/libert.state.nj.us./transportation/airwater/maritime/pdf/compstrategy.pdf
Dupont Titanium Technologies, Maxville Mine, Starke, Florida, USA. SCIAM Worldwide Case Study,
www.SCIAMworldwide.com
Lee, W.G. et al. “Development of speed and accuracy for mass measurements in check weighers and conveyor belt scales.”
Proceedings of ISMFM, 1994, pp 23 – 28.
13. Kameoka, K., et al. “Signal Processing for check weigher.” Proceedings of APMF, 1996, pp 1222 – 128.
Kobayashi, M., (mkobayashi@vibra.co.jp), Shinko Company Ltd, Japan, Kuroso, S., (kurosu@oyama-ct.ac), Research Institute,
Crotech, Japan, Ohnishi, H., (oonishi@vibra.com.jp), Shinko Company Ltd, Japan, Tasaki, R., Kyoto Institute of Technology,
Japan, Yamazaki, T., (yama@oyama-ct.ac.jp) Oyama National College of Technology, Japan. “Continuous Weighing by Multi-
stage Conveyor Belt Scales.” Proceedings of SICE Annual Conference, Fukui University, Japan,August 4-6, 2003, Vol. 1, pp 813 –
818.
Ono, T., “Basic Point of Dynamic Mass Measurement.” Proceedings of SICE Annual Conference, 1999, pp 43 – 44.
Ono, T., “Dynamic Weighing of Mass.” Instrumentation and Automation, Volume 12, 1984, page 35.
www.cidra.com, “SONARTrac Ultrasonic Flow Meter”
www.SCIAMworldwide.com. “DM3 Density Meter”
CITATION
Batey, R.H. “A Non-Nuclear Density Meter and Mass Flow System for Dredging Slurries,” Proceedings of the Western Dredging
Association (WEDA XXXII) Technical Conference and Texas A&M University (TAMU 43) Dredging Seminar, San Antonio, Texas,
June 10 – 13, 2012.