Downloaded 332 times


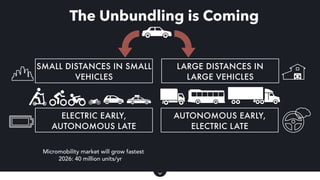

The document analyzes vehicle travel data from the 2017 US National Household Travel Survey, highlighting an extensive range of vehicle miles traveled, person trips, and distances related to car travel. It includes statistical insights on trip probability and distance distribution for various transportation modes, such as cars, taxis, and bicycles in specific cities like New York, Boston, and Chicago. The data offers insights into the patterns of micromobility usage and comparative travel distances across different modes of transportation.