Download as PDF, PPTX
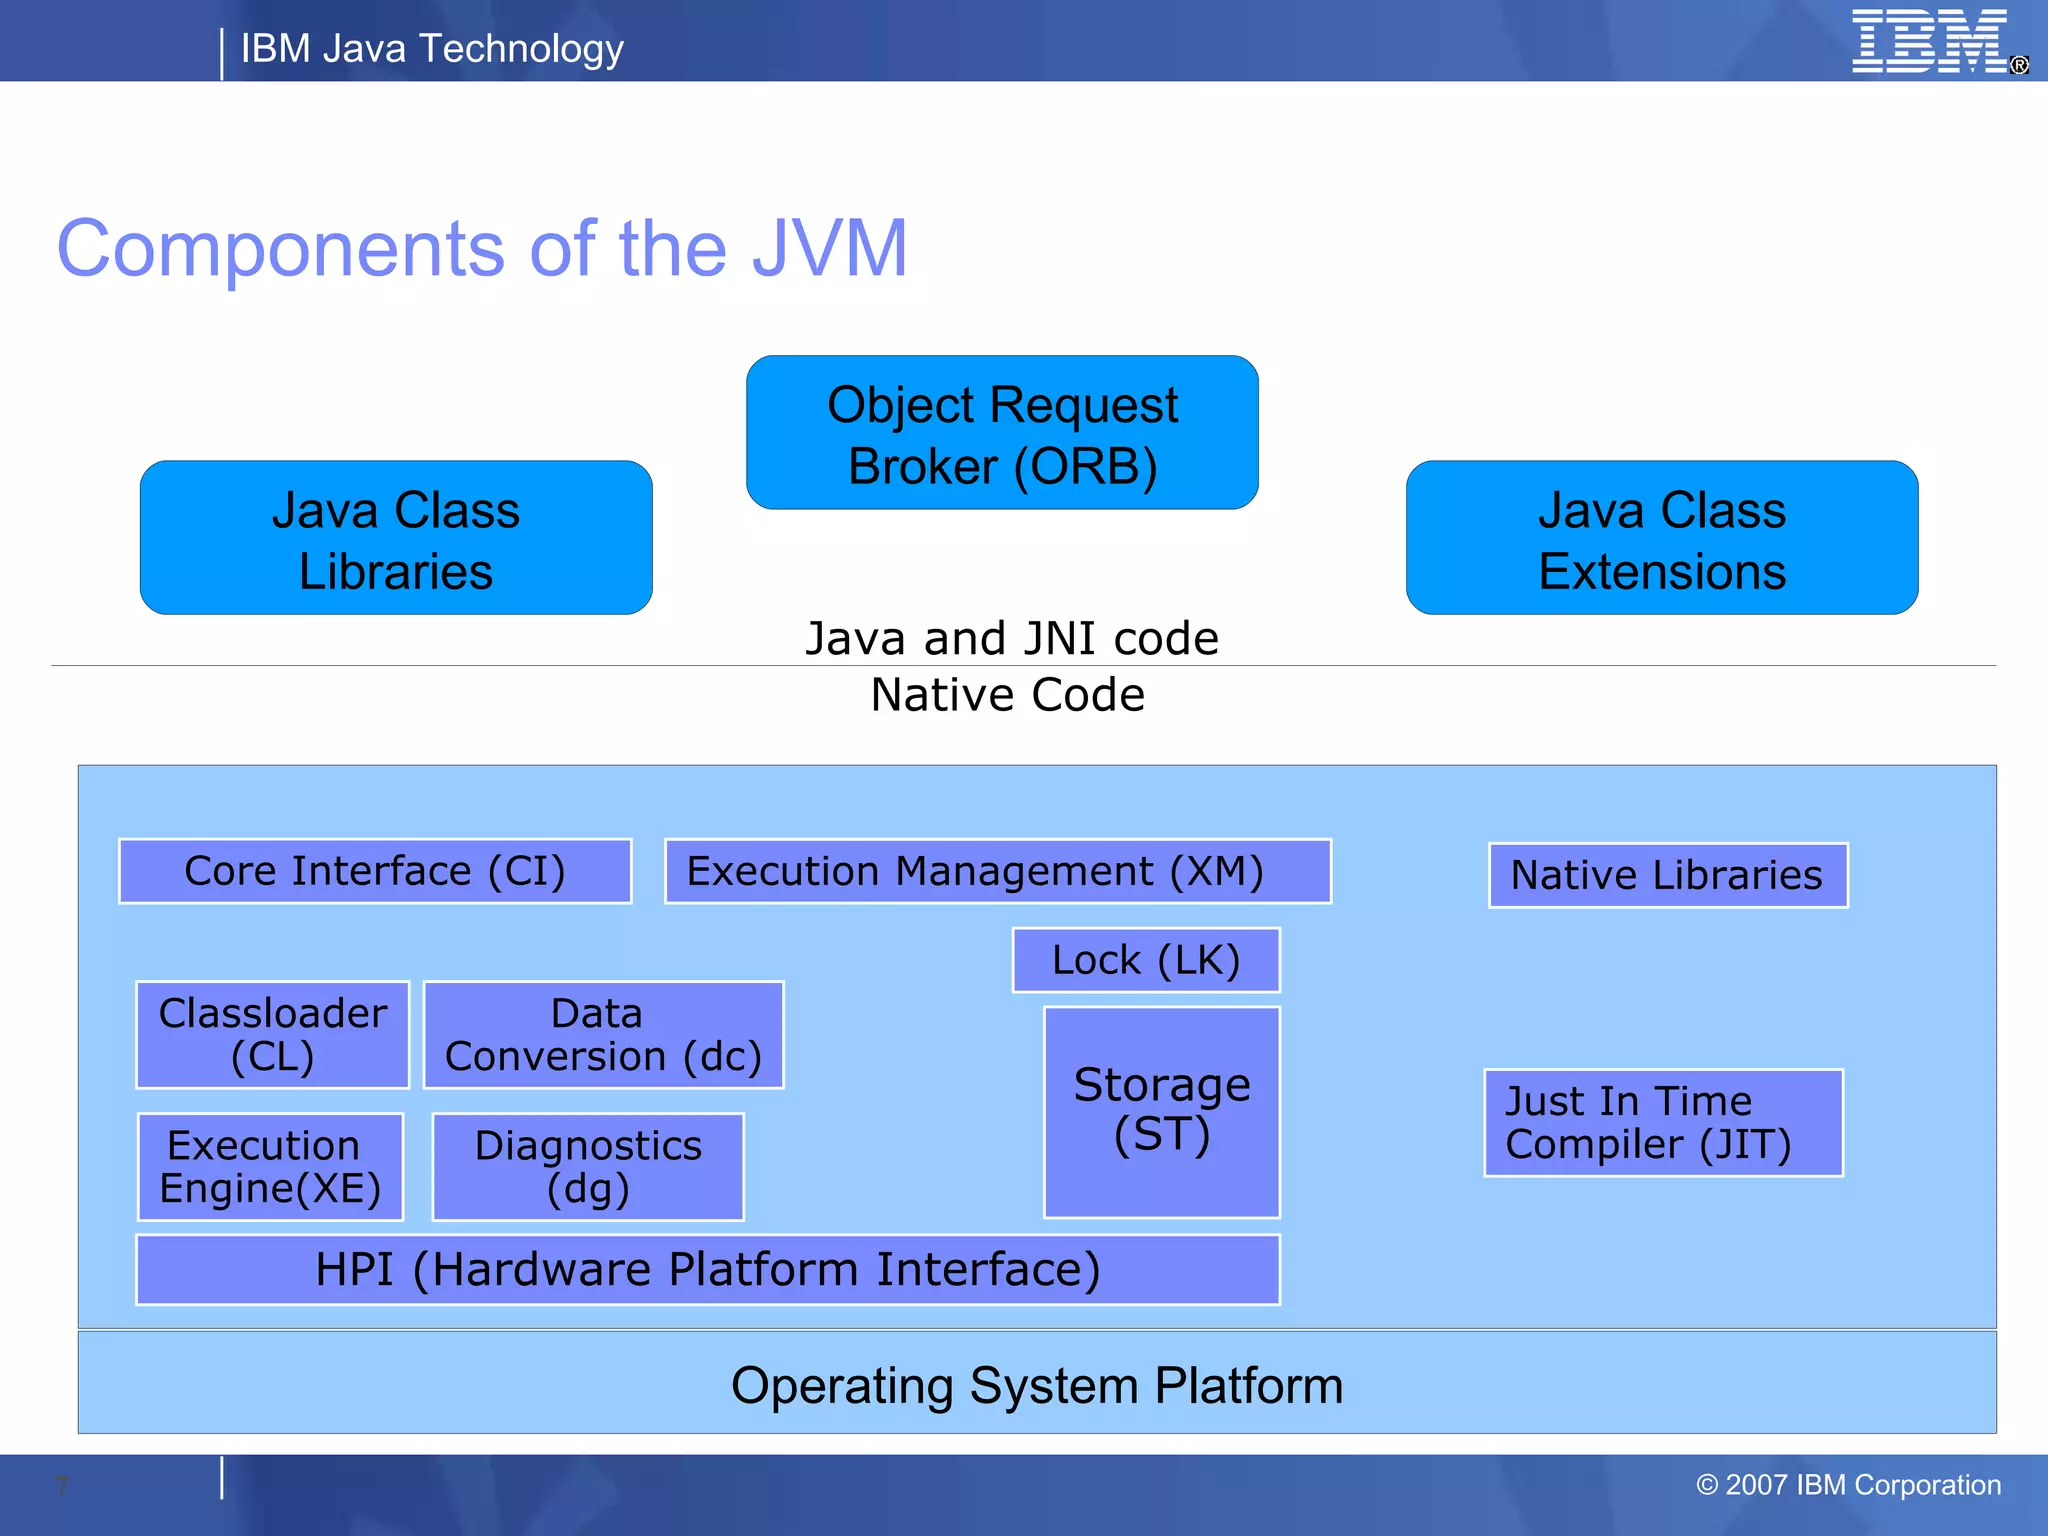


The document provides an overview of the IBM Java Virtual Machine (JVM), detailing its components, architecture, and diagnostic capabilities to troubleshoot application issues. It discusses subcomponents such as the execution engine, class loader, and memory management, while also illustrating common problem scenarios and methods to analyze application performance. Techniques for tracing and diagnosing issues like memory usage, response times, and CPU consumption are emphasized for effective JVM management.