Download to read offline


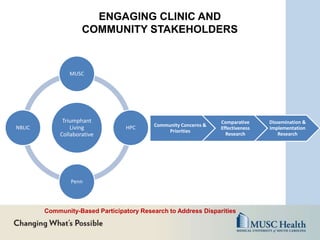
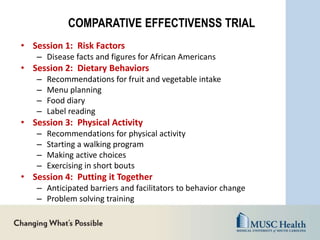
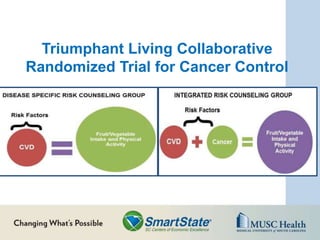

The SmartState Center for Cancer Equity at the Medical University of South Carolina aims to reduce cancer disparities through four main strategies: 1) enhancing minority participation in clinical research on health promotion and disease prevention; 2) increasing access to emerging technologies for these purposes; 3) developing culturally-tailored interventions to improve health outcomes; and 4) establishing infrastructure for promotion and prevention efforts in clinical and community settings. The Center directs comparative effectiveness trials, dissemination/implementation research, and community-engaged studies to address cancer inequities.


![PERI-PROSTHETIC FRACTURE NAIL-PLATE CONSTRUCT [NPC].pptx](https://cdn.slidesharecdn.com/ss_thumbnails/drarunkumardrmohamedashrafperiprostheticfrasturenail-plateconstructnpc-260209164459-7e9d15a1-thumbnail.jpg?width=640&height=640&fit=bounds)


