Downloaded 31 times

![Project Goals
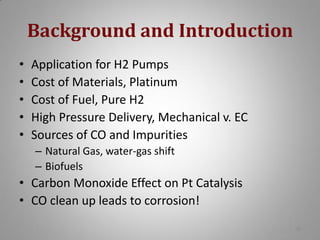
• Problem: Hydrogen oxidation electrocatalysts are used
in anode of hydrogen pump and fuel cell. They are subject
to poisoning from impurities like carbon monoxide [CO]
and durability concerns that arise from cleaning up CO.
• Challenge: Develop supports which can improve the
activity and durability of electrocatalysts for H2 pump.
• Approach: Design a composite support structure which
can aid in the improvement of both desired properties.
Demonstrate performance improvements through
working membrane electrode assemblies (MEA). Study
the material behavior and elucidate the benefits.
3](https://image.slidesharecdn.com/teamcapitalisprogressfinal-131017155458-phpapp02/85/CapItalIs-Fuel-Cell-Challenge-V-Presentation-3-320.jpg)

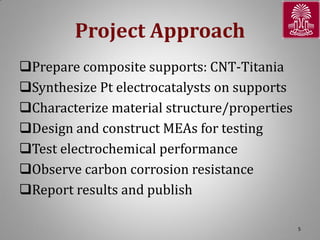

![Metal Oxides & Defect Chemistry
By metal oxide doping of Ti site with Nb,
𝑁𝑏2 𝑂5
2 𝑇𝑖𝑂2
1
2 𝑁𝑏·𝑇𝑖 + 4 𝑂 𝑂𝑋 + 2 𝑂2 + 2 𝑒 −
The equilibrium reaction for oxygen at low pressures is:
1
𝑂 𝑂𝑋 ⇌ 𝑉 ·· + 2 𝑒 − + 2 𝑂2
𝑂
The mass action law follows this expression for the equilibrium constant K
for electrons
𝑉 ·· ∗[𝑛]2
𝑂
[𝑂2 ]1/2
= 𝐾 𝑛 where [O2] = Partial pressure of O2 or P(O2)
At low P(O2), where e- compensates for the oxygen vacancies [n] ≈ 2 𝑉 ··
𝑂
1
2
𝑛 ∗ 𝑛
2
1
−2
= 𝐾 𝑛 ∗ 𝑃(𝑂2 )
1
3
𝑛 = (2𝐾 𝑛 ) ∗ 𝑃(𝑂2 )
therefore,
1
−6
11](https://image.slidesharecdn.com/teamcapitalisprogressfinal-131017155458-phpapp02/85/CapItalIs-Fuel-Cell-Challenge-V-Presentation-11-320.jpg)
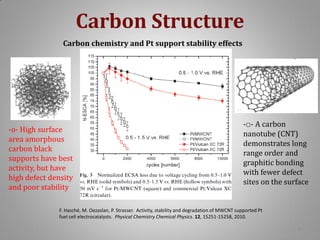
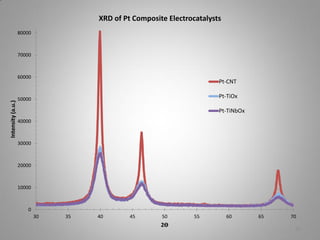
![XRD Spectra of Composite Support
and effect of [C:Ti] atomic ratio
Effect of Titanium Isopropoxide
added to fixed 0.1 g mass of CNT
Titanium Moles Added
Power (Ti moles)
6.E-04
[10:1]
60000
Ti moles
7.E-04
5.E-04
4.E-04
3.E-04
50000
40000
30000
20000
[80:1]
2.E-04
[80:1]
70000
[10:1]
8.E-04
80000
Intensity (counts)
9.E-04
XRD Spectra of TiOx-CNT Catalyst Supports
10000
1.E-04
0.E+00
0
100
200
[Ti:C] Atomic Ratio
300
400
0
10
30
50
70
90
2Ѳ
XRD scans show the presence of small anatase crystallites on the carbon nanotube
support. A higher titanium loading of 10:1 had a greater resistance and also
lacked sufficient electronic contact to function as electrocatalyst as evidenced by
the minimal ECSA and lack of i-V performance. A lowered ration of C:Ti [80:1] (5%
18
mass ratio of Ti) was used successfully.](https://image.slidesharecdn.com/teamcapitalisprogressfinal-131017155458-phpapp02/85/CapItalIs-Fuel-Cell-Challenge-V-Presentation-18-320.jpg)
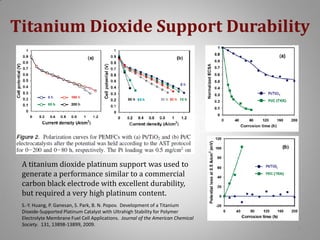
![Raman Spectra of Composite Support
Raman Spectra of CNT:Titania
18000
Titania-CNT
Oxidized-CNT
16000
25000
12000
20000
10000
8000
6000
4000
2000
0
0
500
1000
1500
2000
Intensity (a.u.)
Intensity (a. u.)
14000
[80:1]
15000
[10:1]
10000
TiNbOx
5000
-1
Raman Shift (cm )
0
0
500
1000
1500
2000
Raman Shift (cm-1)
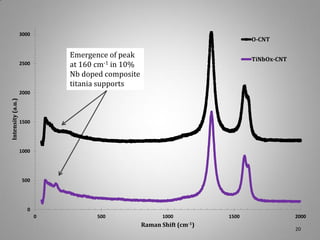
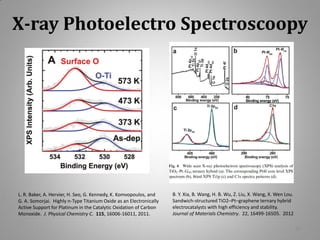
Raman data from red laser also shows the confirmation
of dual phase support with presence of anatase. The
concentration of titania on the surface may have an effect
on the material’s band gap, Eg. Later, dopant Nb atoms
wer added to effectively reduce the titanium oxidation
state and increase its electronic conductivity.
W. F. Zhang, Y. L. He, M. S. Zhang, Z Yin, Q. Chen. Raman scattering study on anatase TiO2 nanocrystals. J. Phys. D: Appl. Phys. 33, 912–916 (2000).
19](https://image.slidesharecdn.com/teamcapitalisprogressfinal-131017155458-phpapp02/85/CapItalIs-Fuel-Cell-Challenge-V-Presentation-19-320.jpg)
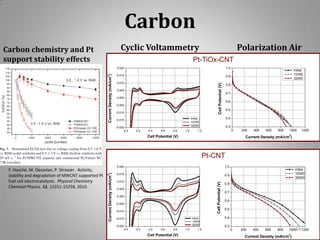
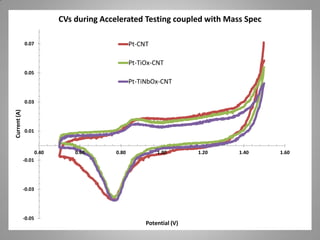
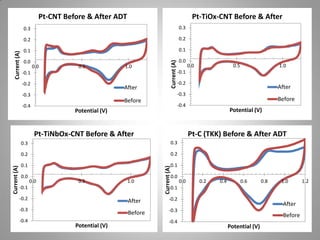
![Carbon Corrosion Resistance
L. M. Roen, C. H. Paik, and T. D. Jarvi. Electrocatalytic Corrosion of Carbon Support in PEMFC Cathodes.
Electrochemical and Solid-State Letters. 7 (1), A-19-A22, 2004.
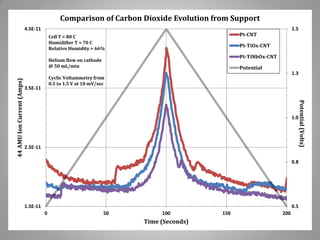
A method to quickly screen electrocatalyst durability achieved by scanning cell
potential and monitoring the evolution of carbon dioxide [CO2+] ion current by mass
spectrometer from sample capillary attached to the exhaust line. Real time
concentrations can be correlated with potential dynamic.
21](https://image.slidesharecdn.com/teamcapitalisprogressfinal-131017155458-phpapp02/85/CapItalIs-Fuel-Cell-Challenge-V-Presentation-21-320.jpg)
![Electron Microscopy
Distribution of Pt Crystallites
0.40
Frequency
0.35
0.30
0.25
0.20
Atomic ratio near 1:1 between Ti:Pt
in this image from STEM and EDX
0.15
0.10
0.05
0.00
2-2.5 2.5-3 3-3.5 3.5-4 4-4.5 4.5-5 5-5.5
[Ti]
Pt Crtystallite Diameter (nm)
HRTEM of Pt particle distribution on support (above)
TEM at USC shows area for improvement and also a
single CNT/Pt electrocatalys (below; left and right)
[O]
Credit: Haijun Qian and JoAn Hudson at Clemson EMF for HRTEM and STEM images & EDX data
[Pt]
23](https://image.slidesharecdn.com/teamcapitalisprogressfinal-131017155458-phpapp02/85/CapItalIs-Fuel-Cell-Challenge-V-Presentation-23-320.jpg)


![Raman Spectra of Carbon:Titanium Catalyst Supports
Raman Spectroscopy
25000
20000
[80:1]
Intensity (a.u.)
15000
[10:1]
TiNbOx
10000
5000
0
0
200
400
600
800
1000
Raman Shift
1200
1400
1600
1800
2000
(cm-1)
32](https://image.slidesharecdn.com/teamcapitalisprogressfinal-131017155458-phpapp02/85/CapItalIs-Fuel-Cell-Challenge-V-Presentation-32-320.jpg)

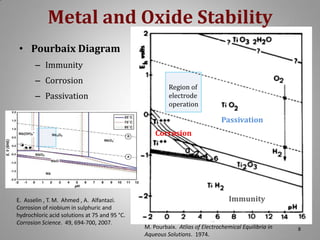
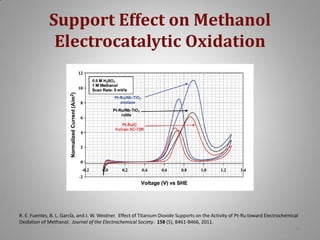
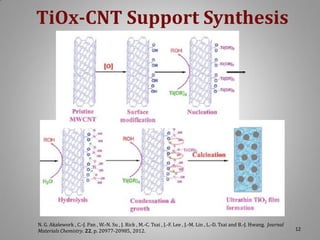
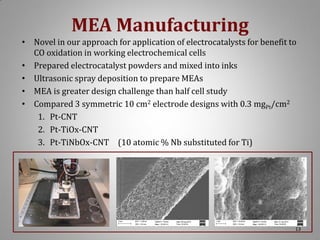
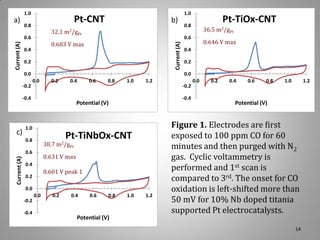
This document provides information on a project to develop resilient oxidation catalysts for electrochemical hydrogen pumps. The project goals were to improve the activity and durability of electrocatalysts used in hydrogen pumps by designing composite support structures. Specifically, the project involved synthesizing platinum electrocatalysts supported on carbon nanotube-titania and carbon nanotube-titanium niobium oxide composites, and testing their performance in membrane electrode assemblies. Testing showed the composite supported catalysts had better tolerance to carbon monoxide poisoning and higher carbon corrosion resistance compared to platinum on carbon nanotubes alone.


