The QE Index gained slightly during the week but market capitalization decreased slightly. Trading value, volume, and number of transactions all declined compared to the previous week. Two stocks will be added to the QE Index while two will be removed. The US Federal Reserve further reduced its bond purchasing program. Projected spending on infrastructure and facilities for the 2022 World Cup is estimated at $50 billion for 2014.
The Qatar Exchange Index lost 0.17% over the shortened trading week to close at 10,468.59 points. Trading value decreased 53.2% to QR944.8 million due to the shortened week. Gulf International Services was the top contributor to index gains after announcing a contract win, while Industries Qatar dragged the index lower. The report also provided regional market performance updates and highlights recent economic news and corporate developments in Qatar.
- The Qatar Exchange index declined slightly over the week while market capitalization increased slightly. Trading volume decreased slightly while value traded and number of transactions increased slightly.
- Ezdan Holding was the best performing stock for the week, rising 4.2%, while Qatar Cinema & Film Distribution fell the most at 5.2%.
- Foreign institutions remained net sellers over the week while Qatari institutions were net buyers. Foreign and Qatari retail investors remained net buyers.
The Qatar Exchange Index gained 1.84% over the week to close at 12,961.40 points. Market capitalization increased 0.9% to QR731.9 billion. Industries Qatar and QNB Group were the top two contributors to the weekly index gain. The IMF projected Qatar's inflation to remain at 3-4% and growth at 6-7%. Property transactions in Doha rose 29% in Q1 2014 versus Q4 2013. MSCI is expected to announce 9 Qatari firms qualifying for its emerging markets list on May 14. Barwa Real Estate sold the Barwa City project for QR7.57 billion.
- The QSE Index declined 2.46% over the week due to falls in Industries Qatar, Masraf Al Rayan and Ezdan Holding Group. Trading value and volume also decreased over the week.
- Foreign institutions were net sellers over the week while Qatari institutions were net buyers. Qatar's GDP is projected to grow over 7% annually through 2017 due to investments in non-hydrocarbon sectors.
- Company news included MERS reporting a higher profit and dividend for 2014 and Mesaieed Petrochemical guiding to lower sales volumes and earnings in 2015.
The Qatar Exchange Index gained slightly during the week but trading volume declined. Two stocks, Masraf Al Rayan and Vodafone Qatar, were the biggest contributors to the index's gain. Regional markets were mixed, with Abu Dhabi's index the top performer. Market indicators showed foreign institutions turned to net buying while Qatari institutions sold shares.
The Qatari stock market declined significantly last week, with the QSE Index falling 4.37% and market capitalization decreasing 4.23%. Trading value and volume also declined. Regional markets also witnessed declines due to weak oil prices. Foreign investors remained net buyers while Qatari investors were net sellers. In corporate news, Doha Bank finalized a QR312 million financing deal and Barwa Real Estate sold two land plots for a total of QR5.34 billion.
- The QE Index lost 0.38% over the week to close at 9,723.52 points, while market capitalization decreased slightly.
- Quarterly earnings reports from major companies like QNB Group, Nakilat, Qatari Investors Group, and Qatar Fuel were mixed.
- Trading value and volume both decreased from the prior week, while the number of transactions also fell. Foreign institutions remained net buyers during the week.
The Qatar Exchange Index declined 3.37% over the week, with market capitalization decreasing by 2.51%. Trading value and volume both decreased compared to the previous week. Masraf Al Rayan and Qatar Islamic Bank were the biggest contributors to the weekly index decline. Foreign institutions continued net buying during the week, while Qatari and foreign retail investors were mixed. Nakilat took over operations of the first LNG vessel as it moves toward becoming the owner and operator of the fleet.
The Qatari stock market gained slightly over the week. Trading volume and value decreased compared to the previous week. Industries Qatar and Qatar Islamic Bank were the largest contributors to the weekly index gain, while Ooredoo and Qatar Insurance negatively contributed. Foreign institutions remained net sellers during the week, while Qatari institutions were net buyers. Several companies announced dividends for 2014, with Gulf International Services announcing a large year-over-year increase.
The QE Index gained 4.51% over the week driven by improved regional market performance. Trading value and volume increased 15.74% and 18.03% respectively. Foreign investors remained net sellers while local institutions were net sellers and non-Qatari individuals were net buyers. Regional indices also rose with Dubai gaining the most at 8.62% due to reduced geopolitical tensions. The Qatari population is expected to grow significantly this year due to infrastructure investment leading to job creation.
The QE Index declined 2.27% over the week to close at 11,343.38 points. Trading volume increased 11.9% while value traded rose 7.61%. Two real estate companies, BRES and ERES, announced financial results. BRES reported a net profit of QR1.37bn for 2013 and recommended a dividend of QR2.00 per share. ERES reported a net profit of QR1.1bn for 2013 and recommended a dividend of QR0.31 per share, and also acquired over 20% of IHGS shares. Foreign and Qatari institutions remained net buyers during the week.
The QSE Index gained 0.46% over the week to close at 11,347.15, with market capitalization increasing slightly to QR598.9 billion. Trading value rose 1.51% to QR2.34 billion, led by the Banks and Financial Services sector. Trading volume increased 6.88% to 57.9 million shares, led by the Real Estate sector. Foreign institutions turned bullish and net bought QR384.9 million worth of stocks, while Qatari institutions net sold QR211.7 million worth.
- The Qatar Stock Exchange Index lost 1.42% over the week to close at 11,439.30 points as 32 stocks fell, 8 rose, and 3 remained unchanged. Trading value remained flat at QR1.17bn while volume increased 1.9% to 29.1mn shares.
- Foreign institutions remained net buyers during the week at QR25.4mn while Qatari institutions were net sellers at QR79.8mn. Qatar's population increased 2.8% month-over-month to 2.412 million residents as of October 31, 2015.
- The Qatar Central Bank auctioned QR2bn in treasury bills, with yields rising from the previous auction. Emir Tamim bin
- The QSE Index fell 3.66% over the week, with market capitalization decreasing 3.34% to QR602.4 billion. Only 11 of 43 listed companies saw their stock prices rise.
- Trading value fell 33.7% to QR1.32 billion, with the Banks & Financial Services sector accounting for 39.41% of trading value. Trading volume also decreased 30.21% to 32.5 million shares.
- Foreign institutions turned bearish, selling a net QR185.2 million in stocks, while Qatari institutions also remained bearish with net sales of QR19.7 million.
The Qatar Exchange Index gained 2.09% over the week to close at 11,338.41 points. Trading value decreased 25% to QR2.3 billion while volume fell 24.4% to 48.4 million shares. Ooredoo and QNB Group were the biggest contributors to the index's weekly gain. Foreign investors were net buyers of QR400.4 million while Qatari investors were net sellers. Doha Bank and Qatar Islamic Bank reported 2013 results in line with or exceeding expectations.
- The Qatar Exchange Index lost 77.42 points during the week to close at 10,391.17 points. Trading value increased 108.95% to QR1.97bn while volume rose 131.17% to 58mn shares.
- The major news was the initial public offering of Mesaieed Petrochemical Holding Company, a QP subsidiary, offering a 26% stake that could raise QR3.2bn.
- Qatari Investors Group was the best performing stock, gaining 19.56%, while Aamal declined the most at 6.03%.
The QE Index declined 5.12% for the week. Trading value and volume decreased as well. QNBK, MARK and IQCD were the biggest contributors to the weekly index decline. Only MERS ended the week with a gain. Foreign investors remained bearish with net selling while Qatari investors remained bullish with net buying. The economy is expected to grow in 2014 and 2015, driven by non-hydrocarbon sectors. Inflation is expected to remain moderate while the current account surplus is expected to decrease. CBQK successfully issued $750 million in bonds and Empower paid the first installment of its loan to Doha Bank. Woqod is finalizing its five-year plan to expand facilities
- The Qatar Stock Exchange (QSE) Index declined 0.88% over the week, with trading value and volume decreasing as well. The biggest decliners were Gulf International Services, Ezdan Holding Group, and Qatar Islamic Bank.
- Foreign and Qatari retail investors were net buyers during the week, while Qatari and foreign institutions were net sellers.
- Several companies reported financial results, with Nakilat and United Development Company reporting profits in line with estimates. Qatar's banking sector loan book declined slightly in January while deposits also decreased.
The QSE Index gained 1.6% over the week to close at 12,092.25 points. Trading value decreased 37.6% to QR3.1 billion, while trading volume decreased 48.85% to 77.66 million shares. Industries Qatar, Masraf Al Rayan and QNB Group contributed most to index gains, while Ezdan Holding Group and Qatar Insurance contributed losses. Foreign institutions turned bearish with net selling of QR186.1 million, while Qatari institutions turned bullish with net buying of QR357.6 million.
- The QSE Index increased 1.9% over the week to close at 12,515.86 points, with market capitalization up 0.85% to QR660.09 billion.
- Trading value increased 22.25% to QR2.72 billion compared to the prior week, led by the Real Estate sector which accounted for 32.71% of total trading value.
- Ezdan Holding Group (ERES) was the best performing stock for the week, rising 17.79%, and was also the top traded stock by value and volume.
The QSE Index in Qatar gained 0.1% on the day. Gains were led by the Real Estate and Banks & Financial Services indices. QNB Group and Barwa Real Estate Co. were the top gainers while Qatar Islamic Bank fell the most. Overall trading activity was lower than the 30-day average. In other GCC markets, indices fell in Saudi Arabia, Dubai, Abu Dhabi, Kuwait, Oman and Bahrain. Global economic data showed mixed results with UK public finances improving but foreign direct investment into China declining more than expected.
The Qatar Stock Exchange Index gained over 4% last week, with market capitalization increasing over 4%. Trading volume and value decreased from the prior week. The Banks and Financial Services sector contributed most to trading value and volume. Foreign institutions remained net buyers while Qatari investors remained net sellers. The document discusses stock performance and provides an outlook for the Qatari economy and non-oil sector growth amid lower oil prices.
- The Qatar Exchange Index gained 1.86% over the week to close at 14,350.50 points, while market capitalization increased 2.0% to QR762.6 billion.
- Ezdan Holding Group and Mazaya Qatar Real Estate Development will replace two other companies in the QE Index, while other index changes were also announced.
- Trading value decreased 9.9% to QR3.3 billion compared to the previous week, while trading volume fell 3.0% and the number of transactions declined 5.2%.
Transition: how to become a more design-minded organization (by Thomas Lockwood)Dima Leont'ev
This document provides guidance on how organizations can become more design-minded. It discusses how design can add value and drive innovation and growth. It defines design thinking as discovering unmet needs to create new concepts, while design management involves leading design processes and outputs. The document outlines 10 principles for organizations to become more design-minded, such as developing empathy for customers, engaging integrated design processes, aligning design and business strategy, and empowering creativity. It argues that businesses need transformation and design can help solve problems and drive change.
Remco Ukraine provides turnkey industrial construction services throughout Ukraine. They have extensive experience constructing industrial buildings for clients in a wide range of industries across Europe. Remco uses a modular steel construction system that allows them to build industrial halls much faster than traditional construction methods. They work closely with clients to design and construct buildings tailored to their specific needs.
The document advertises the Business Analytics Summit conference happening on November 12-13, 2009. The summit will focus on unlocking data for profits through sessions on data integration, reporting and analysis, key performance indicators (KPIs), and the latest technologies. Attendees will learn about implementing business analytics tools from industry experts and case studies. Over 200 business analytics experts are expected to attend, with networking and workshop opportunities.
This document discusses 3GVision and their offerings for mobile barcode solutions. 3GVision has over a decade of experience in image processing for mobile. Their main product is an end-to-end barcode solution called i-nigma that allows users to create and manage barcode campaigns, generate reports on scans, and provides a mobile app to read codes. They also offer a barcode reading SDK and can provide customized solutions. Their barcodes provide a way for mobile access to websites and apps with benefits like advertising, information access, and payments.
This document provides information about a 2-3 day cruise tour of Halong Bay from Hanoi with Paradise Cruises. The itinerary includes exploring famous sites in Halong Bay via cruise and activities like swimming, kayaking, and visits to fishing villages. Cruises are offered on luxury boats with en-suite cabins and meals included from $144 per person. Both 2 and 3 day options are available with the 3 day adding a trip to Cat Ba National Park on the second day.
This document provides an overview of Unix shell scripting with ksh/bash. It discusses the goals of the class, which are to learn what problems are suited to shell scripts, review commonly used Unix commands for scripts, and write simple shell scripts. It also lists some assumptions, such as having a basic understanding of commands, navigation, redirection and pipes. The document then provides details on the history of different shells like sh, csh, ksh and bash, and compares their features. It also discusses other scripting languages before focusing on ksh/bash versus sh scripts.
This document summarizes discussions from the GI2012 conference on open data policies. It describes how a representative from the German Federal Ministry of the Interior used the example of an "intelligent lawnmower" needing access to weather data through INSPIRE to argue for a national geoinformation strategy. However, others felt Germany does not need a new strategy, but rather more transparent, interoperable, and freely accessible public spatial data to enable better decision making. The document concludes by reiterating the view that Germany needs more open data transparency rather than a new national strategy.
Vibgyor International FZ LLC is a cladding solution provider located in the UAE that manufactures Z and C purlins, decking sheets, steel and polycarbonate cladding, turbo ventilators, roof and wall sandwich panels, and other cladding accessories like gutters and flashings. Their current production capacity is 100,000 square meters for sandwich panels and 400,000 square meters for single skin panels. Their mission is to provide cost-effective cladding solutions without compromising on quality, aesthetics, or environmental aspects while offering professional and reliable services.
This document discusses key performance indicators (KPIs) for licensed vocational nurses (LVNs). It provides examples of LVN KPIs, including lists of KPIs, performance appraisals, job skills, and key result areas. It also outlines steps for creating KPIs for LVNs, including defining objectives, identifying key result areas and tasks, and determining how to measure results. Additionally, it discusses types of KPIs and common mistakes to avoid when developing KPI metrics for LVNs.
Präsentation auf den M-Days München von Dr. Ralf Lauterbach, Vodafone zur Vodafone App-Initiative
Die Vodafone App-Initiative berät und unterstützt aktiv Agenturen, Entwickler, Plattformanbieter und Inhaltsanbietern bei der Vermarktung, Erstellung und Verbreitung von Inhalten und Anwendungsfällen auf mobilen Endgeräten.
A deck I presented at Intersolar North America in July 2009. The intent was to demonstrate my thoughts on BIPV definitions, product categories, and important market trends. I hope to be posting a cleaner version in the future.
15ª edição Feira Empreendedor 24 nov2012Dilen Ratanji
O documento discute a criação de uma empresa de consultoria especializada chamada VetBizz Consulting. Em três frases ou menos, o documento:
1) Explica a génese e objetivos da VetBizz Consulting, uma empresa de consultoria focada em Centros de Atendimento Médico-Veterinários.
2) Discute a estratégia e plano de negócios da empresa, incluindo segmentação, posicionamento e estratégia de marketing.
3) Fornece dicas sobre como criar uma empresa de consultoria e a proposta de valor da VetB
La boa vizcachera es una serpiente en peligro de extinción que habita los bosques y matorrales del Gran Chaco en Bolivia, Paraguay y el noroeste de Argentina. Está amenazada principalmente por la destrucción de su hábitat para la agricultura, ganadería y producción de carbón, así como por la caza de su piel. Para protegerla es necesario preservar los bosques chaqueños y prohibir la caza y comercio de esta especie.
Mobile creates a million challenges, but it's also been a boon for content specialists. It's shown how much content matters—and how hard it is to deal with changing devices and unpredictable screen sizes without considering key messages and communication priorities first. Suddenly, content strategists are in demand.
But we're not here to be the new hotness—the must-have tech hire of the moment. We're here to make an impact on our users' experiences and our organizations' success. We're here to solve problems.
Those problems won't be fixed with audit spreadsheets and editorial plans alone, though. They require a new set of skills: not just doing, but educating, collaborating, and facilitating change. By taking advantage of this moment—our moment—we can do more than fix today's mobile issues. We can give our digital initiatives focus, our projects purpose, and our organizations the ability to adapt.
The Qatar Stock Exchange Index gained slightly over the week. Trading value and volume decreased compared to the previous week. The real estate sector contributed the most to trading value and volume. Foreign institutions turned to net buying during the week after net selling the previous week. The report also provides details on index performance, company news, and economic news including forecasts for moderating real estate growth and inflation in Qatar.
The Qatar Exchange Index gained 0.40% over the week to close at 9,886.68 points. Trading value decreased 13.42% to QR900.8 million while volume fell 9.17% to 19.8 million shares. Zad Holding was the top gainer, rising 10.83%, while Widam Food declined the most by 4.95%. Foreign institutions were net sellers of QR48.6 thousand after being net buyers the prior week.
The Qatar Exchange Index declined 1.91% over the week. Trading value and volume decreased significantly. Masraf Al Rayan and Ooredoo were the biggest decliners, while QNB Group and Gulf International Services helped limit losses. Foreign investors continued net buying while Qatari investors net sold. Inflation in Qatar rose to 3.4% in May due to higher rents and fuel costs. Standard Chartered maintained a stable outlook for Qatar given its dominant position in global LNG markets. Gulf Drilling International won two land rig contracts worth QR1.1 billion from Qatar Petroleum.
The Qatar Exchange Index gained 2.04% over the week to close at 9,479.80 points, as market capitalization rose by 1.74% to QR520 billion. Trading value and volume increased significantly by 65.21% and 37.69% respectively. MSCI upgraded Qatar and the UAE to emerging market status, which is expected to result in $450-650 million of foreign investments flowing into the Qatari market. Foreign institutions turned to net buying while Qatari individuals remained net sellers during the week.
The QE Index gained 0.57% over the week to close at 9,298.75 points, while market capitalization rose 0.61% to QR512.2 billion. Trading value decreased 29.22% to QR1,290.7 million as volume fell 41.77% to 28.3 million shares. Islamic Holding Group was the best performer, up 12.83%, while Qatar Cinema & Film Distribution declined the most at 8.80%. Regional markets were mixed, with Qatar outperforming declines in Dubai and Abu Dhabi. Foreign investors remained net sellers of QR100 million for the week.
The Qatar Stock Exchange Index lost 0.44% over the week. Trading value and volume increased significantly by 96.69% and 115.62% respectively. The Banks and Financial Services sector contributed most to trading value, while the Real Estate sector led trading volume. Foreign institutions remained bearish, while Qatari institutions turned bullish. Construction of Qatar's Al Khor Al Bayt 2022 FIFA World Cup stadium is set to begin in September 2015.
The Qatar Exchange Index gained 1.11% over the week to close at 13,104.75 points. Trading value increased slightly to QR4.95 billion, while volume decreased 12.16% to 111.6 million shares. MSCI added 10 Qatari and 9 UAE companies to its emerging markets index, including QNB Group, Industries Qatar, and Emaar Properties. Foreign institutions remained net buyers during the week at QR277.3 million, while Qatari and foreign retail investors were net sellers.
The Qatar Exchange Index gained 2.25% over the week to close at 10,109.50 points. Trading value and volume increased substantially compared to the prior week. Al Khalij Commercial Bank was the best performing stock, up 11.79% for the week. Emerging markets remain under pressure from the potential tapering of US quantitative easing programs, which could slow global growth. Regional markets have fared better than emerging markets in recent weeks.
The QSE Index gained 1.02% over the week to close at 13,729.78 points, with market capitalization increasing 1.17% to QR742.4 billion. Trading value and volume increased 35.5% and 10.5% respectively. Foreign institutions remained net buyers while Qatari institutions were net sellers. Barwa Real Estate was the top performer with a 12.7% gain and the biggest contributor to the weekly index gain. The Emir of Qatar announced plans to merge Enterprise Qatar and Qatar Development Bank to further support private sector growth.
The QE Index declined 4.05% over the trading week to close at 12,453.76 points. Trading value decreased 22.08% to QR3.2 billion, while volume fell 33.29% to 66.7 million shares. Ooredoo was the worst performing stock, declining 11.80%, while Qatar Cinema & Film Distribution saw the largest gain of 21.52%. Foreign institutions were net sellers of QR132.6 million for the week.
The QSE Index gained 1.98% over the week to close at 12,133.23, with market capitalization increasing 1.3% to QR642.36 billion. Ezdan Holding Group was the best performing stock, gaining 8.19%, while QNB Group declined the most by 1.44%. Trading value increased 54.23% to QR1.53 billion due to higher trading in the banks and financial services sector. Foreign institutions remained net buyers during the week at QR161.1 million.
The Qatar Exchange Index gained 102.84 points during the week to close at 14,088.82 points. Trading value increased by 6.5% to reach QR3.7 billion, while trading volume increased by 21.5% to 83.3 million shares. Three stocks - Barwa Real Estate, Gulf International Services, and Industries Qatar - were the biggest contributors to the weekly index gain.
The Qatari stock market declined slightly over the past week. Trading volume and value both decreased compared to the previous week. Several sectors such as real estate and banks contributed most to the market decline. Foreign investors were net sellers during the week while Qatari investors were net buyers. Overall, the Qatari market outperformed other GCC markets in 2014 with an 18.4% return, while Kuwait's market declined 13.4% for the year.
The QE Index gained 1.55% over the week to close at 13,076.33 points, with market capitalization increasing 0.77% to QR695.6 billion. Trading volume increased 656.1% to 85.1 million shares, while value traded rose 611.9% to QR3.4 billion. Mazaya Qatar was the top performing stock with a 19.78% gain, while Industries Qatar fell 2.19%. Qatar Islamic Bank, Qatari Investors Group and Nakilat were the biggest index contributors. Foreign institutions remained net buyers during the week at QR143.1 million.
The Qatari stock market declined slightly over the week. Trading value increased slightly while volume decreased. Foreign institutions remained bearish through net selling, while Qatari institutions and retail investors remained bullish through net buying. The biggest decliners for the week were Ezdan Holding Group, Commercial Bank of Qatar, and Industries Qatar. Several companies set dates to disclose upcoming quarterly financial results. Qatar also amended rules regarding classification of GCC citizens invested in Qatari equities.
The QSE Index fell 1.98% over the week to close at 11,880.82 points. Trading value and volume both decreased over the week. IQCD, QNBK, and BRES were the largest drags on the index, while QATI and CBQK contributed positively. Foreign institutions turned bearish and net sold shares, while Qatari institutions remained bullish and were net buyers. The real estate sector led trading value and volume for the week.
The QE Index gained 0.90% over the week to close at 10,375.06 points. Trading value decreased 11.79% to QR2.3 billion, while volume declined 1.94% to 80.4 million shares. Regional indices were mixed, with Dubai up 1.9% and Kuwait down 0.7%. Doha Bank plans to raise QR2 billion in Tier 1 capital, while Commercial Bank of Qatar received approval to raise QR2 billion in additional Tier 1 capital. Ooredoo priced a $1.25 billion sukuk issue.
QNBFS Daily Market Report December 24, 2023QNB Group
The QE Index rose 0.8% to close at 10,285.3. Gains were led by the Transportation and Banks & Financial Services indices, gaining 1.4% and 1.2%, respectively.
QNBFS Daily Technical Trader Qatar - October 10, 2023 التحليل الفني اليومي لب...QNB Group
The document provides a daily technical analysis of the QE Index and QATAR INSURANCE CO stock. For the QE Index, it notes the index remains in a downtrend but is approaching a support level of 9,700, where long positions could be taken. It provides expected resistance and support levels. For QATAR INSURANCE CO stock, it notes the stock has not fallen as much as others and the uptrend remains intact above moving averages, though liquidity is low. It provides expected price targets and resistance/support levels for the stock. Definitions of technical analysis terms like candlesticks, support, and simple moving average are also included.
QNBFS Daily Market Report October 04, 2023QNB Group
The QE Index rose 0.2% to close at 10,273.3. Gains were led by the Transportation and Consumer Goods & Services indices, gaining 1.7% and 0.1%, respectively.
QNBFS Daily Technical Trader Qatar - October 04, 2023 التحليل الفني اليومي لب...QNB Group
The General Index failed to sustain its breakout above the double-bottom formation’s neckline and continued with its decline into the formation’s territory.
QNBFS Daily Technical Trader Qatar - September 28, 2023 التحليل الفني اليومي ...QNB Group
The General Index failed to sustain its breakout above the double-bottom formation’s neckline and continued with its decline into the formation’s territory.
QNBFS Daily Market Report September 24, 2023QNB Group
- The QE Index in Qatar rose 0.3% led by gains in the Transportation and Industrials indices. Qatar Navigation and Al Khaleej Takaful Insurance were the top gainers.
- Regional markets were mixed with Saudi Arabia down 1% but Abu Dhabi up marginally. Economic data from the US and Europe was mixed.
- In Qatar news, QR500mn in bills were sold at a yield of 5.755% and Gulf International Services approved final merger agreements. Ooredoo also signed an MoU to support businesses in Qatar free zones.
QNBFS Daily Technical Trader Qatar - September 24, 2023 التحليل الفني اليومي ...QNB Group
The General Index failed to sustain its breakout above the double-bottom formation’s neckline and continued with its decline into the formation’s territory.
QNBFS Daily Technical Trader Qatar - September 19, 2023 التحليل الفني اليومي ...QNB Group
The General Index failed to sustain its breakout above the double-bottom formation’s neckline and continued with its decline into the formation’s territory.
QNBFS Daily Market Report September 17, 2023QNB Group
The QE Index declined 0.5% to close at 10,319.3. Losses were led by the Industrials and Consumer Goods & Services indices, falling 1.4% and 1.1%, respectively.
QNBFS Daily Technical Trader Qatar - September 07, 2023 التحليل الفني اليومي ...QNB Group
The General Index failed to
sustain its breakout above the
double-bottom formation’s
neckline and continued with
its decline into the
formation’s territory.
OJP data from firms like Vicinity Jobs have emerged as a complement to traditional sources of labour demand data, such as the Job Vacancy and Wages Survey (JVWS). Ibrahim Abuallail, PhD Candidate, University of Ottawa, presented research relating to bias in OJPs and a proposed approach to effectively adjust OJP data to complement existing official data (such as from the JVWS) and improve the measurement of labour demand.
Falcon stands out as a top-tier P2P Invoice Discounting platform in India, bridging esteemed blue-chip companies and eager investors. Our goal is to transform the investment landscape in India by establishing a comprehensive destination for borrowers and investors with diverse profiles and needs, all while minimizing risk. What sets Falcon apart is the elimination of intermediaries such as commercial banks and depository institutions, allowing investors to enjoy higher yields.
The Universal Account Number (UAN) by EPFO centralizes multiple PF accounts, simplifying management for Indian employees. It streamlines PF transfers, withdrawals, and KYC updates, providing transparency and reducing employer dependency. Despite challenges like digital literacy and internet access, UAN is vital for financial empowerment and efficient provident fund management in today's digital age.
South Dakota State University degree offer diploma Transcriptynfqplhm
办理美国SDSU毕业证书制作南达科他州立大学假文凭定制Q微168899991做SDSU留信网教留服认证海牙认证改SDSU成绩单GPA做SDSU假学位证假文凭高仿毕业证GRE代考如何申请南达科他州立大学South Dakota State University degree offer diploma Transcript
University of North Carolina at Charlotte degree offer diploma Transcripttscdzuip
办理美国UNCC毕业证书制作北卡大学夏洛特分校假文凭定制Q微168899991做UNCC留信网教留服认证海牙认证改UNCC成绩单GPA做UNCC假学位证假文凭高仿毕业证GRE代考如何申请北卡罗莱纳大学夏洛特分校University of North Carolina at Charlotte degree offer diploma Transcript
Fabular Frames and the Four Ratio ProblemMajid Iqbal
Digital, interactive art showing the struggle of a society in providing for its present population while also saving planetary resources for future generations. Spread across several frames, the art is actually the rendering of real and speculative data. The stereographic projections change shape in response to prompts and provocations. Visitors interact with the model through speculative statements about how to increase savings across communities, regions, ecosystems and environments. Their fabulations combined with random noise, i.e. factors beyond control, have a dramatic effect on the societal transition. Things get better. Things get worse. The aim is to give visitors a new grasp and feel of the ongoing struggles in democracies around the world.
Stunning art in the small multiples format brings out the spatiotemporal nature of societal transitions, against backdrop issues such as energy, housing, waste, farmland and forest. In each frame we see hopeful and frightful interplays between spending and saving. Problems emerge when one of the two parts of the existential anaglyph rapidly shrinks like Arctic ice, as factors cross thresholds. Ecological wealth and intergenerational equity areFour at stake. Not enough spending could mean economic stress, social unrest and political conflict. Not enough saving and there will be climate breakdown and ‘bankruptcy’. So where does speculative design start and the gambling and betting end? Behind each fabular frame is a four ratio problem. Each ratio reflects the level of sacrifice and self-restraint a society is willing to accept, against promises of prosperity and freedom. Some values seem to stabilise a frame while others cause collapse. Get the ratios right and we can have it all. Get them wrong and things get more desperate.
Understanding how timely GST payments influence a lender's decision to approve loans, this topic explores the correlation between GST compliance and creditworthiness. It highlights how consistent GST payments can enhance a business's financial credibility, potentially leading to higher chances of loan approval.
Economic Risk Factor Update: June 2024 [SlideShare]Commonwealth
May’s reports showed signs of continued economic growth, said Sam Millette, director, fixed income, in his latest Economic Risk Factor Update.
For more market updates, subscribe to The Independent Market Observer at https://blog.commonwealth.com/independent-market-observer.
STREETONOMICS: Exploring the Uncharted Territories of Informal Markets throug...sameer shah
Delve into the world of STREETONOMICS, where a team of 7 enthusiasts embarks on a journey to understand unorganized markets. By engaging with a coffee street vendor and crafting questionnaires, this project uncovers valuable insights into consumer behavior and market dynamics in informal settings."
Vicinity Jobs’ data includes more than three million 2023 OJPs and thousands of skills. Most skills appear in less than 0.02% of job postings, so most postings rely on a small subset of commonly used terms, like teamwork.
Laura Adkins-Hackett, Economist, LMIC, and Sukriti Trehan, Data Scientist, LMIC, presented their research exploring trends in the skills listed in OJPs to develop a deeper understanding of in-demand skills. This research project uses pointwise mutual information and other methods to extract more information about common skills from the relationships between skills, occupations and regions.
[4:55 p.m.] Bryan Oates
OJPs are becoming a critical resource for policy-makers and researchers who study the labour market. LMIC continues to work with Vicinity Jobs’ data on OJPs, which can be explored in our Canadian Job Trends Dashboard. Valuable insights have been gained through our analysis of OJP data, including LMIC research lead
Suzanne Spiteri’s recent report on improving the quality and accessibility of job postings to reduce employment barriers for neurodivergent people.
Decoding job postings: Improving accessibility for neurodivergent job seekers
Improving the quality and accessibility of job postings is one way to reduce employment barriers for neurodivergent people.
In a tight labour market, job-seekers gain bargaining power and leverage it into greater job quality—at least, that’s the conventional wisdom.
Michael, LMIC Economist, presented findings that reveal a weakened relationship between labour market tightness and job quality indicators following the pandemic. Labour market tightness coincided with growth in real wages for only a portion of workers: those in low-wage jobs requiring little education. Several factors—including labour market composition, worker and employer behaviour, and labour market practices—have contributed to the absence of worker benefits. These will be investigated further in future work.
How Does CRISIL Evaluate Lenders in India for Credit RatingsShaheen Kumar
CRISIL evaluates lenders in India by analyzing financial performance, loan portfolio quality, risk management practices, capital adequacy, market position, and adherence to regulatory requirements. This comprehensive assessment ensures a thorough evaluation of creditworthiness and financial strength. Each criterion is meticulously examined to provide credible and reliable ratings.
How Does CRISIL Evaluate Lenders in India for Credit Ratings
Weekly market report
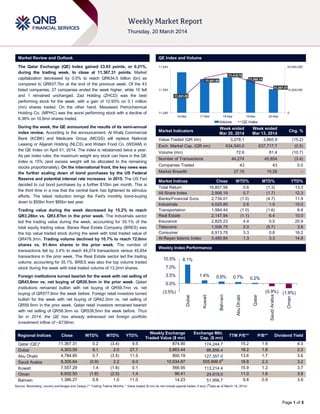
1. Page 1 of 5
Market Review and Outlook QE Index and Volume
The Qatar Exchange (QE) Index gained 23.93 points, or 0.21%,
during the trading week, to close at 11,367.31 points. Market
capitalization decreased by 0.5% to reach QR634.5 billion (bn) as
compared to QR637.7bn at the end of the previous week. Of the 43
listed companies, 27 companies ended the week higher, while 15 fell
and 1 remained unchanged. Zad Holding (ZHCD) was the best
performing stock for the week, with a gain of 12.93% on 0.1 million
(mn) shares traded. On the other hand, Mesaieed Petrochemical
Holding Co. (MPHC) was the worst performing stock with a decline of
8.38% on 10.6mn shares traded.
During the week, the QE announced the results of its semi-annual
index review. According to the announcement, Al Khalij Commercial
Bank (KCBK) and Medicare Group (MCGS) will replace National
Leasing or Alijarah Holding (NLCS) and Widam Food Co. (WDAM) in
the QE Index on April 01, 2014. The index is rebalanced twice a year.
As per index rules, the maximum weight any stock can have in the QE
index is 15% (and excess weight will be allocated to the remaining
stocks proportionately). On the international front, the key news was
the further scaling down of bond purchases by the US Federal
Reserve and potential interest rate increases in 2015. The US Fed
decided to cut bond purchases by a further $10bn per month. This is
the third time in a row that the central bank has tightened its stimulus
efforts. The latest reduction brings the Fed's monthly bond-buying
down to $55bn from $85bn last year.
Trading value during the week decreased by 15.2% to reach
QR3.28bn vs. QR3.87bn in the prior week. The Industrials sector
led the trading value during the week, accounting for 35.1% of the
total equity trading value. Barwa Real Estate Company (BRES) was
the top value traded stock during the week with total traded value of
QR476.3mn. Trading volume declined by 10.7% to reach 72.6mn
shares vs. 81.4mn shares in the prior week. The number of
transactions fell by 3.4% to reach 44,274 transactions versus 45,854
transactions in the prior week. The Real Estate sector led the trading
volume, accounting for 35.1%. BRES was also the top volume traded
stock during the week with total traded volume of 13.2mn shares.
Foreign institutions turned bearish for the week with net selling of
QR43.6mn vs. net buying of QR20.5mn in the prior week. Qatari
institutions remained bullish with net buying of QR59.7mn vs. net
buying of QR577.6mn the week before. Foreign retail investors turned
bullish for the week with net buying of QR42.3mn vs. net selling of
QR59.5mn in the prior week. Qatari retail investors remained bearish
with net selling of QR58.3mn vs. QR538.5mn the week before. Thus
far in 2014, the QE has already witnessed net foreign portfolio
investment inflow of ~$736mn.
Market Indicators
Week ended
Mar 20, 2014
Week ended
Mar 13, 2014
Chg. %
Value Traded (QR mn) 3,278.1 3,865.9 (15.2)
Exch. Market Cap. (QR mn) 634,540.0 637,717.7 (0.5)
Volume (mn) 72.6 81.4 (10.7)
Number of Transactions 44,274 45,854 (3.4)
Companies Traded 43 43 0.0
Market Breadth 27:15 15:28 –
Market Indices Close WTD% MTD% YTD%
Total Return 16,807.56 0.6 (1.3) 13.3
All Share Index 2,906.19 0.7 (1.7) 12.3
Banks/Financial Svcs. 2,734.01 (1.0) (4.7) 11.9
Industrials 4,025.85 2.6 1.5 15.0
Transportation 1,984.44 (1.0) (1.6) 6.8
Real Estate 2,147.94 (1.1) 6.4 10.0
Insurance 2,825.23 4.4 0.5 20.9
Telecoms 1,506.75 2.0 (5.7) 3.6
Consumer 6,913.78 3.3 0.8 16.2
Al Rayan Islamic Index 3,485.84 1.3 3.3 14.8
Market Indices
Weekly Index Performance
Regional Indices Close WTD% MTD% YTD%
Weekly Exchange
Traded Value ($ mn)
Exchange Mkt.
Cap. ($ mn)
TTM P/E** P/B** Dividend Yield
Qatar (QE)* 11,367.31 0.2 (3.4) 9.5 874.90 174,244.7 15.2 1.9 4.3
Dubai 4,303.55 8.1 2.0 27.7 2,663.44 86,856.4 18.2 1.6 2.2
Abu Dhabi 4,784.85 0.7 (3.5) 11.5 800.19 127,357.0 13.6 1.7 3.6
Saudi Arabia 9,305.64 (0.9) 2.2 9.0 10,934.87 505,899.5#
18.8 2.3 3.2
Kuwait 7,557.29 1.4 (1.8) 0.1 566.95 113,214.4 15.9 1.2 3.7
Oman 6,932.50 (1.8) (2.5) 1.4 96.41 24,919.0 11.0 1.6 3.8
Bahrain 1,386.27 0.8 1.0 11.0 14.23 51,956.7 9.8 0.9 3.9
Source: Bloomberg, country exchanges and Zawya (** Trailing Twelve Months; * Value traded ($ mn) do not include special trades, if any) (
#
Data as of March 19, 2014)
11,331.05
11,401.65
11,418.76
11,388.14
11,367.31
0
10,000,000
20,000,000
11,280
11,360
11,440
16-Mar 17-Mar 18-Mar 19-Mar 20-Mar
Volume QE Index
8.1%
1.4% 0.8% 0.7% 0.2%
(0.9%) (1.8%)(3.5%)
0.0%
3.5%
7.0%
10.5%
Dubai
Kuwait
Bahrain
AbuDhabi
Qatar
SaudiArabia
Oman
2. Page 2 of 5
News
Economic News
QNB Group: Gas demand growth set to benefit Qatar –
Natural gas is expected to be the fastest growing energy source
until 2035, according to the latest BP Energy Outlook 2035.
Between 2012 and 2035, natural gas demand is expected to
grow by an average 1.9% per year, outpacing all other energy
sources. LNG exports are expected to grow more than twice as
fast as gas consumption, at an average of 3.9% per year, and
accounting for 26% of growth in global gas supply to 2035.
Such large demand is likely to put upward pressure on natural
gas prices, including LNG, and as a result Qatar is likely to
benefit significantly from these developments. (QNB Group,
Gulf-Times.com)
Deposit growth outpaced loan growth in the month of
February 2014 – Loans climbed by 1.0% month-over-month
(MoM) in February 2014. This is after a strong performance of
2.3% MoM in January 2014. However, deposits expanded by
3.9% MoM in the month of February 2014 (+1.0% MoM in
January 2014). Hence, the banking sector‟s loan-to-deposit
ratio (LDR) decreased to 104% at the end of February 2014 vs.
107% in January 2014. Going forward, we expect activity in the
banking sector to pick up in the coming months with the public
sector leading the way. (QCB, QNBFS Research)
MEED: Qatar project market outlook strong amid $285bn
spending plans – According to data from MEED Projects, the
outlook for Qatar‟s project market until 2020 is strong as
projects planned or underway have reached an estimated value
of $285bn. Although the massive project activity is attributed to
Qatar‟s preparations for the FIFA World Cup 2022, the bulk of
the projects are actually part of the plan for the Qatar National
Vision 2030 economic roadmap. Qatar is undertaking a number
of mega projects in order to accomplish its National Vision, with
significant investments being poured into transportation and
shipping infrastructure. These investments include the
construction of Hamad International Airport, the New Doha
Port, and several mega cities such as Lusail and Msheireb.
(Gulf-Times.com)
MEED: Tenders for 10 new stadiums to be issued in 2014 –
Qatar, whose projects market witnessed a 21% growth in 2013
and is slated to see new deals worth $140bn-150bn in 2014,
will soon invite tenders for some 10 projects related to hosting
the 2022 World Cup. According to the MEED Insight Report,
with an average yearly $16bn outlay during 2008-13, Qatar
accounted for 12% ($96bn) of the total projects awarded in the
GCC region. Yasser al-Mulla, Project Manager at Al-Rayyan
Precinct for Supreme Committee for Delivery & Legacy said
Qatar will issue some 10 tenders in 2014 for project managers
and design consultants on the stadiums being built for the
games. Doha expects to spend an additional $4bn for building
stadiums and related sporting infrastructure for the World Cup.
The largest new stadium planned is „Lusail Iconic‟, which will
have a capacity of around 86,000 people and is to be used for
the opening match and the finals. (Gulf-Times.com)
Qatar issues $2.2bn tender for Doha Metro phase one –
Qatar has issued a new tender for phase one of the Doha
Metro, a key infrastructure project in the Gulf country as it
prepares to host the 2022 World Cup. According to sources, the
tender, issued earlier this month, is for the rolling stock,
systems, depot facilities, track work and other aspects of Doha
Metro. The tender, which could cross $2.2bn, would be the final
one for the metro‟s phase one and the contract is expected to
be awarded in the next five months. Last year, Qatar awarded
four design & build contracts worth about $8.2bn for phase one
of the Doha Metro. (Gulf-Times.com)
QCB: Qatar to sign construction projects worth $50bn –
The Qatar Central Bank (QCB) Governor HE Sheikh Abdullah
bin Saud Al Thani said that Qatar‟s government is expected to
sign various contracts for construction projects worth as much
as $50bn in 2014 as it builds infrastructure needed to host the
soccer World Cup in 2022. HE Sheikh Abdullah said that these
projects will be in transport, energy and other sectors. He
stated that this reflected the rapid development of the Qatari
economy and the extended growth expected in the next few
years for achieving the Qatar National Vision (QNV) 2030. He
mentioned that in order to achieve the QNV 2030 goals, various
QCB initiatives, including the strategy of supervisory and
regulatory bodies have been launched. (Gulf-Times.com,
Peninsula Qatar)
$6.5bn Al Karaana petchem project eyes Asian markets –
The new Al Karaana petrochemicals project – a 80:20 JV of
Qatar Petroleum and Shell – is eyeing Asian markets to a great
extent for its products. Al Karaana‟s CEO designate Stijn van
Els said that the estimated $6.5bn project, which is now in the
middle of the FEED phase, will embark on the next stage of
engineering, procurement & construction (EPC) and is
considering a mix of conventional bank loans and Islamic
financing. In March 2013, Qatar had awarded the plant‟s front-
end engineering & design (FEED) contract to Fluor. The project
is slated for completion by 2018. Upon commissioning, the
project is expected to contribute an additional 25% to Qatar‟s
petrochemicals production capacity. Els said that the plant‟s
total production capacity would be 2mn tons per year of
petrochemicals, including 1.5mn tons of mono ethylene glycol,
300,000 tons of linear alpha olefin and 250,000 tons of oxo
alcohol. (Gulf-Times.com)
Qatar to launch $65bn worth projects – The Administrative
Control and Transparency Authority‟s President HE Abdullah
bin Hamad Al Attiyah announced that Qatar is set to launch
development projects worth around $65bn soon. Of this, $30bn
ventures are high-profile projects. Al Attiyah said that Qatar is
set to launch large number of mega projects to realize the
Qatar National Vision 2030, as well as other infrastructure
projects associated with hosting the FIFA 2022 event. These
projects vary from stadiums, railway network, roads, highways,
bridges, intersections, water and electricity, hotels and urban
development. (Peninsula Qatar)
Market & Corporate News
MPHC posts QR609.6mn net profit from May 29, 2013 to
December 31, 2013 – Mesaieed Petrochemical Holding
Company (MPHC) reported a net profit of QR609.6mn for the
period May 29, 2013 to December 31, 2013. On a separate
note, the company announced the financial highlights of the last
four months of 2013 (more relevant to shareholders). According
to which MPHC registered a net profit of ~QR0.6bn for the four-
month period ended December 31, 2013, and the Board of
Directors proposed a cash dividend of ~QR0.4bn, or QR0.35
per share. This proposed dividend is equivalent to 72.1% of net
profit. The Board also recommended that the shareholders as
of the close of trading on the last trading day before the group‟s
first post-IPO annual general assembly meeting will be entitled
to receive a dividend relating to the four-month period ended
December 31, 2013 despite the fact that MPHC was only listed
on February 26, 2014. (MPHC Press Release, MPHC Financial
Statements)
3. Page 3 of 5
Qatar Exchange
Top 5 Gainers Top 5 Decliners
Source: Qatar Exchange (QE) Source: Qatar Exchange (QE)
Most Active Shares by Value (QR Million) Most Active Shares by Volume (Million)
Source: Qatar Exchange (QE) Source: Qatar Exchange (QE)
Investor Trading Percentage to Total Value Traded Net Traded Value by Nationality (QR Million)
Source: Qatar Exchange (QE) Source: Qatar Exchange (QE)
12.9%
10.3%
8.5%
8.0%
6.9%
0.0%
4.5%
9.0%
13.5%
Zad Holding Islamic
Holding Group
Qatar Cinema
& Film
Distribution
Widam Food
Co.
Qatari
Investors
Group
-8.4%
-7.7%
-4.6%
-3.0% -3.0%
-15.0%
-10.0%
-5.0%
0.0%
Mesaieed
Petrochemical
Holding
Company
Qatar Gas
Transport
(Nakilat)
Commercial
Bank of Qatar
QNB Group Al Khaleej
Takaful
Insurance
476.3
394.9
350.2
327.3
179.2
0.0
200.0
400.0
600.0
Barwa Real
Estate
Mesaieed
Petrochemical
Holding
Company
Qatari
Investors
Group
QNB Group Industries
Qatar
13.2
10.6
9.1
6.4
3.6
0.0
5.0
10.0
15.0
Barwa Real
Estate
Mesaieed
Petrochemical
Holding
Company
Mazaya Qatar Qatari
Investors
Group
Masraf Al
Rayan
0%
20%
40%
60%
80%
100%
Buy Sell
47.46% 49.24%
17.66% 15.84%
16.62% 15.33%
18.26% 19.59%
Qatari Individuals Qatari Institutions
Non-Qatari Individuals Non-Qatari Institutions
2,135
1,143
2,133
1,145
1
(1)
(500) - 500 1,000 1,500 2,000 2,500
Qatari
Non-Qatari
Net Investment Total Sold Total Bought
4. Page 4 of 5
TECHNICAL ANALYSIS OF THE QE INDEX
Source: Bloomberg
The QE Index ended the volatile week on a slightly positive note and snapped its three-week losing streak. The index attempted to halt its recent downmove
and closed last week on a predominantly flattish note. The index after Sunday‟s decline witnessed a short-rally on Monday & Tuesday and managed to
climb above the 11,400.0 psychological level. However, the rally was short-lived as the index reversed in the remaining two trading sessions. Meanwhile,
the index has strong support near the 11,300.0 level, which is also in proximity to the 55-day moving average (currently at 11,307.30). We believe if the
index can stay above 11,300.0 and attempt a rebound above the 11,400.0-11,480.0 levels, it may set the stage for a further higher move toward the
11,500.0-11,600.0 levels. However, if the index fails to cling onto to its support of the 55-day moving average and the 11,300.0 level it may result in bearish
implications and may drift lower to test the next important support near the 11,170.0 level. Further, the RSI is stalling, while the MACD continues to grow
more bearish. Thus, we expect the volatility to continue.
DEFINITIONS OF KEY TERMS USED IN TECHNICAL ANALYSIS
RSI (Relative Strength Index) indicator – RSI is a momentum oscillator that measures the speed and change of price movements. The RSI oscillates
between 0 to 100. The index is deemed to be overbought once the RSI approaches the 70 level, indicating that a correction is likely. On the other hand, if
the RSI approaches 30, it is an indication that the index may be getting oversold and therefore likely to bounce back.
MACD (Moving Average Convergence Divergence) indicator – The indicator consists of the MACD line and a signal line. The divergence or the
convergence of the MACD line with the signal line indicates the strength in the momentum during the uptrend or downtrend, as the case may be. When the
MACD crosses the signal line from below and trades above it, it gives a positive indication. The reverse is the situation for a bearish trend.
Candlestick chart – A candlestick chart is a price chart that displays the high, low, open, and close for a security. The „body‟ of the chart is portion between
the open and close price, while the high and low intraday movements form the „shadow‟. The candlestick may represent any time frame. We use a one-day
candlestick chart (every candlestick represents one trading day) in our analysis.
Doji candlestick pattern – A Doji candlestick is formed when a security's open and close are practically equal. The pattern indicates indecisiveness, and
based on preceding price actions and future confirmation, may indicate a bullish or bearish trend reversal.
Shooting Star/Inverted Hammer candlestick patterns – These candlestick patterns have a small real body (open price and close price are near to each
other), and a long upper shadow (large intraday movement on the upside). The Shooting Star is a bearish reversal pattern that forms after a rally. The
Inverted Hammer looks exactly like a Shooting Star, but forms after a downtrend. Inverted Hammers represent a potential bullish trend reversal.
5. Contacts
Saugata Sarkar Ahmed M. Shehada Keith Whitney Sahbi Kasraoui
Head of Research Head of Trading Head of Sales Manager - HNWI
Tel: (+974) 4476 6534 Tel: (+974) 4476 6535 Tel: (+974) 4476 6533 Tel: (+974) 4476 6544
saugata.sarkar@qnbfs.com.qa ahmed.shehada@qnbfs.com.qa keith.whitney@qnbfs.com.qa sahbi.alkasraoui@qnbfs.com.qa
QNB Financial Services SPC
Contact Center: (+974) 4476 6666
PO Box 24025, Doha, Qatar
DISCLAIMER: This publication has been prepared by QNB Financial Services SPC (“QNBFS”) a wholly-owned subsidiary of Qatar National Bank (“QNB”). QNBFS is regulated by the Qatar
Financial Markets Authority and the Qatar Exchange; QNB is regulated by the Qatar Central Bank. This publication expresses the views and opinions of QNBFS at a given time only. It is not an
offer, promotion or recommendation to buy or sell securities or other investments, nor is it intended to constitute legal, tax, accounting, or financial advice. We therefore strongly advise potential
investors to seek independent professional advice before making any investment decision. Although the information in this report has been obtained from sources that QNBFS believes to be
reliable, we have not independently verified such information and it may not be accurate or complete. While this publication has been prepared with the utmost degree of care by our analysts,
QNBFS does not make any representations warranties as to the accuracy and completeness of the information it may contain, and declines any liability in that respect. QNBFS reserves the right
to amend the views and opinions expressed in this publication at any time. It may also express viewpoints or make investment decisions that differ significantly from, or even contradict, the views
and opinions included in this report.
COPYRIGHT: No part of this document may be reproduced without the explicit written permission of QNBFS.
Page 5 of 5
Source: Bloomberg
Company Name
Price
(Mar 20)
% Change 5-
Day
% Change
YTD
Market Cap.
QR Million TTM P/E P/B Div. Yield
Qatar National Bank 177.00 (3.01) 2.91 123,852 13.1 2.3 4.0
Qatar Islamic Bank 72.90 (0.82) 5.65 17,226 12.9 1.5 5.5
Commercial Bank of Qatar 60.00 (4.64) 1.69 17,816 11.1 1.1 2.8
Doha Bank 58.40 1.92 0.34 15,089 10.1 1.3 7.7
Al Ahli Bank 50.40 2.86 19.13 8,326 15.8 2.3 N/A
Qatar International Islamic Bank 71.60 0.14 16.05 10,838 14.4 2.0 5.2
Masraf Al Rayan 38.50 0.79 23.00 28,875 17.0 2.7 3.9
Al Khaliji Bank 20.94 0.96 4.75 7,538 13.7 1.3 4.8
National Leasing 28.10 (0.18) (6.80) 1,390 15.9 1.1 5.3
Dlala Holding 22.86 1.83 3.44 507 N/M 2.3 N/A
Qatar & Oman Investment 12.40 0.40 (0.96) 391 19.7 1.2 4.0
Islamic Holding Group 61.90 10.34 34.57 248 27.4 4.2 2.7
Banking and Financial Services 232,096
Zad Holding 76.00 12.93 9.35 994 10.1 0.8 5.3
Qatar German Co. for Medical Devices 13.60 0.74 (1.81) 157 N/M 0.8 N/A
Salam International Investment 12.06 (0.66) (7.30) 1,379 12.1 0.8 8.3
Medicare Group 65.00 4.50 23.81 1,829 29.8 2.4 2.8
Qatar Cinema & Film Distribution 43.95 8.52 9.60 251 33.6 1.8 4.6
Qatar Fuel 248.00 3.33 13.48 20,946 17.2 3.3 3.1
Qatar Meat and Livestock 45.50 7.95 (11.99) 819 14.9 3.3 8.8
Al Meera Consumer Goods 161.40 (0.31) 21.08 3,228 15.7 2.4 5.0
Consumer Goods and Services 29,603
Qatar Industrial Manufacturing 43.05 1.06 2.09 2,046 10.1 1.5 5.8
Qatar National Cement 119.50 0.42 0.42 5,868 13.5 2.3 5.0
Industries Qatar 178.90 2.11 5.92 108,235 13.5 3.2 6.1
Qatari Investors Group 55.60 6.92 27.23 6,913 31.3 3.2 1.3
Qatar Electricity and Water 171.00 2.09 3.41 18,810 13.6 3.1 4.0
Mannai Corp. 105.10 2.84 16.91 4,795 10.8 2.2 4.5
Aamal 14.35 0.35 (4.33) 8,610 17.1 1.2 N/A
Gulf International Services 79.00 5.61 61.89 14,681 21.7 4.8 2.0
Mesaieed Petrochem. Holding Co. 35.00 (8.38) N/A 43,971 N/A N/A N/A
Industrials 213,927
Qatar Insurance 64.90 3.84 21.99 10,419 12.8 2.0 3.1
Doha Insurance 22.60 (1.74) (9.60) 582 8.7 1.1 8.8
Qatar General Insurance & Reinsurance 40.00 6.19 0.21 2,767 1.3 0.6 3.1
Al Khaleej Takaful Insurance 42.20 (2.99) 15.62 721 10.9 1.2 2.0
Qatar Islamic Insurance 62.50 4.17 7.94 938 14.7 3.4 6.0
Insurance 15,426
United Development 21.85 (1.00) (3.36) 7,368 22.8 0.7 4.6
Barwa Real Estate 35.30 (1.40) 18.46 13,736 17.5 1.0 4.2
Ezdan Real Estate 15.95 (1.54) (6.18) 42,307 N/M 1.5 0.8
Mazaya Qatar Real Estate Development 12.62 1.28 12.88 1,262 19.1 1.2 4.8
Real Estate 64,674
Qatar Telecom 139.80 2.42 1.90 44,781 17.4 1.8 3.6
Vodafone Qatar 12.20 0.00 13.91 10,314 N/M 1.7 N/A
Telecoms 55,095
Qatar Navigation (Milaha) 93.00 0.22 12.05 10,651 11.2 0.8 4.0
Gulf Warehousing 42.10 2.68 1.45 2,002 19.7 2.5 3.6
Qatar Gas Transport (Nakilat) 19.76 (7.66) (2.42) 11,066 15.0 2.5 5.6
Transportation 23,719
Qatar Exchange 634,540