The Qatar Exchange Index lost 4.85% over the week to close at 9,619.04 points as market capitalization decreased by 4.36% to QR526.5 billion. Regional markets also declined between 1.2-6.6% due to concerns over regional tensions and the potential tapering of US quantitative easing. Trading value increased 29.86% to QR2.4 billion while volume rose 16.38% to 56.2 million shares. Foreign institutions remained net sellers while local institutions were net buyers.
The QE Index gained 4.51% over the week driven by improved regional market performance. Trading value and volume increased 15.74% and 18.03% respectively. Foreign investors remained net sellers while local institutions were net sellers and non-Qatari individuals were net buyers. Regional indices also rose with Dubai gaining the most at 8.62% due to reduced geopolitical tensions. The Qatari population is expected to grow significantly this year due to infrastructure investment leading to job creation.
- The Qatar Exchange Index declined 3.31% for the week to close at 13,874.97 points, as market capitalization decreased 3.1% to QR739.2 billion.
- Trading value and volume both decreased from the prior week, falling 18% and 17.3% respectively. The real estate sector accounted for the largest trading volume and value.
- Foreign and Qatari institutions were net sellers during the week, while foreign and Qatari retail investors were net buyers.
- The Qatar Stock Exchange Index lost 1.42% over the week to close at 11,439.30 points as 32 stocks fell, 8 rose, and 3 remained unchanged. Trading value remained flat at QR1.17bn while volume increased 1.9% to 29.1mn shares.
- Foreign institutions remained net buyers during the week at QR25.4mn while Qatari institutions were net sellers at QR79.8mn. Qatar's population increased 2.8% month-over-month to 2.412 million residents as of October 31, 2015.
- The Qatar Central Bank auctioned QR2bn in treasury bills, with yields rising from the previous auction. Emir Tamim bin
The QE Index lost 2.42% over the week to close at 13,443.16 points. Market capitalization decreased by 1.5% to QR719.4 billion. Three stocks, Masraf Al Rayan, Ooredoo, and Qatar Electricity and Water, were the biggest contributors to the weekly index decline. Trading value increased by 11.6% while trading volume decreased by 21.7%. Foreign institutions remained bullish while Qatari and foreign retail investors remained bearish.
The Qatar Stock Exchange Index declined 3.6% during the week, closing at 11,862.51 points. Industries Qatar (IQCD) was the worst performing stock, declining 17.61% and was the biggest contributor to the weekly index decline. Trading value increased 14.9% during the week to QR2.9 billion, led by the Industrials sector. Foreign institutions remained net sellers during the week with net sales of QR133.3 million.
The QSE Index gained 1.98% over the week to close at 12,133.23, with market capitalization increasing 1.3% to QR642.36 billion. Ezdan Holding Group was the best performing stock, gaining 8.19%, while QNB Group declined the most by 1.44%. Trading value increased 54.23% to QR1.53 billion due to higher trading in the banks and financial services sector. Foreign institutions remained net buyers during the week at QR161.1 million.
- The Qatar Exchange Index gained 4.05% over the week to close at 13,465.69 points, with market capitalization increasing 3.9% to QR726.5 billion. Trading value increased 2.2% to QR2.89 billion while trading volume rose 12.1% to 60.1 million shares.
- Industries Qatar, QNB Group, and Gulf International Services were the top contributors to the weekly index gain. Foreign institutions turned to net buying while Qatari institutions engaged in net selling.
- Real estate prices in Qatar reached an all-time high in September according to the Qatar Central Bank, with the price index surging 42.1% year-over-year. Several
The Qatari stock market declined slightly over the week. Trading value increased slightly while volume decreased. Foreign institutions remained bearish through net selling, while Qatari institutions and retail investors remained bullish through net buying. The biggest decliners for the week were Ezdan Holding Group, Commercial Bank of Qatar, and Industries Qatar. Several companies set dates to disclose upcoming quarterly financial results. Qatar also amended rules regarding classification of GCC citizens invested in Qatari equities.
The QE Index declined 5.12% for the week. Trading value and volume decreased as well. QNBK, MARK and IQCD were the biggest contributors to the weekly index decline. Only MERS ended the week with a gain. Foreign investors remained bearish with net selling while Qatari investors remained bullish with net buying. The economy is expected to grow in 2014 and 2015, driven by non-hydrocarbon sectors. Inflation is expected to remain moderate while the current account surplus is expected to decrease. CBQK successfully issued $750 million in bonds and Empower paid the first installment of its loan to Doha Bank. Woqod is finalizing its five-year plan to expand facilities
The QE Index gained slightly during the week but market capitalization decreased slightly. Trading value, volume, and number of transactions all declined compared to the previous week. Two stocks will be added to the QE Index while two will be removed. The US Federal Reserve further reduced its bond purchasing program. Projected spending on infrastructure and facilities for the 2022 World Cup is estimated at $50 billion for 2014.
The Qatari stock market gained slightly over the week. Trading volume and value decreased compared to the previous week. Industries Qatar and Qatar Islamic Bank were the largest contributors to the weekly index gain, while Ooredoo and Qatar Insurance negatively contributed. Foreign institutions remained net sellers during the week, while Qatari institutions were net buyers. Several companies announced dividends for 2014, with Gulf International Services announcing a large year-over-year increase.
- The QSE Index declined 2.46% over the week due to falls in Industries Qatar, Masraf Al Rayan and Ezdan Holding Group. Trading value and volume also decreased over the week.
- Foreign institutions were net sellers over the week while Qatari institutions were net buyers. Qatar's GDP is projected to grow over 7% annually through 2017 due to investments in non-hydrocarbon sectors.
- Company news included MERS reporting a higher profit and dividend for 2014 and Mesaieed Petrochemical guiding to lower sales volumes and earnings in 2015.
The QE Index declined 2.27% over the week to close at 11,343.38 points. Trading volume increased 11.9% while value traded rose 7.61%. Two real estate companies, BRES and ERES, announced financial results. BRES reported a net profit of QR1.37bn for 2013 and recommended a dividend of QR2.00 per share. ERES reported a net profit of QR1.1bn for 2013 and recommended a dividend of QR0.31 per share, and also acquired over 20% of IHGS shares. Foreign and Qatari institutions remained net buyers during the week.
The QSE Index fell 1.98% over the week to close at 11,880.82 points. Trading value and volume both decreased over the week. IQCD, QNBK, and BRES were the largest drags on the index, while QATI and CBQK contributed positively. Foreign institutions turned bearish and net sold shares, while Qatari institutions remained bullish and were net buyers. The real estate sector led trading value and volume for the week.
The QE Index gained 0.57% over the week to close at 9,298.75 points, while market capitalization rose 0.61% to QR512.2 billion. Trading value decreased 29.22% to QR1,290.7 million as volume fell 41.77% to 28.3 million shares. Islamic Holding Group was the best performer, up 12.83%, while Qatar Cinema & Film Distribution declined the most at 8.80%. Regional markets were mixed, with Qatar outperforming declines in Dubai and Abu Dhabi. Foreign investors remained net sellers of QR100 million for the week.
The QSE Index increased slightly over the week, with market capitalization also rising. Trading volume and value increased compared to the previous week. Qatar International Islamic Bank, Mesaieed Petrochemical Holding Company and QNB Group were the largest contributors to the weekly index gain. Foreign institutions reported net buying while Qatari retail investors reported net selling. The report also provided updates on recent economic news in Qatar including UNCTAD data on FDI and Qatar's global economic performance ranking, as well as notes on LNG expansion projects and ratings updates.
The QE Index gained 1.24% over the week to close at 12,550.98 points. Market capitalization increased by 2.73% to QR728.6 billion. Three companies reported their Q1 2014 results: QIBK posted a net profit of QR335.4 million, down 6.9% QoQ; ABQK reported a net profit of QR150.8 million, surging 34.5% QoQ; and GWCS reported a net profit of QR28.9 million, up 7.7% QoQ. Foreign institutions remained net buyers while Qatari and foreign retail investors remained net sellers.
The Qatar Stock Exchange Index lost 541 points, or 4.35%, during the week. Trading value increased 57% while volume rose 54%. The real estate sector contributed most to trading value and volume. Ezdan Holding Group saw the biggest losses and was the top traded stock by value and volume. Foreign institutions remained net buyers while Qatari institutions were net sellers.
- The Qatar Exchange Index declined 6.4% for the week, with trading value increasing 3.1% but volume decreasing 18%. Foreign investors remained bearish with net selling while Qatari investors remained bullish.
- Qatar's foreign reserves hit an all-time high of $43.5 billion in August, driven by a strong current account surplus. Inflation rose 3.6% year-over-year in September due to higher rents.
- QNB Group posted a 12.6% year-over-year increase in net profit for the first nine months of 2014 to QR8 billion, driven by higher operating income and net interest income.
The Qatar Exchange Index declined 1.91% over the week. Trading value and volume decreased significantly. Masraf Al Rayan and Ooredoo were the biggest decliners, while QNB Group and Gulf International Services helped limit losses. Foreign investors continued net buying while Qatari investors net sold. Inflation in Qatar rose to 3.4% in May due to higher rents and fuel costs. Standard Chartered maintained a stable outlook for Qatar given its dominant position in global LNG markets. Gulf Drilling International won two land rig contracts worth QR1.1 billion from Qatar Petroleum.
- The QSE Index lost 0.13% over the week to close at 11,770.25, with market capitalization decreasing slightly. Trading value and volume also decreased from the prior week.
- The Banks and Financial Services sector contributed the most to trading value and volume, while Masraf Al Rayan, Barwa Real Estate, and Vodafone Qatar were the biggest detractors from the weekly index loss.
- Foreign institutions turned bullish with net buying during the week, while Qatari and foreign retail investors turned bearish with net selling.
The Qatar Exchange Index lost 2.94% over the week to close at 9,580.77 points, as market capitalization decreased by 2.85% to QR522 billion. Of the 42 listed companies, 8 increased while 32 declined and 2 remained unchanged. Trading value decreased 17.39% to QR1.4 billion while trading volume fell 36.38% to 27.3 million shares. Foreign institutions were net sellers of QR103.7 million worth of equities. We remain positive on the long-term outlook for Qatari equities and recommend accumulating strong companies on dips.
The QE index in Qatar rose 0.5% led by gains in the banking and consumer goods sectors. Medicare Group and Masraf Al Rayan were the top gainers rising over 2% each. The Dubai and Abu Dhabi markets declined over 1% and 0.6% respectively due to losses in real estate and financial stocks. Globally, US wholesale inventories and sales rose less than expected in June while French and German industrial production declined in the same month.
The document provides an overview of stock market activity and company news from Qatar and other GCC countries. Key points:
- The Qatar stock market index rose 0.2% led by gains in the telecom and industrial sectors. Top gainers were Qatar German Co. for Med. Dev. and Islamic Holding Group.
- Regional markets were mixed with Dubai and Abu Dhabi rising while Saudi Arabia, Kuwait, and Oman fell.
- Company earnings news included QNB Group reporting a 15.1% rise in 1H2013 net profit and its plans to commence operations in India in 3Q2013.
- MSCI Qatar Index announced provisional weights for some Qatari companies
The QE index in Qatar declined 1.6% led by losses in the Industrials and Telecoms indices. Qatar Cinema & Film Dist. Co. and Qatar German Co. for Med. Dev. were the top losers, falling 7.4% and 4.7% respectively. Regional indices also declined, with Dubai down 2.5%, Abu Dhabi falling 3.0% and Saudi Arabia declining 0.4%. Global economic data was mixed, with US vehicle sales beating estimates but factory orders declining more than expected.
The QE index in Qatar rose 0.3% led by gains in the telecom and insurance indices. Dlala Brok. & Inv. Holding Co. and Ooredoo were the top gainers, while Islamic Holding Group and Al Meera Consumer Goods Co. declined. Volume traded was lower than the 30-day average. In other GCC markets, Saudi Arabia and Abu Dhabi rose while Kuwait fell. Global economic data showed higher than expected US consumer credit and small business optimism, while UK industrial production was flat.
The QE index in Qatar rose 0.6% led by gains in the Transportation and Banking & Financial Services indices. QNB Group and Qatar Navigation were the top gainers rising over 2% each, while Qatar Industrial Manufacturing fell 3.7%. Regional indices in Saudi Arabia, Dubai, Abu Dhabi, Kuwait and Oman also rose between 1-2.5%. In company news, QGTS' joint venture received $662 million in refinancing to expand its LNG fleet, and Ashghal awarded a contract to oversee road projects in Qatar.
The QE index in Qatar rose 0.4% led by gains in the transportation and telecom sectors. Qatar Electricity & Water Co. and Qatar Gas Transport Co. were the top gainers, while Al Ahli Bank fell 3.2%. Most other GCC markets fell except for Saudi Arabia and Oman. Earnings were reported from Dubai Refreshments Co., and global economic data was mixed with US factory orders beating estimates but economic optimism declining. In company news, Qatar established a new economic council and various Qatar companies set dates to disclose earnings. The US Fed adopted new Basel III rules to regulate banks while the BoE plans new bank capital rules.
Real GDP growth in Qatar reached 6.2% in Q1 2013, in line with QNB Economics' forecast. Higher oil and gas production boosted exports and the current account surplus, while lower investment outflows narrowed the financial account deficit. CPI inflation stabilized at 3.5% despite rising rents as non-rent inflation slowed. The new Emir reshuffled ministries and cabinet positions. Efforts are underway to increase foreign ownership limits in listed Qatari companies. Qatar and the UAE were upgraded to emerging market status by MSCI.
QNBFS Weekly Market Report August 22, 2019QNB Group
The Qatar Stock Exchange Index increased 3.09% for the week. Ooredoo was the best performing stock, rising 8.9%, while Qatar First Bank declined the most at 7.5%. Trading value and volume both significantly increased. Foreign institutions remained bearish through net selling, while Qatari institutions were bullish with net buying. Qatar's industrial production rose 1.9% year-over-year in June led by increases in manufacturing. Construction activity is picking up as Qatar saw a 51% rise in building permits issued in July. Russia's VTB bank acquired a 19% stake in Qatari lender CQUR Bank.
The QE Index gained 1.55% over the week to close at 13,076.33 points, with market capitalization increasing 0.77% to QR695.6 billion. Trading volume increased 656.1% to 85.1 million shares, while value traded rose 611.9% to QR3.4 billion. Mazaya Qatar was the top performing stock with a 19.78% gain, while Industries Qatar fell 2.19%. Qatar Islamic Bank, Qatari Investors Group and Nakilat were the biggest index contributors. Foreign institutions remained net buyers during the week at QR143.1 million.
The Qatar Stock Exchange Index lost 0.44% over the week. Trading value and volume increased significantly by 96.69% and 115.62% respectively. The Banks and Financial Services sector contributed most to trading value, while the Real Estate sector led trading volume. Foreign institutions remained bearish, while Qatari institutions turned bullish. Construction of Qatar's Al Khor Al Bayt 2022 FIFA World Cup stadium is set to begin in September 2015.
The QSE Index lost 0.54% over the week to close at 11,944.62 points. Trading value and volume decreased 58.07% and 64.08% respectively. Industries Qatar, Ooredoo, and Gulf International Services were the top decliners for the week. Foreign institutions continued net selling while Qatari institutions remained net buyers. Economic news included Turkey's Alternatifbank receiving a $125 million loan from Qatari banks, and Qatar being named the top per capita energy subsidizer in the world. Several companies set dates to disclose upcoming financial results.
The Qatar Exchange Index declined 3.37% over the week, with market capitalization decreasing by 2.51%. Trading value and volume both decreased compared to the previous week. Masraf Al Rayan and Qatar Islamic Bank were the biggest contributors to the weekly index decline. Foreign institutions continued net buying during the week, while Qatari and foreign retail investors were mixed. Nakilat took over operations of the first LNG vessel as it moves toward becoming the owner and operator of the fleet.
The Qatar Stock Exchange index fell 1.33% over the week. Trading volume and value increased significantly compared to the previous week. The real estate and banking sectors were the top contributors to trading value and volume. Key stocks like Ezdan Holding Group and Gulf International Services decreased the index, while Industries Qatar and Qatar Islamic Bank increased it. Foreign investors remained net sellers while Qatari investors were net buyers. Real estate prices in Qatar reached a new record high in June according to a central bank index.
The Qatar Exchange Index gained 2.25% over the week to close at 10,109.50 points. Trading value and volume increased substantially compared to the prior week. Al Khalij Commercial Bank was the best performing stock, up 11.79% for the week. Emerging markets remain under pressure from the potential tapering of US quantitative easing programs, which could slow global growth. Regional markets have fared better than emerging markets in recent weeks.
The Qatar Stock Exchange Index lost 3.11% over the week to close at 10,522.21 points. Trading value and volume both decreased significantly over the week. Several of Qatar's largest companies, including QNB Group, Industries Qatar, and Masraf Al Rayan were primary contributors to the weekly index loss. Foreign institutions remained net sellers during the week, while Qatari institutions and retail investors were net buyers.
The QE Index gained 4.74% over the week to close at 12,376.62 points, with market capitalization increasing 5.04% to QR676.3 billion. Trading value increased 48.95% to QR3.4 billion compared to the prior week, led by the Banks & Financial Services sector. Trading volume rose 90.09% to 85.7 million shares. QNB Group, Masraf Al Rayan and Qatar Islamic Bank were the largest index contributors. Foreign institutions remained net sellers while Qatari institutions were net buyers.
The Qatar Exchange Index gained slightly during the week but trading volume declined. Two stocks, Masraf Al Rayan and Vodafone Qatar, were the biggest contributors to the index's gain. Regional markets were mixed, with Abu Dhabi's index the top performer. Market indicators showed foreign institutions turned to net buying while Qatari institutions sold shares.
The Qatar Exchange Index gained 2.04% over the week to close at 9,479.80 points, as market capitalization rose by 1.74% to QR520 billion. Trading value and volume increased significantly by 65.21% and 37.69% respectively. MSCI upgraded Qatar and the UAE to emerging market status, which is expected to result in $450-650 million of foreign investments flowing into the Qatari market. Foreign institutions turned to net buying while Qatari individuals remained net sellers during the week.
The Qatar Stock Exchange Index gained slightly over the week. Trading value and volume decreased compared to the previous week. The real estate sector contributed the most to trading value and volume. Foreign institutions turned to net buying during the week after net selling the previous week. The report also provides details on index performance, company news, and economic news including forecasts for moderating real estate growth and inflation in Qatar.
The QSE Index gained 1.02% over the week to close at 13,729.78 points, with market capitalization increasing 1.17% to QR742.4 billion. Trading value and volume increased 35.5% and 10.5% respectively. Foreign institutions remained net buyers while Qatari institutions were net sellers. Barwa Real Estate was the top performer with a 12.7% gain and the biggest contributor to the weekly index gain. The Emir of Qatar announced plans to merge Enterprise Qatar and Qatar Development Bank to further support private sector growth.
The Qatari stock market declined slightly over the past week. Trading volume and value both decreased compared to the previous week. Several sectors such as real estate and banks contributed most to the market decline. Foreign investors were net sellers during the week while Qatari investors were net buyers. Overall, the Qatari market outperformed other GCC markets in 2014 with an 18.4% return, while Kuwait's market declined 13.4% for the year.
The QE Index declined 4.05% over the trading week to close at 12,453.76 points. Trading value decreased 22.08% to QR3.2 billion, while volume fell 33.29% to 66.7 million shares. Ooredoo was the worst performing stock, declining 11.80%, while Qatar Cinema & Film Distribution saw the largest gain of 21.52%. Foreign institutions were net sellers of QR132.6 million for the week.
QNBFS Daily Market Report December 24, 2023QNB Group
The QE Index rose 0.8% to close at 10,285.3. Gains were led by the Transportation and Banks & Financial Services indices, gaining 1.4% and 1.2%, respectively.
QNBFS Daily Technical Trader Qatar - October 10, 2023 التحليل الفني اليومي لب...QNB Group
The document provides a daily technical analysis of the QE Index and QATAR INSURANCE CO stock. For the QE Index, it notes the index remains in a downtrend but is approaching a support level of 9,700, where long positions could be taken. It provides expected resistance and support levels. For QATAR INSURANCE CO stock, it notes the stock has not fallen as much as others and the uptrend remains intact above moving averages, though liquidity is low. It provides expected price targets and resistance/support levels for the stock. Definitions of technical analysis terms like candlesticks, support, and simple moving average are also included.
QNBFS Daily Market Report October 04, 2023QNB Group
The QE Index rose 0.2% to close at 10,273.3. Gains were led by the Transportation and Consumer Goods & Services indices, gaining 1.7% and 0.1%, respectively.
QNBFS Daily Technical Trader Qatar - October 04, 2023 التحليل الفني اليومي لب...QNB Group
The General Index failed to sustain its breakout above the double-bottom formation’s neckline and continued with its decline into the formation’s territory.
QNBFS Daily Technical Trader Qatar - September 28, 2023 التحليل الفني اليومي ...QNB Group
The General Index failed to sustain its breakout above the double-bottom formation’s neckline and continued with its decline into the formation’s territory.
QNBFS Daily Market Report September 24, 2023QNB Group
- The QE Index in Qatar rose 0.3% led by gains in the Transportation and Industrials indices. Qatar Navigation and Al Khaleej Takaful Insurance were the top gainers.
- Regional markets were mixed with Saudi Arabia down 1% but Abu Dhabi up marginally. Economic data from the US and Europe was mixed.
- In Qatar news, QR500mn in bills were sold at a yield of 5.755% and Gulf International Services approved final merger agreements. Ooredoo also signed an MoU to support businesses in Qatar free zones.
QNBFS Daily Technical Trader Qatar - September 24, 2023 التحليل الفني اليومي ...QNB Group
The General Index failed to sustain its breakout above the double-bottom formation’s neckline and continued with its decline into the formation’s territory.
QNBFS Daily Technical Trader Qatar - September 19, 2023 التحليل الفني اليومي ...QNB Group
The General Index failed to sustain its breakout above the double-bottom formation’s neckline and continued with its decline into the formation’s territory.
QNBFS Daily Market Report September 17, 2023QNB Group
The QE Index declined 0.5% to close at 10,319.3. Losses were led by the Industrials and Consumer Goods & Services indices, falling 1.4% and 1.1%, respectively.
QNBFS Daily Technical Trader Qatar - September 07, 2023 التحليل الفني اليومي ...QNB Group
The General Index failed to
sustain its breakout above the
double-bottom formation’s
neckline and continued with
its decline into the
formation’s territory.
QNBFS Daily Technical Trader Qatar - September 06, 2023 التحليل الفني اليومي ...QNB Group
The General Index failed to sustain its breakout above the double-bottom formation’s neckline and continued with its decline into the formation’s territory.
❼❷⓿❺❻❷❽❷❼❽ Dpboss Matka Result Satta Matka Guessing Satta Fix jodi Kalyan Final ank Satta Matka Dpbos Final ank Satta Matta Matka 143 Kalyan Matka Guessing Final Matka Final ank Today Matka 420 Satta Batta Satta 143 Kalyan Chart Main Bazar Chart vip Matka Guessing Dpboss 143 Guessing Kalyan night
Easily Verify Compliance and Security with Binance KYCAny kyc Account
Use our simple KYC verification guide to make sure your Binance account is safe and compliant. Discover the fundamentals, appreciate the significance of KYC, and trade on one of the biggest cryptocurrency exchanges with confidence.
At Techbox Square, in Singapore, we're not just creative web designers and developers, we're the driving force behind your brand identity. Contact us today.
Understanding User Needs and Satisfying ThemAggregage
https://www.productmanagementtoday.com/frs/26903918/understanding-user-needs-and-satisfying-them
We know we want to create products which our customers find to be valuable. Whether we label it as customer-centric or product-led depends on how long we've been doing product management. There are three challenges we face when doing this. The obvious challenge is figuring out what our users need; the non-obvious challenges are in creating a shared understanding of those needs and in sensing if what we're doing is meeting those needs.
In this webinar, we won't focus on the research methods for discovering user-needs. We will focus on synthesis of the needs we discover, communication and alignment tools, and how we operationalize addressing those needs.
Industry expert Scott Sehlhorst will:
• Introduce a taxonomy for user goals with real world examples
• Present the Onion Diagram, a tool for contextualizing task-level goals
• Illustrate how customer journey maps capture activity-level and task-level goals
• Demonstrate the best approach to selection and prioritization of user-goals to address
• Highlight the crucial benchmarks, observable changes, in ensuring fulfillment of customer needs
How are Lilac French Bulldogs Beauty Charming the World and Capturing Hearts....Lacey Max
“After being the most listed dog breed in the United States for 31
years in a row, the Labrador Retriever has dropped to second place
in the American Kennel Club's annual survey of the country's most
popular canines. The French Bulldog is the new top dog in the
United States as of 2022. The stylish puppy has ascended the
rankings in rapid time despite having health concerns and limited
color choices.”
The 10 Most Influential Leaders Guiding Corporate Evolution, 2024.pdfthesiliconleaders
In the recent edition, The 10 Most Influential Leaders Guiding Corporate Evolution, 2024, The Silicon Leaders magazine gladly features Dejan Štancer, President of the Global Chamber of Business Leaders (GCBL), along with other leaders.
The Genesis of BriansClub.cm Famous Dark WEb PlatformSabaaSudozai
BriansClub.cm, a famous platform on the dark web, has become one of the most infamous carding marketplaces, specializing in the sale of stolen credit card data.
Call8328958814 satta matka Kalyan result satta guessing➑➌➋➑➒➎➑➑➊➍
Satta Matka Kalyan Main Mumbai Fastest Results
Satta Matka ❋ Sattamatka ❋ New Mumbai Ratan Satta Matka ❋ Fast Matka ❋ Milan Market ❋ Kalyan Matka Results ❋ Satta Game ❋ Matka Game ❋ Satta Matka ❋ Kalyan Satta Matka ❋ Mumbai Main ❋ Online Matka Results ❋ Satta Matka Tips ❋ Milan Chart ❋ Satta Matka Boss❋ New Star Day ❋ Satta King ❋ Live Satta Matka Results ❋ Satta Matka Company ❋ Indian Matka ❋ Satta Matka 143❋ Kalyan Night Matka..
Anny Serafina Love - Letter of Recommendation by Kellen Harkins, MS.AnnySerafinaLove
This letter, written by Kellen Harkins, Course Director at Full Sail University, commends Anny Love's exemplary performance in the Video Sharing Platforms class. It highlights her dedication, willingness to challenge herself, and exceptional skills in production, editing, and marketing across various video platforms like YouTube, TikTok, and Instagram.
Navigating the world of forex trading can be challenging, especially for beginners. To help you make an informed decision, we have comprehensively compared the best forex brokers in India for 2024. This article, reviewed by Top Forex Brokers Review, will cover featured award winners, the best forex brokers, featured offers, the best copy trading platforms, the best forex brokers for beginners, the best MetaTrader brokers, and recently updated reviews. We will focus on FP Markets, Black Bull, EightCap, IC Markets, and Octa.
Best practices for project execution and deliveryCLIVE MINCHIN
A select set of project management best practices to keep your project on-track, on-cost and aligned to scope. Many firms have don't have the necessary skills, diligence, methods and oversight of their projects; this leads to slippage, higher costs and longer timeframes. Often firms have a history of projects that simply failed to move the needle. These best practices will help your firm avoid these pitfalls but they require fortitude to apply.
The APCO Geopolitical Radar - Q3 2024 The Global Operating Environment for Bu...APCO
The Radar reflects input from APCO’s teams located around the world. It distils a host of interconnected events and trends into insights to inform operational and strategic decisions. Issues covered in this edition include:
How MJ Global Leads the Packaging Industry.pdfMJ Global
MJ Global's success in staying ahead of the curve in the packaging industry is a testament to its dedication to innovation, sustainability, and customer-centricity. By embracing technological advancements, leading in eco-friendly solutions, collaborating with industry leaders, and adapting to evolving consumer preferences, MJ Global continues to set new standards in the packaging sector.
Discover timeless style with the 2022 Vintage Roman Numerals Men's Ring. Crafted from premium stainless steel, this 6mm wide ring embodies elegance and durability. Perfect as a gift, it seamlessly blends classic Roman numeral detailing with modern sophistication, making it an ideal accessory for any occasion.
https://rb.gy/usj1a2
Best Competitive Marble Pricing in Dubai - ☎ 9928909666Stone Art Hub
Stone Art Hub offers the best competitive Marble Pricing in Dubai, ensuring affordability without compromising quality. With a wide range of exquisite marble options to choose from, you can enhance your spaces with elegance and sophistication. For inquiries or orders, contact us at ☎ 9928909666. Experience luxury at unbeatable prices.
Best Competitive Marble Pricing in Dubai - ☎ 9928909666
Weekly Market Report
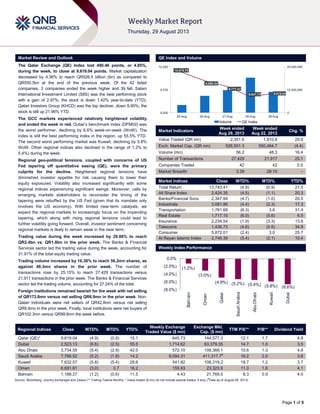
1. Page 1 of 5
Market Review and Outlook QE Index and Volume
The Qatar Exchange (QE) Index lost 490.46 points, or 4.85%,
during the week, to close at 9,619.04 points. Market capitalization
decreased by 4.36% to reach QR526.5 billion (bn) as compared to
QR550.5bn at the end of the previous week. Of the 42 listed
companies, 3 companies ended the week higher and 39 fell. Salam
International Investment Limited (SIIS) was the best performing stock
with a gain of 2.97%; the stock is down 1.42% year-to-date (YTD).
Qatari Investors Group (KHCD) was the top decliner, down 9.95%; the
stock is still up 21.96% YTD.
The GCC markets experienced relatively heightened volatility
and ended the week in red. Dubai‟s benchmark index (DFMGI) was
the worst performer, declining by 6.6% week-on-week (WoW). The
index is still the best performing index in the region, up 55.5% YTD.
The second worst performing market was Kuwait, declining by 5.8%
WoW. Other regional indices also declined in the range of 1.2% to
5.4%) during the week.
Regional geo-political tensions, coupled with concerns of US
Fed tapering off quantitative easing (QE), were the primary
culprits for the decline. Heightened regional tensions have
diminished investor appetite for risk causing them to lower their
equity exposures. Volatility also increased significantly with some
regional indices experiencing significant swings. Moreover, calls by
emerging markets stakeholders to reconsider the timing of the
tapering were rebuffed by the US Fed (given that its mandate only
involves the US economy). With limited near-term catalysts, we
expect the regional markets to increasingly focus on the impending
tapering, which along with rising regional tensions could lead to
further volatility going forward. Overall, investor sentiment concerning
regional markets is likely to remain weak in the near term.
Trading value during the week increased by 29.86% to reach
QR2.4bn vs. QR1.8bn in the prior week. The Banks & Financial
Services sector led the trading value during the week, accounting for
31.91% of the total equity trading value.
Trading volume increased by 16.38% to reach 56.2mn shares, as
against 48.3mn shares in the prior week. The number of
transactions rose by 25.15% to reach 27,429 transactions versus
21,917 transactions in the prior week. The Banks & Financial Services
sector led the trading volume, accounting for 27.24% of the total.
Foreign institutions remained bearish for the week with net selling
of QR173.8mn versus net selling QR6.9mn in the prior week. Non-
Qatari individuals were net sellers of QR42.8mn versus net selling
QR9.4mn in the prior week. Finally, local institutions were net buyers of
QR102.3mn versus QR99.8mn the week before.
Market Indicators
Week ended
Aug 29, 2013
Week ended
Aug 22, 2013
Chg. %
Value Traded (QR mn) 2,351.6 1,810.8 29.9
Exch. Market Cap. (QR mn) 526,501.3 550,484.7 (4.4)
Volume (mn) 56.2 48.3 16.4
Number of Transactions 27,429 21,917 25.1
Companies Traded 42 42 0.0
Market Breadth 3:39 28:10 –
Market Indices Close WTD% MTD% YTD%
Total Return 13,743.41 (4.9) (0.9) 21.5
All Share Index 2,424.35 (4.5) (1.1) 20.3
Banks/Financial Svcs. 2,347.94 (4.7) (1.0) 20.5
Industrials 3,081.86 (4.4) (2.3) 17.3
Transportation 1,761.68 (6.3) 3.6 31.4
Real Estate 1,717.15 (6.0) (5.6) 6.5
Insurance 2,234.54 (1.9) (3.3) 13.8
Telecoms 1,436.73 (4.6) (0.5) 34.9
Consumer 5,872.01 (2.4) 3.0 25.7
Al Rayan Islamic Index 2,746.39 (5.4) (2.1) 10.4
Market Indices
Weekly Index Performance
Regional Indices Close WTD% MTD% YTD%
Weekly Exchange
Traded Value ($ mn)
Exchange Mkt.
Cap. ($ mn)
TTM P/E** P/B** Dividend Yield
Qatar (QE)* 9,619.04 (4.9) (0.9) 15.1 645.73 144,577.3 12.1 1.7 4.8
Dubai 2,523.13 (6.6) (2.5) 55.5 1,714.62 63,379.35 14.7 1.0 3.5
Abu Dhabi 3,734.55 (5.4) (2.9) 42.0 572.10 108,368.1 10.6 1.3 4.8
Saudi Arabia 7,766.52 (5.2) (1.9) 14.2 9,094.31 411,317.7#
16.2 2.0 3.8
Kuwait 7,632.57 (5.8) (5.4) 28.6 541.82 108,319.2 18.7 1.2 3.7
Oman 6,691.61 (3.0) 0.7 16.2 155.93 23,323.9 11.0 1.6 4.1
Bahrain 1,188.27 (1.2) (0.6) 11.5 4.43 21,769.5 8.3 0.9 4.0
Source: Bloomberg, country exchanges and Zawya (** Trailing Twelve Months; * Value traded ($ mn) do not include special trades, if any) (
#
Data as of August 28, 2013)
10,078.78
9,898.54
9,771.41
9,547.73 9,619.04
0
12,500,000
25,000,000
9,200
9,700
10,200
25-Aug 26-Aug 27-Aug 28-Aug 29-Aug
Volume QE Index
(1.2%)
(3.0%)
(4.9%) (5.2%) (5.4%) (5.8%) (6.6%)
(8.0%)
(6.0%)
(4.0%)
(2.0%)
0.0%
Bahrain
Oman
Qatar
SaudiArabia
AbuDhabi
Kuwait
Dubai
2. Page 2 of 5
News
Economic News
Qatar’s foreign trade surplus at QR32.1bn in June –
According to the data released by Qatar‟s Ministry of
Development Planning & Statistics (MDPS), the country‟s
international trade balance of goods in June 2013 showed a
surplus of QR32.1bn, indicating an increase of 2.0% YoY. Total
exports of goods (including exports of domestic origin and re-
exports) increased 2.4% YoY to QR39.8bn, whereas the value
of imports went up 4.1% YoY to QR7.6bn. The data showed
that an increase in total exports was mainly due to petroleum
oils & oils from bituminous minerals (crude) that showed an
increase of 9.6% YoY. However, this increase was partially
offset by the drop in exports of petroleum oils & oils from
bituminous minerals (not crude). The main destination countries
were Japan with a share of 28% of total exports, followed by
South Korea (18%) and India (11%). Motor cars & other
passenger vehicles, aircraft spare parts and telephones were
the main imported products in June 2013. The US was the
leading exporting country with a share of 13%, followed by
China with 11% and UAE with 8%. (QSA)
Qatar’s CPI rises 3.1% YoY in July – According to the data
released by the Ministry of Development Planning & Statistics,
Qatar‟s Consumer Price Index (CPI) remained unchanged in
July 2013 at 114.5 over June 2013, albeit showing an increase
of 3.1% YoY. The ministry‟s report stated that a group-wise
month on month comparison of July‟s CPI with June‟s CPI
showed increases in most of the major groups. The
“entertainment, recreation & culture” group rose by 1.2% MoM,
while “garment & footwear” grew by 0.5% MoM, and “furniture,
textiles & home” by 0.3% MoM. However, prices declined by
1.3% MoM in the “miscellaneous goods & services” group, and
in the “food beverages & tobacco” group by 0.8% MoM. On a
YoY basis, the “entertainment, recreation and culture" group
rose 9.3%, "rent, fuel & energy” went up 6.5%, and the "medical
care & medical services" group up 2.5%. However, prices in the
“miscellaneous goods & services" group declined by 3.2%. A
CPI exclusive of the “rent, fuel & energy” group has also been
calculated, after eliminating the effect of rent, with the overall
index reaching 126.3, indicating an increase of 1.9% YoY.
(AME Info)
Building material demand to rise in Qatar – According to a
survey conducted by the Ministry of Development Planning &
Statistics, Qatar's construction sector is set to see a record
demand of primary building materials over the next few years.
In the run up to the 2022 FIFA World Cup, the highest projected
demand would be for limestone, gabbro and spoil removal &
disposal. The demand for these materials would reach a record
peak during 2014-2016. The survey showed that for the 2012-
22 period, at 515mn tons, limestone was the material with the
highest demand, followed by Gabbro at 264mn tons. The spoil
removal & disposal demand is expected to reach 166mn tons
during the period. (Peninsula Qatar)
Qatar largest LNG exporter to South Korea – South Korean
Prime Minister Chung Hong-won said that Qatar is the largest
exporter of LNG to South Korea (30%) and the third exporter of
crude oil (11%). He said that South Korea and Qatar are
important trading partners to each other on the basis of their
complementary industrial structure, adding that trading volume
between the two countries has more than doubled from $123bn
in 2010 to $262bn in 2012. Moreover, he said Korea‟s crude oil
imports from Qatar have increased from 64mn barrels in 2010
to 103mn barrels in 2012. (Gulf-Times.com)
Consumer confidence high in Qatar – According to the
findings of the MasterCard Index of Consumer Confidence,
consumers in Qatar are extremely optimistic on employment,
economy, regular income and stock market. The findings
showed that consumers are more optimistic about employment
(99.4 currently versus 98.1 previous), economy (98 vs 97) and
quality of life (97.2 vs 96.2). They are also very optimistic about
regular income (95.7 vs 99.3) and stock market (91.7 vs 92),
despite a slight decrease in the score compared to the previous
edition of the index. (Gulf-Times.com)
QCB to issue QR4bn T-bills on September 3 – The Qatar
Central Bank (QCB) is set to issue treasury bills with a maturity
period of 91 days, 182 days and 273 days on September 3,
2013. The total amount of issuance is QR4bn. (QCB)
Market & Corporate News
Kahramaa tests its first underground substation –
Kahramaa has successfully completed and tested the
substation at Msheireb Downtown Doha, the flagship
development of Msheireb Properties. The 66 Kilovolt substation
is the first energized underground substation in Qatar. (AME
Info)
Kahramaa floats tender for water project – Qatar General
Electricity & Water Corporation (Kahramaa) has floated a
tender for key water lines project, which is part of the
corporation's plans to develop the water sector in the country.
The tender pertains to contracts for material supply and the
construction and commissioning of water lines and channels
between Umm Baraka and Rawdat Rashid. (Gulf-Times.com)
Kahramaa to install smart meters – Qatar General Electricity
& Water Corporation (Kahramaa) is executing a new project,
which will install smart meters in all the buildings in the country
by 2016. As part of this project, QEWS has recently connected
a set of meters in a building in Al Sadd with a temporary
monitoring center in the customer service building in the Al Hilal
area. These meters work through a remote monitoring and
reading system connected to a central facility. (Gulf-Times.com)
SIIS earns QR48mn net profit from land sale – Salam
International Investment Limited (SIIS) announced that two land
plots among its real estate investments have been sold, in
addition to the land sold previously. SIIS has achieved a net
profit of QR48mn from the latest sale. Thus, the gross net profit
achieved from the recent and the previous land sale deals
stood at QR73mn. The results for these deals will be visible in
the company‟s semi-annual financial statements for 2013. (QE)
Qafac’s QR291mn carbon recovery plant to be ready by
2014-end – Qatar Fuel Additives‟ (Qafac) General Manager
Nasser Jeham al-Kuwari said the company‟s carbon dioxide
recovery (CDR) plant worth QR291mn is more than 50%
complete and is set for commissioning by the end of 2014. The
plant located at Mesaieed will meet a two-pronged objective for
Qafac of both reducing emissions as well as stepping up
methanol production. He also said that the plant, when
operational, will recover 500 tons per day of carbon dioxide (a
greenhouse gas) from its methanol reformer stack and will
inject it back into its existing process to enhance the methanol
production. Further, he said that the company is looking at an
additional production of 100,000 tons per year of methanol.
Meanwhile, Qafac has opened its new headquarters at the Bay
Tower 2 in The Gate Mall. (Gulf-Times.com)
3. Page 3 of 5
Qatar Exchange
Top Gainers Top Decliners
Source: Qatar Exchange (QE) Source: Qatar Exchange (QE)
Most Active Shares by Value (QR Million) Most Active Shares by Volume (Million)
Source: Qatar Exchange (QE) Source: Qatar Exchange (QE)
Investor Trading Percentage to Total Value Traded Net Traded Value by Nationality (QR Million)
Source: Qatar Exchange (QE) Source: Qatar Exchange (QE)
3.0%
1.6%
0.9%
0.0%
1.0%
2.0%
3.0%
Salam International
Investment
Doha Insurance Al Ahli Bank
-10.0%
-8.8%
-6.9% -6.9%
-6.4%
-12.0%
-8.0%
-4.0%
0.0%
Qatari
Investors
Group
Dlala Holding Milaha Qatar
International
Islamic Bank
Medicare
Group
411.1
225.1
179.9
137.6 130.3
0.0
150.0
300.0
450.0
Industries
Qatar
QNB Group Qatar Gas
Transport
(Nakilat)
Milaha United
Development
9.7
6.1
4.3
3.6
2.8
0.0
4.0
8.0
12.0
Qatar Gas
Transport
(Nakilat)
United
Development
Masraf Al
Rayan
Vodafone
Qatar
Al Khaliji Bank
0%
20%
40%
60%
80%
100%
Buy Sell
42.71% 37.86%
22.88%
18.52%
14.16%
15.98%
20.26%
27.65%
Qatari Individuals Qatari Institutions
Non-Qatari Individuals Non-Qatari Institutions
1,542
809
1,326
1,026
217
(217)
(500) - 500 1,000 1,500 2,000
Qatari
Non-Qatari
Net Investment Total Sold Total Bought
4. Page 4 of 5
TECHNICAL ANALYSIS OF THE QE INDEX
Source: Bloomberg
The QE Index reversed from its bullish trend and witnessed heavy selling pressure throughout last week. The index fell around 491 points on the back of
large volumes. The index failed to make any further headway above the 10,150.0 level and was persistently setting lower lows until Wednesday. However,
the index rebounded from its lows of 9,331.34 and recovered by the end of the week, closing at its intraday high of 9,619.04 on Thursday. Despite this price
rebound, there are doubts on the sustainability of this higher move. Thus, accumulation is not recommended, until an additional bullish price confirmation
occurs; until then the current short-term trend looks bearish. The index faces an immediate resistance near the 9,670.0 level and it needs to breach this
level in order to change this bearish short-term trend. If the index manages to breach this level and stay above, it may advance toward the 9,700.0 and
9,800.0 levels. On the downside, the immediate support comes at the 55-day moving average (currently at 9,576.05). A breakdown below this support could
lead to a drop toward the 9,500.0 level. Meanwhile, the RSI stands at 41.78, indicating that the index may be oversold and is due for sideways or a higher
move. However, the MACD is relatively in a freefall mode without any reversal signs. Hence, these indicators signal a choppy market in the coming week.
DEFINITIONS OF KEY TERMS USED IN TECHNICAL ANALYSIS
RSI (Relative Strength Index) indicator – RSI is a momentum oscillator that measures the speed and change of price movements. The RSI oscillates
between 0 to 100. The index is deemed to be overbought once the RSI approaches the 70 level, indicating that a correction is likely. On the other hand, if
the RSI approaches 30, it is an indication that the index may be getting oversold and therefore likely to bounce back.
MACD (Moving Average Convergence Divergence) indicator – The indicator consists of the MACD line and a signal line. The divergence or the
convergence of the MACD line with the signal line indicates the strength in the momentum during the uptrend or downtrend, as the case may be. When the
MACD crosses the signal line from below and trades above it, it gives a positive indication. The reverse is the situation for a bearish trend.
Candlestick chart – A candlestick chart is a price chart that displays the high, low, open, and close for a security. The „body‟ of the chart is portion between
the open and close price, while the high and low intraday movements form the „shadow‟. The candlestick may represent any time frame. We use a one-day
candlestick chart (every candlestick represents one trading day) in our analysis.
Doji candlestick pattern – A Doji candlestick is formed when a security's open and close are practically equal. The pattern indicates indecisiveness, and
based on preceding price actions and future confirmation, may indicate a bullish or bearish trend reversal.
Shooting Star/Inverted Hammer candlestick patterns – These candlestick patterns have a small real body (open price and close price are near to each
other), and a long upper shadow (large intraday movement on the upside). The Shooting Star is a bearish reversal pattern that forms after a rally. The
Inverted Hammer looks exactly like a Shooting Star, but forms after a downtrend. Inverted Hammers represent a potential bullish trend reversal.
5. Contacts
Ahmed M. Shehada Keith Whitney Saugata Sarkar Sahbi Kasraoui
Head of Trading Head of Sales Head of Research Manager - HNWI
Tel: (+974) 4476 6535 Tel: (+974) 4476 6533 Tel: (+974) 4476 6534 Tel: (+974) 4476 6544
ahmed.shehada@qnbfs.com.qa keith.whitney@qnbfs.com.qa saugata.sarkar@qnbfs.com.qa sahbi.alkasraoui@qnbfs.com.qa
QNB Financial Services SPC
Contact Center: (+974) 4476 6666
PO Box 24025, Doha, Qatar
DISCLAIMER: This publication has been prepared by QNB Financial Services SPC (“QNBFS”) a wholly-owned subsidiary of Qatar National Bank (“QNB”). QNBFS is regulated by the Qatar
Financial Markets Authority and the Qatar Exchange; QNB is regulated by the Qatar Central Bank. This publication expresses the views and opinions of QNBFS at a given time only. It is not an
offer, promotion or recommendation to buy or sell securities or other investments, nor is it intended to constitute legal, tax, accounting, or financial advice. We therefore strongly advise potential
investors to seek independent professional advice before making any investment decision. Although the information in this report has been obtained from sources that QNBFS believes to be
reliable, we have not independently verified such information and it may not be accurate or complete. While this publication has been prepared with the utmost degree of care by our analysts,
QNBFS does not make any representations warranties as to the accuracy and completeness of the information it may contain, and declines any liability in that respect. QNBFS reserves the right
to amend the views and opinions expressed in this publication at any time. It may also express viewpoints or make investment decisions that differ significantly from, or even contradict, the views
and opinions included in this report.
COPYRIGHT: No part of this document may be reproduced without the explicit written permission of QNBFS.
Page 5 of 5
Source: Bloomberg
Company Name
Price
(August 29)
% Change 5-
Day
% Change
Monthly
Market Cap.
QR Million TTM P/E P/B Div. Yield
Qatar National Bank 167.50 (5.42) (5.37) 117,205 13.1 2.5 3.6
Qatar Islamic Bank 69.80 (5.42) 1.31 16,493 14.6 1.5 5.4
Commercial Bank of Qatar 68.40 (2.43) (0.15) 16,925 8.4 1.2 8.8
Doha Bank 53.70 (3.94) 5.92 13,875 9.3 1.6 7.7
Al Ahli Bank 55.00 0.92 3.58 6,989 13.5 2.1 5.5
Qatar International Islamic Bank 55.50 (6.88) 2.59 8,401 11.9 1.7 6.3
Masraf Al Rayan 28.90 (3.83) 2.85 21,675 13.5 2.2 3.5
Al Khaliji Bank 18.49 (2.99) 9.67 6,656 12.3 1.3 5.4
National Leasing 34.20 (5.79) (3.25) 1,692 10.0 1.3 5.8
Dlala Holding 19.26 (8.81) (9.19) 428 N/M 2.0 N/A
Qatar & Oman Investment 12.45 (5.68) (4.67) 392 20.5 1.2 4.0
Islamic Holding Group 38.80 (4.20) (4.20) 155 24.8 3.0 2.9
Banking and Financial Services 210,887
Zad Holding 63.00 (5.12) 5.00 824 8.8 1.1 6.3
Qatar German Co. for Medical Devices 14.40 (4.26) (8.57) 166 N/M 0.9 N/A
Salam International Investment 12.48 2.97 (0.48) 1,427 23.6 0.9 5.6
Medicare Group 47.95 (6.35) 3.34 1,350 22.7 1.8 3.8
Qatar Cinema & Film Distribution 49.10 (2.00) (6.12) 280 29.7 2.1 4.1
Qatar Fuel 282.90 (2.11) 5.56 18,380 16.1 3.3 3.5
Qatar Meat and Livestock 52.70 (5.89) (12.02) 949 14.4 4.1 7.6
Al Meera Consumer Goods 131.50 (2.45) (3.31) 2,630 17.3 2.1 6.1
Consumer Goods and Services 26,005
Qatar Industrial Manufacturing 48.10 (3.80) (6.24) 1,905 11.2 1.5 6.1
Qatar National Cement 102.20 (1.26) 2.71 5,018 11.5 2.1 5.9
Industries Qatar 153.50 (4.66) (3.40) 92,868 10.3 3.1 5.0
Qatari Investors Group 28.05 (9.95) (1.06) 3,487 17.5 1.7 2.7
Qatar Electricity and Water 158.00 (3.30) (3.66) 15,800 11.0 3.0 4.6
Mannai Corp. 84.00 (3.45) (3.23) 3,832 8.8 1.7 5.7
Aamal 14.60 (4.82) 2.10 8,760 13.7 1.3 N/A
Gulf International Services 48.00 (3.81) 0.31 7,136 12.7 2.6 3.1
Industrials 138,806
Qatar Insurance 60.00 (1.64) (2.28) 7,706 9.3 1.6 3.4
Doha Insurance 26.00 1.56 4.00 669 12.2 1.3 3.5
Qatar General Insurance & Reinsurance 51.30 (3.21) (8.06) 2,957 3.5 0.9 1.7
Al Khaleej Takaful Insurance 40.50 (1.94) 0.87 692 14.5 1.2 2.1
Qatar Islamic Insurance 57.40 (2.71) (4.65) 861 14.5 3.3 6.1
Insurance 12,885
United Development 21.40 (6.02) (4.80) 7,217 9.5 0.7 4.7
Barwa Real Estate 24.50 (5.95) (6.67) 9,534 15.9 0.8 6.1
Ezdan Real Estate 17.44 (2.35) 2.29 46,260 N/M 1.7 0.7
Mazaya Qatar Real Estate Development 11.33 (5.98) (1.05) 1,133 17.0 1.0 5.3
Real Estate 64,143
Qatar Telecom 139.00 (4.66) (0.57) 44,524 13.2 1.8 3.6
Vodafone Qatar 9.02 (3.84) (0.33) 7,626 N/M 1.3 N/A
Telecoms 52,150
Qatar Navigation (Milaha) 78.00 (6.92) 2.63 8,933 9.2 0.8 4.8
Gulf Warehousing 39.75 (5.36) (4.22) 1,891 19.6 2.5 N/A
Qatar Gas Transport (Nakilat) 19.29 (5.90) 5.99 10,802 14.4 3.4 5.2
Transportation 21,626
Qatar Exchange 526,501