The QSE Index lost 0.54% over the week to close at 11,944.62 points. Trading value and volume decreased 58.07% and 64.08% respectively. Industries Qatar, Ooredoo, and Gulf International Services were the top decliners for the week. Foreign institutions continued net selling while Qatari institutions remained net buyers. Economic news included Turkey's Alternatifbank receiving a $125 million loan from Qatari banks, and Qatar being named the top per capita energy subsidizer in the world. Several companies set dates to disclose upcoming financial results.
The Qatar Exchange Index gained 2.04% over the week to close at 9,479.80 points, as market capitalization rose by 1.74% to QR520 billion. Trading value and volume increased significantly by 65.21% and 37.69% respectively. MSCI upgraded Qatar and the UAE to emerging market status, which is expected to result in $450-650 million of foreign investments flowing into the Qatari market. Foreign institutions turned to net buying while Qatari individuals remained net sellers during the week.
The QE index declined 0.3% to close at 10,336.5 led by losses in the Transportation and Industrials indices. Top losers were Qatar Navigation and Medicare Group falling 2.3% and 1.7% respectively, while top gainers included Dlala Brok. & Inv. Holding Co. rising 2.2% and Vodafone Qatar up 2.1%. Trading volume rose 9.2% to 9.9mn shares compared to the previous day but was 12.1% lower than the 30-day average. Regionally, indices in Saudi Arabia were up marginally while Dubai and Abu Dhabi fell 0.3% and rose 0.3% respectively
The QE index in Qatar declined 0.2% led by losses in the telecom and banking indices. Losses were seen in Qatar German Co. for Med. Dev. and Ezdan Holding Group, while gains were witnessed in United Development Co. and National Leasing. Trading volume on the QE exchange rose 27.0% compared to the previous day. The document also provides market commentary and updates on regional and global markets.
The QE index rose 0.2% to close at 10,395.3, led by gains in the Insurance and Banking & Financial Services indices. Al Ahli Bank and Islamic Holding Group were the top gainers rising 9.7% and 5.3% respectively, while Qatar Cinema & Film Dist. Co. fell 6.0% and Salam International Investment Co. declined 1.8%. Trading volume declined 8.9% compared to the previous day and was 11.8% lower than the 30-day moving average. Qatar Gas Transport Co. and Salam International Investment Co. were the most active stocks. News items include QNCD's plans to expand capacity, CBQK allowing 25
The Qatar Stock Exchange Index lost 3.11% over the week to close at 10,522.21 points. Trading value and volume both decreased significantly over the week. Several of Qatar's largest companies, including QNB Group, Industries Qatar, and Masraf Al Rayan were primary contributors to the weekly index loss. Foreign institutions remained net sellers during the week, while Qatari institutions and retail investors were net buyers.
The QSE Index in Qatar gained 0.1% on the day. Gains were led by the Real Estate and Banks & Financial Services indices. QNB Group and Barwa Real Estate Co. were the top gainers while Qatar Islamic Bank fell the most. Overall trading activity was lower than the 30-day average. In other GCC markets, indices fell in Saudi Arabia, Dubai, Abu Dhabi, Kuwait, Oman and Bahrain. Global economic data showed mixed results with UK public finances improving but foreign direct investment into China declining more than expected.
QNBFS Daily Market Report September 16, 2021QNB Group
The QE Index in Qatar declined 0.2% due to losses in the transportation and real estate indices. Investment Holding Group and Ahli Bank were the top losers. Mesaieed Petrochemical gained 2.5% while Baladna rose 2.2%. Trading volume fell 25.5% but was higher than the 30-day average. Regional indices were mixed with Saudi and Abu Dhabi rising while Kuwait and Oman fell. Several Qatari banks are in discussions to launch Apple Pay following launches by QNB Group and Dukhan Bank amid growing customer demand for mobile payment services.
The QE index in Qatar rose 0.4% led by gains in the transportation and telecom sectors. Qatar Electricity & Water Co. and Qatar Gas Transport Co. were the top gainers, while Al Ahli Bank fell 3.2%. Most other GCC markets fell except for Saudi Arabia and Oman. Earnings were reported from Dubai Refreshments Co., and global economic data was mixed with US factory orders beating estimates but economic optimism declining. In company news, Qatar established a new economic council and various Qatar companies set dates to disclose earnings. The US Fed adopted new Basel III rules to regulate banks while the BoE plans new bank capital rules.
The QE Index in Qatar rose 0.3% led by gains in the Telecom and Banks indices. QNB Group and Qatar General Insurance rose the most, while Al Meera fell. Trading volume rose 72.8% but was below the 30-day average. In other markets, Saudi fell 0.6% while Abu Dhabi rose marginally and Kuwait rose 0.3%. Regionally, volume was highest in Saudi Arabia.
The QE index rose 0.1% to close at 11,885.8, led by gains in the telecom and industrial indices. Gulf Warehousing Co. and Qatar National Cement Co. were the top gainers, rising 3.3% and 3.1% respectively, while Widam Food Co. fell 10.0% and Qatar Cinema & Film Distribution Co. declined 5.4%. Trading volume fell 45.3% compared to the previous day and was 18.1% lower than the 30-day moving average. Regional indices were mixed with Qatar, Bahrain, Saudi Arabia rising while Dubai, Abu Dhabi, Kuwait, Oman fell. Earnings news included GISS
The QE index rose 0.6% led by gains in the Industrials and Insurance indices. Qatar Cinema & Film Dist. Co. and Qatar Electricity & Water Co. were the top gainers, while Al Khaleej Takaful Group and Qatar Navigation declined the most. Trading volume rose 11.3% to 11.6mn shares, with United Development Co. and Masraf Al Rayan being the most active stocks. Regional indices were mixed with Qatar, Dubai and Abu Dhabi indices rising while Saudi, Kuwait and Oman indices fell. Earnings releases from companies in Qatar, Dubai, Abu Dhabi and Kuwait were reported along with global economic data from the US
QNBFS Daily Market Report August 18, 2019QNB Group
The QE Index in Qatar declined 0.6% due to losses in the telecom and insurance sectors. Telecom stocks Qatar Cinema and Vodafone Qatar fell the most. In other markets, the Dubai index declined 1.3% while the Abu Dhabi index gained marginally. The document provides market commentary and statistics for Qatar, GCC and other regional markets. It also includes some news briefs related to Qatar's economy and Islamic finance sector.
The QE index in Qatar rose 0.4% led by gains in the Telecom and Consumer Goods indices. Top gainers were Qatar Cinema & Film Distribution and Islamic Holding Group. Top traded stocks by volume were United Development Co. and Qatar Gas Transport Co. Regional indices were also up except for Oman which rose 0.3%. Banking data for Qatar showed deposits up 0.1% MoM while loans were flat in August.
The QE index in Qatar rose 0.3% led by gains in the real estate and telecom indices. Qatar German Co. for Med. Dev. and Barwa Real Estate Co. were the top gainers while Al Meera Consumer Goods Co. declined the most. Regional indices were mixed with Kuwait up 1.2% and Saudi Arabia down 0.4%. Internationally, the US Fed maintained its bond buying stimulus program and cut growth forecasts, while the EU and IMF warned of ongoing risks in Cyprus' economic recovery.
The QE index rose 0.4% to close at 10,527.0, led by gains in the Industrials and Telecoms indices. Gulf International Services and Aamal Co. were the top gainers rising 3.4% and 2.3% respectively, while Qatar German Co. for Med. Dev. fell 1.4% and Medicare Group declined 0.9%. Volume rose 3.4% to 10.3mn shares traded, though this was 19.3% lower than the 30-day moving average. Non-Qatari investors were net buyers while Qatari investors were net sellers. In other markets, Dubai and Abu Dhabi indices gained while Kuwait declined
The QE index in Qatar rose 0.1% led by gains in the real estate and telecom indices. Al Khaliji and Zad Holding Co. were the top gainers rising 3.8% and 2.7% respectively, while Qatar Gas Transport Co. fell 2.9%. Regional indices were mixed with Abu Dhabi rising 0.1% while Saudi Arabia fell 0.3%. Trading activity on the Qatar Exchange declined 27.7% in volume terms day-over-day.
The document summarizes daily market activity and news from Qatar, GCC countries, and global markets. Specifically:
- Qatar's stock market rose 2.0% led by gains in real estate and insurance stocks. Ezdan Holding and Qatar Electricity & Water were top gainers.
- Other GCC markets were mixed - Saudi fell while Abu Dhabi rose.
- News highlights included QPMC increasing Qatar's gabbro terminal capacity, Ooredoo launching new email security services, and the first trams arriving for Qatar Foundation's new tram system.
The QSE Index rose 0.7% led by gains in the telecom and real estate indices. Qatar Oman Investment Co. and Vodafone Qatar were the top gainers rising 6.5% and 5.6% respectively. Regional indices were mixed with Saudi Arabia up 1.1% while Oman fell 1.1%. News articles discussed Qatar's population rising 9.7% YoY and Barwa Real Estate selling two land plots for QR5.34bn.
The QE index in Qatar rose 1.3% led by gains in the real estate and transportation indices. Regional markets in Saudi Arabia, Dubai, Abu Dhabi, Oman, and Bahrain were also up, while Kuwait's market declined marginally. Trading activity significantly increased in Qatar with value traded rising 81.5% and volume up 104%. Real estate transactions in Qatar also doubled in July despite the summer season.
QNBFS Daily Market Report August 16, 2018QNB Group
The QSE Index declined 0.5% led by losses in the Real Estate and Telecom indices. Ezdan Holding Group and Masraf Al Rayan were the top losers, falling 6.4% and 2.0% respectively. Trading volume fell 19.3% compared to the previous day. Regionally, indices were mixed with Abu Dhabi up 1.2% while Dubai fell 0.8%. Company earnings news and global economic indicators were also included in the document.
The QE Index declined 0.1% to close at 10,739.1. Losses were led by the Telecoms and Banks & Financial Services indices, falling 0.4% and 0.3%, respectively.
The QE index in Qatar declined 0.7% due to losses in the real estate and transportation indices. Top losers were Dlala Brok. & Inv. Holding Co. and United Development Co., falling 2.8% and 2.6% respectively. In other GCC markets, the indices in Saudi Arabia and Abu Dhabi increased while the rest declined. Regional economic data and company news are also included in the daily market commentary report.
The document summarizes stock market activity in Qatar and other GCC countries on June 13, 2018. It notes that the QSE Index declined 0.9% in Qatar, led by losses in the Industrials and Real Estate indices. Qatar Cinema & Film Distribution and Qatar Industrial Manufacturing were the top losers, falling 9.0% and 4.2% respectively, while Qatar Gas Transport gained 3.9%. Other GCC markets were mixed, with Abu Dhabi down 2.1% but Kuwait up 0.3%. The document also provides commentary on company news and economic data.
The Qatar Exchange Index gained 2.25% over the week to close at 10,109.50 points. Trading value and volume increased substantially compared to the prior week. Al Khalij Commercial Bank was the best performing stock, up 11.79% for the week. Emerging markets remain under pressure from the potential tapering of US quantitative easing programs, which could slow global growth. Regional markets have fared better than emerging markets in recent weeks.
The QE index declined 0.8% led by losses in the telecom and real estate indices. Gulf Warehousing and Barwa Real Estate were the top losers, falling 3.0% and 2.1% respectively, while Qatar Cinema & Film Dist. rose 2.5%. Trading volume fell 20.5% compared to the previous day. Regionally, indices were mixed with Dubai rising 1.0% and Saudi falling 0.4%. Global data showed US vehicle sales below estimates and Eurozone PPI declining 0.8% year-over-year.
The QE index rose 0.4% to close at 9,952.9, led by gains in the Transportation and Industrials indices. United Development Co. and Qatar Cinema & Film Dist. Co. were the top gainers, rising 2.0% and 1.5% respectively, while Qatar General Ins. & Rein. Co. fell 2.7% to be a top loser. Trading volume rose 15.2% compared to the previous day and was 72.1% higher than the 30-day moving average, with United Development Co. and Qatari Investors Group being the most active stocks. Regional indices were mixed with Qatar, Kuwait and Oman indices rising while Dubai, Abu
QNBFS Daily Market Report October 04, 2020QNB Group
The QE Index rose 0.2% to close at 10,005.9 led by gains in the consumer goods and real estate indices. Medicare Group and Qatari German Company for Medical Devices were the top gainers rising 10% each. Trading volume fell 1.6% to 239mn shares. Regionally, indices were mixed with Saudi Arabia and Abu Dhabi falling while Dubai rose. Moody's affirmed Qatar's credit ratings at Aa3 with a stable outlook, noting higher expected LNG output and lower spending would mitigate risks from regional tensions or lower oil prices.
The Qatar Stock Exchange Index lost 541 points, or 4.35%, during the week. Trading value increased 57% while volume rose 54%. The real estate sector contributed most to trading value and volume. Ezdan Holding Group saw the biggest losses and was the top traded stock by value and volume. Foreign institutions remained net buyers while Qatari institutions were net sellers.
The Qatar Stock Exchange Index lost 0.44% over the week. Trading value and volume increased significantly by 96.69% and 115.62% respectively. The Banks and Financial Services sector contributed most to trading value, while the Real Estate sector led trading volume. Foreign institutions remained bearish, while Qatari institutions turned bullish. Construction of Qatar's Al Khor Al Bayt 2022 FIFA World Cup stadium is set to begin in September 2015.
The Qatar Exchange Index lost 4.85% over the week to close at 9,619.04 points as market capitalization decreased by 4.36% to QR526.5 billion. Regional markets also declined between 1.2-6.6% due to concerns over regional tensions and the potential tapering of US quantitative easing. Trading value increased 29.86% to QR2.4 billion while volume rose 16.38% to 56.2 million shares. Foreign institutions remained net sellers while local institutions were net buyers.
The Qatar Exchange Index declined 3.37% over the week, with market capitalization decreasing by 2.51%. Trading value and volume both decreased compared to the previous week. Masraf Al Rayan and Qatar Islamic Bank were the biggest contributors to the weekly index decline. Foreign institutions continued net buying during the week, while Qatari and foreign retail investors were mixed. Nakilat took over operations of the first LNG vessel as it moves toward becoming the owner and operator of the fleet.
QNBFS Weekly Market Report August 22, 2019QNB Group
The Qatar Stock Exchange Index increased 3.09% for the week. Ooredoo was the best performing stock, rising 8.9%, while Qatar First Bank declined the most at 7.5%. Trading value and volume both significantly increased. Foreign institutions remained bearish through net selling, while Qatari institutions were bullish with net buying. Qatar's industrial production rose 1.9% year-over-year in June led by increases in manufacturing. Construction activity is picking up as Qatar saw a 51% rise in building permits issued in July. Russia's VTB bank acquired a 19% stake in Qatari lender CQUR Bank.
The QE Index gained 1.55% over the week to close at 13,076.33 points, with market capitalization increasing 0.77% to QR695.6 billion. Trading volume increased 656.1% to 85.1 million shares, while value traded rose 611.9% to QR3.4 billion. Mazaya Qatar was the top performing stock with a 19.78% gain, while Industries Qatar fell 2.19%. Qatar Islamic Bank, Qatari Investors Group and Nakilat were the biggest index contributors. Foreign institutions remained net buyers during the week at QR143.1 million.
QNBFS Weekly Market Report October 4, 2018QNB Group
The QSE Index gained 1.21% over the week to close at 9,902.48 points. Trading value decreased 16% to QR1 billion, while trading volume fell 12.3% to 28.6 million shares. Industries Qatar, QNB Group, and Nakilat contributed most to index gains, while Ooredoo subtracted from the index. Foreign institutions remained net buyers at QR121.2 million, while Qatari institutions were net sellers of QR17.8 million.
The Qatar Stock Exchange index fell 1.33% over the week. Trading volume and value increased significantly compared to the previous week. The real estate and banking sectors were the top contributors to trading value and volume. Key stocks like Ezdan Holding Group and Gulf International Services decreased the index, while Industries Qatar and Qatar Islamic Bank increased it. Foreign investors remained net sellers while Qatari investors were net buyers. Real estate prices in Qatar reached a new record high in June according to a central bank index.
- The Qatar Stock Exchange Index lost 1.42% over the week to close at 11,439.30 points as 32 stocks fell, 8 rose, and 3 remained unchanged. Trading value remained flat at QR1.17bn while volume increased 1.9% to 29.1mn shares.
- Foreign institutions remained net buyers during the week at QR25.4mn while Qatari institutions were net sellers at QR79.8mn. Qatar's population increased 2.8% month-over-month to 2.412 million residents as of October 31, 2015.
- The Qatar Central Bank auctioned QR2bn in treasury bills, with yields rising from the previous auction. Emir Tamim bin
- The Qatar Exchange Index declined 3.31% for the week to close at 13,874.97 points, as market capitalization decreased 3.1% to QR739.2 billion.
- Trading value and volume both decreased from the prior week, falling 18% and 17.3% respectively. The real estate sector accounted for the largest trading volume and value.
- Foreign and Qatari institutions were net sellers during the week, while foreign and Qatari retail investors were net buyers.
The Qatar Stock Exchange Index gained slightly over the week. Trading value and volume decreased compared to the previous week. The real estate sector contributed the most to trading value and volume. Foreign institutions turned to net buying during the week after net selling the previous week. The report also provides details on index performance, company news, and economic news including forecasts for moderating real estate growth and inflation in Qatar.
The QSE Index gained 1.02% over the week to close at 13,729.78 points, with market capitalization increasing 1.17% to QR742.4 billion. Trading value and volume increased 35.5% and 10.5% respectively. Foreign institutions remained net buyers while Qatari institutions were net sellers. Barwa Real Estate was the top performer with a 12.7% gain and the biggest contributor to the weekly index gain. The Emir of Qatar announced plans to merge Enterprise Qatar and Qatar Development Bank to further support private sector growth.
The QE Index declined 2.27% over the week to close at 11,343.38 points. Trading volume increased 11.9% while value traded rose 7.61%. Two real estate companies, BRES and ERES, announced financial results. BRES reported a net profit of QR1.37bn for 2013 and recommended a dividend of QR2.00 per share. ERES reported a net profit of QR1.1bn for 2013 and recommended a dividend of QR0.31 per share, and also acquired over 20% of IHGS shares. Foreign and Qatari institutions remained net buyers during the week.
The Qatar Exchange Index gained slightly during the week but trading volume declined. Two stocks, Masraf Al Rayan and Vodafone Qatar, were the biggest contributors to the index's gain. Regional markets were mixed, with Abu Dhabi's index the top performer. Market indicators showed foreign institutions turned to net buying while Qatari institutions sold shares.
QNBFS Daily Market Report December 24, 2023QNB Group
The QE Index rose 0.8% to close at 10,285.3. Gains were led by the Transportation and Banks & Financial Services indices, gaining 1.4% and 1.2%, respectively.
QNBFS Daily Technical Trader Qatar - October 10, 2023 التحليل الفني اليومي لب...QNB Group
The document provides a daily technical analysis of the QE Index and QATAR INSURANCE CO stock. For the QE Index, it notes the index remains in a downtrend but is approaching a support level of 9,700, where long positions could be taken. It provides expected resistance and support levels. For QATAR INSURANCE CO stock, it notes the stock has not fallen as much as others and the uptrend remains intact above moving averages, though liquidity is low. It provides expected price targets and resistance/support levels for the stock. Definitions of technical analysis terms like candlesticks, support, and simple moving average are also included.
QNBFS Daily Market Report October 04, 2023QNB Group
The QE Index rose 0.2% to close at 10,273.3. Gains were led by the Transportation and Consumer Goods & Services indices, gaining 1.7% and 0.1%, respectively.
QNBFS Daily Technical Trader Qatar - October 04, 2023 التحليل الفني اليومي لب...QNB Group
The General Index failed to sustain its breakout above the double-bottom formation’s neckline and continued with its decline into the formation’s territory.
QNBFS Daily Technical Trader Qatar - September 28, 2023 التحليل الفني اليومي ...QNB Group
The General Index failed to sustain its breakout above the double-bottom formation’s neckline and continued with its decline into the formation’s territory.
QNBFS Daily Market Report September 24, 2023QNB Group
- The QE Index in Qatar rose 0.3% led by gains in the Transportation and Industrials indices. Qatar Navigation and Al Khaleej Takaful Insurance were the top gainers.
- Regional markets were mixed with Saudi Arabia down 1% but Abu Dhabi up marginally. Economic data from the US and Europe was mixed.
- In Qatar news, QR500mn in bills were sold at a yield of 5.755% and Gulf International Services approved final merger agreements. Ooredoo also signed an MoU to support businesses in Qatar free zones.
QNBFS Daily Technical Trader Qatar - September 24, 2023 التحليل الفني اليومي ...QNB Group
The General Index failed to sustain its breakout above the double-bottom formation’s neckline and continued with its decline into the formation’s territory.
QNBFS Daily Technical Trader Qatar - September 19, 2023 التحليل الفني اليومي ...QNB Group
The General Index failed to sustain its breakout above the double-bottom formation’s neckline and continued with its decline into the formation’s territory.
QNBFS Daily Market Report September 17, 2023QNB Group
The QE Index declined 0.5% to close at 10,319.3. Losses were led by the Industrials and Consumer Goods & Services indices, falling 1.4% and 1.1%, respectively.
QNBFS Daily Technical Trader Qatar - September 07, 2023 التحليل الفني اليومي ...QNB Group
The General Index failed to
sustain its breakout above the
double-bottom formation’s
neckline and continued with
its decline into the
formation’s territory.
STREETONOMICS: Exploring the Uncharted Territories of Informal Markets throug...sameer shah
Delve into the world of STREETONOMICS, where a team of 7 enthusiasts embarks on a journey to understand unorganized markets. By engaging with a coffee street vendor and crafting questionnaires, this project uncovers valuable insights into consumer behavior and market dynamics in informal settings."
Fabular Frames and the Four Ratio ProblemMajid Iqbal
Digital, interactive art showing the struggle of a society in providing for its present population while also saving planetary resources for future generations. Spread across several frames, the art is actually the rendering of real and speculative data. The stereographic projections change shape in response to prompts and provocations. Visitors interact with the model through speculative statements about how to increase savings across communities, regions, ecosystems and environments. Their fabulations combined with random noise, i.e. factors beyond control, have a dramatic effect on the societal transition. Things get better. Things get worse. The aim is to give visitors a new grasp and feel of the ongoing struggles in democracies around the world.
Stunning art in the small multiples format brings out the spatiotemporal nature of societal transitions, against backdrop issues such as energy, housing, waste, farmland and forest. In each frame we see hopeful and frightful interplays between spending and saving. Problems emerge when one of the two parts of the existential anaglyph rapidly shrinks like Arctic ice, as factors cross thresholds. Ecological wealth and intergenerational equity areFour at stake. Not enough spending could mean economic stress, social unrest and political conflict. Not enough saving and there will be climate breakdown and ‘bankruptcy’. So where does speculative design start and the gambling and betting end? Behind each fabular frame is a four ratio problem. Each ratio reflects the level of sacrifice and self-restraint a society is willing to accept, against promises of prosperity and freedom. Some values seem to stabilise a frame while others cause collapse. Get the ratios right and we can have it all. Get them wrong and things get more desperate.
Understanding how timely GST payments influence a lender's decision to approve loans, this topic explores the correlation between GST compliance and creditworthiness. It highlights how consistent GST payments can enhance a business's financial credibility, potentially leading to higher chances of loan approval.
Falcon stands out as a top-tier P2P Invoice Discounting platform in India, bridging esteemed blue-chip companies and eager investors. Our goal is to transform the investment landscape in India by establishing a comprehensive destination for borrowers and investors with diverse profiles and needs, all while minimizing risk. What sets Falcon apart is the elimination of intermediaries such as commercial banks and depository institutions, allowing investors to enjoy higher yields.
5 Tips for Creating Standard Financial ReportsEasyReports
Well-crafted financial reports serve as vital tools for decision-making and transparency within an organization. By following the undermentioned tips, you can create standardized financial reports that effectively communicate your company's financial health and performance to stakeholders.
In a tight labour market, job-seekers gain bargaining power and leverage it into greater job quality—at least, that’s the conventional wisdom.
Michael, LMIC Economist, presented findings that reveal a weakened relationship between labour market tightness and job quality indicators following the pandemic. Labour market tightness coincided with growth in real wages for only a portion of workers: those in low-wage jobs requiring little education. Several factors—including labour market composition, worker and employer behaviour, and labour market practices—have contributed to the absence of worker benefits. These will be investigated further in future work.
2. Elemental Economics - Mineral demand.pdfNeal Brewster
After this second you should be able to: Explain the main determinants of demand for any mineral product, and their relative importance; recognise and explain how demand for any product is likely to change with economic activity; recognise and explain the roles of technology and relative prices in influencing demand; be able to explain the differences between the rates of growth of demand for different products.
OJP data from firms like Vicinity Jobs have emerged as a complement to traditional sources of labour demand data, such as the Job Vacancy and Wages Survey (JVWS). Ibrahim Abuallail, PhD Candidate, University of Ottawa, presented research relating to bias in OJPs and a proposed approach to effectively adjust OJP data to complement existing official data (such as from the JVWS) and improve the measurement of labour demand.
Vicinity Jobs’ data includes more than three million 2023 OJPs and thousands of skills. Most skills appear in less than 0.02% of job postings, so most postings rely on a small subset of commonly used terms, like teamwork.
Laura Adkins-Hackett, Economist, LMIC, and Sukriti Trehan, Data Scientist, LMIC, presented their research exploring trends in the skills listed in OJPs to develop a deeper understanding of in-demand skills. This research project uses pointwise mutual information and other methods to extract more information about common skills from the relationships between skills, occupations and regions.
Does teamwork really matter? Looking beyond the job posting to understand lab...
Weekly market report
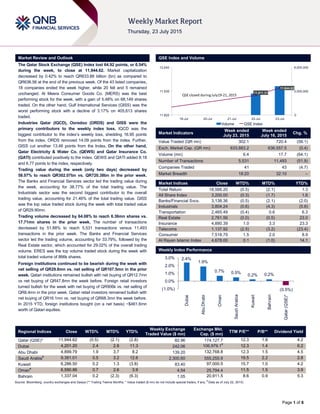
1. `
Page 1 of 6
Market Review and Outlook QSE Index and Volume
The Qatar Stock Exchange (QSE) Index lost 64.92 points, or 0.54%
during the week, to close at 11,944.62. Market capitalization
decreased by 0.42% to reach QR633.88 billion (bn) as compared to
QR636.56 at the end of the previous week. Of the 43 listed companies,
18 companies ended the week higher, while 20 fell and 5 remained
unchanged. Al Meera Consumer Goods Co. (MERS) was the best
performing stock for the week, with a gain of 5.48% on 68,149 shares
traded. On the other hand, Gulf International Services (GISS) was the
worst performing stock with a decline of 3.17% on 405,613 shares
traded.
Industries Qatar (IQCD), Ooredoo (ORDS) and GISS were the
primary contributors to the weekly index loss. IQCD was the
biggest contributor to the index’s weekly loss, shedding 16.95 points
from the index. ORDS removed 14.09 points from the index. Further,
GISS cut another 13.48 points from the Index. On the other hand,
Qatar Electricity & Water Co. (QEWS) and Qatar Insurance Co.
(QATI) contributed positively to the index. QEWS and QATI added 8.18
and 6.77 points to the index, respectively.
Trading value during the week (only two days) decreased by
58.07% to reach QR302.07bn vs. QR720.38bn in the prior week.
The Banks and Financial Services sector led the trading value during
the week, accounting for 38.77% of the total trading value. The
Industrials sector was the second biggest contributor to the overall
trading value, accounting for 21.46% of the total trading value. GISS
was the top value traded stock during the week with total traded value
of QR29.90mn.
Trading volume decreased by 64.08% to reach 6.36mn shares vs.
17.71mn shares in the prior week. The number of transactions
decreased by 51.88% to reach 5,531 transactions versus 11,493
transactions in the prior week. The Banks and Financial Services
sector led the trading volume, accounting for 33.79%, followed by the
Real Estate sector, which accounted for 29.02% of the overall trading
volume. ERES was the top volume traded stock during the week with
total traded volume of 866k shares.
Foreign institutions continued to be bearish during the week with
net selling of QR29.8mn vs. net selling of QR107.5mn in the prior
week. Qatari institutions remained bullish with net buying of QR12.7mn
vs net buying of QR47.8mn the week before. Foreign retail investors
turned bullish for the week with net buying of QR906k vs. net selling of
QR8.4mn in the prior week. Qatari retail investors remained bullish with
net buying of QR16.1mn vs. net buying of QR68.3mn the week before.
In 2015 YTD, foreign institutions bought (on a net basis) ~$461.6mn
worth of Qatari equities.
Market Indicators
Week ended
July 23, 2015
Week ended
July 16, 2015
Chg. %
Value Traded (QR mn) 302.1 720.4 (58.1)
Exch. Market Cap. (QR mn) 633,883.2 636,557.5 (0.4)
Volume (mn) 6.4 17.7 (64.1)
Number of Transactions 5,531 11,493 (51.9)
Companies Traded 41 43 (4.7)
Market Breadth 18:20 32:10 –
Market Indices Close WTD% MTD% YTD%
Total Return 18,566.20 (0.5) (2.1) 1.3
All Share Index 3,200.00 (0.3) (1.7) 1.6
Banks/Financial Svcs. 3,138.36 (0.5) (2.1) (2.0)
Industrials 3,804.24 (0.6) (4.3) (5.8)
Transportation 2,465.49 (0.4) 0.6 6.3
Real Estate 2,761.56 (0.0) (0.5) 23.0
Insurance 4,880.39 1.0 3.3 23.3
Telecoms 1,137.92 (2.5) (3.2) (23.4)
Consumer 7,518.79 1.5 2.0 8.9
Al Rayan Islamic Index 4,678.00 0.1 (1.0) 14.1
Market Indices
Weekly Index Performance
Regional Indices Close WTD% MTD% YTD%
Weekly Exchange
Traded Value ($ mn)
Exchange Mkt.
Cap. ($ mn)
TTM P/E** P/B** Dividend Yield
Qatar (QSE)* 11,944.62 (0.5) (2.1) (2.8) 82.96 174,127.7 12.3 1.8 4.2
Dubai 4,201.20 2.4 2.8 11.3 242.06 106,979.1#
106,979.1
106,979.1
12.3 1.4 6.2
Abu Dhabi 4,899.79 1.9 3.7 8.2 139.20 132,768.8 12.3 1.5 4.5
Saudi Arabia#
9,381.01 0.5 3.2 12.6 2,300.60 555,255.9 19.5 2.2 2.8
Kuwait 6,286.50 0.2 1.3 (3.8) 83.40 97,000.5 15.7 1.0 4.2
Oman#
6,590.86 0.7 2.6 3.9 4.54 25,794.4 11.5 1.5 3.9
Bahrain 1,337.04 0.2 (2.3) (6.3) 1.05 20,911.5 8.6 0.9 5.3
Source: Bloomberg, country exchanges and Zawya (** Trailing Twelve Months; * Value traded ($ mn) do not include special trades, if any;
#
Data as of July 22, 2015)
11,911.31
11,944.62
0
3,000,000
6,000,000
11,820
11,930
12,040
19-Jul 20-Jul 21-Jul 22-Jul 23-Jul
Volume QSE Index
QSE closed during July19-21, 2015
2.4%
1.9%
0.7% 0.5%
0.2% 0.2%
(0.5%)(1.0%)
0.0%
1.0%
2.0%
3.0%
Dubai
AbuDhabi
Oman
SaudiArabia
Kuwait
Bahrain
Qatar(QSE)*
2. Page 2 of 6
News
Economic News
Turkey’s Alternatifbank gets $125mn 10-Year subordinated
loan from CBQK/units – Of the total, a $75mn loan was
received from parent Commercial Bank of Qatar (CBQK), along
with $25mn each from CBQ’s units United Arab Bank and
National Bank of Oman, Alternatifbank said in a public filing.
Maturity of the loan is 10 year plus 1 day. (Bloomberg)
Siemens win Kahramaa contracts for building substations
– Siemens has won two contracts from Qatar General
Electricity & Water Corporation (Kahramaa) for the turnkey
construction of three substations in Qatar and for the supply of
air-insulated switchgears. Siemens will supply three 132/11kV
substations as part of the Phase II of the Qatar Power
Transmission System expansion project, which has been
devised to meet the growing demand for electricity in Qatar, as
the country continues to witness rapid development and
urbanization. Kahramaa’s expansion projects aim to ensure a
stable power supply to all sectors, including households,
business centers, shopping malls, hospitals and schools
throughout Doha and its suburbs. Meanwhile, Kahramaa’s
Renewable Energy Technology Chairman, Engineer Saleh
Hamad Al Marri said Qatar has saved around QR600mn by
reducing use of gas for production of electricity and water.
Speaking at a forum in Milano Exhibition 2015 in Italy, Al Marri
said Kahramaa has put a plan in place to rationalize and
increase efficiency of energy production and consumption. The
electricity project using solar energy aims to reduce carbon
emissions and meet two percent of the total electricity demand.
(Gulf-Times.com, Peninsula Qatar)
CMC to hold second meeting on Sept 2 – The newly elected
Central Municipal Council (CMC) members for the fifth term will
hold their second meeting on September 2, 2015 to set up
service and public facility, legal, complaints and council affair
panels, among others. The fifth term is expected to be
challenging as the members will address issues, including
internal regulations, new headquarters for the CMC and
recommendations forwarded by the previous council. Chairman
Mohamed bin Hamood Al Shaifi urged members to cooperate,
study and understand the CMC laws. He said it is important for
them to understand CMC’s relations with the Ministry of
Municipality & Urban Planning, Ashghal and other ministries
and departments. (Peninsula Qatar)
Alijarah records QR33.5mn loss in 2Q2015 – National
Leasing (Alijarah) reported a net loss of QR33.5mn in 2Q2015
as compared to a net profit of QR5.7mn in 1Q2015 (net profit of
QR9.3mn in 2Q2014) as its total income dipped 46% QoQ (-
19% YoY) to QR30.5mn in 2Q2015. Further, the company
booked an impairment loss of QR10.8mn on available for sale
financial assets in 2Q2015 which further impacted the bottom-
line. Loss per share amounted to QR0.68 in 2Q2015 as
compared to earnings per share of QR0.12 in 1Q2015. (QSE)
ORDS to sell entire stake in Liberty Telecommunications –
Ooredoo (ORDS) has agreed to sell its entire stake in
Philippines-based Liberty Telecommunications Holdings to
Vega Inc., a subsidiary of San Miguel Corporation and a major
stockholder of Liberty. All parties are proceeding with finalizing
the transaction and fulfilling the necessary regulatory approval.
This divestment will enable ORDS to focus on its core
business. ORDS acquired a 40% shareholding in Liberty in
2008 to develop a WiMAX business in the Philippines. (QSE)
QA launches flights to two more Pakistani cities – Qatar
Airways (QA) has launched services to two new destinations in
Pakistan - Sialkot and Faisalabad - on consecutive days. The
airline commenced on July 16 four weekly passenger services
to Sialkot, where it already operates dedicated freighter
services. QA added on July 17 Faisalabad to its Pakistan
network with three flights a week. Sialkot and Faisalabad have
joined Karachi, Lahore, Islamabad and Peshawar as QA’s
routes to Pakistan served by non-stop flights from the airline’s
Doha hub. Multan will be added from August 2 as the airline’s
next Pakistani destination with three flights a week. (Gulf-
Times.com)
IMF: Qatar top per capita energy subsidizer – Qatar has
been named the top per capita energy subsidizer in the world.
The International Monetary Fund’s (IMF) latest update on global
energy subsidies shows Qatar is the top subsidizer in terms of
per capita, China is top in dollar terms and Ukraine in percent of
GDP. Qatar’s total energy subsidies (post-tax) are projected to
hit an estimated $14.47bn in 2015. Of these, petroleum subsidy
accounts for $6.78bn, while natural gas and electricity subsidies
account for $5.17bn and $2.51bn, respectively. Qatar’s energy
subsidies in terms of per capita are projected at $5,995.25 for
2015. A product breakdown shows petroleum as the highest
subsidized product, amounting to $2,810.29 per capita. Natural
gas amounts to $2,143.83 and electricity subsidy to $1,041.12.
According to the IMF, Qatar’s energy subsidy is expected to
touch 6.37% of its GDP in 2015. Petroleum subsidy accounts
for 2.99% of the GDP, natural gas 2.28% and electricity 1.11%.
The country-level estimates in the GCC shows Kuwait is the
second biggest per capita energy subsidizer ($3,429.95),
followed by Saudi Arabia ($3,395.03). (Peninsula Qatar)
MRDS to disclose financials on August 3 – Mazaya Qatar
Real Estate Development (MRDS) will announce its financial
reports for the period ending June 30, 2015 on August 3, 2015.
(QSE)
IQCD to announce financials on August 3 – Industries Qatar
(IQCD) will disclose its financial reports for the period ending
June 30, 2015 on August 3, 2015. (QSE)
GISS to disclose financials on August 4 – Gulf International
Services (GISS) will announce its financial reports for the
period ending June 30, 2015 on August 4, 2015. (QSE)
MPHC to announce its financials on August 5 – Mesaieed
Petrochemical Holding Company (MPHC) will disclose its
financial reports for the period ending June 30, 2015 on August
5, 2015. (QSE)
MERS to disclose financials on August 10 – Al Meera
Consumer Goods Company (MERS) will announce its financial
reports for the period ending June 30, 2015 on August 10,
2015. (QSE)
WDAM to announce financials on August 13 – Widam Food
Company (WDAM) has announced its intent to disclose the
reviewed financial reports for the period ending June 30, 2015
on August 13, 2015. (QSE)
3. Page 3 of 6
Qatar Stock Exchange
Top Gainers Top Decliners
Source: Qatar Stock Exchange (QSE) Source: Qatar Stock Exchange (QSE)
Most Active Shares by Value (QR Million) Most Active Shares by Volume (Million)
Source: Qatar Stock Exchange (QSE) Source: Qatar Stock Exchange (QSE)
Investor Trading Percentage to Total Value Traded Net Traded Value by Nationality (QR Million)
Source: Qatar Stock Exchange (QSE) Source: Qatar Stock Exchange (QSE)
5.5%
4.2%
2.0% 1.9%
1.7%
0.0%
2.0%
4.0%
6.0%
Al Meera
Consumer
Goods
Al Ahli Bank Doha
Insurance
Medicare
Group
Qatar
Electricity and
Water
-3.2% -3.2%
-2.9%
-2.1%
-1.3%
-4.5%
-3.0%
-1.5%
0.0%
Gulf International
Services
Ooredoo National Leasing Commercial Bank
of Qatar
Industries Qatar
29.9
25.5
24.6 24.4 24.4
0.0
12.0
24.0
36.0
Gulf
International
Services
Doha Bank Barwa Real
Estate
QNB Group Masraf Al
Rayan
0.9
0.5 0.5
0.5 0.5
0.0
0.4
0.8
1.2
Ezdan Real
Estate
Masraf Al Rayan Salam
International
Investment
Barwa Real
Estate
Doha Bank
0%
20%
40%
60%
80%
100%
Buy Sell
39.03% 33.71%
11.11%
6.89%
12.20%
11.90%
37.65%
47.51%
Qatari Individuals Qatari Institutions
Non-Qatari Individuals Non-Qatari Institutions
151
151
123
179
29
(29)
(50) - 50 100 150 200
Qatari
Non-Qatari
Net Investment Total Sold Total Bought
4. Page 4 of 6
TECHNICAL ANALYSIS OF THE QSE INDEX
Source: Bloomberg
With only two days of trading this week, market activity and traded volumes were at its minimal and the index dropped by 0.54% vs. the previous week.
Technical Indicators are flat. Until the market moves with higher traded volumes and breaks its flattish attitude, we reiterate our previous support and
resistance levels between 11,800 and 12,600, respectively.
DEFINITIONS OF KEY TERMS USED IN TECHNICAL ANALYSIS
RSI (Relative Strength Index) indicator – RSI is a momentum oscillator that measures the speed and change of price movements. The RSI oscillates
between 0 to 100. The index is deemed to be overbought once the RSI approaches the 70 level, indicating that a correction is likely. On the other hand, if
the RSI approaches 30, it is an indication that the index may be getting oversold and therefore likely to bounce back.
MACD (Moving Average Convergence Divergence) indicator – The indicator consists of the MACD line and a signal line. The divergence or the
convergence of the MACD line with the signal line indicates the strength in the momentum during the uptrend or downtrend, as the case may be. When the
MACD crosses the signal line from below and trades above it, it gives a positive indication. The reverse is the situation for a bearish trend.
Candlestick chart – A candlestick chart is a price chart that displays the high, low, open, and close for a security. The ‘body’ of the chart is portion between
the open and close price, while the high and low intraday movements form the ‘shadow’. The candlestick may represent any time frame. We use a one-day
candlestick chart (every candlestick represents one trading day) in our analysis.
Doji candlestick pattern – A Doji candlestick is formed when a security's open and close are practically equal. The pattern indicates indecisiveness, and
based on preceding price actions and future confirmation, may indicate a bullish or bearish trend reversal.
Shooting Star/Inverted Hammer candlestick patterns – These candlestick patterns have a small real body (open price and close price are near to each
other), and a long upper shadow (large intraday movement on the upside). The Shooting Star is a bearish reversal pattern that forms after a rally. The
Inverted Hammer looks exactly like a Shooting Star, but forms after a downtrend. Inverted Hammers represent a potential bullish trend reversal.
5. Page 5 of 6
Source: Bloomberg
Company Name
Price
(July 23)
% Change 5-
Day
% Change
YTD
Market Cap.
QR Million TTM P/E P/B Div. Yield
Qatar National Bank 182.60 (0.54) (13.57) 128,750 11.7 2.3 4.1
Qatar Islamic Bank 107.20 (0.92) 5.68 25,520 14.6 1.8 3.9
Commercial Bank of Qatar 55.10 (2.14) (11.84) 17,932 9.5 1.1 5.8
Doha Bank 53.50 0.75 (5.96) 13,849 10.1 1.1 7.5
Al Ahli Bank 46.00 4.24 (3.40) 8,713 13.7 2.0 2.8
Qatar International Islamic Bank 78.90 (0.13) (3.43) 11,943 13.9 2.3 5.1
Masraf Al Rayan 45.70 (0.65) 3.17 34,200 16.3 3.4 3.8
Al Khaliji Bank 22.50 (0.49) 2.04 8,100 13.3 1.4 4.4
National Leasing 20.10 (2.88) 1.25 1,002 36.2 0.8 4.2
Dlala Holding 27.20 (0.37) (18.95) 770 13.7 2.6 N/A
Qatar & Oman Investment 16.05 0.44 4.68 508 16.5 1.5 5.0
Islamic Holding Group 133.10 (0.96) 7.39 535 36.7 9.0 2.2
Banking and Financial Services 251,822
Zad Holding 102.50 0.99 22.02 1,341 12.1 1.7 3.9
Qatar German Co. for Medical Devices 17.00 (1.17) 66.01 195 N/A 1.2 N/A
Salam International Investment 13.90 (1.20) (11.67) 1,600 20.0 1.0 4.3
Medicare Group 190.00 1.90 60.68 5,291 26.9 6.0 0.9
Qatar Cinema & Film Distribution 42.50 0.00 6.25 267 21.4 1.9 2.1
Qatar Fuel 172.10 0.46 (15.37) 14,603 12.8 2.2 5.2
Qatar Meat and Livestock 61.00 0.98 2.48 1,114 20.6 4.3 4.0
Al Meera Consumer Goods 261.00 5.48 36.55 5,462 23.7 4.3 3.3
Consumer Goods and Services 29,873
Qatar Industrial Manufacturing 46.75 0.00 7.84 2,222 13.4 1.6 6.4
Qatar National Cement 120.00 (0.33) (0.33) 6,460 15.2 2.4 3.0
Industries Qatar 133.10 (1.26) (20.42) 80,889 14.2 2.7 5.2
Qatari Investors Group 51.50 0.96 26.81 6,527 27.9 2.8 1.4
Qatar Electricity and Water 221.00 1.67 19.95 24,739 15.5 3.7 3.3
Mannai Corp. 110.00 (0.64) 0.37 4,991 9.2 2.4 5.5
Aamal 15.17 0.07 4.86 9,557 15.1 1.3 6.3
Gulf International Services 74.20 (3.17) (24.61) 13,604 8.6 3.9 7.5
Mesaieed Petrochemical Holding 24.03 0.00 -18.6 30,152 20.9 2.3 4.6
Industrials 179,139
Qatar Insurance 102.00 1.10 28.20 18,647 19.8 3.2 2.2
Doha Insurance 25.70 1.95 (9.66) 1,310 14.8 1.2 3.8
Qatar General Insurance & Reinsurance 55.90 0.18 8.96 4,447 4.9 0.8 3.1
Al Khaleej Takaful Insurance 42.50 1.42 (3.11) 1,093 14.7 1.7 3.0
Qatar Islamic Insurance 81.90 0.61 4.43 1,238 14.8 4.3 4.8
Insurance 26,734
United Development 24.62 0.84 6.40 8,888 13.0 0.8 5.0
Barw a Real Estate 50.80 0.20 21.48 19,806 3.2 1.1 4.3
Ezdan Real Estate 18.05 (0.28) 21.25 47,984 35.0 1.6 2.2
Mazaya Qatar Real Estate Development 18.51 (0.37) 2.09 1,955 11.3 1.5 1.5
Real Estate 78,633
Qatar Telecom 83.60 (3.16) (33.25) 26,490 15.2 1.3 4.8
Vodafone Qatar 16.32 (1.03) (0.30) 13,865 N/A 2.5 1.3
Telecoms 40,355
Qatar Navigation (Milaha) 97.10 0.00 (1.41) 11,235 10.5 0.9 5.6
Gulf Warehousing 75.20 0.00 34.40 3,605 22.5 4.3 2.0
Qatar Gas Transport (Nakilat) 22.21 (0.89) (3.46) 12,488 13.1 3.1 5.4
Transportation 27,328
Qatar Exchange 633,883
6. Contacts
Saugata Sarkar Sahbi Kasraoui QNB Financial Services SPC
Head of Research Head of HNI Contact Center: (+974) 4476 6666
Tel: (+974) 4476 6534 Tel: (+974) 4476 6544 PO Box 24025
saugata.sarkar@qnbfs.com.qa sahbi.alkasraoui@qnbfs.com.qa Doha, Qatar
Disclaimer and Copyright Notice: This publication has been prepared by QNB Financial Services SPC (“QNBFS”) a wholly-owned subsidiary of QNB SAQ (“QNB”). QNBFS is regulated by the
Qatar Financial Markets Authority and the Qatar Exchange QNB SAQ is regulated by the Qatar Central Bank. This publication expresses the views and opinions of QNBFS at a given time only. It is
not an offer, promotion or recommendation to buy or sell securities or other investments, nor is it intended to constitute legal, tax, accounting, or financial advice. QNBFS accepts no liability
whatsoever for any direct or indirect losses arising from use of this report. Any investment decision should depend on the individual circumstances of the investor and be based on specifically
engaged investment advice. We therefore strongly advise potential investors to seek independent professional advice before making any investment decision. Although the information in this report
has been obtained from sources that QNBFS believes to be reliable, we have not independently verified such information and it may not be accurate or complete. QNBFS does not make any
representations or warranties as to the accuracy and completeness of the information it may contain, and declines any liability in that respect. For reports dealing with Technical Analysis,
expressed opinions and/or recommendations may be different or contrary to the opinions/recommendations of QNBFS Fundamental Research as a result of depending solely on the historical
technical data (price and volume). QNBFS reserves the right to amend the views and opinions expressed in this publication at any time. It may also express viewpoints or make investment
decisions that differ significantly from, or even contradict, the views and opinions included in this report. This report may not be reproduced in whole or in part without permission from QNBFS
COPYRIGHT: No part of this document may be reproduced without the explicit written permission of QNBFS.
Page 6 of 6