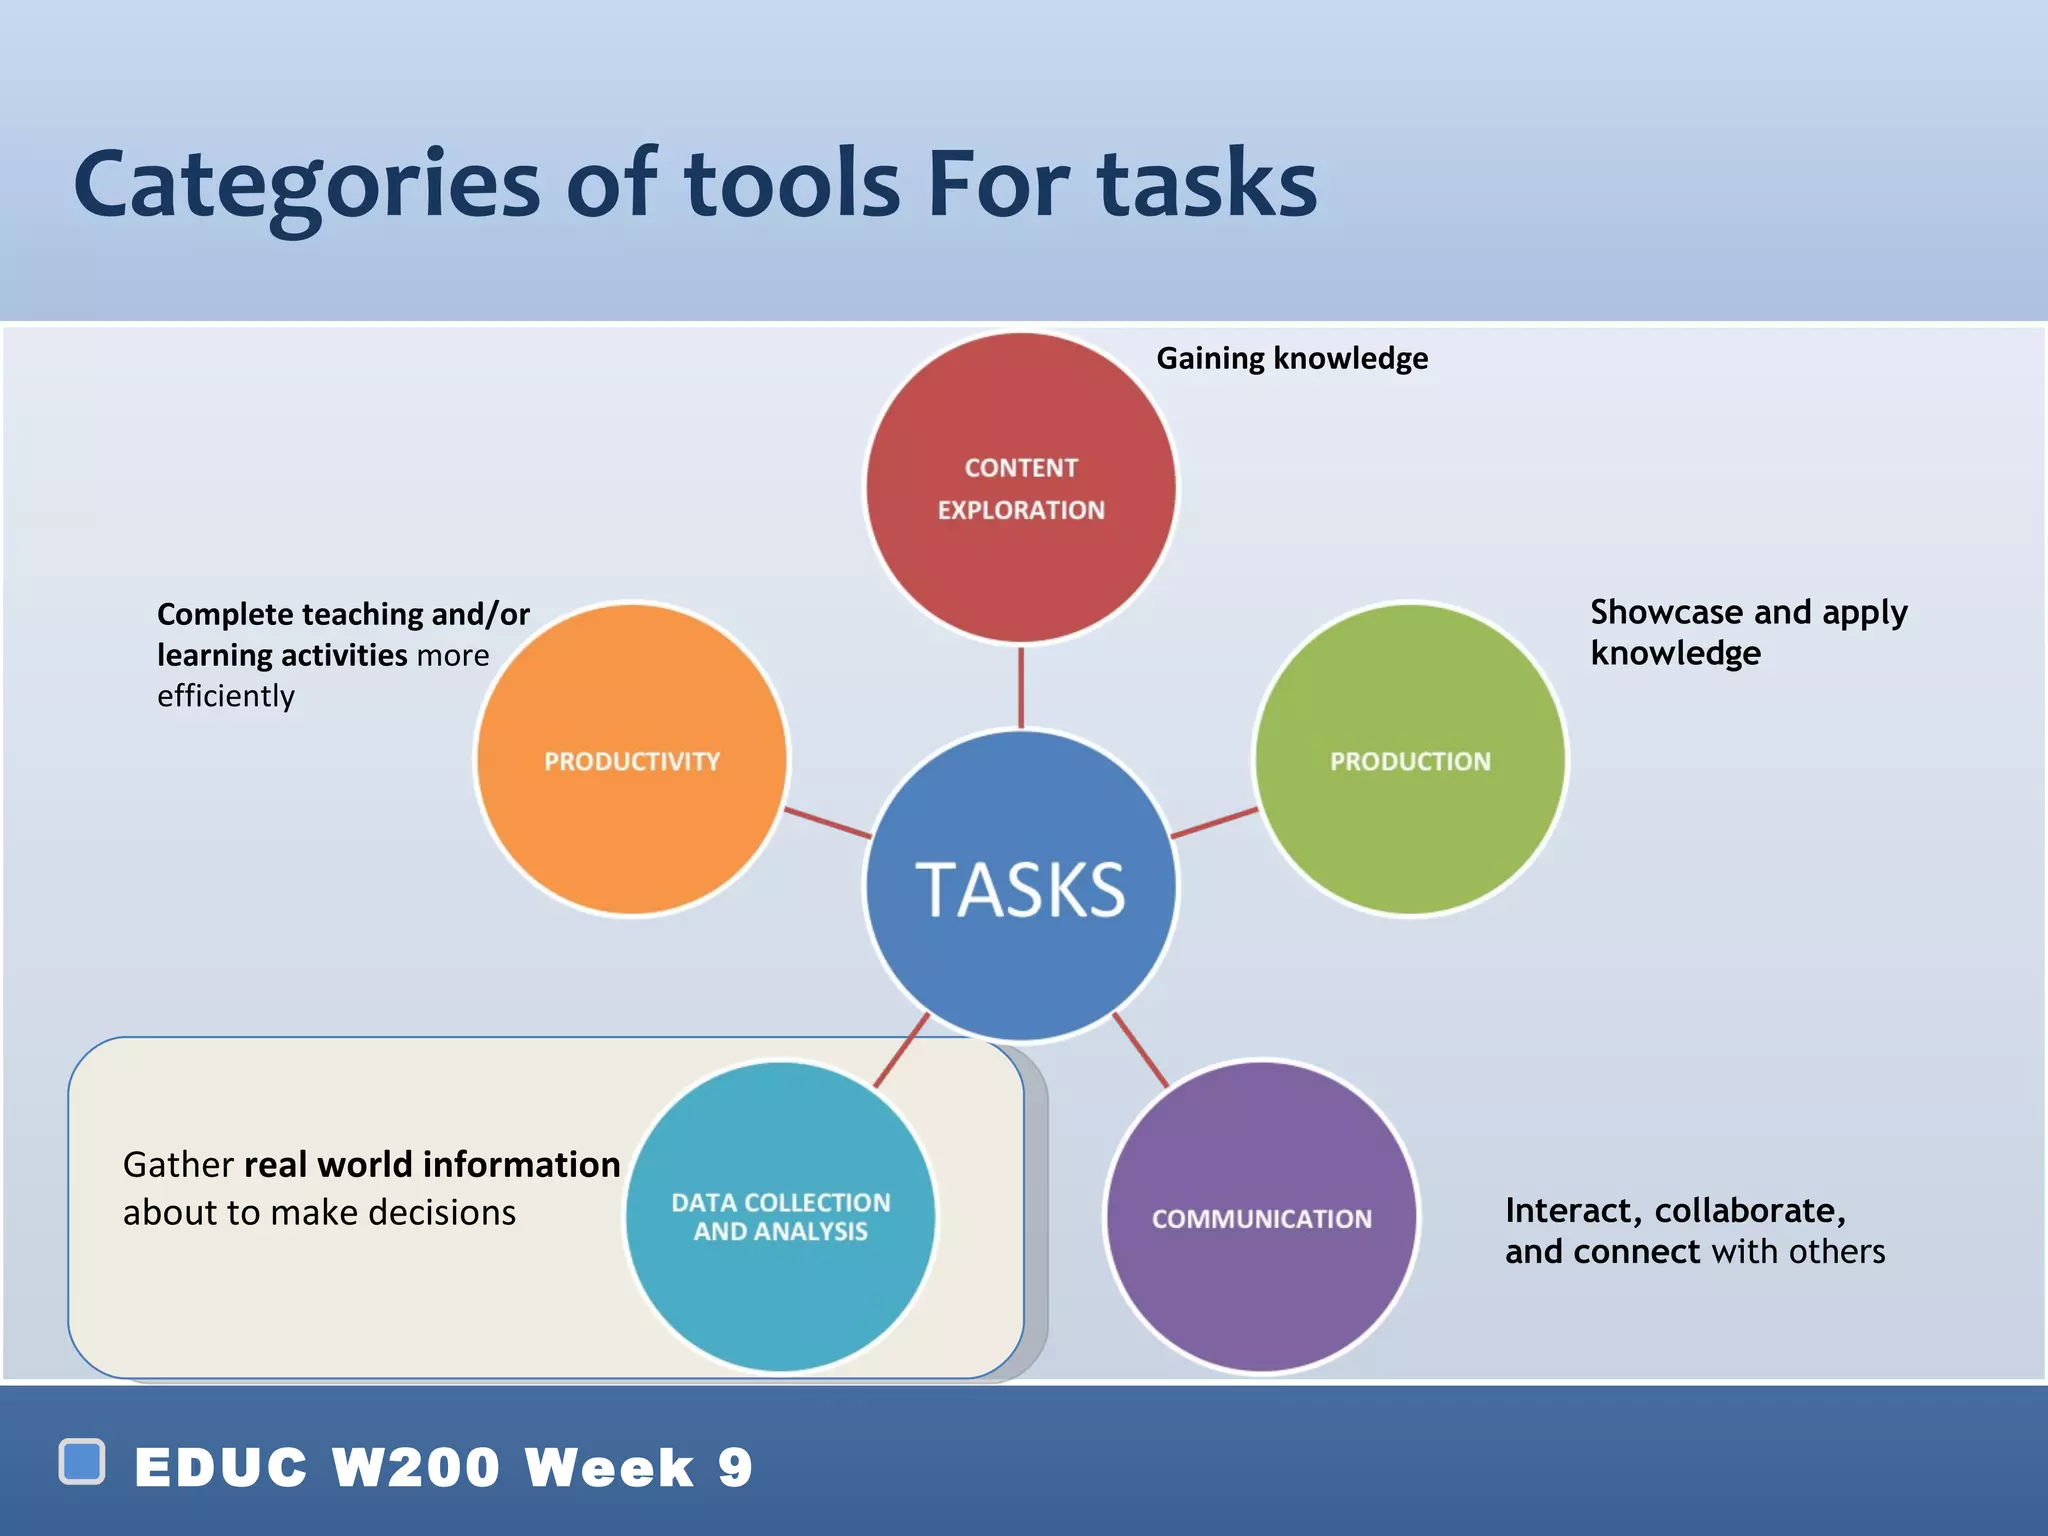
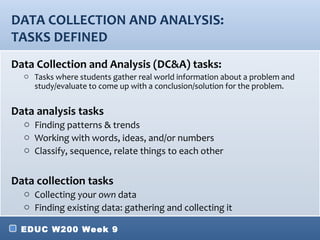
Categories of tools For tasks
                                 Gaining knowledge


   Complete teaching and/or                               Showcase and apply
   learning activities more                               knowledge
   efficiently


 Gather real world information
 about to make decisions                             Interact, collaborate,
                                                     and connect with others


 EDUC W200 Week 9
DATA COLLECTION AND ANALYSIS TASKS


EDUC W200 Week 9
DATA COLLECTION & ANALYSIS (DC&A) TASKS:

• Discussion Questions :
  o What is your definition of “data analysis?” What do you
    think of?
  o What about “data collection?” What do you think of for
    that?
  o In your school experiences, when have you collected data?
    Analyzed data?


 EDUC W200 Week 9
DATA COLLECTION AND ANALYSIS:
TASKS DEFINED
Data Collection and Analysis (DC&A) tasks:
  o Tasks where students gather real world information about a problem and
    study/evaluate to come up with a conclusion/solution for the problem.


Data analysis tasks
  o Finding patterns & trends
  o Working with words, ideas, and/or numbers
  o Classify, sequence, relate things to each other


Data collection tasks
  o Collecting your own data
  o Finding existing data: gathering and collecting it

 EDUC W200 Week 9
DATA COLLECTION AND ANALYSIS:
ACROSS SUBJECT AREAS
• And tools for DC&A tasks help them do this.
  But how does this work across subject areas and
  grade levels…?

Discussion Question:
How can students in my subject area learn through
  collecting data? Analyzing data?


 EDUC W200 Week 9
DATA ANALYSIS TASKS


EDUC W200 Week 9
WHAT ARE DATA ANALYSIS TASKS?

• Its all about thinking about, moving around,
  organizing and looking for patterns in data.
• Provide students with raw materials (facts, numbers,
  words, etc)
• Asks them to draw conclusions and facts on their
  own
• Not limited to numbers – it’s about patterns of all
  types


 EDUC W200 Week 9
EXAMPLES OF ANALYZING DATA

 • Taking measurements of three different plants over
   the course of a month (science)
 • Looking up the parties of presidential election
   winners and recording them for each election year
   (social studies)
 • Looking at multiple poems and finding the common
   meters, themes, structures, etc
 • Measuring angles and using these measurements to
   create “rules” for geometry

 EDUC W200 Week 9
Data collection and analysis:
across subject areas
• And tools for DC&A tasks help them do this.
  But how does this work across subject areas and
  grade levels…?

Think-Pair-Share – 3 minutes:
How can students in my subject area learn through
collecting data? Analyzing data?


 EDUC W200 Week 9
WHY BOTHER WITH DATA ANALYSIS TASKS?

• Analyzing your own data makes it more ‘real’
• Gives a visual way to view information (Ex: Wordle or
  InspireData)
• It also teaches problem solving


 EDUC W200 Week 9

Week9 sp2012_Lecture part1 defintions

  • 1.
    Categories of toolsFor tasks Gaining knowledge Complete teaching and/or Showcase and apply learning activities more knowledge efficiently Gather real world information about to make decisions Interact, collaborate, and connect with others EDUC W200 Week 9
  • 2.
    DATA COLLECTION ANDANALYSIS TASKS EDUC W200 Week 9
  • 3.
    DATA COLLECTION &ANALYSIS (DC&A) TASKS: • Discussion Questions : o What is your definition of “data analysis?” What do you think of? o What about “data collection?” What do you think of for that? o In your school experiences, when have you collected data? Analyzed data? EDUC W200 Week 9
  • 4.
    DATA COLLECTION ANDANALYSIS: TASKS DEFINED Data Collection and Analysis (DC&A) tasks: o Tasks where students gather real world information about a problem and study/evaluate to come up with a conclusion/solution for the problem. Data analysis tasks o Finding patterns & trends o Working with words, ideas, and/or numbers o Classify, sequence, relate things to each other Data collection tasks o Collecting your own data o Finding existing data: gathering and collecting it EDUC W200 Week 9
  • 5.
    DATA COLLECTION ANDANALYSIS: ACROSS SUBJECT AREAS • And tools for DC&A tasks help them do this. But how does this work across subject areas and grade levels…? Discussion Question: How can students in my subject area learn through collecting data? Analyzing data? EDUC W200 Week 9
  • 6.
  • 7.
    WHAT ARE DATAANALYSIS TASKS? • Its all about thinking about, moving around, organizing and looking for patterns in data. • Provide students with raw materials (facts, numbers, words, etc) • Asks them to draw conclusions and facts on their own • Not limited to numbers – it’s about patterns of all types EDUC W200 Week 9
  • 8.
    EXAMPLES OF ANALYZINGDATA • Taking measurements of three different plants over the course of a month (science) • Looking up the parties of presidential election winners and recording them for each election year (social studies) • Looking at multiple poems and finding the common meters, themes, structures, etc • Measuring angles and using these measurements to create “rules” for geometry EDUC W200 Week 9
  • 9.
    Data collection andanalysis: across subject areas • And tools for DC&A tasks help them do this. But how does this work across subject areas and grade levels…? Think-Pair-Share – 3 minutes: How can students in my subject area learn through collecting data? Analyzing data? EDUC W200 Week 9
  • 10.
    WHY BOTHER WITHDATA ANALYSIS TASKS? • Analyzing your own data makes it more ‘real’ • Gives a visual way to view information (Ex: Wordle or InspireData) • It also teaches problem solving EDUC W200 Week 9

Editor's Notes

  • #8 Data Analysis Tasks Looking for patterns or trends Classifying, sequencing, categorizing Doesn ’t have to be complicated to be effective! Can be done with collected data or database data It ’s all about thinking about, moving around, organizing and looking for patterns in data.
  • #9 Examples of analyzing data Distributing survey of height, weight, and gender (math/statistics) Plotting various combinations of the data for statistical analysis or “eyeball testing” Taking measurements of three different plants over the course of a month (science) Plotting the growth and comparing Looking up the parties of presidential election winners and recording them for each election year (social studies) Creating a timeline of the winners and major historical events and looking for patterns
  • #11 Letting students analyze their own data instead of “just telling them the rule/pattern” adds authenticity It gives students a chance to look at unifying themes (Ex: Wordle ) or visual representations of many details ( InspireData ) It also teaches problem solving - they won ’t always have you to tell them the rule or pattern! If the student can figure out the