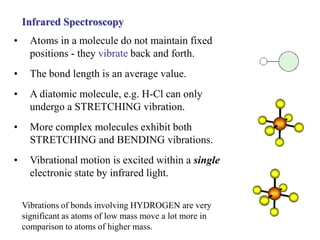
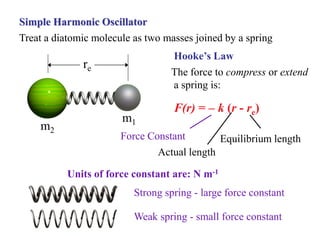
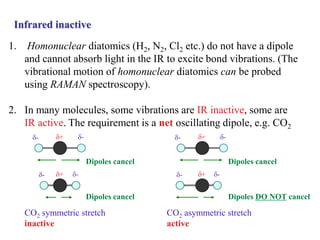
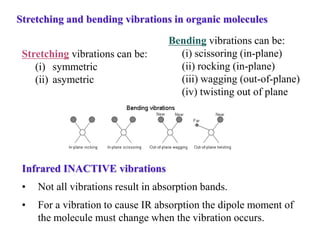
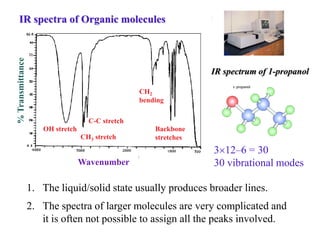
SlideShare a Scribd company logo
Infrared Spectroscopy
• Atoms in a molecule do not maintain fixed
positions - they vibrate back and forth.
• The bond length is an average value.
• A diatomic molecule, e.g. H-Cl can only
undergo a STRETCHING vibration.
• More complex molecules exhibit both
STRETCHING and BENDING vibrations.
• Vibrational motion is excited within a single
electronic state by infrared light.
Vibrations of bonds involving HYDROGEN are very
significant as atoms of low mass move a lot more in
comparison to atoms of higher mass.
Simple Harmonic Oscillator
re
m1
m2
Hooke’s Law
The force to compress or extend
a spring is:
F(r) = – k (r - re)
Force Constant
Actual length
Equilibrium length
Strong spring - large force constant
Weak spring - small force constant
Units of force constant are: N m-1
Treat a diatomic molecule as two masses joined by a spring
Diatomic molecule force constants
Strong bonds have large force constants.
Molecule k/N m-1 Eb/kJ mol-1
H2 509 436
HCl 478 431
Cl2 320 242
N2 2241 945
Single bonds
triple bond
Eb = bond dissociation
energy.
Potential energy in the spring, V(r)
V(r) = k (r – re)2
1
2
Vibrational frequency, n
The vibrational frequency is given by:
SI Units
• Hz (or s-1) for n
• N m-1 for k
• kg (per molecule) for µ
We frequently use masses in g mol-1 (e.g. H=1, C=12, O=16 …)
 = m1 m2
m1 + m2
u kg
Where u is the unified mass
constant u = 1.66  10-27 kg
n = 1
2
k
 Hz  = m1 m2
m1 + m2
µ is the reduced mass
kg
Vibrational frequency - wavenumbers, cm-1
cm-1
n = 1
200c
k

The vibrational frequency
in cm-1 is given by:
The frequency is:
1. directly proportional to the force constant
2. inversely proportional to the reduced mass
Molecule k/N m-1 µ/kg n/cm-1
H2 509 8.3110-28 4159
HCl 478 1.6210-27 2890
Cl2 320 2.9110-26 557
N2 2241 1.1610-26 2331
The SI unit of wavenumber is m-1.
But cm-1 is more common.
n/m n/cm 100
n = 1/l and c = lnso n = n / c
Example
Suppose that the C=O group in a peptide bond can be regarded as
isolated from the rest of the molecule. Given that the force constant
of the bond in a carbonyl group is 908 N m-1, calculate
the vibrational frequency of (a) 12C=16O and (b) 13C=16O.
Energy levels
Classically the harmonic oscillator
can have any energy.
Quantum mechanically it only has
discrete equally spaced energy
levels given by:
v = 0, 1, 2, 3…
Ev = (v + ) hn
1
2
Selection rule
Absorption of light only occurs for ∆v = ± 1
This means that each transition has the same energy change.
Interaction with light
1. Light has an oscillating electric field.
2. The molecule must also possess an oscillating electric field (at
the same frequency).
3. Photon energy must equal the difference between energy levels.
1. Heteronuclear diatomics have a dipole due to the uneven
electron distribution around each atom.
2. The dipole is the product of the charge  distance apart.
3. Bond vibrations change the distance and hence the dipole
oscillates. This creates an oscillating electric field.
d+
d-
d+
d-
d+
d-
d+
d-
d+
d-
max min
Oscillating dipole
1. Homonuclear diatomics (H2, N2, Cl2 etc.) do not have a dipole
and cannot absorb light in the IR to excite bond vibrations. (The
vibrational motion of homonuclear diatomics can be probed
using RAMAN spectroscopy).
2. In many molecules, some vibrations are IR inactive, some are
IR active. The requirement is a net oscillating dipole, e.g. CO2
Infrared inactive
d+
d- d-
d+
d- d-
Dipoles cancel
Dipoles cancel
CO2 symmetric stretch
inactive
d+
d- d-
d+
d- d-
Dipoles cancel
Dipoles DO NOT cancel
CO2 asymmetric stretch
active
Characteristic Vibrations of H2O - all IR active
symmetric stretch asymmetric stretch
n1 = 3657 cm-1 n2 = 1595 cm-1 n3 = 3756 cm-1
bend
Number of vibrational modes
Linear molecule with n atoms - number modes = 3n–5
e.g. CO2 n = 3 so number vib modes = 33–5 = 4
Non-linear molecule with n atoms - number modes = 3n–6
e.g. CH4 n = 5 so number vib modes = 35–6 = 9
The number of vibrational modes increases
very rapidly with n, PLUS many of these
vibrations may occur at the same frequency
and so not all of the possible bands are seen
as independent absorptions.
IR spectra are complex
Fullerene C60
174 vib modes
Stretching and bending vibrations in organic molecules
Stretching vibrations can be:
(i) symmetric
(ii) asymetric
Infrared INACTIVE vibrations
• Not all vibrations result in absorption bands.
• For a vibration to cause IR absorption the dipole moment of
the molecule must change when the vibration occurs.
Bending vibrations can be:
(i) scissoring (in-plane)
(ii) rocking (in-plane)
(iii) wagging (out-of-plane)
(iv) twisting out of plane
• Each stretching and bending vibration of a bond is associated
with radiation whose frequency exactly matches the frequency
of the vibration of the bond.
• Different functional groups, e.g. C–C, C=C, C=O, N–H …
will have different characteristic frequencies
• Therefore, by determining the frequencies of light (IR) that are
absorbed by a particular compound we can determine what
kind of bonds it has.
IR spectra of Organic/Biological molecules
This is not as easy as it sounds
IR spectra of Organic molecules
Gas Phase Infrared Spectrum of Formaldehyde, H2C=O
IR spectra are often shown as % Transmittance vs Wavenumber.
So, ZERO absorption is 100% transmittance.
An absorption band appears as a trough in the spectrum. i.e. the
spectrum looks ‘upside down’.
The spectra of simple
molecules can often
be fully assigned
Wavenumber / cm-1
3n–6 = 34–6 = 6
6 vibrational modes
%
Transmittance
Wavenumber
IR spectra of Organic molecules
IR spectrum of 1-propanol
OH stretch
CH2
bending
CH3 stretch
Backbone
stretches
C-C stretch
1. The liquid/solid state usually produces broader lines.
2. The spectra of larger molecules are very complicated and
it is often not possible to assign all the peaks involved.
312–6 = 30
30 vibrational modes
Lactic Acid
OH stretches
CH3 stretches
carboxyl
stretches
Backbone
stretches
Fingerprint Region
The fingerprint region is an area of complex overlaps where it is
impossible to assign all (any?) of the bands. It can act as a unique
‘fingerprint’ for a given molecule.
Functional group Region
Spectral regions in the infrared
Middle IR spectrum can also be roughly divided into:
1. FUNCTIONAL GROUP REGION,  = 4000 - 1200 cm-1
2. FINGERPRINT REGION,  = 1200 - 400 cm-1
• It takes more energy to stretch a bond than bend it
• Therefore stretching bands are found in the
4000-1200 cm-1 (functional group region)
• Bends are typically observed in the fingerprint region
Functional group frequencies
There are extensive tables and charts available to aid in identifying
IR spectral features. It’s as much an art as a science!
Functional group frequencies
Amide I Amide II
Applications of IR to Protein structure
Amide bond of peptides has many vibrational
modes (at least 10 IR bands) these bands are
designated amide I, amide II, etc.
The frequency of Amide I depends upon the environment of
the bond and as such can be used to learn about the protein structure.
O
C
N
H
Amide I
Amide II
Protein Amide I: 1690-1600
Protein Amide II: 1575-1480
Amide Band Assignments
Amide A is 95% due to the the N-H stretching vibration. It is very sensitive to the
strength of the hydrogen bond.
Amide I is primarily governed by the stretching vibrations of the C=O (70-85%) and
C-N groups (10-20%).
Amide II derives mainly from in-plane N-H bending (40-60%). The rest arises from
the C-N (18-40%) and the C-C (about 10%) stretching vibrations.
Amide III, V are very complex bands dependent nature of side chains and hydrogen
bonding - only of limited use for the extraction of structural information.
Its frequency depends upon whether the peptide bond is in the
-helix, -sheet, or random configuration
Wavenumber /cm-1
-helix 1650
-sheet 1632, 1685
random coil 1658
Each band is well resolved so if protein contains all three
configurations 4 bands will be seen.
Amide I band

More Related Content

Similar to Week2_Notes.pdf

I R spectroscopy
I R spectroscopyI R spectroscopy
I R spectroscopy
ceutics1315
 
ir spectroscopy
ir spectroscopyir spectroscopy
ir spectroscopy
komal shinde
 
Infrared spectroscopy
Infrared spectroscopy Infrared spectroscopy
Infrared spectroscopy
Suvarta Maru
 
Infrared (IR) Spectroscopy
Infrared (IR) SpectroscopyInfrared (IR) Spectroscopy
Infrared (IR) Spectroscopy
Ashwani Dhingra
 
Infrared.ppt mass NMR mass and it spectroscopy
Infrared.ppt mass NMR mass and it spectroscopyInfrared.ppt mass NMR mass and it spectroscopy
Infrared.ppt mass NMR mass and it spectroscopy
ShaikhSalman43
 
Ftir final presentation
Ftir final presentationFtir final presentation
Ftir final presentation
Tejasvi Bhatia
 
6_2018_05_05!06_59_31_PM.ppt
6_2018_05_05!06_59_31_PM.ppt6_2018_05_05!06_59_31_PM.ppt
6_2018_05_05!06_59_31_PM.ppt
BhupendraShilpi
 
IR spectroscopy- Infra Red spectroscopy in details
IR spectroscopy- Infra Red spectroscopy in detailsIR spectroscopy- Infra Red spectroscopy in details
IR spectroscopy- Infra Red spectroscopy in details
Bioline Education
 
1.b IR spec.ppt.........................
1.b IR spec.ppt.........................1.b IR spec.ppt.........................
1.b IR spec.ppt.........................
YogeshSalunke22
 
استخدام جهاز ATR-FTIR
استخدام جهاز ATR-FTIRاستخدام جهاز ATR-FTIR
استخدام جهاز ATR-FTIR
MohammedTahir35
 
Ir spectroscopy by Bhavana P Khobragade
Ir spectroscopy by Bhavana P KhobragadeIr spectroscopy by Bhavana P Khobragade
Ir spectroscopy by Bhavana P Khobragade
BhavanaKhobragade
 
Introduction to ir spectroscopy
Introduction to ir spectroscopyIntroduction to ir spectroscopy
Introduction to ir spectroscopy
Bahauddin Zakariya University lahore
 
1.-uv-visible (1) edicion dios.pdf sssss
1.-uv-visible (1) edicion dios.pdf sssss1.-uv-visible (1) edicion dios.pdf sssss
1.-uv-visible (1) edicion dios.pdf sssss
l22211712
 
Infrared spectroscopy - IR...............
Infrared spectroscopy - IR...............Infrared spectroscopy - IR...............
Infrared spectroscopy - IR...............
3611VINODHAVARSHINIS
 
IR Spectroscopy with detailed introduction
IR Spectroscopy  with detailed introductionIR Spectroscopy  with detailed introduction
IR Spectroscopy with detailed introduction
nivedithag131
 
IR introduction Introduction, Principle & Theory
IR introduction Introduction, Principle & TheoryIR introduction Introduction, Principle & Theory
IR introduction Introduction, Principle & Theory
nivedithag131
 
Ch 323 INFARED SPECTROSCOPY INTRODUCTION
Ch 323 INFARED SPECTROSCOPY INTRODUCTIONCh 323 INFARED SPECTROSCOPY INTRODUCTION
Ch 323 INFARED SPECTROSCOPY INTRODUCTION
University of Dar es Salaam
 
INFRARED Spectroscopy analytical instrument.ppt
INFRARED Spectroscopy analytical instrument.pptINFRARED Spectroscopy analytical instrument.ppt
INFRARED Spectroscopy analytical instrument.ppt
FitsumDemissie
 
TOPIC 5 NP SPECTROSCOPIC -IR.pptx
TOPIC 5 NP SPECTROSCOPIC -IR.pptxTOPIC 5 NP SPECTROSCOPIC -IR.pptx
TOPIC 5 NP SPECTROSCOPIC -IR.pptx
SorayaIshak2
 

Similar to Week2_Notes.pdf (20)

I R spectroscopy
I R spectroscopyI R spectroscopy
I R spectroscopy
 
ir spectroscopy
ir spectroscopyir spectroscopy
ir spectroscopy
 
Infrared spectroscopy
Infrared spectroscopy Infrared spectroscopy
Infrared spectroscopy
 
FTIR
FTIRFTIR
FTIR
 
Infrared (IR) Spectroscopy
Infrared (IR) SpectroscopyInfrared (IR) Spectroscopy
Infrared (IR) Spectroscopy
 
Infrared.ppt mass NMR mass and it spectroscopy
Infrared.ppt mass NMR mass and it spectroscopyInfrared.ppt mass NMR mass and it spectroscopy
Infrared.ppt mass NMR mass and it spectroscopy
 
Ftir final presentation
Ftir final presentationFtir final presentation
Ftir final presentation
 
6_2018_05_05!06_59_31_PM.ppt
6_2018_05_05!06_59_31_PM.ppt6_2018_05_05!06_59_31_PM.ppt
6_2018_05_05!06_59_31_PM.ppt
 
IR spectroscopy- Infra Red spectroscopy in details
IR spectroscopy- Infra Red spectroscopy in detailsIR spectroscopy- Infra Red spectroscopy in details
IR spectroscopy- Infra Red spectroscopy in details
 
1.b IR spec.ppt.........................
1.b IR spec.ppt.........................1.b IR spec.ppt.........................
1.b IR spec.ppt.........................
 
استخدام جهاز ATR-FTIR
استخدام جهاز ATR-FTIRاستخدام جهاز ATR-FTIR
استخدام جهاز ATR-FTIR
 
Ir spectroscopy by Bhavana P Khobragade
Ir spectroscopy by Bhavana P KhobragadeIr spectroscopy by Bhavana P Khobragade
Ir spectroscopy by Bhavana P Khobragade
 
Introduction to ir spectroscopy
Introduction to ir spectroscopyIntroduction to ir spectroscopy
Introduction to ir spectroscopy
 
1.-uv-visible (1) edicion dios.pdf sssss
1.-uv-visible (1) edicion dios.pdf sssss1.-uv-visible (1) edicion dios.pdf sssss
1.-uv-visible (1) edicion dios.pdf sssss
 
Infrared spectroscopy - IR...............
Infrared spectroscopy - IR...............Infrared spectroscopy - IR...............
Infrared spectroscopy - IR...............
 
IR Spectroscopy with detailed introduction
IR Spectroscopy  with detailed introductionIR Spectroscopy  with detailed introduction
IR Spectroscopy with detailed introduction
 
IR introduction Introduction, Principle & Theory
IR introduction Introduction, Principle & TheoryIR introduction Introduction, Principle & Theory
IR introduction Introduction, Principle & Theory
 
Ch 323 INFARED SPECTROSCOPY INTRODUCTION
Ch 323 INFARED SPECTROSCOPY INTRODUCTIONCh 323 INFARED SPECTROSCOPY INTRODUCTION
Ch 323 INFARED SPECTROSCOPY INTRODUCTION
 
INFRARED Spectroscopy analytical instrument.ppt
INFRARED Spectroscopy analytical instrument.pptINFRARED Spectroscopy analytical instrument.ppt
INFRARED Spectroscopy analytical instrument.ppt
 
TOPIC 5 NP SPECTROSCOPIC -IR.pptx
TOPIC 5 NP SPECTROSCOPIC -IR.pptxTOPIC 5 NP SPECTROSCOPIC -IR.pptx
TOPIC 5 NP SPECTROSCOPIC -IR.pptx
 

More from JoyPalit

Chain_Rule.pdf
Chain_Rule.pdfChain_Rule.pdf
Chain_Rule.pdf
JoyPalit
 
4204 Chapt 3 (L-1) Water pollution (Introduction).pdf
4204 Chapt 3 (L-1) Water pollution (Introduction).pdf4204 Chapt 3 (L-1) Water pollution (Introduction).pdf
4204 Chapt 3 (L-1) Water pollution (Introduction).pdf
JoyPalit
 
ACCE 201 Lec 01.pdf
ACCE 201 Lec 01.pdfACCE 201 Lec 01.pdf
ACCE 201 Lec 01.pdf
JoyPalit
 
Week3_Notes.pdf
Week3_Notes.pdfWeek3_Notes.pdf
Week3_Notes.pdf
JoyPalit
 
Week1_Notes.pdf
Week1_Notes.pdfWeek1_Notes.pdf
Week1_Notes.pdf
JoyPalit
 
Lecture15.pdf
Lecture15.pdfLecture15.pdf
Lecture15.pdf
JoyPalit
 
Lecture16.pdf
Lecture16.pdfLecture16.pdf
Lecture16.pdf
JoyPalit
 
Lecture17.pdf
Lecture17.pdfLecture17.pdf
Lecture17.pdf
JoyPalit
 
Lecture14.pdf
Lecture14.pdfLecture14.pdf
Lecture14.pdf
JoyPalit
 
Lecture1.pdf
Lecture1.pdfLecture1.pdf
Lecture1.pdf
JoyPalit
 

More from JoyPalit (10)

Chain_Rule.pdf
Chain_Rule.pdfChain_Rule.pdf
Chain_Rule.pdf
 
4204 Chapt 3 (L-1) Water pollution (Introduction).pdf
4204 Chapt 3 (L-1) Water pollution (Introduction).pdf4204 Chapt 3 (L-1) Water pollution (Introduction).pdf
4204 Chapt 3 (L-1) Water pollution (Introduction).pdf
 
ACCE 201 Lec 01.pdf
ACCE 201 Lec 01.pdfACCE 201 Lec 01.pdf
ACCE 201 Lec 01.pdf
 
Week3_Notes.pdf
Week3_Notes.pdfWeek3_Notes.pdf
Week3_Notes.pdf
 
Week1_Notes.pdf
Week1_Notes.pdfWeek1_Notes.pdf
Week1_Notes.pdf
 
Lecture15.pdf
Lecture15.pdfLecture15.pdf
Lecture15.pdf
 
Lecture16.pdf
Lecture16.pdfLecture16.pdf
Lecture16.pdf
 
Lecture17.pdf
Lecture17.pdfLecture17.pdf
Lecture17.pdf
 
Lecture14.pdf
Lecture14.pdfLecture14.pdf
Lecture14.pdf
 
Lecture1.pdf
Lecture1.pdfLecture1.pdf
Lecture1.pdf
 

Recently uploaded

NO1 Uk best vashikaran specialist in delhi vashikaran baba near me online vas...
NO1 Uk best vashikaran specialist in delhi vashikaran baba near me online vas...NO1 Uk best vashikaran specialist in delhi vashikaran baba near me online vas...
NO1 Uk best vashikaran specialist in delhi vashikaran baba near me online vas...
Amil Baba Dawood bangali
 
ethical hacking-mobile hacking methods.ppt
ethical hacking-mobile hacking methods.pptethical hacking-mobile hacking methods.ppt
ethical hacking-mobile hacking methods.ppt
Jayaprasanna4
 
weather web application report.pdf
weather web application report.pdfweather web application report.pdf
weather web application report.pdf
Pratik Pawar
 
Student information management system project report ii.pdf
Student information management system project report ii.pdfStudent information management system project report ii.pdf
Student information management system project report ii.pdf
Kamal Acharya
 
Railway Signalling Principles Edition 3.pdf
Railway Signalling Principles Edition 3.pdfRailway Signalling Principles Edition 3.pdf
Railway Signalling Principles Edition 3.pdf
TeeVichai
 
Architectural Portfolio Sean Lockwood
Architectural Portfolio Sean LockwoodArchitectural Portfolio Sean Lockwood
Architectural Portfolio Sean Lockwood
seandesed
 
Gen AI Study Jams _ For the GDSC Leads in India.pdf
Gen AI Study Jams _ For the GDSC Leads in India.pdfGen AI Study Jams _ For the GDSC Leads in India.pdf
Gen AI Study Jams _ For the GDSC Leads in India.pdf
gdsczhcet
 
Cosmetic shop management system project report.pdf
Cosmetic shop management system project report.pdfCosmetic shop management system project report.pdf
Cosmetic shop management system project report.pdf
Kamal Acharya
 
Immunizing Image Classifiers Against Localized Adversary Attacks
Immunizing Image Classifiers Against Localized Adversary AttacksImmunizing Image Classifiers Against Localized Adversary Attacks
Immunizing Image Classifiers Against Localized Adversary Attacks
gerogepatton
 
在线办理(ANU毕业证书)澳洲国立大学毕业证录取通知书一模一样
在线办理(ANU毕业证书)澳洲国立大学毕业证录取通知书一模一样在线办理(ANU毕业证书)澳洲国立大学毕业证录取通知书一模一样
在线办理(ANU毕业证书)澳洲国立大学毕业证录取通知书一模一样
obonagu
 
block diagram and signal flow graph representation
block diagram and signal flow graph representationblock diagram and signal flow graph representation
block diagram and signal flow graph representation
Divya Somashekar
 
DESIGN A COTTON SEED SEPARATION MACHINE.docx
DESIGN A COTTON SEED SEPARATION MACHINE.docxDESIGN A COTTON SEED SEPARATION MACHINE.docx
DESIGN A COTTON SEED SEPARATION MACHINE.docx
FluxPrime1
 
addressing modes in computer architecture
addressing modes  in computer architectureaddressing modes  in computer architecture
addressing modes in computer architecture
ShahidSultan24
 
Sachpazis:Terzaghi Bearing Capacity Estimation in simple terms with Calculati...
Sachpazis:Terzaghi Bearing Capacity Estimation in simple terms with Calculati...Sachpazis:Terzaghi Bearing Capacity Estimation in simple terms with Calculati...
Sachpazis:Terzaghi Bearing Capacity Estimation in simple terms with Calculati...
Dr.Costas Sachpazis
 
HYDROPOWER - Hydroelectric power generation
HYDROPOWER - Hydroelectric power generationHYDROPOWER - Hydroelectric power generation
HYDROPOWER - Hydroelectric power generation
Robbie Edward Sayers
 
road safety engineering r s e unit 3.pdf
road safety engineering  r s e unit 3.pdfroad safety engineering  r s e unit 3.pdf
road safety engineering r s e unit 3.pdf
VENKATESHvenky89705
 
TECHNICAL TRAINING MANUAL GENERAL FAMILIARIZATION COURSE
TECHNICAL TRAINING MANUAL   GENERAL FAMILIARIZATION COURSETECHNICAL TRAINING MANUAL   GENERAL FAMILIARIZATION COURSE
TECHNICAL TRAINING MANUAL GENERAL FAMILIARIZATION COURSE
DuvanRamosGarzon1
 
Planning Of Procurement o different goods and services
Planning Of Procurement o different goods and servicesPlanning Of Procurement o different goods and services
Planning Of Procurement o different goods and services
JoytuBarua2
 
Quality defects in TMT Bars, Possible causes and Potential Solutions.
Quality defects in TMT Bars, Possible causes and Potential Solutions.Quality defects in TMT Bars, Possible causes and Potential Solutions.
Quality defects in TMT Bars, Possible causes and Potential Solutions.
PrashantGoswami42
 
Standard Reomte Control Interface - Neometrix
Standard Reomte Control Interface - NeometrixStandard Reomte Control Interface - Neometrix
Standard Reomte Control Interface - Neometrix
Neometrix_Engineering_Pvt_Ltd
 

Recently uploaded (20)

NO1 Uk best vashikaran specialist in delhi vashikaran baba near me online vas...
NO1 Uk best vashikaran specialist in delhi vashikaran baba near me online vas...NO1 Uk best vashikaran specialist in delhi vashikaran baba near me online vas...
NO1 Uk best vashikaran specialist in delhi vashikaran baba near me online vas...
 
ethical hacking-mobile hacking methods.ppt
ethical hacking-mobile hacking methods.pptethical hacking-mobile hacking methods.ppt
ethical hacking-mobile hacking methods.ppt
 
weather web application report.pdf
weather web application report.pdfweather web application report.pdf
weather web application report.pdf
 
Student information management system project report ii.pdf
Student information management system project report ii.pdfStudent information management system project report ii.pdf
Student information management system project report ii.pdf
 
Railway Signalling Principles Edition 3.pdf
Railway Signalling Principles Edition 3.pdfRailway Signalling Principles Edition 3.pdf
Railway Signalling Principles Edition 3.pdf
 
Architectural Portfolio Sean Lockwood
Architectural Portfolio Sean LockwoodArchitectural Portfolio Sean Lockwood
Architectural Portfolio Sean Lockwood
 
Gen AI Study Jams _ For the GDSC Leads in India.pdf
Gen AI Study Jams _ For the GDSC Leads in India.pdfGen AI Study Jams _ For the GDSC Leads in India.pdf
Gen AI Study Jams _ For the GDSC Leads in India.pdf
 
Cosmetic shop management system project report.pdf
Cosmetic shop management system project report.pdfCosmetic shop management system project report.pdf
Cosmetic shop management system project report.pdf
 
Immunizing Image Classifiers Against Localized Adversary Attacks
Immunizing Image Classifiers Against Localized Adversary AttacksImmunizing Image Classifiers Against Localized Adversary Attacks
Immunizing Image Classifiers Against Localized Adversary Attacks
 
在线办理(ANU毕业证书)澳洲国立大学毕业证录取通知书一模一样
在线办理(ANU毕业证书)澳洲国立大学毕业证录取通知书一模一样在线办理(ANU毕业证书)澳洲国立大学毕业证录取通知书一模一样
在线办理(ANU毕业证书)澳洲国立大学毕业证录取通知书一模一样
 
block diagram and signal flow graph representation
block diagram and signal flow graph representationblock diagram and signal flow graph representation
block diagram and signal flow graph representation
 
DESIGN A COTTON SEED SEPARATION MACHINE.docx
DESIGN A COTTON SEED SEPARATION MACHINE.docxDESIGN A COTTON SEED SEPARATION MACHINE.docx
DESIGN A COTTON SEED SEPARATION MACHINE.docx
 
addressing modes in computer architecture
addressing modes  in computer architectureaddressing modes  in computer architecture
addressing modes in computer architecture
 
Sachpazis:Terzaghi Bearing Capacity Estimation in simple terms with Calculati...
Sachpazis:Terzaghi Bearing Capacity Estimation in simple terms with Calculati...Sachpazis:Terzaghi Bearing Capacity Estimation in simple terms with Calculati...
Sachpazis:Terzaghi Bearing Capacity Estimation in simple terms with Calculati...
 
HYDROPOWER - Hydroelectric power generation
HYDROPOWER - Hydroelectric power generationHYDROPOWER - Hydroelectric power generation
HYDROPOWER - Hydroelectric power generation
 
road safety engineering r s e unit 3.pdf
road safety engineering  r s e unit 3.pdfroad safety engineering  r s e unit 3.pdf
road safety engineering r s e unit 3.pdf
 
TECHNICAL TRAINING MANUAL GENERAL FAMILIARIZATION COURSE
TECHNICAL TRAINING MANUAL   GENERAL FAMILIARIZATION COURSETECHNICAL TRAINING MANUAL   GENERAL FAMILIARIZATION COURSE
TECHNICAL TRAINING MANUAL GENERAL FAMILIARIZATION COURSE
 
Planning Of Procurement o different goods and services
Planning Of Procurement o different goods and servicesPlanning Of Procurement o different goods and services
Planning Of Procurement o different goods and services
 
Quality defects in TMT Bars, Possible causes and Potential Solutions.
Quality defects in TMT Bars, Possible causes and Potential Solutions.Quality defects in TMT Bars, Possible causes and Potential Solutions.
Quality defects in TMT Bars, Possible causes and Potential Solutions.
 
Standard Reomte Control Interface - Neometrix
Standard Reomte Control Interface - NeometrixStandard Reomte Control Interface - Neometrix
Standard Reomte Control Interface - Neometrix
 

Week2_Notes.pdf

  • 1. Infrared Spectroscopy • Atoms in a molecule do not maintain fixed positions - they vibrate back and forth. • The bond length is an average value. • A diatomic molecule, e.g. H-Cl can only undergo a STRETCHING vibration. • More complex molecules exhibit both STRETCHING and BENDING vibrations. • Vibrational motion is excited within a single electronic state by infrared light. Vibrations of bonds involving HYDROGEN are very significant as atoms of low mass move a lot more in comparison to atoms of higher mass.
  • 2. Simple Harmonic Oscillator re m1 m2 Hooke’s Law The force to compress or extend a spring is: F(r) = – k (r - re) Force Constant Actual length Equilibrium length Strong spring - large force constant Weak spring - small force constant Units of force constant are: N m-1 Treat a diatomic molecule as two masses joined by a spring
  • 3. Diatomic molecule force constants Strong bonds have large force constants. Molecule k/N m-1 Eb/kJ mol-1 H2 509 436 HCl 478 431 Cl2 320 242 N2 2241 945 Single bonds triple bond Eb = bond dissociation energy. Potential energy in the spring, V(r) V(r) = k (r – re)2 1 2
  • 4. Vibrational frequency, n The vibrational frequency is given by: SI Units • Hz (or s-1) for n • N m-1 for k • kg (per molecule) for µ We frequently use masses in g mol-1 (e.g. H=1, C=12, O=16 …)  = m1 m2 m1 + m2 u kg Where u is the unified mass constant u = 1.66  10-27 kg n = 1 2 k  Hz  = m1 m2 m1 + m2 µ is the reduced mass kg
  • 5. Vibrational frequency - wavenumbers, cm-1 cm-1 n = 1 200c k  The vibrational frequency in cm-1 is given by: The frequency is: 1. directly proportional to the force constant 2. inversely proportional to the reduced mass Molecule k/N m-1 µ/kg n/cm-1 H2 509 8.3110-28 4159 HCl 478 1.6210-27 2890 Cl2 320 2.9110-26 557 N2 2241 1.1610-26 2331 The SI unit of wavenumber is m-1. But cm-1 is more common. n/m n/cm 100 n = 1/l and c = lnso n = n / c
  • 6. Example Suppose that the C=O group in a peptide bond can be regarded as isolated from the rest of the molecule. Given that the force constant of the bond in a carbonyl group is 908 N m-1, calculate the vibrational frequency of (a) 12C=16O and (b) 13C=16O.
  • 7. Energy levels Classically the harmonic oscillator can have any energy. Quantum mechanically it only has discrete equally spaced energy levels given by: v = 0, 1, 2, 3… Ev = (v + ) hn 1 2 Selection rule Absorption of light only occurs for ∆v = ± 1 This means that each transition has the same energy change.
  • 8. Interaction with light 1. Light has an oscillating electric field. 2. The molecule must also possess an oscillating electric field (at the same frequency). 3. Photon energy must equal the difference between energy levels. 1. Heteronuclear diatomics have a dipole due to the uneven electron distribution around each atom. 2. The dipole is the product of the charge  distance apart. 3. Bond vibrations change the distance and hence the dipole oscillates. This creates an oscillating electric field. d+ d- d+ d- d+ d- d+ d- d+ d- max min Oscillating dipole
  • 9. 1. Homonuclear diatomics (H2, N2, Cl2 etc.) do not have a dipole and cannot absorb light in the IR to excite bond vibrations. (The vibrational motion of homonuclear diatomics can be probed using RAMAN spectroscopy). 2. In many molecules, some vibrations are IR inactive, some are IR active. The requirement is a net oscillating dipole, e.g. CO2 Infrared inactive d+ d- d- d+ d- d- Dipoles cancel Dipoles cancel CO2 symmetric stretch inactive d+ d- d- d+ d- d- Dipoles cancel Dipoles DO NOT cancel CO2 asymmetric stretch active
  • 10. Characteristic Vibrations of H2O - all IR active symmetric stretch asymmetric stretch n1 = 3657 cm-1 n2 = 1595 cm-1 n3 = 3756 cm-1 bend
  • 11. Number of vibrational modes Linear molecule with n atoms - number modes = 3n–5 e.g. CO2 n = 3 so number vib modes = 33–5 = 4 Non-linear molecule with n atoms - number modes = 3n–6 e.g. CH4 n = 5 so number vib modes = 35–6 = 9 The number of vibrational modes increases very rapidly with n, PLUS many of these vibrations may occur at the same frequency and so not all of the possible bands are seen as independent absorptions. IR spectra are complex Fullerene C60 174 vib modes
  • 12. Number of vibrational modes Linear molecule with n atoms - number modes = 3n–5 e.g. CO2 n = 3 so number vib modes = 33–5 = 4 Non-linear molecule with n atoms - number modes = 3n–6 e.g. CH4 n = 5 so number vib modes = 35–6 = 9 The number of vibrational modes increases very rapidly with n, PLUS many of these vibrations may occur at the same frequency and so not all of the possible bands are seen as independent absorptions. IR spectra are complex Fullerene C60 174 vib modes
  • 13. Stretching and bending vibrations in organic molecules Stretching vibrations can be: (i) symmetric (ii) asymetric Infrared INACTIVE vibrations • Not all vibrations result in absorption bands. • For a vibration to cause IR absorption the dipole moment of the molecule must change when the vibration occurs. Bending vibrations can be: (i) scissoring (in-plane) (ii) rocking (in-plane) (iii) wagging (out-of-plane) (iv) twisting out of plane
  • 14. • Each stretching and bending vibration of a bond is associated with radiation whose frequency exactly matches the frequency of the vibration of the bond. • Different functional groups, e.g. C–C, C=C, C=O, N–H … will have different characteristic frequencies • Therefore, by determining the frequencies of light (IR) that are absorbed by a particular compound we can determine what kind of bonds it has. IR spectra of Organic/Biological molecules This is not as easy as it sounds
  • 15. IR spectra of Organic molecules Gas Phase Infrared Spectrum of Formaldehyde, H2C=O IR spectra are often shown as % Transmittance vs Wavenumber. So, ZERO absorption is 100% transmittance. An absorption band appears as a trough in the spectrum. i.e. the spectrum looks ‘upside down’. The spectra of simple molecules can often be fully assigned Wavenumber / cm-1 3n–6 = 34–6 = 6 6 vibrational modes
  • 16. % Transmittance Wavenumber IR spectra of Organic molecules IR spectrum of 1-propanol OH stretch CH2 bending CH3 stretch Backbone stretches C-C stretch 1. The liquid/solid state usually produces broader lines. 2. The spectra of larger molecules are very complicated and it is often not possible to assign all the peaks involved. 312–6 = 30 30 vibrational modes
  • 17. Lactic Acid OH stretches CH3 stretches carboxyl stretches Backbone stretches Fingerprint Region The fingerprint region is an area of complex overlaps where it is impossible to assign all (any?) of the bands. It can act as a unique ‘fingerprint’ for a given molecule. Functional group Region
  • 18. Spectral regions in the infrared Middle IR spectrum can also be roughly divided into: 1. FUNCTIONAL GROUP REGION,  = 4000 - 1200 cm-1 2. FINGERPRINT REGION,  = 1200 - 400 cm-1 • It takes more energy to stretch a bond than bend it • Therefore stretching bands are found in the 4000-1200 cm-1 (functional group region) • Bends are typically observed in the fingerprint region
  • 19. Functional group frequencies There are extensive tables and charts available to aid in identifying IR spectral features. It’s as much an art as a science!
  • 21. Amide I Amide II Applications of IR to Protein structure Amide bond of peptides has many vibrational modes (at least 10 IR bands) these bands are designated amide I, amide II, etc. The frequency of Amide I depends upon the environment of the bond and as such can be used to learn about the protein structure. O C N H Amide I Amide II Protein Amide I: 1690-1600 Protein Amide II: 1575-1480
  • 22. Amide Band Assignments Amide A is 95% due to the the N-H stretching vibration. It is very sensitive to the strength of the hydrogen bond. Amide I is primarily governed by the stretching vibrations of the C=O (70-85%) and C-N groups (10-20%). Amide II derives mainly from in-plane N-H bending (40-60%). The rest arises from the C-N (18-40%) and the C-C (about 10%) stretching vibrations. Amide III, V are very complex bands dependent nature of side chains and hydrogen bonding - only of limited use for the extraction of structural information.
  • 23. Its frequency depends upon whether the peptide bond is in the -helix, -sheet, or random configuration Wavenumber /cm-1 -helix 1650 -sheet 1632, 1685 random coil 1658 Each band is well resolved so if protein contains all three configurations 4 bands will be seen. Amide I band