FULL ENJOY - 9953040155 Call Girls in Chhatarpur | Delhi
Week 09_Handout benchmark data
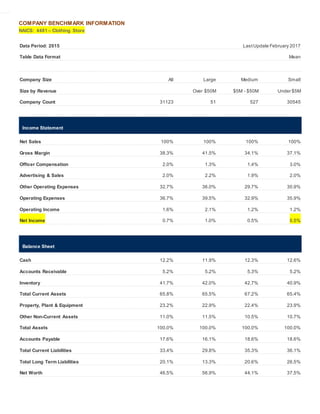
1. COMPANY BENCHMARK INFORMATION
NAICS: 4481 – Clothing Store
Data Period: 2015 LastUpdate February 2017
Table Data Format Mean
Company Size All Large Medium Small
Size by Revenue Over $50M $5M - $50M Under $5M
Company Count 31123 51 527 30545
Income Statement
Net Sales 100% 100% 100% 100%
Gross Margin 38.3% 41.5% 34.1% 37.1%
Officer Compensation 2.0% 1.3% 1.4% 3.0%
Advertising & Sales 2.0% 2.2% 1.9% 2.0%
Other Operating Expenses 32.7% 36.0% 29.7% 30.9%
Operating Expenses 36.7% 39.5% 32.9% 35.9%
Operating Income 1.6% 2.1% 1.2% 1.2%
Net Income 0.7% 1.0% 0.5% 0.5%
Balance Sheet
Cash 12.2% 11.9% 12.3% 12.6%
Accounts Receivable 5.2% 5.2% 5.3% 5.2%
Inventory 41.7% 42.0% 42.7% 40.9%
Total Current Assets 65.8% 65.5% 67.2% 65.4%
Property, Plant & Equipment 23.2% 22.9% 22.4% 23.9%
Other Non-Current Assets 11.0% 11.5% 10.5% 10.7%
Total Assets 100.0% 100.0% 100.0% 100.0%
Accounts Payable 17.6% 16.1% 18.6% 18.6%
Total Current Liabilities 33.4% 29.8% 35.3% 36.1%
Total Long Term Liabilities 20.1% 13.3% 20.6% 26.5%
Net Worth 46.5% 56.9% 44.1% 37.5%
2. Financial Ratios
(Click on any ratio for comprehensive definitions)
Quick Ratio 0.56 0.61 0.53 0.53
Current Ratio 1.97 2.20 1.91 1.81
CurrentLiabilities to NetWorth 71.9% 52.4% 79.9% 96.3%
Current Liabilities to Inventory x0.80 x0.71 x0.83 x0.88
Total Debt to Net Worth x1.15 x0.76 x1.27 x1.67
Fixed Assets to Net Worth x0.50 x0.40 x0.51 x0.64
Days Accounts Receivable 8 8 9 8
Inventory Turnover x3.36 x3.24 x3.42 x3.46
Total Assets to Sales 44.9% 44.0% 45.9% 45.2%
Working Capital to Sales 14.5% 15.7% 14.6% 13.2%
Accounts Payable to Sales 7.9% 7.0% 8.5% 8.4%
Pre-Tax Return on Sales 1.1% 1.6% 0.8% 0.8%
Pre-Tax Return on Assets 2.5% 3.6% 1.6% 1.7%
Pre-Tax Return on Net Worth 5.3% 6.3% 3.7% 4.6%
InterestCoverage x3.34 x4.20 x2.68 x2.67
EBITDA to Sales 3.6% 4.2% 3.3% 3.2%
Capital Expenditures to Sales 2.4% 2.6% 2.3% 2.2%
3. COMPANY BENCHMARK INFORMATION
NAICS: 722320 - Catering
Data Period: 2015 LastUpdate February 2017
Table Data Format Mean
Company Size All Large Medium Small
Size by Revenue Over $50M $5M - $50M Under $5M
Company Count 5211 7 85 5119
Income Statement
Net Sales 100% 100% 100% 100%
Gross Margin 100.0% 100.0% 100.0% 100.0%
Officer Compensation 4.2% 3.5% 3.6% 4.9%
Advertising & Sales 4.4% 4.5% 4.7% 4.2%
Other Operating Expenses 87.2% 88.3% 88.0% 86.4%
Operating Expenses 95.9% 96.3% 96.2% 95.5%
Operating Income 4.1% 3.7% 3.8% 4.5%
Net Income 2.1% 1.9% 1.9% 2.2%
Balance Sheet
Cash 22.2% 21.1% 18.0% 24.6%
Accounts Receivable 12.5% 13.2% 13.7% 11.6%
Inventory 6.3% 7.6% 6.6% 5.6%
Total Current Assets 45.0% 45.6% 44.1% 45.1%
Property, Plant & Equipment 37.2% 32.9% 35.8% 39.7%
Other Non-Current Assets 17.9% 21.6% 20.1% 15.2%
Total Assets 100.0% 100.0% 100.0% 100.0%
Accounts Payable 6.6% 7.1% 8.3% 5.7%
Total Current Liabilities 27.6% 28.8% 29.8% 26.0%
Total Long Term Liabilities 26.1% 26.2% 24.6% 26.8%
Net Worth 46.3% 45.0% 45.6% 47.2%
4. Financial Ratios
(Click on any ratio for comprehensive definitions)
Quick Ratio 1.28 1.21 1.13 1.40
Current Ratio 1.63 1.58 1.48 1.74
CurrentLiabilities to NetWorth 59.5% 64.0% 65.4% 55.0%
Current Liabilities to Inventory x4.38 x3.81 x4.54 x4.62
Total Debt to Net Worth x1.16 x1.22 x1.19 x1.12
Fixed Assets to Net Worth x0.80 x0.73 x0.79 x0.84
Days Accounts Receivable 20 20 21 19
Inventory Turnover x0.00 x0.01 x0.00 x0.00
Total Assets to Sales 44.9% 43.2% 43.7% 46.2%
Working Capital to Sales 7.8% 7.3% 6.2% 8.8%
Accounts Payable to Sales 2.9% 2.9% 3.5% 2.6%
Pre-Tax Return on Sales 3.3% 3.1% 3.0% 3.6%
Pre-Tax Return on Assets 7.4% 7.2% 7.0% 7.8%
Pre-Tax Return on Net Worth 16.0% 16.0% 15.3% 16.5%
InterestCoverage x4.26 x4.75 x4.18 x4.16
EBITDA to Sales 10.0% 10.0% 9.8% 10.1%
Capital Expenditures to Sales 7.5% 7.8% 7.5% 7.3%
5. COMPANY BENCHMARK INFORMATION
NAICS: 33721- Office Furniture Mfg.
Data Period: 2015 LastUpdate February 2017
Table Data Format Mean
Company Size All Large Medium Small
Size by Revenue Over $50M $5M - $50M Under $5M
Company Count 2333 28 302 2003
Income Statement
Net Sales 100% 100% 100% 100%
Gross Margin 27.3% 27.0% 25.7% 30.7%
Officer Compensation 1.9% 1.4% 1.6% 3.0%
Advertising & Sales 1.1% 1.1% 1.0% 1.2%
Other Operating Expenses 23.0% 23.0% 21.8% 25.0%
Operating Expenses 26.0% 25.6% 24.4% 29.2%
Operating Income 1.4% 1.4% 1.2% 1.6%
Net Income 0.7% 0.7% 0.6% 0.8%
Balance Sheet
Cash 11.5% 10.7% 11.9% 11.9%
Accounts Receivable 24.2% 24.3% 23.6% 25.1%
Inventory 23.8% 23.0% 24.8% 23.1%
Total Current Assets 65.8% 64.0% 66.6% 66.8%
Property, Plant & Equipment 20.5% 21.7% 20.1% 19.4%
Other Non-Current Assets 13.8% 14.3% 13.3% 13.8%
Total Assets 100.0% 100.0% 100.0% 100.0%
Accounts Payable 14.7% 13.8% 15.0% 15.7%
Total Current Liabilities 28.8% 26.3% 29.9% 30.7%
Total Long Term Liabilities 25.9% 21.5% 26.5% 31.0%
Net Worth 45.3% 52.2% 43.7% 38.3%
6. Financial Ratios
(Click on any ratio for comprehensive definitions)
Quick Ratio 1.25 1.34 1.20 1.22
Current Ratio 2.28 2.43 2.23 2.18
CurrentLiabilities to NetWorth 63.7% 50.4% 68.3% 80.3%
Current Liabilities to Inventory x1.21 x1.14 x1.20 x1.33
Total Debt to Net Worth x1.21 x0.92 x1.29 x1.61
Fixed Assets to Net Worth x0.45 x0.42 x0.46 x0.51
Days Accounts Receivable 45 45 44 48
Inventory Turnover x5.94 x6.23 x5.86 x5.68
Total Assets to Sales 50.8% 50.3% 50.3% 52.2%
Working Capital to Sales 18.7% 19.0% 18.5% 18.9%
Accounts Payable to Sales 7.6% 7.0% 7.7% 8.3%
Pre-Tax Return on Sales 1.1% 1.2% 1.0% 1.2%
Pre-Tax Return on Assets 2.2% 2.4% 2.0% 2.4%
Pre-Tax Return on Net Worth 4.8% 4.6% 4.6% 6.2%
InterestCoverage x2.32 x2.44 x2.30 x2.33
EBITDA to Sales 3.1% 3.4% 2.8% 3.1%
Capital Expenditures to Sales 1.5% 1.8% 1.4% 1.2%
7. COMPANY BENCHMARK INFORMATION
NAICS: 337- Furniture Mfg.
Data Period: 2015 LastUpdate February 2017
Table Data Format Mean
Company Size All Large Medium Small
Size by Revenue Over $50M $5M - $50M Under $5M
Company Count 9329 73 714 8542
Income Statement
Net Sales 100% 100% 100% 100%
Gross Margin 27.4% 27.9% 27.3% 26.7%
Officer Compensation 1.9% 1.5% 1.9% 2.8%
Advertising & Sales 1.0% 1.1% 1.0% 1.0%
Other Operating Expenses 23.2% 24.1% 23.1% 21.7%
Operating Expenses 26.2% 26.7% 26.0% 25.5%
Operating Income 1.2% 1.3% 1.2% 1.2%
Net Income 0.6% 0.7% 0.6% 0.6%
Balance Sheet
Cash 11.3% 11.1% 11.5% 11.6%
Accounts Receivable 24.1% 24.0% 23.6% 24.8%
Inventory 24.6% 24.6% 25.0% 24.0%
Total Current Assets 66.1% 65.7% 66.2% 66.6%
Property, Plant & Equipment 19.4% 18.7% 20.3% 19.5%
Other Non-Current Assets 14.5% 15.5% 13.5% 13.9%
Total Assets 100.0% 100.0% 100.0% 100.0%
Accounts Payable 13.4% 12.2% 14.0% 14.8%
Total Current Liabilities 27.4% 25.3% 28.7% 29.6%
Total Long Term Liabilities 27.0% 23.6% 28.0% 32.2%
Net Worth 45.6% 51.1% 43.3% 38.2%
8. Financial Ratios
(Click on any ratio for comprehensive definitions)
Quick Ratio 1.30 1.39 1.23 1.24
Current Ratio 2.41 2.60 2.31 2.25
CurrentLiabilities to NetWorth 60.1% 49.6% 66.3% 77.5%
Current Liabilities to Inventory x1.11 x1.03 x1.15 x1.23
Total Debt to Net Worth x1.19 x0.96 x1.31 x1.62
Fixed Assets to Net Worth x0.43 x0.37 x0.47 x0.51
Days Accounts Receivable 42 43 41 43
Inventory Turnover x6.11 x5.93 x6.12 x6.45
Total Assets to Sales 48.3% 49.6% 47.4% 47.2%
Working Capital to Sales 18.7% 20.1% 17.8% 17.5%
Accounts Payable to Sales 6.5% 6.0% 6.6% 7.0%
Pre-Tax Return on Sales 1.0% 1.1% 1.0% 1.0%
Pre-Tax Return on Assets 2.1% 2.1% 2.1% 2.1%
Pre-Tax Return on Net Worth 4.6% 4.1% 4.8% 5.5%
InterestCoverage x1.95 x1.88 x2.02 x2.02
EBITDA to Sales 2.7% 2.9% 2.7% 2.6%
Capital Expenditures to Sales 1.6% 1.7% 1.6% 1.5%