This investor presentation summarizes Wayfair's business model and growth strategies. Some key points:
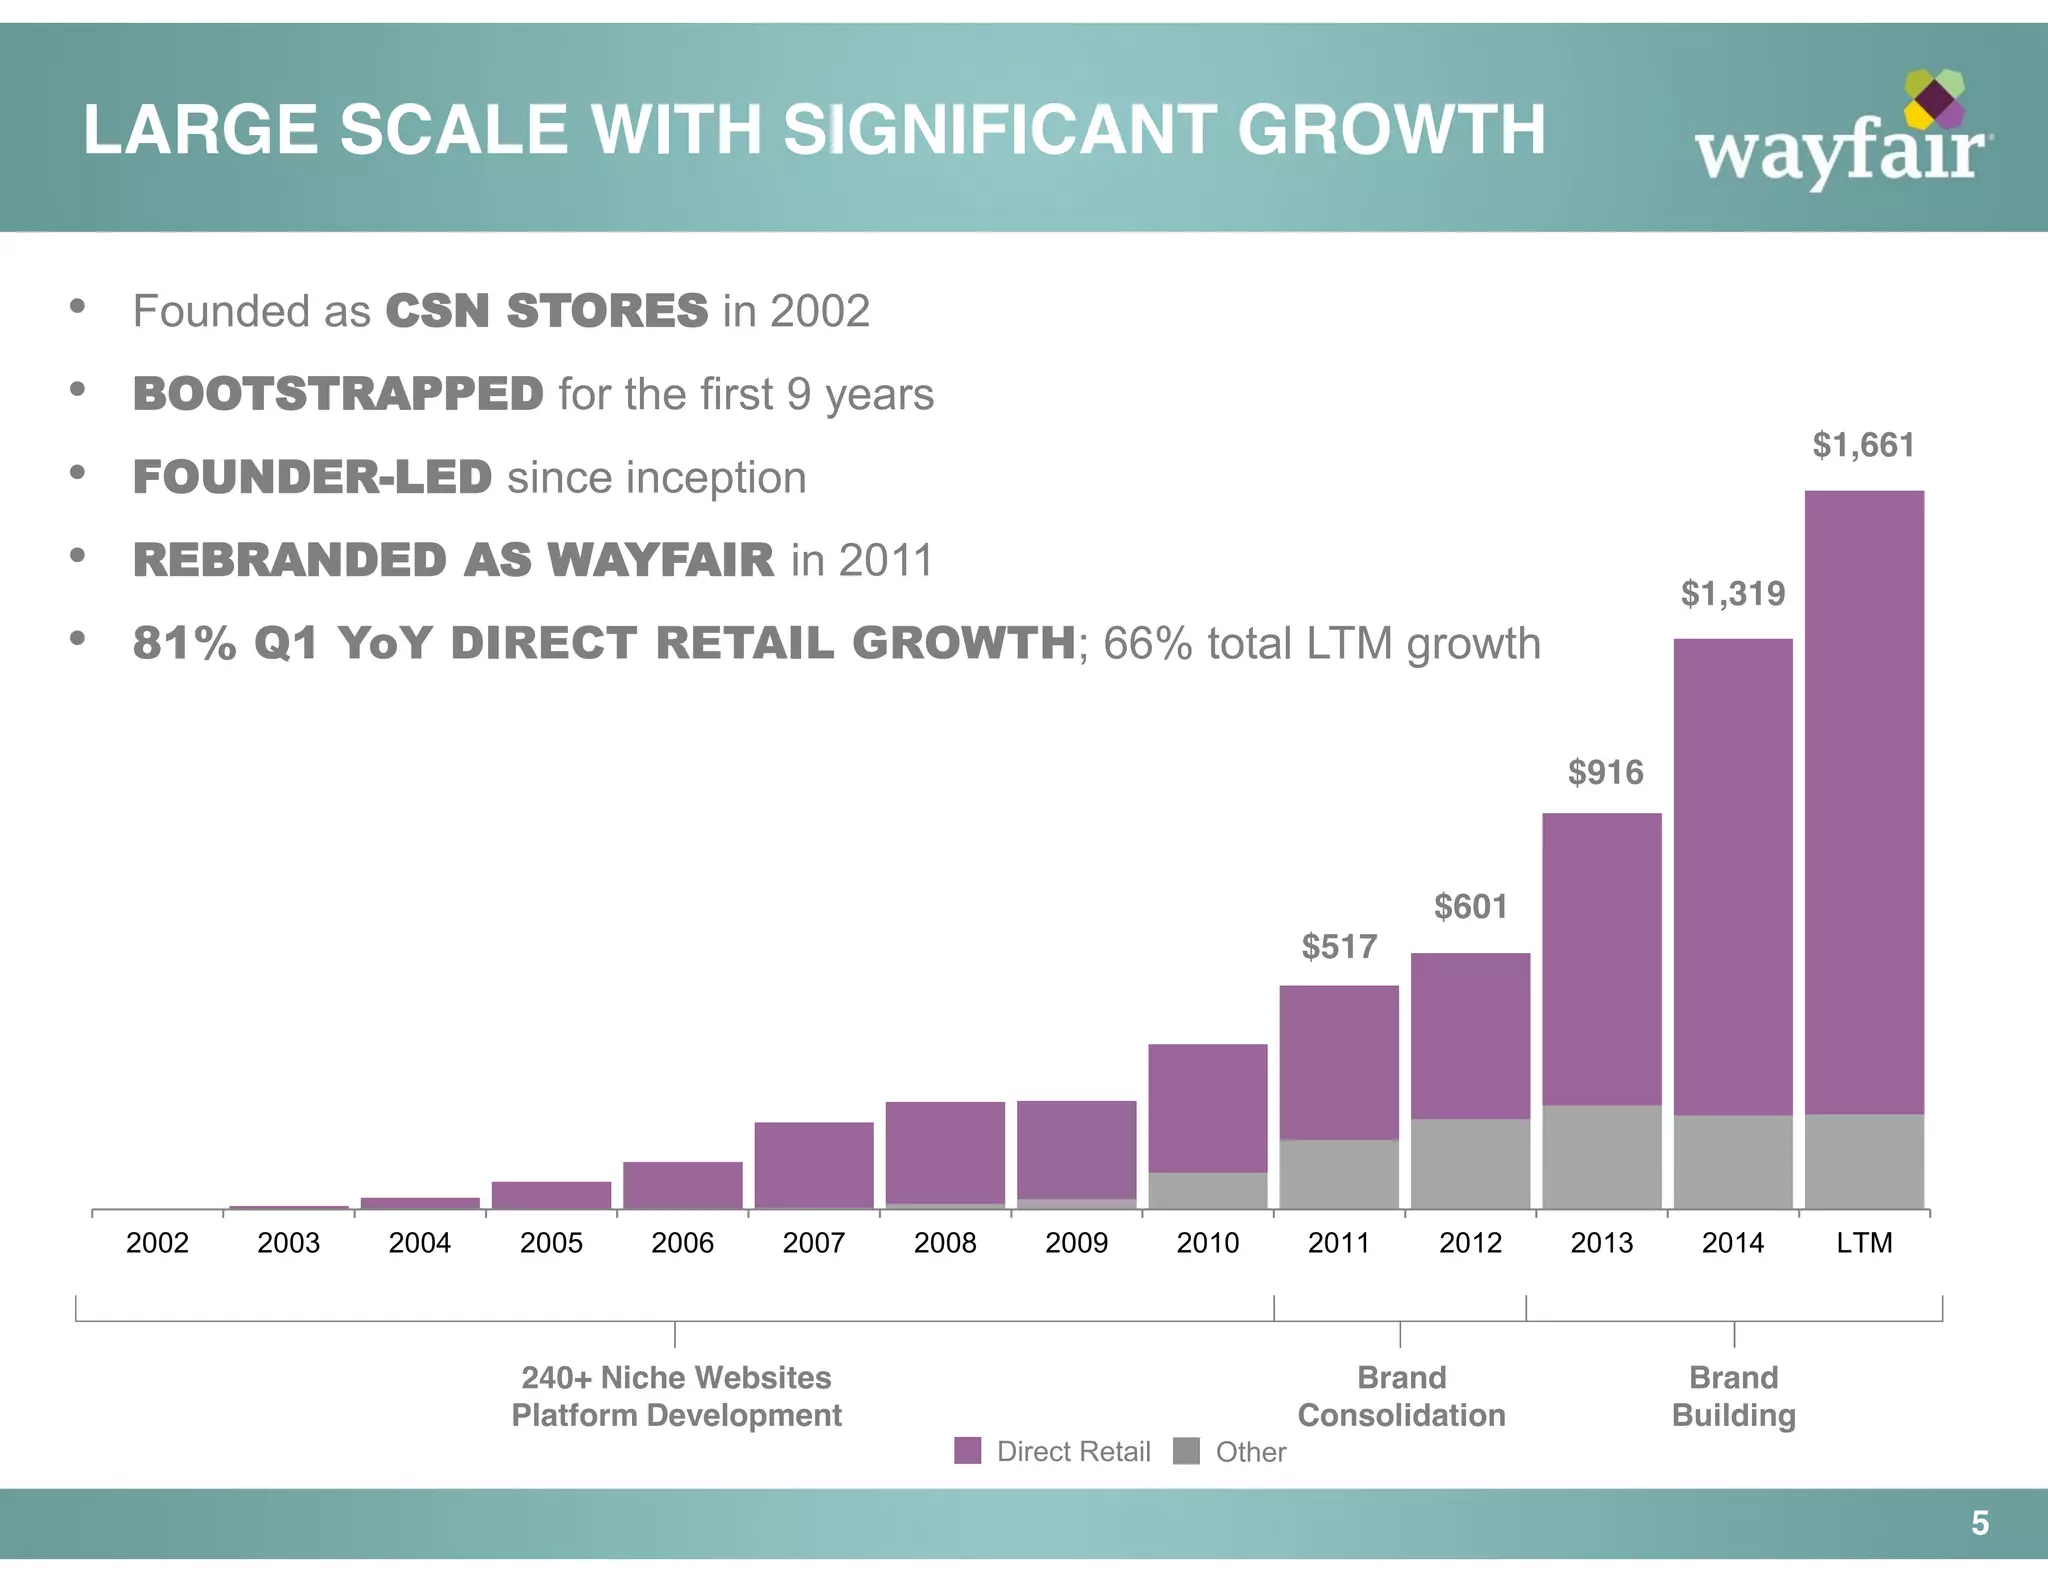
- Wayfair is an online retailer of home goods with over 7 million products and $1.6 billion in LTM net revenue. It operates multiple home brands.
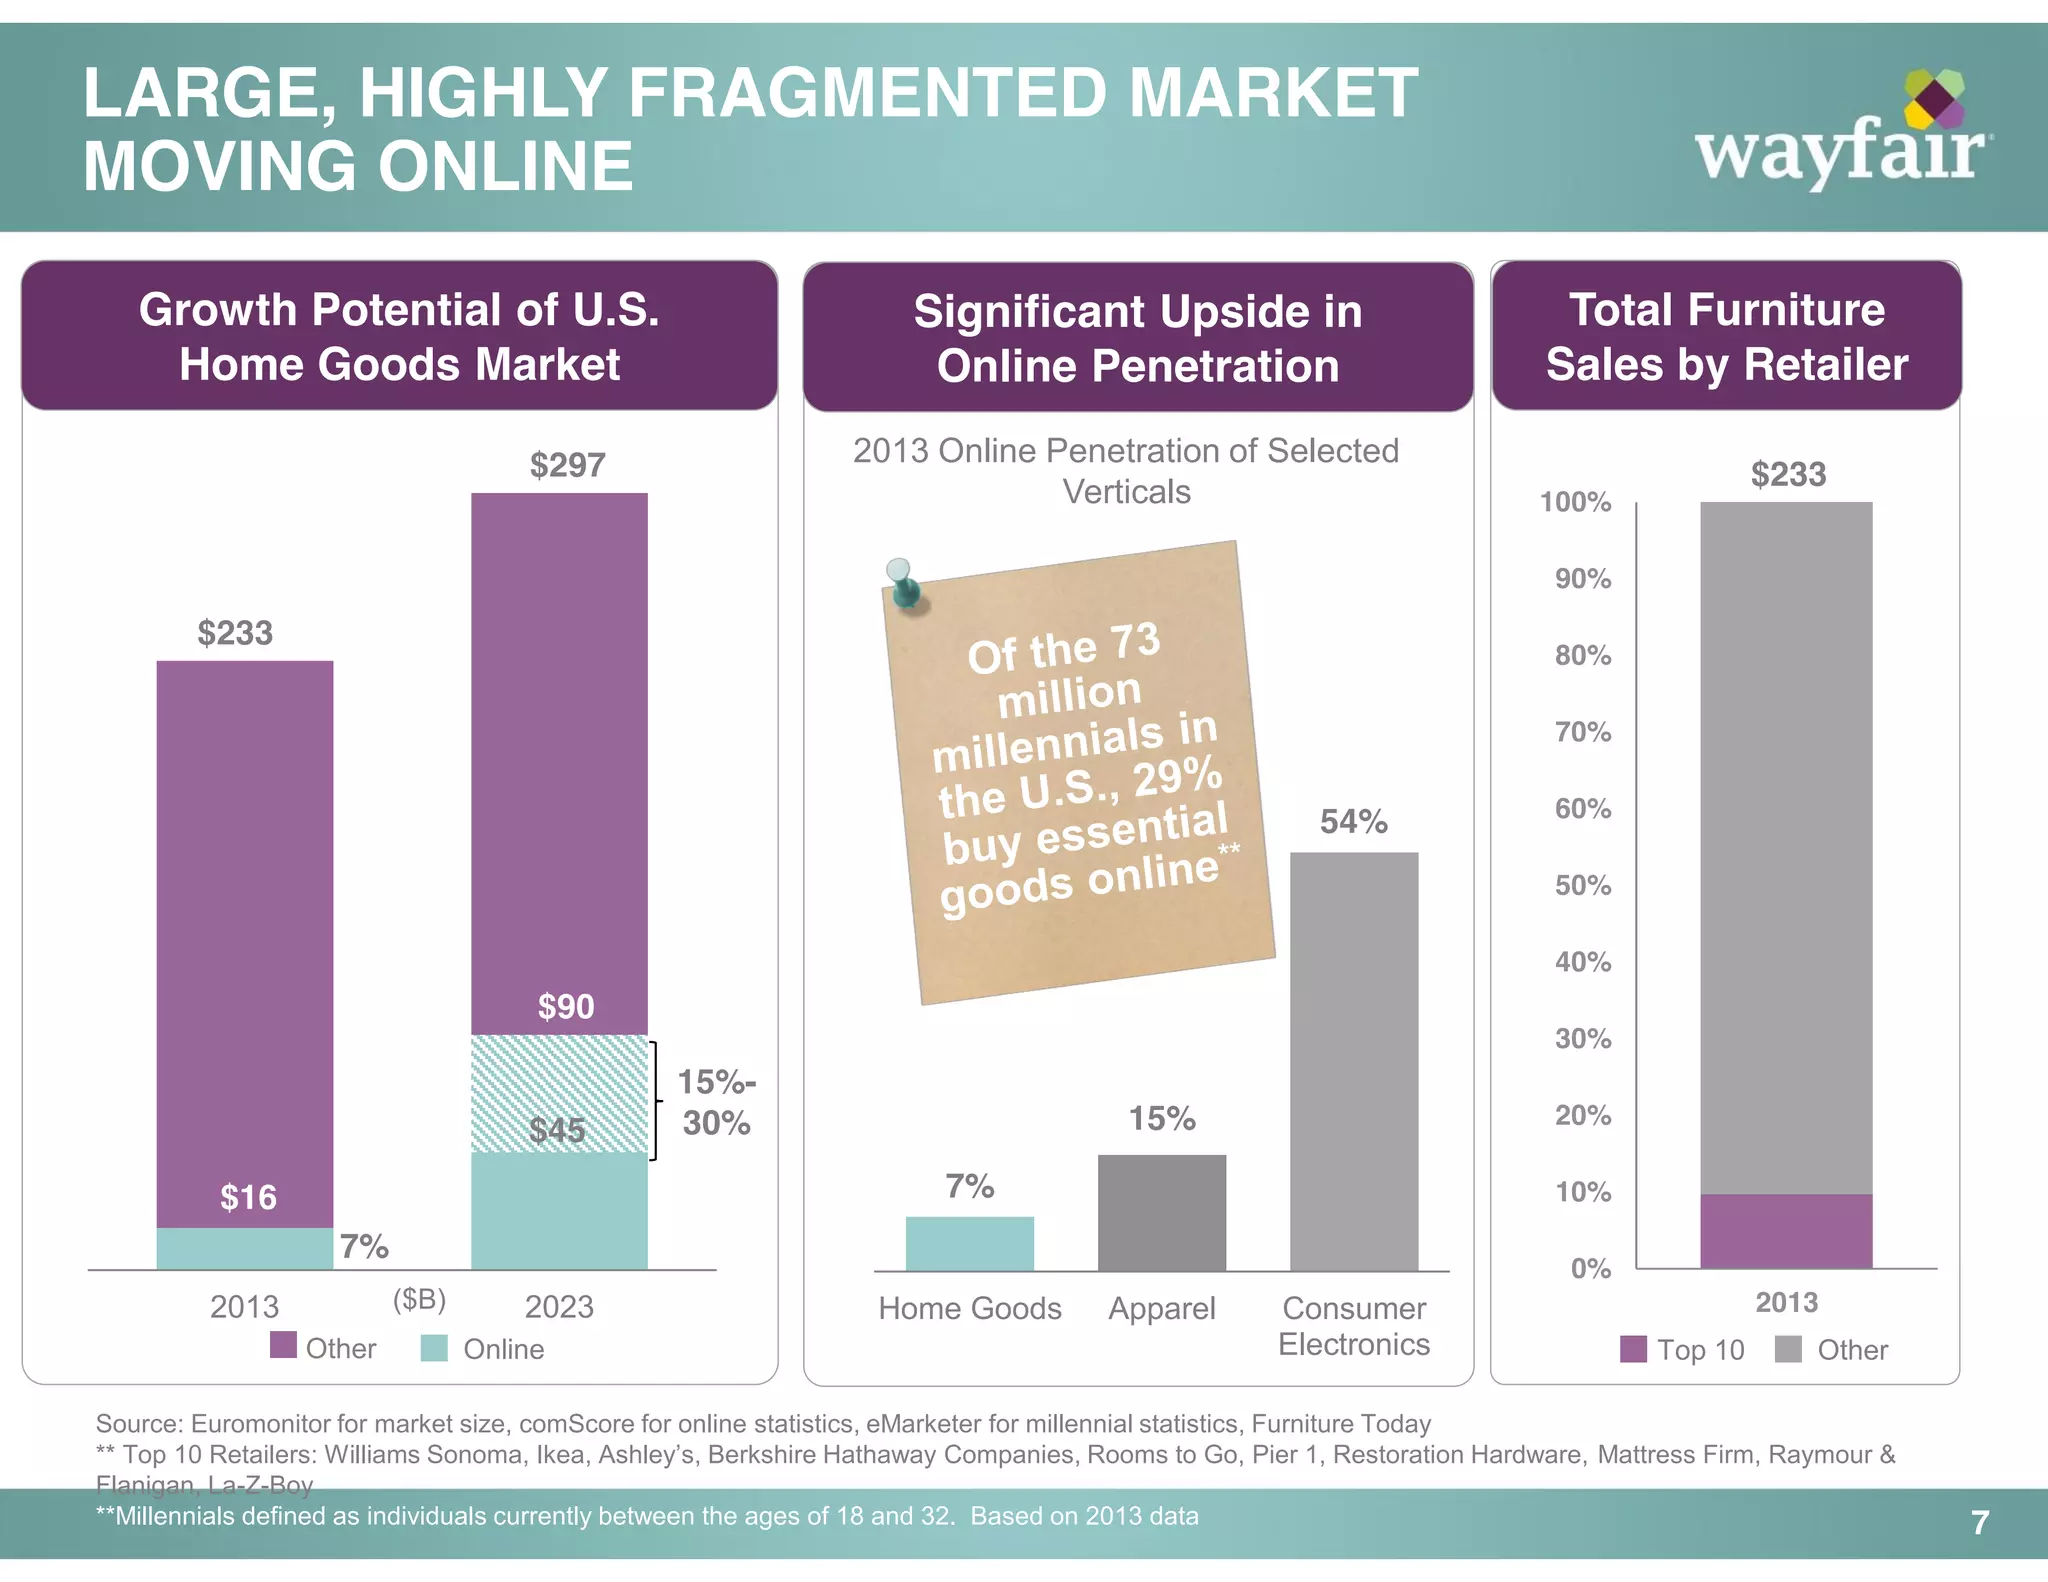
- The home goods market is large and highly fragmented, with significant potential for further online penetration. Wayfair is well positioned for this opportunity.
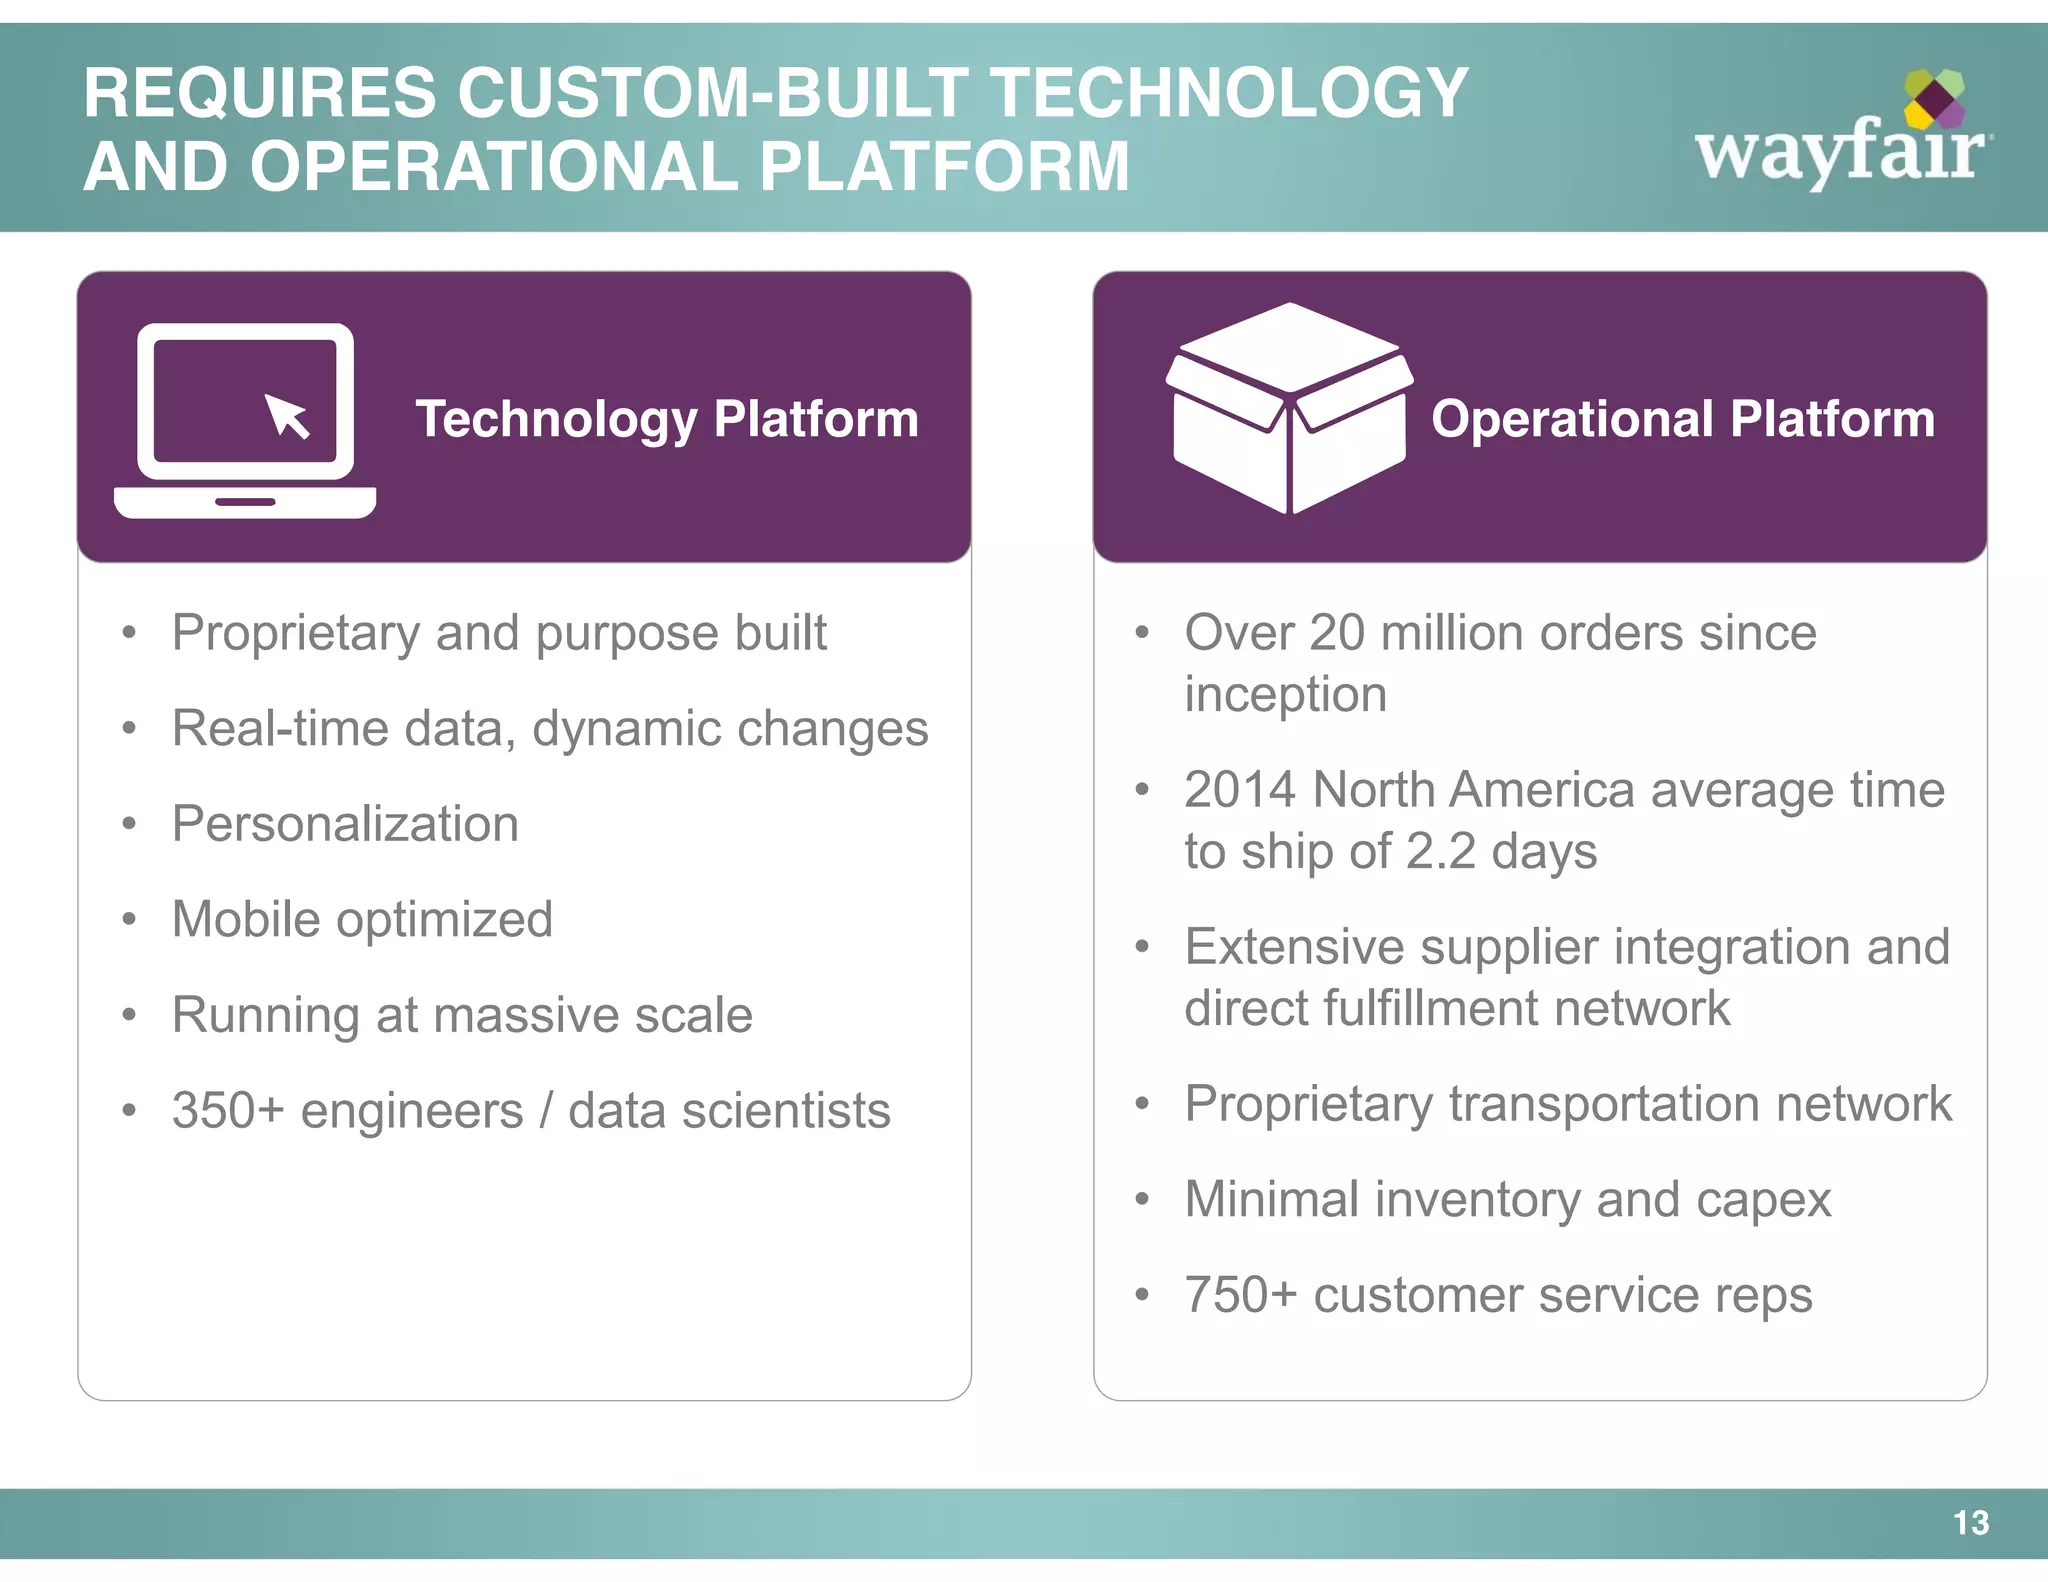
- Wayfair has achieved strong growth through technology-enabled direct fulfillment and a supplier network with minimal inventory.
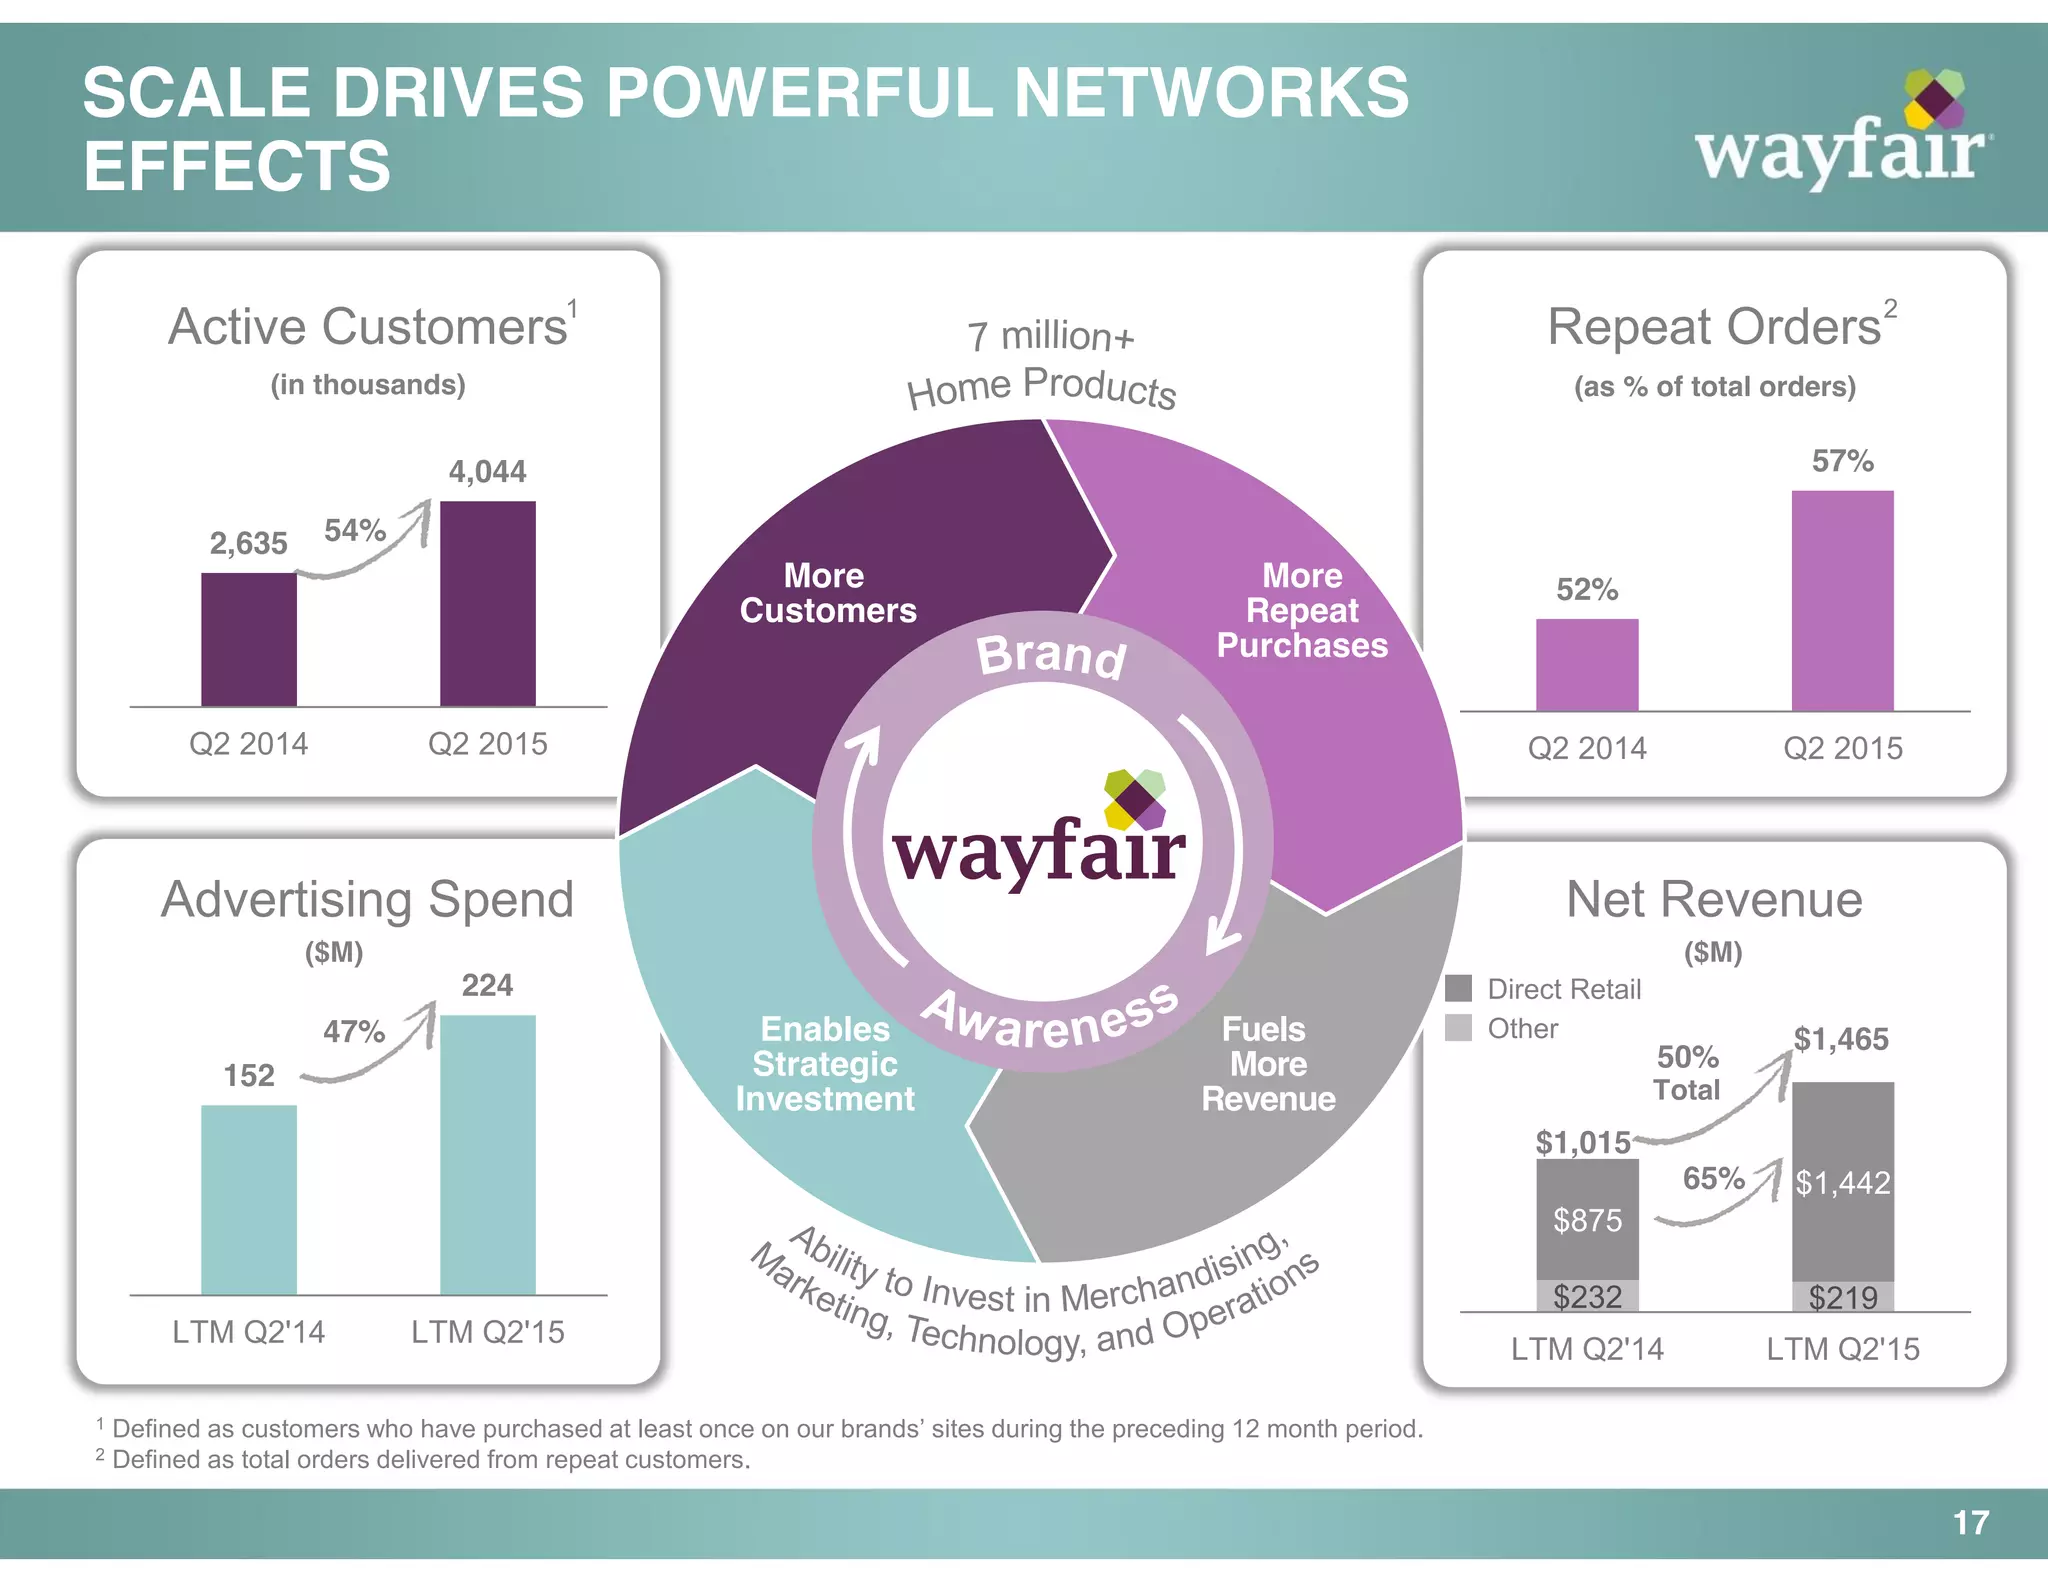
- Its scale allows for powerful network effects like increasing personalization, repeat purchases, and revenue per customer over time.
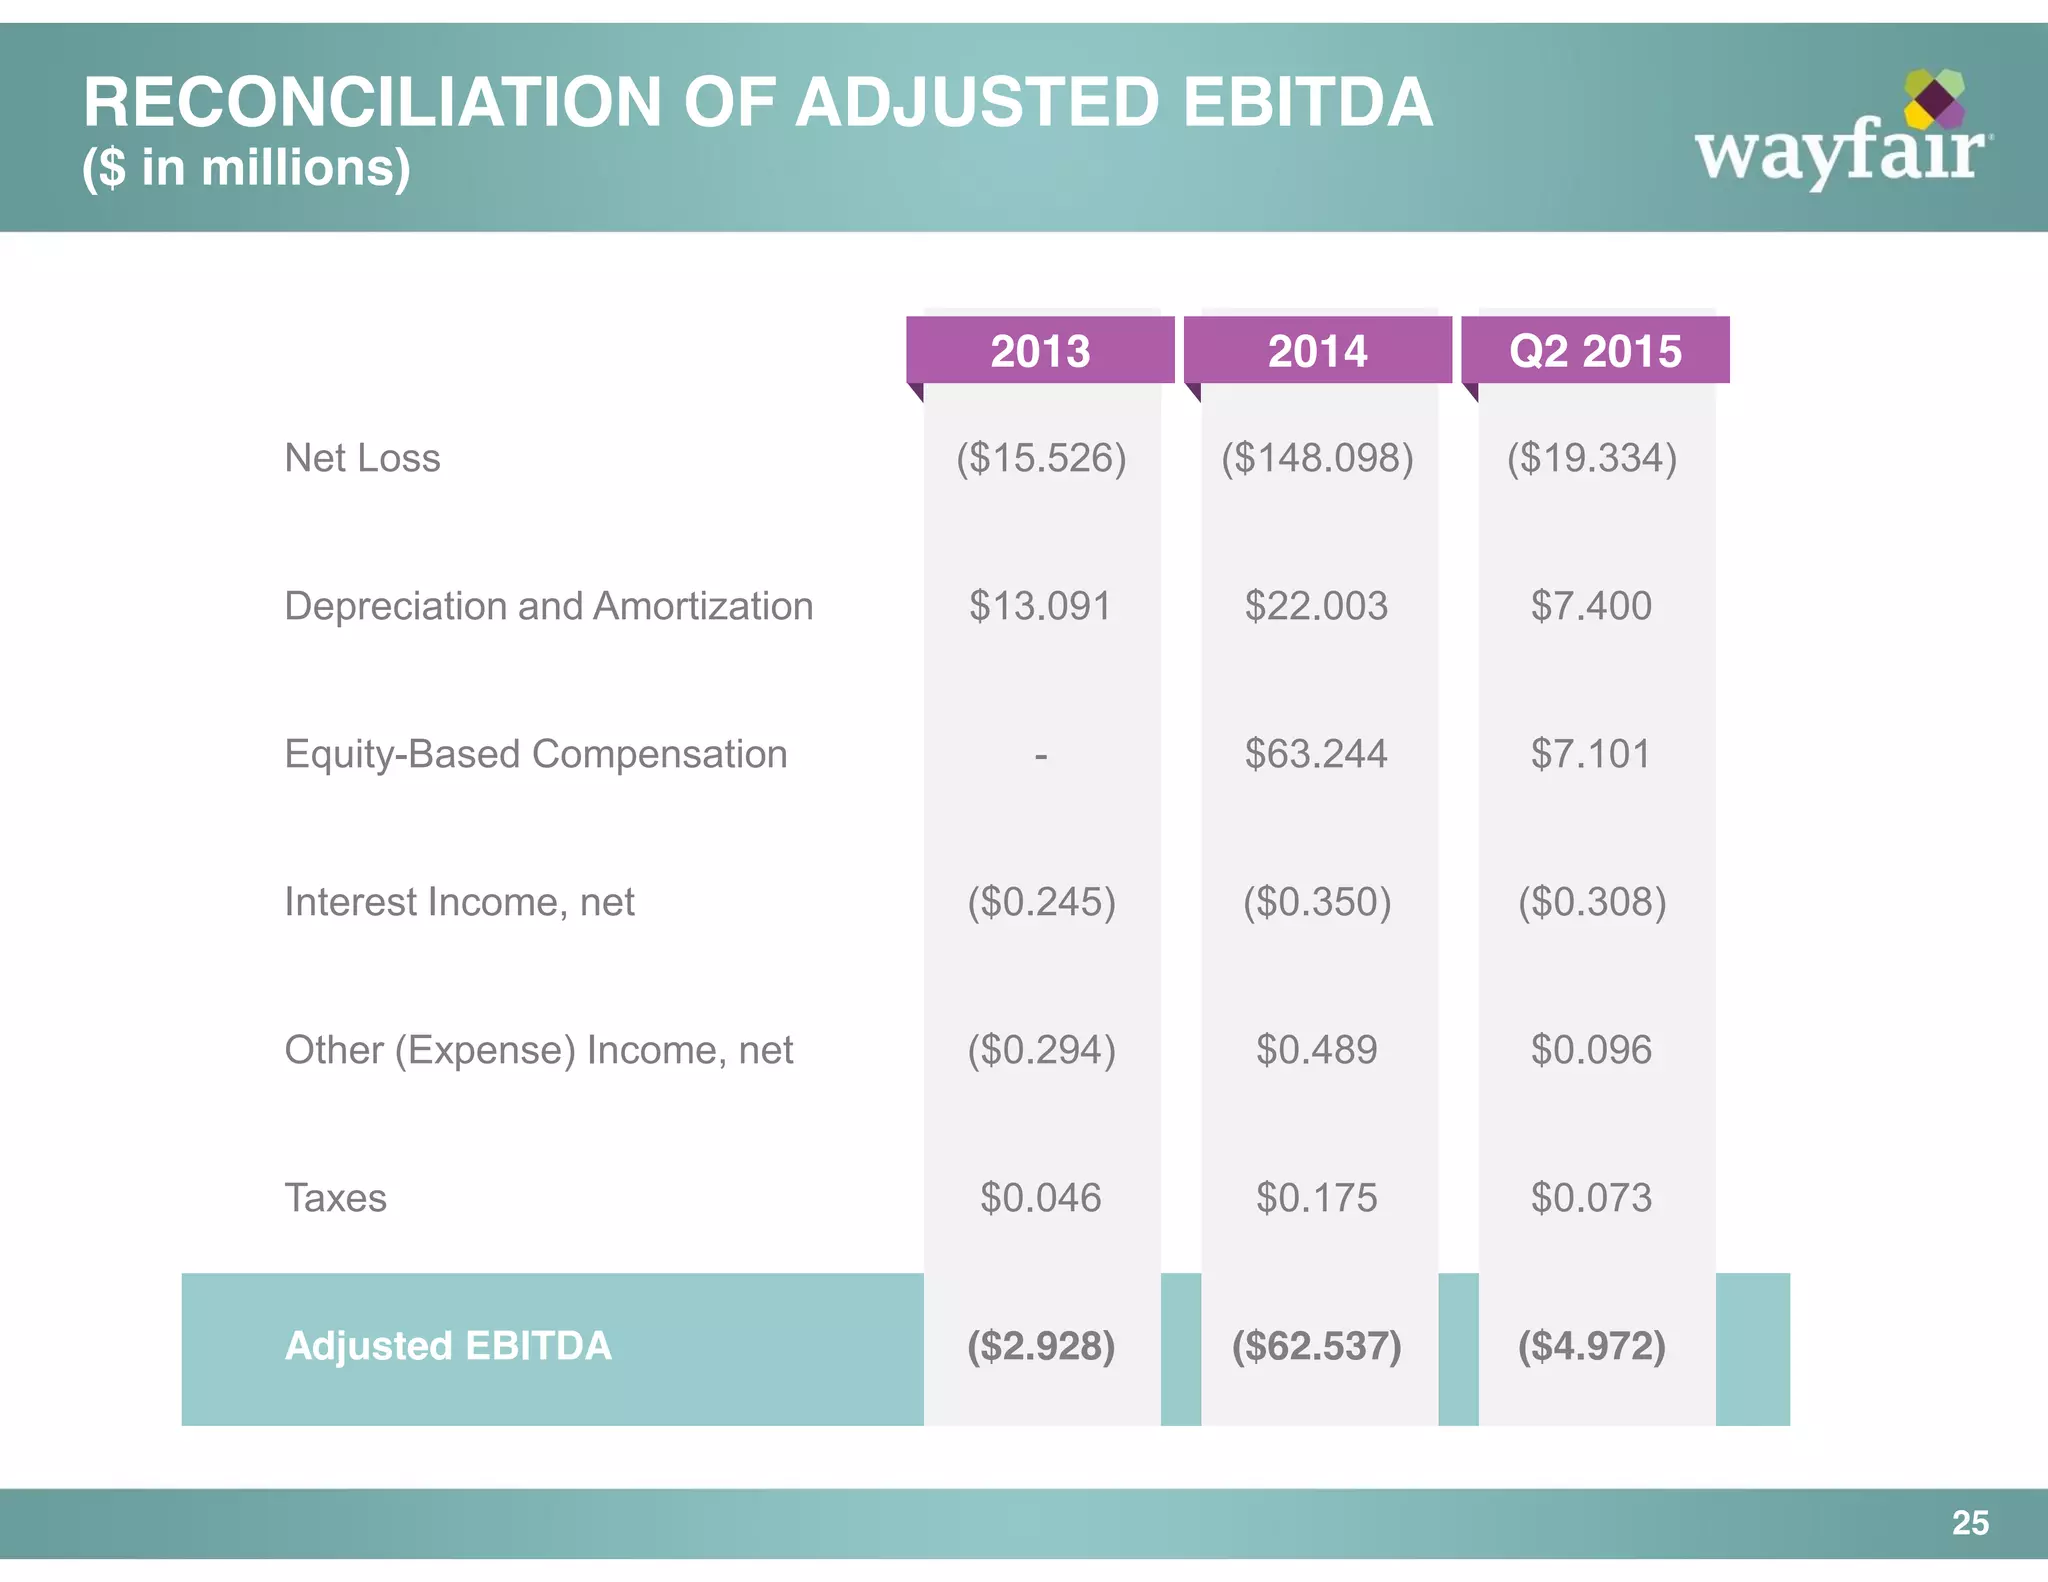
- Long term targets project continued revenue growth and improving profitability through increased efficiency