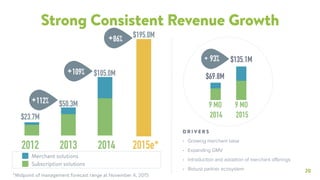
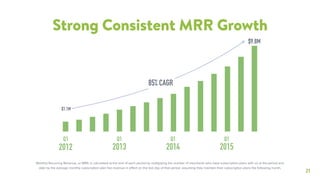
SlideShare a Scribd company logo
200,000+
ACTIVE SHOPIFY MERCHANTS
$1.9 BILLION+
GMV IN Q3 ā€˜15
2
Safe Harbour
This presentation contains forward-looking statements that are based on our managementā€™s current estimates, beliefs and assumptions, which are based on
managementā€™s perception of historic trends, current conditions and expected future developments, as well as other factors management believes are appropriate
in the circumstances. Although we believe that the plans, intentions, expectations, assumptions and strategies reļ¬‚ected in these forward-looking statements are
reasonable, these statements relate to future events or our future ļ¬nancial performance, and involve known and unknown risks, uncertainties and other factors
that may cause our actual results to be materially diļ¬€erent from any future results expressed or implied by these forward-looking statements. Although the
forward-looking statements contained in this presentation are based upon what we believe are reasonable assumptions, investors are cautioned against placing
undue reliance on these statements since actual results may vary from the forward-looking statements. Forward-looking statements involve known and unknown
risks, uncertainties and other factors, which are, in some cases, beyond our control and which could materially aļ¬€ect our results. These risks are described in
further detail in the section entitled ā€œRisk Factorsā€ and elsewhere in our ļ¬lings with regulatory agencies. If one or more of these risks or uncertainties occur, or if
our underlying assumptions prove to be incorrect, actual results may vary signiļ¬cantly from those implied or projected by the forward-looking statements.
References to long-term trends in our model are forward-looking and made as of the current date. Nothing in this presentation should be regarded as a
representation by any person that these long- term trends will be achieved and we undertake no duty to update its long-term trends.
We believe that the case studies presented in this presentation provide a representative sample of how our merchants have been able to use various features of
our platform to grow their respective businesses. References in this presentation to increased visits, growth and sales following implementation of our platform do
not necessarily mean that our platform was the only factor contributing to such increases.
To supplement the ļ¬nancial measures prepared in accordance with generally accepted accounting principles (GAAP), we use non-GAAP ļ¬nancial measures that
exclude certain items. Non-GAAP ļ¬nancial measures are not prepared in accordance with GAAP; therefore, the information is not necessarily comparable to other
companies and should be considered as a supplement to, not a substitute for, or superior to, the corresponding measures calculated in accordance with GAAP.
JANUARY 2016
3
Store #1: Snowdevil
C I R C A 2 0 0 4
Brick-and-Mortar
One Platform, Every Channel, Any Device.
STOREFRONTS 4
5
One Platform, Every Channel, Any Device.
ā€¢ snowboards
ā€¢ shredding
ā€¢ winter gear
Inventory ShippingOrder Management
AnalyticsPromotionsPayments Apps
A single, integrated back office
6
Multi-channel Commerce Platform
ā€¢ A single, simple to use back office
ā€¢ Powering all your sales channels
ā€¢ Everything integrated
7
Our Market
E N T R E P R E N E U R S H I P
S M B
L A R G E R
U N L I M I T E D
179$ PER
MONTH
P R O F E S S I O N A L
79$ PER
MONTH
B A S I C
29$ PER
MONTH
Enterprise
SMB
Entrepreneurs
8
Entrepreneurship
ā€¢ Small merchants today can become
our largest merchants tomorrow.
ā€¢ Completeness, reduced complexity,
and ease of use.
ā€¢ Leaves little room for disruption
from below.
DID IT WORK? YES
NO
IDEA
BUILD
9
Build-a-Business
ā€œIā€™m biased, but I think being an entrepreneur is a pretty damn good thing.ā€
ā€“Ā  SIR R IC HAR D B RANSON
2011 2012 2013 2014
$3.5M $12M $55M $100M
TIM FERRISS SETH G ODI N G ARY VAYNE RC HUK DAYMOND JOH N
2015
SI R RICHARD BRANS ON
SOLD SOLD SOLD SOLD
$250MSOLD
10
Headroom on SMB TAM
Source: AMI Partners
(1) Merchants defined as retailers with less than 500 employees. Includes commercially located businesses, sole proprietorships and home-based businesses
(2) Key geographies include: U.S., Canada, U.K., Western Europe, Australia and New Zealand
(3) Annualized revenue per merchant of approximately $1,000 based on the three months ended March 31, 2015
Global (1)
Current Core Geographies (2)
10M
46M$46B Global TAM (3)
$10B TAM (3)
11
Larger Brands
12
Build-a-Business Success
April 2010 Enters BaB competition
June 2010 Hits 10k orders in ļ¬rst 90 days
July 2010 Wins Shopify's Build A Business Competition
April 2011 First year's sales total more than $3M
June 2011 Expands into retail location
Nov 2011 Obama starts using a DODOcase
2012 Product line expands to iPhone Cases
2013 Facebook store launches
2014 Upgrades to Shopify Plus
2015 22 full-time employees and growing
13
Partner Ecosystem
SH OPIFY APP STORE
SH OPIFY TH EM E STORE
SH OPIFY E XPE R TS
200k
Merchants
App
Developers
Theme
Designers
Agencies
Partners
APP AND INTEGRATION PARTNERS
DESIGN AND DEVELOPMENT AGENCIES
STRATEGIC PARTNERS
14
Content
Marketing
Search
Engine
Marketing
Leading
Blog
Global
In-personā€Ø
Events
15
16
Synonymous with Ecommerce
ā€œEcommerceā€ ā€œShopifyā€
G O O G L E T R E N D S D ATA F I LT E R E D F O R U S A
2009 2010 2011 2012 2013 2014 2015
17
Shopifyā€™s Unique Recipe
Great Technology Beautiful Design Robust Ecosystem
Hundreds of Apps,ā€Ø
Themes, and Experts
Multi-tenant, scalable,ā€Ø
high availability architecture
Simple, limitless customization
of gorgeous themes
THE NUMBERS
18
19
Financial Highlights
LONG-TERM FOCUSIII
Strong, consistent growth in Revenue,
MRR and GMV
Success-based revenue stream built on a
large recurring subscription (SaaS) base
Strong track record of cash management
and investing for the long term
GROWTHI
POWERFUL BUSINESS MODELII
20
Strong Consistent Revenue Growth
ā€¢ Growing merchant base
ā€¢ Expanding GMV
ā€¢ Introduction and adoption of merchant oļ¬€erings
ā€¢ Robust partner ecosystem
D R I V E R S
9 MO
2014
+ 93% $135.1M
$69.8M
Subscription solutions
Merchant solutions
$23.7M
$105.0M
2013 20142012
$50.3M
+109%
+112%
9 MO
2015
2015e*
*Midpoint of management forecast range at November 4, 2015
$195.0M+86%
21
Strong Consistent MRR Growth
Monthly Recurring Revenue, or MRR, is calculated at the end of each period by multiplying the number of merchants who have subscription plans with us at the period end
date by the average monthly subscription plan fee revenue in eļ¬€ect on the last day of that period, assuming they maintain their subscription plans the following month.
2013 20142012 2015
Q1 Q1 Q1Q1
$9.8M
$1.1M
85% CAGR
22
Strong Consistent GMV Growth
ā€¢ More merchants
ā€¢ Higher avg. GMV per merchant
ā€¢ Introduction of POS
D R I V E R S
9 MO ā€˜14 9 MO ā€˜15
+102% $4.9B
$2.4B
$0.7B
$3.8B
2013 20142012
$1.6B
+133%
+128%
23
Powerful Business Model
$18.9M
$62.1M
2013 20142012
$36.9M
9 MO ā€˜14 9 MO ā€˜15
$75.8M
$42.3M
Excludes SBC expense
+94%
GROSS PROFIT
+68% +80%
24
Operating Leverage
Excludes SBC and Sales Tax expense
8%
8%
8%
7%
17%
22%
25%
26%
35%
43%46%51%
S&M R&D G&A
2013 20142012 YTD 2015
84% 79%
73%
60%
AS A PERCENTAGE OF REVENUE
25
More Merchants
& More GMV
More
Partners
More
Solutions
More International
Penetration
More
Channels
Growth Vectors
26
Investment Highlights
ā€¢ Enormous Opportunity ā€“ Multichannel commerce platform targeted at SMB market.
ā€¢ Powerful Business Model ā€“ Rapidly growing SaaS and success-based business model.
ā€¢ World-class Product ā€“ Well-crafted for simplicity and scalability.
ā€¢ Vast Ecosystem ā€“ Engaged and expanding partner ecosystem that is difficult to replicate.
ā€¢ Vision ā€“ Product-driven team with a long-term focus.
27
Make commerce better
for everyone.
APPENDI X
28
29
Reconciliation to GAAP Figures
2012 2013 2014
9 mo ended
Sept 30, 2014
9 mo ended
Sept 30, 2015
GAAP Gross proļ¬t 18,937 36,739 61,795 42,182 75,561
add: cost of revenues SBC 11 113 259 159 198
Non-GAAP Gross Proļ¬t 18,948 36,852 62,054 42,341 75,759
% of Revenue 80% 73% 59% 61% 56%
GAAP Sales and marketing 12,262 23,351 45,929 33,720 47,847
less: Sales and marketing SBC 66 354 696 451 681
Non-GAAP Sales and Marketing 12,196 22,997 45,233 33,269 47,166
% of Revenue 51% 46% 43% 48% 35%
GAAP Research and development 6,452 13,682 25,915 19,296 26,181
less: Research and development SBC 282 1,152 2,776 2,010 2,853
Non-GAAP Research and development 6,170 12,530 23,139 17,286 23,328
% of Revenue 26% 25% 22% 25% 17%
GAAP General and administrative 1,737 3,975 11,566 6,286 12,770
less: General and administrative SBC 49 147 712 347 1,547
less: Non-recurring sales and use tax expense - - 2,182 - 566
Non-GAAP General and administrative 1,688 3,828 8,672 5,939 10,657
% of Revenue 7% 8% 8% 9% 8%
GAAP Operating Expense 20,451 41,008 83,410 59,302 86,798
less: Operating SBC 397 1,653 4,184 2,808 5,081
less: Non-recurring sales and use tax expense - - 2,182 - 566
Non-GAAP Operating Expense 20,054 39,355 77,044 56,494 81,185
% of Revenue 84% 79% 73% 81% 60%

More Related Content

What's hot

Front Series B Deck
Front Series B DeckFront Series B Deck
Front Series B Deck
Mathilde Collin
Ā 
Mixpanel - Our pitch deck that we used to raise $65M
Mixpanel - Our pitch deck that we used to raise $65MMixpanel - Our pitch deck that we used to raise $65M
Mixpanel - Our pitch deck that we used to raise $65M
Suhail Doshi
Ā 
Fittr Pitch Deck
Fittr Pitch DeckFittr Pitch Deck
Fittr Pitch Deck
nolanperk
Ā 
Kickfolio - 500Startups Batch 5
Kickfolio - 500Startups Batch 5Kickfolio - 500Startups Batch 5
Kickfolio - 500Startups Batch 5
500 Startups
Ā 
The Deck We Used to Raise $1M Seed Round
The Deck We Used to Raise $1M Seed RoundThe Deck We Used to Raise $1M Seed Round
The Deck We Used to Raise $1M Seed Round
Ben Lang
Ā 
Manpacks Pitch Deck
Manpacks Pitch DeckManpacks Pitch Deck
Manpacks Pitch Deck
startuphome
Ā 
Swipes pitch deck for Beta Pitch 2013 Finals in Berlin
Swipes pitch deck for Beta Pitch 2013 Finals in BerlinSwipes pitch deck for Beta Pitch 2013 Finals in Berlin
Swipes pitch deck for Beta Pitch 2013 Finals in Berlin
Swipes App
Ā 
Pitch Deck Teardown: Ageras's $36M Private Equity deck
Pitch Deck Teardown: Ageras's $36M Private Equity deckPitch Deck Teardown: Ageras's $36M Private Equity deck
Pitch Deck Teardown: Ageras's $36M Private Equity deck
HajeJanKamps
Ā 
Brex Pitch Deck
Brex Pitch DeckBrex Pitch Deck
Brex Pitch Deck
Pitch Decks
Ā 
BuzzFeed Pitch Deck
BuzzFeed Pitch DeckBuzzFeed Pitch Deck
BuzzFeed Pitch Deck
Tech in Asia ID
Ā 
Coinbase Pitch Deck designed by Zlides
Coinbase Pitch Deck designed by ZlidesCoinbase Pitch Deck designed by Zlides
Coinbase Pitch Deck designed by Zlides
Zlides
Ā 
Tinder Pitch Deck
Tinder Pitch DeckTinder Pitch Deck
Tinder Pitch Deck
Ryan Gum
Ā 
Dropbox: $15K VC investment turned into $16.8B. Dropbox's initial pitch deck
Dropbox: $15K VC investment turned into $16.8B. Dropbox's initial pitch deckDropbox: $15K VC investment turned into $16.8B. Dropbox's initial pitch deck
Dropbox: $15K VC investment turned into $16.8B. Dropbox's initial pitch deck
AA BB
Ā 
Pitch Deck Teardown: Northspyre's $25 million Series B deck
Pitch Deck Teardown: Northspyre's $25 million Series B deckPitch Deck Teardown: Northspyre's $25 million Series B deck
Pitch Deck Teardown: Northspyre's $25 million Series B deck
HajeJanKamps
Ā 
Lunchbox Pitch Deck
Lunchbox Pitch DeckLunchbox Pitch Deck
Lunchbox Pitch Deck
HamishGrant6
Ā 
SEOmoz Pitch Deck July 2011
SEOmoz Pitch Deck July 2011SEOmoz Pitch Deck July 2011
SEOmoz Pitch Deck July 2011
Rand Fishkin
Ā 
Square: $10M VC investment turned into $40B. Square's initial pitch deck
Square: $10M VC investment turned into $40B. Square's initial pitch deckSquare: $10M VC investment turned into $40B. Square's initial pitch deck
Square: $10M VC investment turned into $40B. Square's initial pitch deck
AA BB
Ā 
Zestful pitch deck
Zestful pitch deckZestful pitch deck
Zestful pitch deck
Pitch Decks
Ā 
Mattermark 2nd (Final) Series A Deck
Mattermark 2nd (Final) Series A DeckMattermark 2nd (Final) Series A Deck
Mattermark 2nd (Final) Series A Deck
Danielle Morrill
Ā 
BuzzFeed Pitch Deck
BuzzFeed Pitch DeckBuzzFeed Pitch Deck
BuzzFeed Pitch Deck
startuphome
Ā 

What's hot (20)

Front Series B Deck
Front Series B DeckFront Series B Deck
Front Series B Deck
Ā 
Mixpanel - Our pitch deck that we used to raise $65M
Mixpanel - Our pitch deck that we used to raise $65MMixpanel - Our pitch deck that we used to raise $65M
Mixpanel - Our pitch deck that we used to raise $65M
Ā 
Fittr Pitch Deck
Fittr Pitch DeckFittr Pitch Deck
Fittr Pitch Deck
Ā 
Kickfolio - 500Startups Batch 5
Kickfolio - 500Startups Batch 5Kickfolio - 500Startups Batch 5
Kickfolio - 500Startups Batch 5
Ā 
The Deck We Used to Raise $1M Seed Round
The Deck We Used to Raise $1M Seed RoundThe Deck We Used to Raise $1M Seed Round
The Deck We Used to Raise $1M Seed Round
Ā 
Manpacks Pitch Deck
Manpacks Pitch DeckManpacks Pitch Deck
Manpacks Pitch Deck
Ā 
Swipes pitch deck for Beta Pitch 2013 Finals in Berlin
Swipes pitch deck for Beta Pitch 2013 Finals in BerlinSwipes pitch deck for Beta Pitch 2013 Finals in Berlin
Swipes pitch deck for Beta Pitch 2013 Finals in Berlin
Ā 
Pitch Deck Teardown: Ageras's $36M Private Equity deck
Pitch Deck Teardown: Ageras's $36M Private Equity deckPitch Deck Teardown: Ageras's $36M Private Equity deck
Pitch Deck Teardown: Ageras's $36M Private Equity deck
Ā 
Brex Pitch Deck
Brex Pitch DeckBrex Pitch Deck
Brex Pitch Deck
Ā 
BuzzFeed Pitch Deck
BuzzFeed Pitch DeckBuzzFeed Pitch Deck
BuzzFeed Pitch Deck
Ā 
Coinbase Pitch Deck designed by Zlides
Coinbase Pitch Deck designed by ZlidesCoinbase Pitch Deck designed by Zlides
Coinbase Pitch Deck designed by Zlides
Ā 
Tinder Pitch Deck
Tinder Pitch DeckTinder Pitch Deck
Tinder Pitch Deck
Ā 
Dropbox: $15K VC investment turned into $16.8B. Dropbox's initial pitch deck
Dropbox: $15K VC investment turned into $16.8B. Dropbox's initial pitch deckDropbox: $15K VC investment turned into $16.8B. Dropbox's initial pitch deck
Dropbox: $15K VC investment turned into $16.8B. Dropbox's initial pitch deck
Ā 
Pitch Deck Teardown: Northspyre's $25 million Series B deck
Pitch Deck Teardown: Northspyre's $25 million Series B deckPitch Deck Teardown: Northspyre's $25 million Series B deck
Pitch Deck Teardown: Northspyre's $25 million Series B deck
Ā 
Lunchbox Pitch Deck
Lunchbox Pitch DeckLunchbox Pitch Deck
Lunchbox Pitch Deck
Ā 
SEOmoz Pitch Deck July 2011
SEOmoz Pitch Deck July 2011SEOmoz Pitch Deck July 2011
SEOmoz Pitch Deck July 2011
Ā 
Square: $10M VC investment turned into $40B. Square's initial pitch deck
Square: $10M VC investment turned into $40B. Square's initial pitch deckSquare: $10M VC investment turned into $40B. Square's initial pitch deck
Square: $10M VC investment turned into $40B. Square's initial pitch deck
Ā 
Zestful pitch deck
Zestful pitch deckZestful pitch deck
Zestful pitch deck
Ā 
Mattermark 2nd (Final) Series A Deck
Mattermark 2nd (Final) Series A DeckMattermark 2nd (Final) Series A Deck
Mattermark 2nd (Final) Series A Deck
Ā 
BuzzFeed Pitch Deck
BuzzFeed Pitch DeckBuzzFeed Pitch Deck
BuzzFeed Pitch Deck
Ā 

Similar to Shopify Investor Deck January 2016

Investor deck q32015
Investor deck q32015Investor deck q32015
Investor deck q32015
shopifyInvestors
Ā 
Investor deck q32015 (1)
Investor deck q32015 (1)Investor deck q32015 (1)
Investor deck q32015 (1)
shopifyInvestors
Ā 
Shopify overview july 2015
Shopify overview july 2015Shopify overview july 2015
Shopify overview july 2015
shopifyInvestors
Ā 
Ir website 06152015
Ir website 06152015Ir website 06152015
Ir website 06152015
shopifyInvestors
Ā 
Shopify investor deck 11022016
Shopify investor deck 11022016Shopify investor deck 11022016
Shopify investor deck 11022016
shopifyInvestors
Ā 
Q1 2017 investor deck
Q1 2017 investor deckQ1 2017 investor deck
Q1 2017 investor deck
shopifyInvestors
Ā 
Q1 2017 investor deck
Q1 2017 investor deck Q1 2017 investor deck
Q1 2017 investor deck
shopifyInvestors
Ā 
Shopify Investor Deck - August 2016
Shopify Investor Deck - August 2016Shopify Investor Deck - August 2016
Shopify Investor Deck - August 2016
shopifyInvestors
Ā 
Q1 2017 investor deck
Q1 2017 investor deckQ1 2017 investor deck
Q1 2017 investor deck
shopifyInvestors
Ā 
Q4 2016 investor deck pdf
Q4 2016 investor deck pdfQ4 2016 investor deck pdf
Q4 2016 investor deck pdf
shopifyInvestors
Ā 
Shopify investor deck 02172016
Shopify investor deck 02172016Shopify investor deck 02172016
Shopify investor deck 02172016
shopifyInvestors
Ā 
Shopify investor deck 05042016
Shopify investor deck 05042016 Shopify investor deck 05042016
Shopify investor deck 05042016
shopifyInvestors
Ā 
Q4 2016 investor deck
Q4 2016 investor deckQ4 2016 investor deck
Q4 2016 investor deck
shopifyInvestors
Ā 
Q4 2016 investor deck
Q4 2016 investor deckQ4 2016 investor deck
Q4 2016 investor deck
shopifyInvestors
Ā 
Shopify Investor Deck 08032016
Shopify Investor Deck 08032016 Shopify Investor Deck 08032016
Shopify Investor Deck 08032016
shopifyInvestors
Ā 
Shopify q1 2017 investor deck
Shopify q1 2017 investor deckShopify q1 2017 investor deck
Shopify q1 2017 investor deck
shopifyInvestors
Ā 
Investor deck q4 2017
Investor deck q4 2017Investor deck q4 2017
Investor deck q4 2017
shopifyInvestors
Ā 
Investor deck q4 2017
Investor deck q4 2017Investor deck q4 2017
Investor deck q4 2017
shopifyInvestors
Ā 
Investor deck q4 2017 (1)
Investor deck q4 2017 (1)Investor deck q4 2017 (1)
Investor deck q4 2017 (1)
shopifyInvestors
Ā 
Investor deck q4 2017
Investor deck q4 2017Investor deck q4 2017
Investor deck q4 2017
shopifyInvestors
Ā 

Similar to Shopify Investor Deck January 2016 (20)

Investor deck q32015
Investor deck q32015Investor deck q32015
Investor deck q32015
Ā 
Investor deck q32015 (1)
Investor deck q32015 (1)Investor deck q32015 (1)
Investor deck q32015 (1)
Ā 
Shopify overview july 2015
Shopify overview july 2015Shopify overview july 2015
Shopify overview july 2015
Ā 
Ir website 06152015
Ir website 06152015Ir website 06152015
Ir website 06152015
Ā 
Shopify investor deck 11022016
Shopify investor deck 11022016Shopify investor deck 11022016
Shopify investor deck 11022016
Ā 
Q1 2017 investor deck
Q1 2017 investor deckQ1 2017 investor deck
Q1 2017 investor deck
Ā 
Q1 2017 investor deck
Q1 2017 investor deck Q1 2017 investor deck
Q1 2017 investor deck
Ā 
Shopify Investor Deck - August 2016
Shopify Investor Deck - August 2016Shopify Investor Deck - August 2016
Shopify Investor Deck - August 2016
Ā 
Q1 2017 investor deck
Q1 2017 investor deckQ1 2017 investor deck
Q1 2017 investor deck
Ā 
Q4 2016 investor deck pdf
Q4 2016 investor deck pdfQ4 2016 investor deck pdf
Q4 2016 investor deck pdf
Ā 
Shopify investor deck 02172016
Shopify investor deck 02172016Shopify investor deck 02172016
Shopify investor deck 02172016
Ā 
Shopify investor deck 05042016
Shopify investor deck 05042016 Shopify investor deck 05042016
Shopify investor deck 05042016
Ā 
Q4 2016 investor deck
Q4 2016 investor deckQ4 2016 investor deck
Q4 2016 investor deck
Ā 
Q4 2016 investor deck
Q4 2016 investor deckQ4 2016 investor deck
Q4 2016 investor deck
Ā 
Shopify Investor Deck 08032016
Shopify Investor Deck 08032016 Shopify Investor Deck 08032016
Shopify Investor Deck 08032016
Ā 
Shopify q1 2017 investor deck
Shopify q1 2017 investor deckShopify q1 2017 investor deck
Shopify q1 2017 investor deck
Ā 
Investor deck q4 2017
Investor deck q4 2017Investor deck q4 2017
Investor deck q4 2017
Ā 
Investor deck q4 2017
Investor deck q4 2017Investor deck q4 2017
Investor deck q4 2017
Ā 
Investor deck q4 2017 (1)
Investor deck q4 2017 (1)Investor deck q4 2017 (1)
Investor deck q4 2017 (1)
Ā 
Investor deck q4 2017
Investor deck q4 2017Investor deck q4 2017
Investor deck q4 2017
Ā 

More from shopifyInvestors

Investor deck q2 2018
Investor deck q2 2018Investor deck q2 2018
Investor deck q2 2018
shopifyInvestors
Ā 
Investor deck q1 2018
Investor deck q1 2018Investor deck q1 2018
Investor deck q1 2018
shopifyInvestors
Ā 
Investor deck q4 2017
Investor deck q4 2017Investor deck q4 2017
Investor deck q4 2017
shopifyInvestors
Ā 
Investor deck q3 2017
Investor deck q3 2017Investor deck q3 2017
Investor deck q3 2017
shopifyInvestors
Ā 
Merchant stories
Merchant stories Merchant stories
Merchant stories
shopifyInvestors
Ā 
Shopify merchant stories
Shopify merchant storiesShopify merchant stories
Shopify merchant stories
shopifyInvestors
Ā 
Investor deck q2 2017 (1)
Investor deck q2 2017 (1)Investor deck q2 2017 (1)
Investor deck q2 2017 (1)
shopifyInvestors
Ā 
Investor deck q2 2017
Investor deck q2 2017Investor deck q2 2017
Investor deck q2 2017
shopifyInvestors
Ā 
Investor deck q2 2017
Investor deck q2 2017Investor deck q2 2017
Investor deck q2 2017
shopifyInvestors
Ā 
Investor deck q2 2017
Investor deck q2 2017Investor deck q2 2017
Investor deck q2 2017
shopifyInvestors
Ā 
Investor deck q2 2017
Investor deck q2 2017Investor deck q2 2017
Investor deck q2 2017
shopifyInvestors
Ā 
Ir featured content slides nov 2015
Ir featured content slides nov 2015Ir featured content slides nov 2015
Ir featured content slides nov 2015
shopifyInvestors
Ā 

More from shopifyInvestors (12)

Investor deck q2 2018
Investor deck q2 2018Investor deck q2 2018
Investor deck q2 2018
Ā 
Investor deck q1 2018
Investor deck q1 2018Investor deck q1 2018
Investor deck q1 2018
Ā 
Investor deck q4 2017
Investor deck q4 2017Investor deck q4 2017
Investor deck q4 2017
Ā 
Investor deck q3 2017
Investor deck q3 2017Investor deck q3 2017
Investor deck q3 2017
Ā 
Merchant stories
Merchant stories Merchant stories
Merchant stories
Ā 
Shopify merchant stories
Shopify merchant storiesShopify merchant stories
Shopify merchant stories
Ā 
Investor deck q2 2017 (1)
Investor deck q2 2017 (1)Investor deck q2 2017 (1)
Investor deck q2 2017 (1)
Ā 
Investor deck q2 2017
Investor deck q2 2017Investor deck q2 2017
Investor deck q2 2017
Ā 
Investor deck q2 2017
Investor deck q2 2017Investor deck q2 2017
Investor deck q2 2017
Ā 
Investor deck q2 2017
Investor deck q2 2017Investor deck q2 2017
Investor deck q2 2017
Ā 
Investor deck q2 2017
Investor deck q2 2017Investor deck q2 2017
Investor deck q2 2017
Ā 
Ir featured content slides nov 2015
Ir featured content slides nov 2015Ir featured content slides nov 2015
Ir featured content slides nov 2015
Ā 

Recently uploaded

New Tax Regime User Guide Flexi Plan Revised (1).pptx
New Tax Regime User Guide Flexi Plan Revised (1).pptxNew Tax Regime User Guide Flexi Plan Revised (1).pptx
New Tax Regime User Guide Flexi Plan Revised (1).pptx
RajkumarRajamanikam
Ā 
Osisko Development - Investor Presentation - June 24
Osisko Development - Investor Presentation - June 24Osisko Development - Investor Presentation - June 24
Osisko Development - Investor Presentation - June 24
Philip Rabenok
Ā 
Snam 2023-27 Industrial Plan - Financial Presentation
Snam 2023-27 Industrial Plan - Financial PresentationSnam 2023-27 Industrial Plan - Financial Presentation
Snam 2023-27 Industrial Plan - Financial Presentation
Valentina Ottini
Ā 
cyberagent_For New Investors_EN_240424.pdf
cyberagent_For New Investors_EN_240424.pdfcyberagent_For New Investors_EN_240424.pdf
cyberagent_For New Investors_EN_240424.pdf
CyberAgent, Inc.
Ā 
Corporate Presentation Probe June 2024.pdf
Corporate Presentation Probe June 2024.pdfCorporate Presentation Probe June 2024.pdf
Corporate Presentation Probe June 2024.pdf
Probe Gold
Ā 
Investor Day 2024 Presentation Sysco 2024
Investor Day 2024 Presentation Sysco 2024Investor Day 2024 Presentation Sysco 2024
Investor Day 2024 Presentation Sysco 2024
Sysco_Investors
Ā 
Collective Mining | Corporate Presentation - May 2024
Collective Mining | Corporate Presentation - May 2024Collective Mining | Corporate Presentation - May 2024
Collective Mining | Corporate Presentation - May 2024
CollectiveMining1
Ā 
Collective Mining | Corporate Presentation - May 2024
Collective Mining | Corporate Presentation - May 2024Collective Mining | Corporate Presentation - May 2024
Collective Mining | Corporate Presentation - May 2024
CollectiveMining1
Ā 

Recently uploaded (8)

New Tax Regime User Guide Flexi Plan Revised (1).pptx
New Tax Regime User Guide Flexi Plan Revised (1).pptxNew Tax Regime User Guide Flexi Plan Revised (1).pptx
New Tax Regime User Guide Flexi Plan Revised (1).pptx
Ā 
Osisko Development - Investor Presentation - June 24
Osisko Development - Investor Presentation - June 24Osisko Development - Investor Presentation - June 24
Osisko Development - Investor Presentation - June 24
Ā 
Snam 2023-27 Industrial Plan - Financial Presentation
Snam 2023-27 Industrial Plan - Financial PresentationSnam 2023-27 Industrial Plan - Financial Presentation
Snam 2023-27 Industrial Plan - Financial Presentation
Ā 
cyberagent_For New Investors_EN_240424.pdf
cyberagent_For New Investors_EN_240424.pdfcyberagent_For New Investors_EN_240424.pdf
cyberagent_For New Investors_EN_240424.pdf
Ā 
Corporate Presentation Probe June 2024.pdf
Corporate Presentation Probe June 2024.pdfCorporate Presentation Probe June 2024.pdf
Corporate Presentation Probe June 2024.pdf
Ā 
Investor Day 2024 Presentation Sysco 2024
Investor Day 2024 Presentation Sysco 2024Investor Day 2024 Presentation Sysco 2024
Investor Day 2024 Presentation Sysco 2024
Ā 
Collective Mining | Corporate Presentation - May 2024
Collective Mining | Corporate Presentation - May 2024Collective Mining | Corporate Presentation - May 2024
Collective Mining | Corporate Presentation - May 2024
Ā 
Collective Mining | Corporate Presentation - May 2024
Collective Mining | Corporate Presentation - May 2024Collective Mining | Corporate Presentation - May 2024
Collective Mining | Corporate Presentation - May 2024
Ā 

Shopify Investor Deck January 2016

  • 1. 200,000+ ACTIVE SHOPIFY MERCHANTS $1.9 BILLION+ GMV IN Q3 ā€˜15
  • 2. 2 Safe Harbour This presentation contains forward-looking statements that are based on our managementā€™s current estimates, beliefs and assumptions, which are based on managementā€™s perception of historic trends, current conditions and expected future developments, as well as other factors management believes are appropriate in the circumstances. Although we believe that the plans, intentions, expectations, assumptions and strategies reļ¬‚ected in these forward-looking statements are reasonable, these statements relate to future events or our future ļ¬nancial performance, and involve known and unknown risks, uncertainties and other factors that may cause our actual results to be materially diļ¬€erent from any future results expressed or implied by these forward-looking statements. Although the forward-looking statements contained in this presentation are based upon what we believe are reasonable assumptions, investors are cautioned against placing undue reliance on these statements since actual results may vary from the forward-looking statements. Forward-looking statements involve known and unknown risks, uncertainties and other factors, which are, in some cases, beyond our control and which could materially aļ¬€ect our results. These risks are described in further detail in the section entitled ā€œRisk Factorsā€ and elsewhere in our ļ¬lings with regulatory agencies. If one or more of these risks or uncertainties occur, or if our underlying assumptions prove to be incorrect, actual results may vary signiļ¬cantly from those implied or projected by the forward-looking statements. References to long-term trends in our model are forward-looking and made as of the current date. Nothing in this presentation should be regarded as a representation by any person that these long- term trends will be achieved and we undertake no duty to update its long-term trends. We believe that the case studies presented in this presentation provide a representative sample of how our merchants have been able to use various features of our platform to grow their respective businesses. References in this presentation to increased visits, growth and sales following implementation of our platform do not necessarily mean that our platform was the only factor contributing to such increases. To supplement the ļ¬nancial measures prepared in accordance with generally accepted accounting principles (GAAP), we use non-GAAP ļ¬nancial measures that exclude certain items. Non-GAAP ļ¬nancial measures are not prepared in accordance with GAAP; therefore, the information is not necessarily comparable to other companies and should be considered as a supplement to, not a substitute for, or superior to, the corresponding measures calculated in accordance with GAAP. JANUARY 2016
  • 3. 3 Store #1: Snowdevil C I R C A 2 0 0 4
  • 4. Brick-and-Mortar One Platform, Every Channel, Any Device. STOREFRONTS 4
  • 5. 5 One Platform, Every Channel, Any Device. ā€¢ snowboards ā€¢ shredding ā€¢ winter gear Inventory ShippingOrder Management AnalyticsPromotionsPayments Apps A single, integrated back office
  • 6. 6 Multi-channel Commerce Platform ā€¢ A single, simple to use back office ā€¢ Powering all your sales channels ā€¢ Everything integrated
  • 7. 7 Our Market E N T R E P R E N E U R S H I P S M B L A R G E R U N L I M I T E D 179$ PER MONTH P R O F E S S I O N A L 79$ PER MONTH B A S I C 29$ PER MONTH Enterprise SMB Entrepreneurs
  • 8. 8 Entrepreneurship ā€¢ Small merchants today can become our largest merchants tomorrow. ā€¢ Completeness, reduced complexity, and ease of use. ā€¢ Leaves little room for disruption from below. DID IT WORK? YES NO IDEA BUILD
  • 9. 9 Build-a-Business ā€œIā€™m biased, but I think being an entrepreneur is a pretty damn good thing.ā€ ā€“Ā  SIR R IC HAR D B RANSON 2011 2012 2013 2014 $3.5M $12M $55M $100M TIM FERRISS SETH G ODI N G ARY VAYNE RC HUK DAYMOND JOH N 2015 SI R RICHARD BRANS ON SOLD SOLD SOLD SOLD $250MSOLD
  • 10. 10 Headroom on SMB TAM Source: AMI Partners (1) Merchants defined as retailers with less than 500 employees. Includes commercially located businesses, sole proprietorships and home-based businesses (2) Key geographies include: U.S., Canada, U.K., Western Europe, Australia and New Zealand (3) Annualized revenue per merchant of approximately $1,000 based on the three months ended March 31, 2015 Global (1) Current Core Geographies (2) 10M 46M$46B Global TAM (3) $10B TAM (3)
  • 12. 12 Build-a-Business Success April 2010 Enters BaB competition June 2010 Hits 10k orders in ļ¬rst 90 days July 2010 Wins Shopify's Build A Business Competition April 2011 First year's sales total more than $3M June 2011 Expands into retail location Nov 2011 Obama starts using a DODOcase 2012 Product line expands to iPhone Cases 2013 Facebook store launches 2014 Upgrades to Shopify Plus 2015 22 full-time employees and growing
  • 13. 13 Partner Ecosystem SH OPIFY APP STORE SH OPIFY TH EM E STORE SH OPIFY E XPE R TS 200k Merchants App Developers Theme Designers Agencies
  • 14. Partners APP AND INTEGRATION PARTNERS DESIGN AND DEVELOPMENT AGENCIES STRATEGIC PARTNERS 14
  • 16. 16 Synonymous with Ecommerce ā€œEcommerceā€ ā€œShopifyā€ G O O G L E T R E N D S D ATA F I LT E R E D F O R U S A 2009 2010 2011 2012 2013 2014 2015
  • 17. 17 Shopifyā€™s Unique Recipe Great Technology Beautiful Design Robust Ecosystem Hundreds of Apps,ā€Ø Themes, and Experts Multi-tenant, scalable,ā€Ø high availability architecture Simple, limitless customization of gorgeous themes
  • 19. 19 Financial Highlights LONG-TERM FOCUSIII Strong, consistent growth in Revenue, MRR and GMV Success-based revenue stream built on a large recurring subscription (SaaS) base Strong track record of cash management and investing for the long term GROWTHI POWERFUL BUSINESS MODELII
  • 20. 20 Strong Consistent Revenue Growth ā€¢ Growing merchant base ā€¢ Expanding GMV ā€¢ Introduction and adoption of merchant oļ¬€erings ā€¢ Robust partner ecosystem D R I V E R S 9 MO 2014 + 93% $135.1M $69.8M Subscription solutions Merchant solutions $23.7M $105.0M 2013 20142012 $50.3M +109% +112% 9 MO 2015 2015e* *Midpoint of management forecast range at November 4, 2015 $195.0M+86%
  • 21. 21 Strong Consistent MRR Growth Monthly Recurring Revenue, or MRR, is calculated at the end of each period by multiplying the number of merchants who have subscription plans with us at the period end date by the average monthly subscription plan fee revenue in eļ¬€ect on the last day of that period, assuming they maintain their subscription plans the following month. 2013 20142012 2015 Q1 Q1 Q1Q1 $9.8M $1.1M 85% CAGR
  • 22. 22 Strong Consistent GMV Growth ā€¢ More merchants ā€¢ Higher avg. GMV per merchant ā€¢ Introduction of POS D R I V E R S 9 MO ā€˜14 9 MO ā€˜15 +102% $4.9B $2.4B $0.7B $3.8B 2013 20142012 $1.6B +133% +128%
  • 23. 23 Powerful Business Model $18.9M $62.1M 2013 20142012 $36.9M 9 MO ā€˜14 9 MO ā€˜15 $75.8M $42.3M Excludes SBC expense +94% GROSS PROFIT +68% +80%
  • 24. 24 Operating Leverage Excludes SBC and Sales Tax expense 8% 8% 8% 7% 17% 22% 25% 26% 35% 43%46%51% S&M R&D G&A 2013 20142012 YTD 2015 84% 79% 73% 60% AS A PERCENTAGE OF REVENUE
  • 25. 25 More Merchants & More GMV More Partners More Solutions More International Penetration More Channels Growth Vectors
  • 26. 26 Investment Highlights ā€¢ Enormous Opportunity ā€“ Multichannel commerce platform targeted at SMB market. ā€¢ Powerful Business Model ā€“ Rapidly growing SaaS and success-based business model. ā€¢ World-class Product ā€“ Well-crafted for simplicity and scalability. ā€¢ Vast Ecosystem ā€“ Engaged and expanding partner ecosystem that is difficult to replicate. ā€¢ Vision ā€“ Product-driven team with a long-term focus.
  • 29. 29 Reconciliation to GAAP Figures 2012 2013 2014 9 mo ended Sept 30, 2014 9 mo ended Sept 30, 2015 GAAP Gross proļ¬t 18,937 36,739 61,795 42,182 75,561 add: cost of revenues SBC 11 113 259 159 198 Non-GAAP Gross Proļ¬t 18,948 36,852 62,054 42,341 75,759 % of Revenue 80% 73% 59% 61% 56% GAAP Sales and marketing 12,262 23,351 45,929 33,720 47,847 less: Sales and marketing SBC 66 354 696 451 681 Non-GAAP Sales and Marketing 12,196 22,997 45,233 33,269 47,166 % of Revenue 51% 46% 43% 48% 35% GAAP Research and development 6,452 13,682 25,915 19,296 26,181 less: Research and development SBC 282 1,152 2,776 2,010 2,853 Non-GAAP Research and development 6,170 12,530 23,139 17,286 23,328 % of Revenue 26% 25% 22% 25% 17% GAAP General and administrative 1,737 3,975 11,566 6,286 12,770 less: General and administrative SBC 49 147 712 347 1,547 less: Non-recurring sales and use tax expense - - 2,182 - 566 Non-GAAP General and administrative 1,688 3,828 8,672 5,939 10,657 % of Revenue 7% 8% 8% 9% 8% GAAP Operating Expense 20,451 41,008 83,410 59,302 86,798 less: Operating SBC 397 1,653 4,184 2,808 5,081 less: Non-recurring sales and use tax expense - - 2,182 - 566 Non-GAAP Operating Expense 20,054 39,355 77,044 56,494 81,185 % of Revenue 84% 79% 73% 81% 60%