
Recommended
Recommended
More Related Content
Similar to Water and sustainabilityIn the high desert of Northern Arizona.docx
Similar to Water and sustainabilityIn the high desert of Northern Arizona.docx (20)
More from celenarouzie
More from celenarouzie (20)
Recently uploaded
Recently uploaded (20)
Water and sustainabilityIn the high desert of Northern Arizona.docx
- 1. Water and sustainability In the high desert of Northern Arizona Pick one from each of the following three categories: 1. Use of water for different purposes: a. Residential needs i. Human uses ii. Watering of lawns, landscaping and gardens b. Commercial uses i. Production ii. Watering of lawns and landscaping c. Recreation i. Parks ii. Skiing iii. Golf 2. Methods of meeting these needs a. Increasing ground water use by developing Red Gap Ranch b. Improve the level of waste water treatment and designate different uses for reclaimed water c. Conservation 3. Water rates and use restrictions: current, proposed changes, evaluation a. Residential b. Commercial c. Recreation Revenge of the Lawn
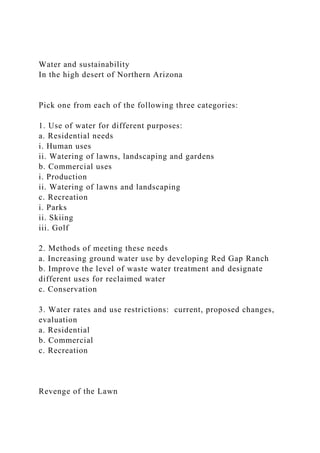
- 2. A discussion of the challenges and opportunities in securing a sustainable water future. Hosted by Philosophy in the Public Interest College of Arts and Letters, NAU New Water Resources Of the 7,000 acres of land suitable for development within City limits, Flagstaff has designated 60% for open space and conservation. Development is allowed on the remaining 40%.5 - Picture Canyon and Observatory Mesa have recently been reserved for open space, adding over 2,700 acres of land within City limits that cannot be developed.5 Population Growth Fig. 6 Estimated cost of additional water resources over a ten year period. Estimates include upfront infrastructure costs, operation and maintenance, and electricity usage. The right Y axis is the volume/cost ratio and is a metric of cost- effectiveness The higher the ratio, the greater the volume of water supplied for a given cost. *Includes the estimated cost of water rights only. Drawing water from the Upper Colorado River basin faces many legal challenges.3 Which new water resources should the city focus its efforts on? Should cities like Flagstaff and Sedona restrict growth in order to meet future water needs? Knowing all the topics we discussed involve tradeoffs: How should Flagstaff meet future water needs? What should our priorities be? Arizona Department of Water Resources. “Water Supply of the Eastern Plateau Planning Area,” Groundwater, 27 Mar. 2014. Web. 14 Nov. 2015. City of Flagstaff-Utilities Division. “Utilities Integrated Master Plan: Water Resources Chapter,” 8 Apr. 2011. Web. 14 Nov. 2015. 3. City of Flagstaff - Utilities Division. “Report to the Water Commission: Water, Wastewater, Reuse and Stormwater,” 11 May 2015. Web. 11 Nov. 2015.
- 3. 4. CDM Smith, EPA, and USAID. "2012 Guidelines for Water Reuse," (2012). US Environmental Protection Agency. Web. 2015. 5. City of Flagstaff. “Open Spaces Commission - Recent Success,” Web. 2015. References: What’s Inside? Figures: 1. Water resource needs with projected population growth 2. Flagstaff water use per capita 3. Flagstaff’s current water resources 4. Potential water conservation measures 5. Current reclaimed water uses 6. Estimated cost of new water resources Table: 1. Restrictions to groundwater use water use and conservation in the high desert 1 Cost AF Groundwater Red Gap RanchReclaimed water recharge and reuse Colorado River suppy* 830 3857 974 3000 Volume AF/year Groundwater Red Gap RanchReclaimed water recharge and reuse Colorado River suppy* 716 12000 4480 8000 Ratio (volume/cost) Groundwater Red Gap Ranch Reclaimed water recharge and reuseColorado River suppy* 0.86265060240963898 3.1112263417163599 4.59958932238193 2.6666666666666661
- 4. Cost / acre-foot and volume of water supplied / yr Volume/cost ratio Additional Resource Option Current and Future Water Needs An acre foot of water is the amount of water it takes to cover an acre of land with 1 foot of water. Equals 325,851 gallons. An average family requires 0.25 acre-feet of water per year. Water Conservation Should we do more to incentivize and promote conservation?WellfieldMaximum Draw Per Year (Acre- Feet)Woody Mountain 3,500 Lake Mary 2,500 Inner City 1,300 to 3,800 Inner Basin 542 Red Gap Ranch 15,000 Table 1. The allowable amount of water per year that the City can draw from each well field in order to ensure a sustainable yield.1 Fig. 1 Projected population growth and water resource needs based on different growth and conservation scenarios.3 Fig 3. Breakdown of the City of Flagstaff’s current water supply.2 Fig. 2 Water use per capita from 1980 – 2010 Fig. 4 Cost to both the City and the consumer for different water conservation options, along with the potential volume of water saved (city-wide) under each option.3 Reclaimed Water Fig. 5 Current uses of reclaimed water. The right chart shows how the reclaim water that is delivered to consumers is allocated on an annual basis.2
- 5. Reclaimed water availability varies depending on the season. In January – March, reclaimed water accounts for 13% – 19% of total water supply. In April – July, reclaimed water makes up 21% - 30% of our total water supply. Should we expand the use of reclaimed water in our water portfolio? If so, in what ways? Gallons per person per day Reclaimed water is treated municipal wastewater. Flagstaff has two wastewater treatment facilities that treat Flagstaff’s wastewater to Arizona’s highest standard for reclaim water.4 Current Rebates for Water Conservation Efficient Toilet Rebate - $100 credit per toilet Turf Rebate – One time $500 credit (min 1,500 square feet removal) Rain Water Harvesting Rebate – One time $100 credit (1,000 gallon tank) Population Growth and Water Resource Needs Historical Population Growth 1950 1960 1970 1980 1990 2000 2010 2020 2030 2040 2050 2060 2070 2080 7663 18214 26117 35310 45990 62710 65870 Projected population @ 1.4% growth rate 1950 1960 1970 1980 1990 2000 2010 2020 2030 2040 2050 2060 2070 2080 65870 71963.8 83024.399999999994 95785.1 110507.2 127492 147087.4 169694.5 Projected population @ < 1% growth rate 65870 72266.899999999994 80400.2 87537.600000000006 93861.1 99657.5 105801.2 112323.4 Historical water resource needs 1263 2568 4719 6212 8541 8912 8353 Water resource needs with 1.4% growth and no additional conservation 8353 9189.6 10602 12231.5 14111.3 16280.2 18782.7 21669.3 Water resource needs 1. 4% growth 20% additional conservation 8353 8961.7999999999938 9800.2999999999938 10758.7 11811.5 13207.4 15230.3 17571 Water resource needs < 1%
- 6. growth no additional conservation 8353 9226.9 10266.799999999999 11178.3 11985.7 12725.8 13510.5 14343.1 Water resource needs < 1% growth 20% additional conservation8353 8999.1 9492.2999999999938 9834.7999999999938 10035.6 10324.200000000001 10955.3 11630.6 Year Population Volume of water acre-FT Residential <1% Golf Courses Manufacturing Municipal Commercial NAUConstruction Residential Snowbowl 1013 281 120 137 129 45 3 206 Delivered Envronmental FlowsUnaccounted Loss Discharge to Rio de Flag 1934 323 89 3841 Inner Basin springs <1% Lake Mary Inner Basin wells Inner Basin springs Lost and unaccounted Lake Mary wells Woody Mtn wells Local wells 1037.9000000000001 237.6 18 891 1726.8 2574.6 2752.1 Cost and Volume Saved of Potential Water Conservation Measures Cost acre-ft - over ten year period Cisterns new residential Rain barrels new residential Cisterns new commercial Cisterns new institutionalHot water recirculators High efficiency (HE) cothes washer Incinerating toilets Turf removal Composting toilets HE toilets (1.3 gal) 1980 - 1994 HE toilets (1.3 gal) post 1994 5500 1704 2650 2546 1358 505 1290 297 1352 25 1901 Cost to consumer 3600 100 4720 4939 230 993 2110 2800 5885 278 278 Volume acre-Ft/year 232 93 33 20 255 220 588 1499 565 311 32 Cost acre-ft Volume acre-ft