SlideShare a Scribd company logo
B R O O K I N G S
M E T R O P O L I TA N
P O L I CY
P R O G RA M
6
I . I N T R O D U C T I O N
A
s the global economy has become more integrated and
urbanized,
fueled in large part by technology, major cities and
metropolitan
areas have become key engines of economic growth. The 123
largest
metro areas in the world generate nearly one third of global
output
with only 13 percent of the world’s population.
In this urban-centered world, the classic notion of a
global city has been upended. This report introduces
a redefined map of global cities, drawing on a new
typology that demonstrates how metro areas vary in
the ways they attract and amass economic drivers
and contribute to global economic growth in distinct
ways. New concerns about economic stagnation—in
both developing and developed economies—add
urgency to mapping the role of the world’s cities and
the extent to which they are well-positioned to deliver
the next round of global growth.1
Instead of a ranking or indexed score, which many
prior cities indices and reports have capably deliv-
ered,2 this analysis differentiates the assets and
challenges faced by seven types of global cities.
This perspective reveals that all major cities are
indeed global; they participate as critical nodes in
an integrated marketplace and are shaped by global
currents. But cities also operate from much differ-
ent starting points and experience diverse economic
trajectories. Concerns about global growth, productiv-
ity, and wages are not monolithic, and so this typology
can inform the variety of paths cities take to address
these challenges. For metro leaders, this typology
can also ensure better application of peer com-
parisons, enable the identification of more relevant
global innovations to local challenges, and reinforce a
city-region’s relative role and performance to inform
economic strategies that ensure ongoing prosperity.
This report proceeds in four parts. In the following
section, Part II, we explore the three global forces of
urbanization, globalization, and technological change,
and how together they are demanding that city-
regions focus on five core factors—traded clusters,
innovation, talent, infrastructure connectivity, and
governance—to bolster their economic competitive-
ness. Building on these factors, Part III outlines the
data and methods deployed to create the metropoli-
tan typology. Part IV explores the collective economic
clout of the metro areas in our sample and introduces
the new typology of global cities. Finally, Part V
explores the future investments, policies, and strate-
gies required for each grouping of metro areas. Within
the typology framework, we explore the priorities for
action going forward, including the implications for
governance.
REDEFINING
GLOBAL CITIES
THE SEVEN TYPES
OF GLOBAL METRO
ECONOMIES
7
U R B A N I Z AT I O N
The world is becoming more urban, placing cities at
the center of global economic development. The share
of global population in metropolitan areas has grown
from 29 percent in 1950 to well over half today, and it
is predicted to reach 66 percent by mid-century.4
History indicates that urbanization both accompanies
and facilitates economic transition from agricul-
ture to manufacturing and services, activities that
tend to demand clusters of labor and capital as well
as the proximity to other firms that cities provide.
Urbanization and industrialization, therefore, tend
to occur in concert. These twin forces, which revolu-
tionized Europe and North America in the late 19th
century and early 20th century, have now touched
Asia and Latin America. However, this process is not
preordained. Africa’s urbanization, for instance, has
not been accompanied by widespread industrializa-
tion.5 Notwithstanding Africa’s challenges, millions
of rural residents each week flock to urban regions
in the Global South in search of the living standards
that new production and service jobs provide. Since
2010 annual urban populations have grown fastest in
Africa (3.55 percent) and Asia (2.50 percent), greatly
exceeding the pace of urban growth in North America
(1.04 percent) and Europe (0.33 percent).6
The pressures and opportunities accompanying
urbanization will be felt most intensely and directly
in the Global South, but the knock-on effects will be
worldwide. Urbanization in developing economies has
resulted in a much greater number of urban areas
in which firms and workers can thrive. In techni-
cal terms, agglomeration externalities—the benefits
that accrue to firms, workers, and local economies
from clustering—now exist in many more parts of the
world.7 As a result, along with their growing human
footprint, metro areas are flexing even greater
economic muscle on the world stage. Overall, the 50
percent of the world’s population that lives in urban
I I . G L O B A L M E G A T R E N D S A N D C I T I E S
T
hree significant forces—urbanization, global integration, and
techno-
logical change—are reshaping the international economy.3 We
focus on
these three forces because they are distinctly positioning cities
as the
world’s competitive economic units while simultaneously
redefining
what it takes for them to excel in today’s economy.
B R O O K I N G S
M E T R O P O L I TA N
P O L I CY
P R O G RA M
8
areas produces roughly 80 percent of the world’s
total output.8
Urbanization, however, comes with risks if it is unman-
aged. Rapid population influxes in the megacities of
Africa, Latin America, and Southeast Asia are strain-
ing the ability of local governments to provide basic
housing, transportation, energy, water, and sewage
infrastructure.9 The world will need to invest $57
trillion in new infrastructure by 2030 to keep pace
with expected growth, the bulk of which will occur in
the developing world.10 If the negative externalities of
congestion, insecurity, and health risks overwhelm the
positive agglomeration externalities that cities provide,
countries run the risk of urbanizing without growth.11
The rise of developing metro areas creates both chal-
lenges and opportunities for developed world cities.
There is now more direct competition for firms and
talent, but metro areas in developed markets can also
look to developing metros with expanding populations
and wealth for new sources of demand. Brookings’
Homi Kharas and Geoffrey Gertz project that China
and India, which account for only 5 percent of global
middle-class consumption today, could together
account for nearly half of that consumption by 2050,
with most of it occurring in their cities.12
G L O B A L I Z AT I O N
Global integration, a defining trend of the postwar
era, is intensifying.13 The volume of goods, services,
and investments between countries increased from
$5 trillion in 1990 to $30 trillion in 2014, or from 24
percent to 39 percent of global gross domestic prod-
uct (GDP).14 Moreover, the nature of global exchange
seems to be shifting. While goods trade has stagnated
in recent years, cross-border flows of data and infor-
mation have grown robustly.15
Broadly measured, these connections matter.
Countries that are more internationally connected
can expect to increase GDP growth by up to 40
percent more than less-connected countries.16 These
findings affirm a wide array of economic literature
citing the benefits of participating in global flows of
trade, investment, and talent. Much of these benefits
stem from the presence of globally-engaged firms.
Local companies that embed themselves in global
value chains gain access to high-quality imports,
lowering their overall costs and allowing them to
become more globally competitive. This process
tends to boost productivity and wages.17 Firms selling
internationally inject new wealth from abroad that,
when spent locally, creates a multiplier effect in the
regional economy, spurring new jobs, growth, and fur-
ther tax revenue to be reinvested locally.18 Households
living in metro areas open to trade are able to access
a greater diversity of goods made elsewhere.19
Furthermore, global exchange is how regions with
fewer industrial capabilities often obtain the knowl-
edge required to move up the economic ladder, create
new jobs, and boost productivity.20
But cities also bear the brunt of the dislocations
caused by global integration. For instance, China’s
insertion into the global trading system resulted
in significant job losses in U.S. labor markets that
specialize in manufacturing.21 In the developing world,
there is an argument to be made that the globaliza-
tion of labor, trade, and capital markets, along with
bringing new knowledge and technologies, has con-
tributed to economic instability and rising inequities
within nations.22
Indeed, even those cities that have thrived in a more
globally integrated world are experiencing challenges
of unevenly shared prosperity. As Saskia Sassen has
argued, the rise of the globally integrated city has
coincided with the rise of the unequal city, across
both developed and developing countries.23 Indeed,
the Organization for Economic Cooperation and
Development (OECD) has found that inequality tends
to be higher and rising more quickly in large cities
than in their surrounding nations due to skills’ distri-
bution and the rise of high earners.24 Inequality may
limit upward mobility and overall economic growth if
it hinders investments in education and skills among
earners at the bottom of the income distribution.25
Recognizing these costs is an important and urgent
matter for public policy. But barring adoption of
severe isolationist policies, global integration will con-
tinue apace, and all cities must respond accordingly.
REDEFINING
GLOBAL CITIES
THE SEVEN TYPES
OF GLOBAL METRO
ECONOMIES
9
T E C H N O L O G I C A L C H A N G E
The information technology revolution, digitization,
and labor-saving automation are altering modes of
communication, the processes firms use to create and
deliver products and services, and the very nature of
work itself.26
The scale of these technological changes is signifi-
cant and the pace of change has been relentless. The
McKinsey Global Institute predicts that 12 emerg-
ing technologies will generate an annual economic
impact of up to $33 trillion by 2025.27 A recent
Brookings study found that many of these technolo-
gies will be developed and deployed within a set of 50
“advanced” industries, characterized by a reliance on
high levels of research and development (R&D) and
significant numbers of science, technology, engineer-
ing, and mathematics (STEM) workers.28
Advanced industries matter because they drive pro-
ductivity growth in an environment in which overall
productivity growth has been lackluster.29 The aver-
age worker in advanced industries is twice as produc-
tive as the average worker outside the sector, due
to these firms’ unique abilities to productively utilize
new technologies and platforms. This productivity dif-
ferential matters because it allows workers within the
sector to earn wages double those of workers outside
of it.30 Cities that can foster environments in which
highly productive firms and workers can thrive enjoy
the associated wage benefits.
Risks accompany these high-tech breakthroughs,
however. In the United States, a useful proxy for other
advanced economies, already demonstrated technolo-
gies have the potential to automate 45 percent of
work activities in the United States.31 Indicative of the
deployment by advanced industries of labor-saving
technology, employment in advanced industries
in U.S. cities has been flat since 1980, even while
the sector’s value-added growth has soared. And
technology-induced labor market changes are not
a challenge just for the developed world. Increased
automation in manufacturing is one reason why
developing countries are deindustrializing at much
lower levels of income. This trend suggests that
manufacturing may not provide the same on-ramp
for lower-income countries going forward, and the
economic and political consequences of this shift may
be significant.32
Especially as populations age and workforces retire,
productivity growth, rather than labor force growth,
will have to do the heavy lifting to maintain overall
economic growth, especially in developed metro
areas. In a study of 20 large national economies, the
McKinsey Global Institute estimates that, to achieve
global growth rates comparable to those experienced
over the last 50 years, productivity growth will need
to be 80 percent faster to compensate for slowing
employment growth.33 Since technology appears to
be such a critical input to worker, firm, and industry-
level productivity, cities must understand and adapt
to its impact.
These three trends underscore a new economic real-
ity for cities. For starters, urbanization has placed
developing metro areas alongside their more devel-
oped peers as the main sites for economic growth and
development. This shift means that understanding
global market currents requires an understanding
of the economic dynamics playing out in the world’s
cities. The opportunities and pressures of global
integration mean that, to deliver prosperity for their
residents, cities must proactively adapt and position
workers, industries, and communities for the upsides
of global engagement by investing in a competitive
traded sector, maintaining infrastructure connec-
tivity, and being open to global flows of capital and
talent. To manage technological change and reap the
productivity gains that will improve living standards,
cities must cultivate innovation systems, skilled
workforces, and digital infrastructure. All of these
competitiveness assets must be stewarded by good
governance and a stable business environment.34
B R O O K I N G S
M E T R O P O L I TA N
P O L I CY
P R O G RA M
1 0
A framework for regional competitiveness
Infrastructure
Enablers
Governance
Trade
Innovation TalentInnovationInnovation TalentTalentTalent
Prosperity
Source: Brookings Institution, RW Ventures, and McKinsey and
Company.
I I I . D A T A A N D M E T H O D S
D E F I N I N G A N D M E A S U R I N G
C O M P E T I T I V E N E S S FA C T O R S
Given this global environment, this report focuses on
the assets that matter for a metro economy’s com-
petitiveness. We draw on the Harvard Business School
definition of a competitive market as one in which
firms can compete successfully in the global economy
while supporting high and rising living standards for
local households.35 Competitive regions are, by this
definition, supportive environments for both compa-
nies and people.
This report draws on a five-factor competitiveness
framework—tradable clusters, innovation, talent,
infrastructure, and governance. Globally competitive
traded sectors, innovation ecosystems, and skilled
labor are the key drivers of overall productivity,
employment creation, and income growth. “Enablers”
support these drivers: well-connected infrastructure
and reliable governance, public services, and the
business environment (see box).36 Focusing on these
fundamentals positions metropolitan economies
to compete based on the distinct long-term value
their industries and people can provide, and avoids
economic strategies that attract firms through “race-
to-the-bottom” techniques that compete via one-time
tax breaks or low wages.
REDEFINING
GLOBAL CITIES
THE SEVEN TYPES
OF GLOBAL METRO
ECONOMIES
1 1
Measuring competitiveness factors
Tradable clusters: Tradable industries are a critical driver of
prosperity and competitiveness. These
industries are typically anchored by globally engaged firms,
which have valuable spillovers for local
economies. The traded sector can be measured in several ways.
We measure tradable industries using
data on greenfield foreign direct investment (i.e., investments
that bring new plants or offices), which
is inextricably bound up with traded industry clusters, and the
productivity differential (measured as
output per worker) between a metro area’s traded sector and
that traded sector nationwide.37 Due to data
limitations at the metropolitan scale, we are unable to
standardize and measure domestic investments
across industries or include data on global trade flows.
Innovation: A region’s innovative capacity and levels of
entrepreneurship both have implications
for its ability to develop and deploy commercial applications,
start new businesses, and maintain
industrial competitiveness in the face of disruptive
technological change.38 We measure innovation through
patenting, venture capital flows, and the scientific impact of
research universities.39
Talent: Human capital—the stock of knowledge, skills,
expertise, and capacities embedded in
the labor force—is of critical importance to enhancing
productivity, raising incomes, and driving
economic growth. We measure talent through the share of
population with tertiary education.40
Infrastructure connectivity: Infrastructure connectivity matters
for regional competitiveness
because firms rely upon global access, both physically and
digitally, to participate in the efficiencies
of global value chains. We measure infrastructure connectivity
through aviation passenger flows and
internet download speeds.41 Due to data limitations we are
unable to utilize standardized indicators on
other important infrastructure metrics such as the quality of
freight and logistics systems, roads, and
public transit.
Governance: Governance matters for competitiveness because
proactive government, public,
and civic groups can marshal investment from a variety of
domestic and international sources to
enable new growth strategies. Similarly, the efficiency with
which government can deliver services and
investments matters; highly fragmented metro areas tend to be
less productive than their more cohesive
counterparts. Central, provincial, and municipal governments
also have unique and complementary roles
to play in enabling firms and their wider regions to succeed in
global markets.42 However, data limitations
limit our ability to quantitatively measure governance in this
report.
S E L E C T I O N A N D D E F I N I T I O N
O F M E T R O P O L I TA N A R E A S
We deploy new, standardized metropolitan-level data
to measure these factors for 123 large metro areas.
This sample constitutes the largest metropolitan
economies in the world in 2015 at purchasing power
parity (PPP) rates for which data on these factors
were available.43 With a few exceptions, these metro
areas all tend to have economies larger than $100
billion in nominal terms. The sample’s average popula-
tion is 7.6 million. As previous studies have shown,
including Brookings’ own Global MetroMonitor and
those by the McKinsey Global Institute and the World
Bank, global growth is not solely powered by these
large metro economies; in fact, small and mid-sized
cities matter greatly.44 Data limitations, however, pre-
vent us from analyzing a larger sample of economies
B R O O K I N G S
M E T R O P O L I TA N
P O L I CY
P R O G RA M
1 2
on all these factors. Given these limitations, we focus
on the largest city-regions because they uniquely
concentrate the assets that undergird global growth.
They are the main infrastructure connection points to
second- and third-tier cities. They cluster universities,
skilled workers, and other innovation assets that yield
the positive externalities and knowledge spillovers
that generate endogenous growth.45
This study uses the general definition of a metro-
politan area as an economic region comprising one
or more cities and their surrounding areas, all linked
by economic and commuting ties (see Appendix A).
These definitions are the same as those used in previ-
ous versions of Brookings’ Global MetroMonitor. We
use the terms city, city-region, metro, metro area, and
metro economy interchangeably to describe eco-
nomic regions.
M E T R O P O L I TA N T Y P O L O G Y
A significant body of research has sought to classify
global cities and measure their economic competitive-
ness. This literature began with the seminal work of
scholars like Peter Hall, John Friedmann and, most
famously, Saskia Sassen, each of whom documented
the unique role of a select handful of cities as the
command and control centers of global finance.46
That work has since been extended. Perhaps the most
commonly known classification of global cities comes
from the research group Globalization and World
Cities (GaWC), which has provided a rich theoretical
and analytical understanding of how cities engage in
the global economy through their unique concentra-
tions of advanced services firms.47 In their capacity
as analysts and investors, multilateral institutions
like OECD and the World Bank offer valuable, rigor-
ous assessments of growth and competitiveness in
global metro areas. Greg Clark and Tim Moonen have
found more than 200 indexes that have a global cities
focus.48
In a summary of global city rankings, the Chicago
Council on Global Affairs notes “how methodologies,
definitions, data use, and conclusions vary wildly
from ranking to ranking.” It also notes “biases and
challenges common to many indexes, including the
author’s perspective, lack of reliable and interna-
tionally comparable data, and the routine presence
of lagging indicators.”49 That report concludes that
city officials and policymakers seek out assessments
based on standardized data, look beyond topline rank-
ings, and uncover comparative strengths and weak-
nesses using relevant peers as a baseline comparison.
Against the backdrop of these previous efforts, we
develop a metropolitan typology based on regional
economic characteristics and competitiveness factors.
Classifying and identifying peers allows policymakers
and stakeholders to better understand the position of
their economies in a globalized context as well as to
conduct constructive benchmarking. To select peers
we utilized a combination of principal components
analysis (PCA), k-means clustering, and agglomera-
tive hierarchical clustering.50 These commonly used
data science techniques allowed us to group metro
areas with their closest peers given a set of economic
and competitiveness indicators. We used 35 variables
in the PCA analysis (see Table 1). We do not include
change-over-time metrics in the clustering algorithm,
but analyze change variables within and across
metropolitan groupings to summarize key trends. For
more details, see Appendix A.
This report creates metropolitan groupings based
on these factors, summarizes the distinguishing
characteristics of each group, and then examines
trends within each using a range of indicators. It is
important to clarify the two ways in which we use
these data. First, we use point-in-time data to create
the metropolitan typology. Those indicators and their
vintage are outlined in Table 1. Second, we examine
change-over-time trends for these same indicators
within the analysis. The variables used to measure
competitiveness factors come from a variety of
sources, including public and private datasets, and
as a result the periods for which we can measure
key characteristics vary considerably. The analysis of
economic and industrial characteristics looks at data
between 2000 and 2015; for flows of greenfield FDI
we use data corresponding to 2009-2015; for venture
capital flows we use data for 2006-2015; for patents
we look at stock of patents between 2008 and 2012;
REDEFINING
GLOBAL CITIES
THE SEVEN TYPES
OF GLOBAL METRO
ECONOMIES
1 3
to measure impact of university research we use the
2010-2013 period; the analysis of population with
tertiary education corresponds to 2014 or latest year
available; aviation passengers uses data for 2004
and 2014; and internet average download speed
corresponds to the 2008- 2015 period. For a more
detailed description of the data sources please see
Appendix A.
Table 1. Indicators used in the clustering algorithm, 2015 or
most recent year available
Dimension Indicator Source
Economic and Industrial
Characteristics
Population, 2015 Oxford Economics, U.S. Census
Bureau
Gross domestic product, 2015 Oxford Economics, Moody's
Analytics
Gross domestic product per capita, 2015 Oxford Economics,
Moody's Analytics,
U.S. Census Bureau
Output per worker, 2015 Oxford Economics, Moody's Analytics
Industry share of overall output, 2015 Oxford Economics,
Moody's Analytics
Industry output per worker, 2015 Oxford Economics, Moody's
Analytics
Traded Clusters Greenfield foreign direct investment, 2009-
2015 fDi Intelligence data
Greenfield foreign direct investment per capita,
2009-2015
Greenfield foreign direct investment jobs
created, 2009-2015
Innovation Share of total publications in top 10 percent
cited papers, 2010-2013
Centre for Science and Technology
Studies (CWTS) and Leiden University
dataShare of total publications done with industry,
2010-2013
Total patents, 2008-2012 REGPAT
Total patents per capita, 2008-2012
Venture capital investments, millions of dollars
per 1,000 inhabitants, 2006-2015
Pitchbook
Venture capital investments, millions of dollars,
2006-2015
Talent Share of population 15+ with tertiary education,
2014 or latest year available
Oxford Economics, U.S. Census
Bureau
Infrastructure Connectivity Total aviation passengers, 2014
SABRE
Total aviation passengers per capita, 2014
Average internet download speed, 2015 Net Index
Governance Data not available across all metro areas N/A
Source: Oxford Economics, U.S. Census Bureau, Moody’s
Analytics, fDi Intelligence data, Centre for Science and
Technology
Studies (CWTS) and Leiden University data, REGPAT,
Pitchbook, and SABRE.
B R O O K I N G S
M E T R O P O L I TA N
P O L I CY
P R O G RA M
1 4
These metros concentrate economic activity because
they house the competitiveness assets required to
drive global growth. They have attracted more than
$5.4 trillion in greenfield FDI since 2009, more than
one-quarter of the global total; six of the top 10 larg-
est inflows were destined for the Asian metros of
Singapore, Shanghai, Hong Kong, Beijing, Suzhou, and
Chongqing. When controlling for population size, FDI
concentrations are still greatest in many of these Asian
metros, but smaller metro economies in North America
(Austin and Vancouver), Europe (Birmingham and
Barcelona), and Australia (Sydney) also join the top 10.
The top 123 metro economies are critical generators
of new scientific research and innovation. Together,
they account for 44 percent of the world’s most
scientifically impactful research universities, gener-
ate 65 percent of all patents, and attract 82 percent
of all venture capital. The largest patent-producing
metros are among the largest economies in the
world, including Tokyo, Seoul-Incheon, Shenzhen,
Osaka, and San Jose. However, in terms of patents
per capita a smaller set of highly innovative cities
rises to the top: San Jose, San Diego, San Francisco,
Boston, and Stuttgart. Many of these metro areas
I V. M A P P I N G T H E E C O N O M I C A S S E T S O F
G L O B A L C I T I E S
T
he world’s large metropolitan areas are notable in their
economic
primacy. With about 13 percent of the world’s people, 123 large
metro
economies generate nearly one-third of global economic output.
Nearly
all of the 123 largest metro economies studied in our analysis
generate
more than $100 billion in annual economic output (in nominal
terms), led by Tokyo
($1.6 trillion) and New York ($1.5 trillion).51
Figure 1. Global share of competitiveness factors, 123 largest
metros, 2015 or most recent
year available
Airports in
Top 50 by
Passenger Traffic
Venture
Capital
Stock
PatentsResearch
Universities
Global
Output
FDI flowGlobal
Population
86%
82%
65%
44%
32%
27%
13%
Source: Oxford Economics, U.S. Census Bureau, Moody’s
Analytics, fDi Intelligence data, Centre for Science and
Technology
Studies (CWTS) and Leiden University data, REGPAT, and
Pitchbook.
REDEFINING
GLOBAL CITIES
THE SEVEN TYPES
OF GLOBAL METRO
ECONOMIES
1 5
are also among the most educated in the world.
San Jose, San Francisco, and Boston join Singapore,
London, Washington, and Madrid as the metros with
the highest shares of their populations with tertiary
education.
These metros also concentrate much of the world’s
critical infrastructure. In 2014, airports in these metro
areas transported more than 4.9 billion air passen-
gers. The largest metro economies in the world, which
house multiple large airports, move the most avia-
tion passengers. New York, London, Shanghai, Los
Angeles, Tokyo, Beijing, Chicago, and Atlanta had the
highest passenger volumes in 2014. The 123-metro
sample contains 86 percent of the world’s 50 busiest
international airports.
T H E S E V E N T Y P E S O F
G L O B A L C I T I E S
This collective economic clout, however, masks the
significant variation in which competiveness factors
are distributed across these cities. While each met-
ropolitan economy in our sample possesses a unique
trade, innovation, talent, and infrastructure connectiv-
ity profile, the distribution of these assets reveals a
clear typology of places. We used advanced statistical
techniques to cluster metro economies based on their
size, industrial structure, and competitiveness fac-
tors. In some cases, these groupings align to specific
regions, like in China or the United States. But just as
often the groupings unite metro economies from dif-
ferent parts of the world, showcasing that they share
more in common with far-flung counterparts than
with their regional neighbors. And while we include
only point-in-time measures in the clustering algo-
rithm, the resulting groupings perform quite similarly
on growth metrics.
Map 1. Seven Types of Global Cities, 2015
123 Largest Metropolitan
Areas Groups
Factory China
Knowledge Capitals
Emerging Gateways
Asian Anchors
Global Giants
American Middleweights
International Middleweights
B R O O K I N G S
M E T R O P O L I TA N
P O L I CY
P R O G RA M
1 6
When grouped into seven metropolitan categories,
the distinct competitive positions of the world’s larg-
est metro economies become sharper, and the result
is a resource that peer metropolitan areas can utilize
for common solutions and investments to enhance
economic growth:
ä Global Giants: six large, wealthy hubs with concen-
trations of corporate headquarters; they serve as
the command and control centers for the world’s
largest advanced economies.
ä Asian Anchors: five large, business and financial
nodes anchoring inward investment into the Asia-
Pacific and Russia.
ä Emerging Gateways: 28 large business and
transportation entry points for major national and
regional emerging markets in Africa, Asia, Eastern
Europe, and Latin America.
ä Factory China: 22 second- and third-tier Chinese
cities distinctly reliant on export-intensive manu-
facturing to power economic growth and global
engagement.
ä Knowledge Capitals: 19 mid-sized, highly produc-
tive knowledge creation centers in the United
States and Europe with talented workforces and
elite research universities.
ä American Middleweights: 16 mid-sized U.S. metro
areas striving for a post-recession niche in the
global economy.
ä International Middleweights: 26 mid-sized cities
in Australia, Canada, and Europe globally con-
nected by people and investment flows, but where
growth has lagged after the financial crisis.
Table 2. Seven types of global cities, 2015
Group name Metro areas
Number of
observations
Global Giants London, Los Angeles, New York, Osaka-Kobe,
Paris, and Tokyo 6
Asian Anchors Beijing, Hong Kong, Moscow, Seoul-Incheon,
Shanghai, and Singapore 6
Emerging
Gateways
Ankara, Brasilia, Busan-Ulsan, Cape Town, Chongqing, Delhi,
East Rand,
Guangzhou, Hangzhou, Istanbul, Jinan, Johannesburg,
Katowice-Ostrava,
Mexico City, Monterrey, Mumbai, Nanjing, Ningbo, Pretoria,
Rio de Janeiro, Saint
Petersburg, Santiago, Sao Paulo, Shenzhen, Tianjin, Warsaw,
Wuhan, and Xi'an.
28
Factory China Changchun, Changsha, Changzhou, Chengdu,
Dalian, Dongguan, Foshan, Fuzhou,
Haerbin, Hefei, Nantong, Qingdao, Shenyang, Shijiazhuang,
Suzhou, Tangshan,
Wenzhou, Wuxi, Xuzhou, Yantai, Zhengzhou, and Zibo
22
Knowledge
Capitals
Atlanta, Austin, Baltimore, Boston, Chicago, Dallas, Denver,
Hartford, Houston,
Minneapolis, Philadelphia, Portland, San Diego, San Francisco,
San Jose, Seattle,
Stockholm, Washington DC, and Zurich
19
American
Middleweights
Charlotte, Cincinnati, Cleveland, Columbus, Detroit,
Indianapolis, Kansas City,
Miami, Orlando, Phoenix, Pittsburgh, Riverside, Sacramento,
San Antonio, St.
Louis, and Tampa
16
International
Middleweights
Brussels, Copenhagen-Malmö, Frankfurt, Hamburg, Karlsruhe,
Köln-Düsseldorf,
Milan, Munich, Nagoya, Rome, Rotterdam-Amsterdam,
Stuttgart, Vienna-
Bratislava, Athens, Barcelona, Berlin, Birmingham, (UK),
Kitakyushu-Fukuoka,
Madrid, Melbourne, Montreal, Perth, Sydney, Tel Aviv,
Toronto, and Vancouver
26
REDEFINING
GLOBAL CITIES
THE SEVEN TYPES
OF GLOBAL METRO
ECONOMIES
1 7
G L O B A L G I A N T S
G
lobal Giants serve as the command and con-
trol centers of the world’s largest advanced
nations. This group includes the largest cities
in the United States (New York and Los Angeles),
Japan (Tokyo and Osaka-Kobe), France (Paris), and
the United Kingdom (London). These metro areas
not only serve as the main entry points for their
extremely powerful nations, but as the world’s most
significant concentrations of wealth, corporate deci-
sion making, and international exchange.
The first characteristic that binds these metro areas
together is their size. On average, Global Giants house
19.4 million residents and generate over $1 trillion in
real output, three times more than the next largest
set of economies, the Asian Anchors. If they were a
single country, they would be the world’s third largest
economy. Beyond their overall economic clout, these
metro economies are highly productive and generate
enormous wealth. They have the second highest aver-
age nominal GDP per person ($58,000) and GDP per
worker ($116,000) among the metro groups, behind
only the Knowledge Capitals.
These wealth levels stem from the concentration of
financial and business services, which generate 41
percent of gross value added (GVA), on average, in
this group. About 20 percent of the Forbes Global
Map 2. Global Giants, 2015
Figure 2. Global Giant indicators, 2015 or most recent year
available
Download
speed
Aviation
passengers
Population
with tertiary
education
Venture
capital
investment
Patents
per capita
Scientific
research
impact
FDI
per capita
FDI stockTraded sector
productivity
differential
GDP
per worker
GDP
per capita
GDPGDP
per worker
GDP
per capita
GDP
Economic characteristics Economic growth Traded clusters
Innovation Talent Infrastructure connectivity
(+)
(-) Metro Average (n=123)(-) Metro Average (n=123)(-) Metro
Average (n=123)
Source: Oxford Economics, U.S. Census Bureau, Moody’s
Analytics, fDi Intelligence data, Centre for Science and
Technology
Studies (CWTS) and Leiden University data, REGPAT,
Pitchbook, and SABRE.
B R O O K I N G S
M E T R O P O L I TA N
P O L I CY
P R O G RA M
1 8
Table 3. Global Giants economic indicators, 2015
Cities
Population 2015
(thousands)
Nominal GDP 2015
($ millions)
Nominal GDP per capita
2015 ($)
Tokyo 37,004 1,623,904 43,884
New York 20,182 1,492,242 73,938
Los Angeles 13,340 927,562 69,532
London 14,855 831,100 55,947
Paris 12,524 818,522 65,354
Osaka-Kobe 18,640 680,997 36,535
Global Giants Average 19,424 1,062,388 57,532
Source: Oxford Economics, U.S. Census Bureau, and Moody’s
Analytics.
Figure 3. Average metropolitan gross domestic product, 2015
American
Middleweights
Factory
China
International
Middleweights
Emerging
Gateways
Knowledge
Capitals
Asian
Anchors
Global Giants
$148,797
$205,657$234,238
$264,926$282,801
$668,056
$1,062,388
Source: Oxford Economics and Moody’s Analytics.
Figure 4. Gross value added by type of service, 2015
Other Sectors
Business,
Financial,
Professional
Services
Factory
China
Emerging
Gateways
American
Middleweights
International
Middleweights
Knowledge
Capitals
Asian
Anchors
Global
Giants
88%
74%
69%68%
64%
60%59%
12%
26%
31%32%36%
40%41%
Source: Oxford Economics, U.S. Census Bureau, and Moody’s
Analytics.
REDEFINING
GLOBAL CITIES
THE SEVEN TYPES
OF GLOBAL METRO
ECONOMIES
1 9
2000 and 18 percent of global firms with more than
$1 billion in revenue, plus five of the world’s seven
largest stock exchanges by market capitalization, are
headquartered in these six markets. Dense clusters of
advanced-producer-services firms in law, accounting,
management consulting, and advertising have formed
to support the complex decision making occurring in
the financial markets and board rooms of multina-
tional firms.53
These are also the world’s major nodes for flows of
people, capital, and knowledge. In 2014, over 800
million aviation passengers traveled through these
markets, by far the highest total of any grouping.
Global travelers often stay to live and work; a little
under one in six residents of a Global Giant is foreign
born.54 Capital flows seamlessly through Global Giants.
Foreign investors parked an average of $25 billion in
these markets between 2009 and 2015, the second
highest after the Asian Anchors. Finally, knowledge
creation is increasingly a major function of these
metro economies. Among the seven types of metro
areas, Global Giants have the highest education levels,
the second highest patenting rates, and the second
highest share of high-impact scientific publications
in their universities. Every metro area except Osaka
is among the top 15 globally in terms of digital data
flows.55 And venture capital investment data reveal
that they are also sites for budding entrepreneurship,
especially London and New York.56
By nearly every measure these cities are globally inte-
grated and fluent. Saskia Sassen mainstreamed the
phrase “global city” in her 1991 book about London,
New York, and Tokyo. The world’s mobile talent and
capital seek them out, and they have benefited from
multiple cycles of high demand.57 Paris is regularly
cited in this class of global city, but Los Angeles and
Osaka may be more surprising additions given that
they are not generally considered among the world’s
leading financial hubs. However, they loom large
on the global stage by dint of their shear economic
weight—Los Angeles and Osaka are the fifth and sixth
largest metro economies in the world, respectively.
B R O O K I N G S
M E T R O P O L I TA N
P O L I CY
P R O G RA M
2 0
A S I A N A N C H O R S
A
sian Anchors include five Pacific-facing metro
areas—Beijing, Hong Kong, Seoul-Incheon,
Shanghai, and Singapore— as well as Moscow,
which, while more aligned with Europe, falls in this
group due to its similarity in size, wealth, and reliance
on business and financial services with many of these
Asian metro economies.58 Asian Anchors have many
of the same characteristics as their established coun-
terparts in Europe, Japan, and the United States, but
are not yet as wealthy and globally connected.
The rise of the metros in this group has everything to
do with the rise of Asia. The ascent of the Asian Tiger
economies followed by the gradual liberalization of
China and Russia positioned these cities as the gate-
ways between the global investment community and
their fast-growing nations. Those foreign investment
streams brought new industries and capabilities to
many of these cities, which have since been bolstered
by local investments in infrastructure and skills.
Asian Anchors are now among the cities with the larg-
est concentrations of people and market activity in the
Map 3. Asian Anchors, 2015
Figure 5. Asian Anchors indicators, 2015 or most recent year
available
Download
speed
Aviation
passengers
Population
with tertiary
education
Venture
capital
investment
Patents
per capita
Scientific
research
impact
FDI
per capita
FDI stockTraded sector
productivity
differential
GDP
per worker
GDP
per capita
GDPGDP
per worker
GDP
per capita
GDP
Economic characteristics Economic growth Traded clusters
Innovation Talent Infrastructure connectivity
(+)
(-) Metro Average (n=123)(-) Metro Average (n=123)(-) Metro
Average (n=123)
Source: Oxford Economics, U.S. Census Bureau, Moody’s
Analytics, fDi Intelligence data, Centre for Science and
Technology
Studies (CWTS) and Leiden University data, REGPAT,
Pitchbook, and SABRE.
REDEFINING
GLOBAL CITIES
THE SEVEN TYPES
OF GLOBAL METRO
ECONOMIES
2 1
world. These metros have an average population
of 16.1 million residents and an average GDP of
$668 billion, the second largest figures among the
seven groups. GDP per capita in these regions has
grown by a robust 4.2 percent per year since 2000.
On average residents of the Asian Anchors are now
firmly rooted in the global middle class. Interestingly,
this average masks significant differences in nominal
GDP per capita among the wealthiest metros in this
group, Singapore ($84,000) and Hong Kong ($57,000),
and the lowest-income metros, Shanghai ($33,000)
and Beijing ($30,000). In line with convergence theory,
the lower-income city-regions in this group have seen
the fastest income growth since 2000.
Despite their disparities in wealth, several character-
istics bind this group, especially the five Asian metro
areas. First, the generous inflows of FDI distinguish
these regions from the rest of the world. On average,
$46 billion in greenfield FDI entered each of these
markets between 2009 and 2015, nearly double the
average of the next highest grouping. No metro areas
in the world attracted more FDI than Hong Kong
and Singapore during this period, and Beijing and
Shanghai were not far behind. These cities provide a
distinct value proposition for foreign investment: they
afford access to a rapidly growing Asian consumer
market; they provide strong infrastructure connec-
tivity—Asian Anchors rank second in total aviation
Table 4. Asian Anchors economic indicators, 2015
Cities
Population 2015
(thousands)
Nominal GDP 2015
($ millions)
Nominal GDP per capita
2015 ($)
Seoul-Incheon 25,095 903,466 36,002
Shanghai 24,768 809,507 32,684
Moscow 12,194 749,686 61,482
Beijing 21,876 663,590 30,335
Singapore 5,546 468,087 84,399
Hong Kong 7,295 413,999 56,751
Asian Anchors Average 16,129 668,056 50,276
Source: Oxford Economics.
Figure 6. Greenfield foreign direct investment in metropolitan
groups (millions of $US), 2009-2015
American
Middleweights
Knowledge
Capitals
Factory
China
International
Middleweights
Emerging
Gateways
Global
Giants
Asian
Anchors
$2,414
$4,671$5,894
$8,681
$10,823
$25,417
$45,966
Source: Brookings analysis of fDi Intelligence and Oxford
Economics data.
B R O O K I N G S
M E T R O P O L I TA N
P O L I CY
P R O G RA M
2 2
passengers, behind Global Giants, and first in average
internet download speed and relatively well-educated
workforces; and they offer a more conducive regula-
tory and political environment than many peers in the
region.59 It is notable that Moscow has not kept pace
with the other Asian metros in this category in regard
to FDI attraction.
These metro areas, along with Tokyo and Osaka-
Kobe, are where Asia’s business gets done. About 32
percent of gross value added in these six metros is
generated by financial and business services, 10 per-
cent of Global 2000 firms are headquartered in these
markets, and major stock exchanges are located in
Shanghai, Hong Kong, and Seoul. Singapore is a sig-
nificant financial trading hub in its own right. And 41
percent of Moscow’s GVA is in financial and business
services.
Yet, labor productivity in this sector is only about one-
third as high as in Global Giants, revealing that much
work needs to be done to move further up the value-
added chain. These metro areas are not yet on par
with their Western counterparts in terms of patenting
intensity or the scientific impact of their universities,
although they can be considered the innovation hubs
of their respective countries. Beijing and Shanghai
together generate 23 percent of China’s patents,
Moscow generates 55 percent of Russia’s, and Seoul-
Incheon generates 67 percent of South Korea’s.
Patents per capita increased by 78 percent across
Asian Anchors between 2007 and 2012. And the share
of scientific publications generated in these markets
that can be considered high-impact increased by 18
percent between 2009 and 2013, the second fastest
increase among the seven groupings.
REDEFINING
GLOBAL CITIES
THE SEVEN TYPES
OF GLOBAL METRO
ECONOMIES
2 3
E M E R G I N G G AT E WAY S
E
merging Gateways are 28 large metropolitan
areas from developing economies that serve
as the business, transportation, and oftentimes
political centers of their countries and regions. Nearly
one-third of the cities in this group are the official
capital of their respective countries (e.g., Ankara,
Brasilia, Cape Town, Mexico City, Pretoria, Santiago,
and Warsaw). In fact, eight of the metropolitan
areas in this group serve as the financial centers of
their countries and house the largest national stock
exchange. Many of these cities served as the focal
point of their national economies as the countries
liberalized their markets for flows of trade, invest-
ment, and people at the end of the 20th century.60
Additionally some of these cities also serve as
gateways for entire regions, as is the case for São
Paulo in financial and business services within South
America61; Istanbul connecting the Middle East and
Europe; Johannesburg as the business hub of sub-
Saharan Africa; and Shenzhen as a major complemen-
tary business hub in China to Beijing, Hong Kong, and
Shanghai.62
Map 4. Emerging Gateways, 2015
Figure 7. Emerging Gateways indicators, 2015 or most recent
year available
Download
speed
Aviation
passengers
Population
with tertiary
education
Venture
capital
investment
Patents
per capita
Scientific
research
impact
FDI
per capita
FDI stockTraded sector
productivity
differential
GDP
per worker
GDP
per capita
GDPGDP
per worker
GDP
per capita
GDP
Economic characteristics Economic growth Traded clusters
Innovation Talent Infrastructure connectivity
(+)
(-) Metro Average (n=123)(-) Metro Average (n=123)(-) Metro
Average (n=123)
Source: Oxford Economics, U.S. Census Bureau, Moody’s
Analytics, fDi Intelligence data, Centre for Science and
Technology
Studies (CWTS) and Leiden University data, REGPAT,
Pitchbook, and SABRE.
B R O O K I N G S
M E T R O P O L I TA N
P O L I CY
P R O G RA M
24
Metropolitan areas in this group house on aver age
10 million inhabitants and have an average GDP
of $265 billion, with some megacities boasting
economies of more than $400 billion (São Paulo,
Guangzhou, Shenzhen, Mexico City, Tianjin, Istanbul,
and Chongqing). The average inhabitant of these
metro areas entered the global middle class over
the past 15 years. Real GDP per capita in Emerging
Gateways has grown 5.5 percent annually since 2000
(second fastest after Factory China metros). Nominal
GDP per capita now stands at around $28,000. Asian
metro areas in this group experienced greater GDP
per capita gains (8.1 percent annually) between 2000
and 2015 than did their Latin American (3.2 percent)
and African counterparts (3.6 percent).
Table 5. Emerging Gateways economic indicators, 2015
Cities
Population 2015
(thousands)
Nominal GDP 2015
($ millions)
Nominal GDP per
capita 2015 ($)
Sao Paulo 21,175 579,473 27,366
Guangzhou 13,155 523,554 39,800
Shenzhen 10,816 490,761 45,374
Mexico City 21,099 485,621 23,017
Tianjin 15,646 477,808 30,538
Istanbul 14,627 449,388 30,723
Chongqing 30,159 425,472 14,108
Delhi 23,513 396,449 16,861
Wuhan 10,261 323,517 31,529
Busan-Ulsan 7,812 305,931 39,160
Hangzhou 8,922 274,969 30,820
Nanjing 8,245 271,934 32,983
Rio de Janeiro 12,172 233,238 19,162
Ningbo 7,724 233,000 30,166
Mumbai 21,799 221,192 10,147
Santiago 7,300 213,908 29,303
Jinan 7,066 174,317 24,671
Warsaw 2,901 164,068 56,564
Xi’an 8,606 160,578 18,658
Brasilia 4,076 159,587 39,150
Saint Petersburg 5,190 158,084 30,459
Monterrey 4,404 140,512 31,906
Katowice-Ostrava 5,008 136,218 27,200
Ankara 5,226 133,934 25,630
Johannesburg 4,725 94,096 19,913
Cape Town 3,976 66,599 16,750
East Rand 3,306 62,492 18,904
Pretoria 3,200 61,240 19,141
Emerging Gateways Average 10,432 264,926 27,857
Source: Oxford Economics.
REDEFINING
GLOBAL CITIES
THE SEVEN TYPES
OF GLOBAL METRO
ECONOMIES
2 5
These regions disproportionately concentrate their
nation’s competitiveness assets. All the cities in
this group have a higher share of their working-age
population with tertiary education compared to their
national economies. Many are home to their nation’s
only globally relevant research universities. Cities like
Istanbul, Santiago, São Paulo, and Shenzhen account
for more than 40 percent of all the patents produced
in their countries. Business, professional, and techni-
cal services accounted for 25 percent of total output
in these metro areas. However, the productivity of the
average worker in this sector is one fifth that of their
peer metros in the Knowledge Capitals, Global Giants,
and American Middleweight group.
Emerging Gateways are the entry points for global
flows of people and capital. They typically house the
best-connected international airports of their nations.
In 2014 all the airports in these metropolitan areas
transported 800 million passengers, up from the 273
million in 2004. In fact, the average metro, which in
2014 transported 28 million passengers per year, up
from 9 million passengers in 2004, registered the
second fastest annual passenger growth rate—3.5
percent—among all groups, behind only Factory China.
Metropolitan areas in this group received FDI flows
of $58 billion between 2009 and 2015, but on a per
capita basis these investment flows trail most of the
other metro groups. They are not yet on par with the
Global Giants in terms of international business or
with Knowledge Capitals in terms of global innovation,
although their prominence is growing quickly. FDI
flows doubled between 2011 and 2015, and the stock
of venture capital investment grew by 300 percent,
from $4.3 billion in 2010 to $14.1 billion in 2015.
Figure 8. Output per worker in business, financial, and
professional services in metropolitan groups,
(thousands of real USD), 201563
Emerging Gateways
Asian Anchors
International Middleweights
American Middleweights
Global Giants
Knowledge Capitals
53
66
158
229
248
254
Source: Brookings analysis of Oxford Economics data.
Figure 9. Aviation passengers compound annual growth in
metropolitan groups, 2004-2014
American Middleweights
Knowledge Capitals
Global Giants
International Middleweights
Asian Anchors
Emerging Gateways
Factory China
0.2%
0.3%
0.4%
1.0%
2.3%
3.5%
7.1%
Source: Brookings analysis of SABRE data.
B R O O K I N G S
M E T R O P O L I TA N
P O L I CY
P R O G RA M
2 6
FA C T O R Y C H I N A
F
actory China comprises Chinese manufacturing
hubs, and the 22 cities are a good represen-
tation of the geographic diversity of China’s
industrial revolution. Factory China includes metros
on China’s east coast (Hefei and Nantong), inland
regions (Chengdu and Zibo), and the Pearl River Delta
(Foshan and Dongguan).64
The metro areas in Factory China are second- and
third-tier population centers that are growing quickly.
The typical city in this group has an average popula-
tion of 8 million and a nominal GDP of $205 billion.
Output and employment have grown in these met-
ros by an outstanding 12.6 and 4.7 percent annually
between 2000 and 2015, the fastest pace among
our seven groups. Real GDP per capita has expanded
fivefold since 2000, from $2,500 to $12,000, rooting
these metros firmly in the global middle class.
Map 5. Factory China, 2015
Figure 10. Factory China indicators, 2015 or most recent year
available
Download
speed
Aviation
passengers
Population
with tertiary
education
Venture
capital
investment
Patents
per capita
Scientific
research
impact
FDI
per capita
FDI stockTraded sector
productivity
differential
GDP
per worker
GDP
per capita
GDPGDP
per worker
GDP
per capita
GDP
Economic characteristics Economic growth Traded clusters
Innovation Talent Infrastructure connectivity
(+)
(-) Metro Average (n=123)(-) Metro Average (n=123)(-) Metro
Average (n=123)
Source: Oxford Economics, U.S. Census Bureau, Moody’s
Analytics, fDi Intelligence data, Centre for Science and
Technology
Studies (CWTS) and Leiden University data, REGPAT,
Pitchbook, and SABRE.
REDEFINING
GLOBAL CITIES
THE SEVEN TYPES
OF GLOBAL METRO
ECONOMIES
2 7
The most salient feature of this group is the extreme
reliance on manufacturing, which accounts for nearly
40 percent of total output in the typical Factory China
city, the highest among all groups. In fact, Factory
China cities were more manufacturing-intensive in
2015 than they were in 2000, when manufacturing
accounted only for 30 percent of their GDP. With only
25 percent of national population, Factory China met-
ros generate one-third ($800 billion) of China’s total
manufacturing value added.
Factory China metro areas plug into the global econ-
omy as nodes in international manufacturing supply
chains, typically providing goods to wealthier con-
sumer markets in advanced economies. Multinational
corporations like Unilever (operating in Hefei),
Goodyear (Dalian), Samsung (Dongguan), DuPont
(Dongguan and Changshu), Intel (Dalian), Pfizer
(Dalian and Hangzhou), and Dell (Chengdu) anchor
manufacturing operations in Factory China.65 This
specialization has proved effective in building wealth
and moving millions of Chinese households into
the global middle class. But growth has come with
significant environmental costs. The heavy industrial
Table 6. Factory China economic indicators, 2015
Cities
Population 2015
(thousands)
Nominal GDP 2015
($ millions)
Nominal GDP per
capita 2015 ($)
Suzhou 10,658 440,255 41,306
Chengdu 14,407 306,458 21,272
Wuxi 6,526 269,957 41,368
Qingdao 9,054 265,789 29,357
Changsha 7,308 245,571 33,604
Dalian 6,942 245,161 35,317
Foshan 7,424 234,737 31,620
Shenyang 8,257 230,103 27,869
Zhengzhou 9,203 209,690 22,784
Tangshan 7,803 190,743 24,446
Dongguan 8,466 186,042 21,976
Yantai 7,057 183,501 26,003
Nantong 7,357 169,781 23,079
Changchun 7,601 162,933 21,435
Fuzhou 7,444 159,572 21,437
Haerbin 10,669 159,238 14,926
Hefei 6,043 156,989 25,979
Shijiazhuang 10,644 156,264 14,681
Xuzhou 8,660 149,682 17,284
Changzhou 4,727 147,281 31,155
Wenzhou 9,275 131,441 14,172
Zibo 4,633 123,273 26,608
Factory China Average 8,189 205,657 25,804
Source: Oxford Economics.
B R O O K I N G S
M E T R O P O L I TA N
P O L I CY
P R O G RA M
2 8
activity has resulted in pollutant levels that are 40
times above what the World Health Organization
recommends, and 40 percent of China’s rivers are
polluted.66
Currently, business, financial, and professional ser-
vices—economic activities typically associated with
urban agglomeration—account for only 12 percent of
total output in this group, well below the average of
32 percent for the other groups. The lack of economic
diversification partly explains why cities in this cluster
rank last in flows of FDI, venture capital attraction,
and international passengers. Additionally, only 13 of
the cities in this group house a top-ranked research
university. Factory China metros file only 0.03 patents
per 10,000 employees, and less than 10 percent of the
population 15 years or older has tertiary education.
Figure 11. Manufacturing share of real gross value added in
metropolitan groups, 2015
Global Giants
American Middleweights
Knowledge Capitals
International Middleweights
Asian Anchors
Emerging Gateways
Factory China
10.1%
10.7%
12.4%
14.5%
17.4%
23.7%
39.5%
Source: Brookings analysis of Oxford Economics and Moody’s
Analytics data.
“Factory China metro areas plug into the global
econ omy as nodes in international manufacturing
supply chains, typically providing goods to wealthier
con sumer markets in advanced economies.”
REDEFINING
GLOBAL CITIES
THE SEVEN TYPES
OF GLOBAL METRO
ECONOMIES
2 9
K N O W L E D G E C A P I TA L S
K
nowledge Capitals tend to be mid-sized
population centers that are among the
wealthiest and most productive in the world.
This group of 19 metropolitan economies has an
average population of 4.2 million, the second smallest
group by population. But because they are so
productive, these metro areas have the third highest
average economic output ($283 billion) and the
highest nominal GDP per capita ($69,000) and GDP
per worker ($136,000) of any group.
Map 6. Knowledge Capitals, 2015
Figure 12. Knowledge Capitals indicators, 2015 or most recent
year available
Download
speed
Aviation
passengers
Population
with tertiary
education
Venture
capital
investment
Patents
per capita
Scientific
research
impact
FDI
per capita
FDI stockTraded sector
productivity
differential
GDP
per worker
GDP
per capita
GDPGDP
per worker
GDP
per capita
GDP
Economic characteristics Economic growth Traded clusters
Innovation Talent Infrastructure connectivity
(+)
(-) Metro Average (n=123)(-) Metro Average (n=123)(-) Metro
Average (n=123)
Source: Oxford Economics, U.S. Census Bureau, Moody’s
Analytics, fDi Intelligence data, Centre for Science and
Technology
Studies (CWTS) and Leiden University data, REGPAT,
Pitchbook, and SABRE.
B R O O K I N G S
M E T R O P O L I TA N
P O L I CY
P R O G RA M
3 0
Knowledge Capitals are the world’s leading knowl-
edge creation centers. They compete in the highest
value-added segments of the economy, relying on
their significant stock of human capital, innovative
universities and entrepreneurs, and relatively sound
infrastructure connectivity.
These places are supremely well educated: 41 per-
cent of their 15-and-over population has obtained a
college degree. Many of these are graduates from the
elite research universities that anchor these metro
economies’ distinct positions in science and technol-
ogy. Universities in this group boast the largest share
of highly cited scientific publications. Of the 100 most
scientifically impactful universities in the world, 20
are located in these cities.
Scientific research tends to translate to new inven-
tions in these regions, which have the highest average
rates of patenting in the world. With only about 1
percent of the world’s population, Knowledge Capitals
generated 16 percent of global patents between 2008
and 2012; shares were even higher in information
technology (22 percent) and life sciences (19 per-
cent). Led by San Jose, San Francisco, and Boston,
Knowledge Capitals also have, by far, the highest ven-
ture capital investment rates per capita in the world.
More than half of all global venture capital funding
flowed to these 19 markets over the past decade.
Finally, controlling for their population size, these
metro economies have the greatest volume of avia-
tion passengers in the world, signifying the substan-
tial flows of business and leisure travelers flocking
Table 7. Knowledge Capitals economic indicators, 2015
Cities
Population 2015
(thousands)
Nominal GDP 2015
($ millions)
Nominal GDP per
capita 2015 ($)
Chicago 9,551 582,496 60,988
Houston 6,657 505,218 75,893
Dallas 7,103 458,043 64,488
Washington 6,098 454,088 74,469
San Francisco 4,656 375,055 80,551
Boston 4,774 370,731 77,651
Philadelphia 6,070 363,644 59,910
Atlanta 5,711 310,822 54,427
Seattle 3,734 285,634 76,504
Minneapolis 3,525 227,417 64,523
San Diego 3,300 217,562 65,938
San Jose 1,977 180,757 91,437
Denver 2,814 179,882 63,916
Baltimore 2,797 178,121 63,673
Stockholm 2,615 167,911 64,223
Portland, Ore. 2,389 159,219 66,640
Zurich 1,972 135,596 68,761
Austin 2,001 119,234 59,591
Hartford 1,211 101,787 84,029
Knowledge Capitals 4,155 282,801 69,348
Source: Oxford Economics, U.S. Census Bureau, and Moody’s
Analytics.
REDEFINING
GLOBAL CITIES
THE SEVEN TYPES
OF GLOBAL METRO
ECONOMIES
3 1
to these places. However, foreign direct investment
inflows are not as substantial as in other groupings,
revealing that, for all their assets, many of these mid-
sized metros must proactively assert their visibility in
the global marketplace.
Knowledge Capitals overwhelmingly are located in
the United States. All but two (Stockholm and Zurich)
are U.S. cities, including well-known coastal innova-
tion hubs like Boston, San Francisco, San Jose, and
Seattle. But they also include metro economies in the
Midwest (Chicago, Minneapolis-St. Paul) and the South
(Atlanta, Austin, Dallas, Houston), which now tend to
compete in technology-intensive advanced industries
across both manufacturing and services.67 Stockholm
and Zurich represent two of Europe’s wealthiest and
most productive economies, specializing in profes-
sional, scientific, and technical services; finance; and
information technology. Overall, output per worker in
these metro areas is 9 percent higher than in the next
most productive metro grouping.
Not only are Knowledge Capitals more productive
than the rest of their advanced economy peers, but
the gap is widening. Between 2000 and 2015, growth
in annual GDP per capita and GDP per worker aver-
aged 0.9 and 1.4 percent, respectively, in Knowledge
Capitals. This is by no means a blistering pace, but
these growth rates are 37 percent and 69 percent
faster, respectively, then average growth rates across
the other three developed-economy groupings.
Figure 13. Global Share of innovation assets in Knowledge
Capital metros, 2015 or most recent
year available
Venture CapitalPatentsTop 750 Research
Universities
Population
50%
16%
6%
1%
Source: Brookings analysis of Oxford Economics, U.S. Census
Bureau, Centre for Science and Technology Studies (CWTS)
and Leiden University, REGPAT, and Pitchbook.
“Knowledge Capitals are the world’s leading
knowl edge creation centers. They compete in
the highest value-added segments of the economy,
relying on their significant stock of human capital,
innovative universities and entrepreneurs, and
relatively sound infrastructure connectivity.”
B R O O K I N G S
M E T R O P O L I TA N
P O L I CY
P R O G RA M
3 2
A M E R I C A N
M I D D L E W E I G H T S
S
ixteen cities form the American Middleweights.
Metropolitan areas in this group are almost
evenly divided between mid-sized production cen-
ters in America’s North and East (Cincinnati, Cleveland,
Pittsburgh, Indianapolis, Detroit) and Southern
cities that have experienced significant population
growth (Miami, Phoenix, Orlando, St. Louis, Tampa,
Sacramento). The average metropolitan area has 3
million inhabitants, generates $149 billion in nominal
output, and has a nominal GDP per capita of $52,000.
Growth in overall output (1.6 percent), GDP per capita
(0.4 percent), and employment (0.7 percent) has
lagged most other metro groupings between 2000
and 2015, perhaps due partly to the high concen-
tration of non-traded clusters in their economies.
American Middleweights have the highest concen-
tration of local services (health care, real estate,
education, and public services), accounting for 28
percent of output and 42 percent of employment.
Moreover, their tradable industries tend to be less
productive than national averages. While many of
the cities in this group are still finding their global
niche, they all maintain at least one globally relevant
Map 7. American Middleweights, 2015
Figure 14. American Middleweights indicators, 2015 or most
recent year available
Download
speed
Aviation
passengers
Population
with tertiary
education
Venture
capital
investment
Patents
per capita
Scientific
research
impact
FDI
per capita
FDI stockTraded sector
productivity
differential
GDP
per worker
GDP
per capita
GDPGDP
per worker
GDP
per capita
GDP
Economic characteristics Economic growth Traded clusters
Innovation Talent Infrastructure connectivity
(+)
(-) Metro Average (n=123)(-) Metro Average (n=123)(-) Metro
Average (n=123)
Source: Oxford Economics, U.S. Census Bureau, Moody’s
Analytics, fDi Intelligence data, Centre for Science and
Technology
Studies (CWTS) and Leiden University data, REGPAT,
Pitchbook, and SABRE.
REDEFINING
GLOBAL CITIES
THE SEVEN TYPES
OF GLOBAL METRO
ECONOMIES
3 3
export sector. For instance, Charlotte, Detroit, and
Phoenix are among the leading metro exporters of
engine and power equipment, motor vehicles, and
semiconductors, respectively. As a group, American
Middleweights increased their exports by 1.9 percent
per year between 2008 and 2014, slightly below the
national average of 2.4 percent in the same period.68
The prevalence of local services accentuated the
impact of the 2008 economic and financial crisis,
particularly in Sunbelt cities that relied heavily on
construction and real estate development to power
economic growth.69 Between 2008 and 2010 the
construction sector shrank 11 percent per year, the
highest drop among all the groups, while the average
home lost 29 percent of its value between 2008 and
2012.70 Cities like Detroit, Miami, Orlando, and Phoenix
saw home price declines of more than 30 percent.
Table 8. American Middleweights economic indicators, 2015
Cities
Population 2015
(thousands)
Nominal GDP 2015
($ millions)
Nominal GDP per
capita 2015 ($)
Miami 6,012 282,514 46,989
Detroit 4,302 218,080 50,692
Phoenix 4,575 214,809 46,958
Riverside 4,489 167,864 37,393
St. Louis 2,812 146,024 51,937
Pittsburgh 2,353 141,339 60,066
Tampa 2,975 140,263 47,144
Charlotte 2,426 131,636 54,253
Sacramento 2,274 126,103 55,449
Orlando 2,387 125,898 52,740
Cleveland 2,061 117,493 57,013
Cincinnati 2,158 115,552 53,553
Indianapolis 1,989 114,936 57,791
San Antonio 2,384 113,910 47,779
Columbus 2,022 113,875 56,328
Kansas City 2,087 110,456 52,914
American Middleweights 2,957 148,797 51,812
Source: U.S. Census Bureau and Moody’s Analytics.
“American Middleweights
have a base of educated
workers, research
universities and hospitals,
and trad able clusters.
Aligning these assets
to improve export
competitiveness through
coordinated economic
strat egies will be critical
if these metros are
to compete in global
markets.”
B R O O K I N G S
M E T R O P O L I TA N
P O L I CY
P R O G RA M
3 4
Figure 15a. Share of output in traded sectors in metropolitan
groups, 2015
American Middleweights
International Middleweights
Knowledge Capitals
Global Giants
Asian Anchors
Emerging Gateways
Factory China
51%
54%
57%
57%
60%
61%
69%
Figure 15b. Share of output in local services in metropolitan
groups, 2015
Factory China
Asian Anchors
Emerging Gateways
Global Giants
Knowledge Capitals
International Middleweights
American Middleweights
10%
13%
17%
22%
24%
25%
28%
Source: Oxford Economics, U.S. Census Bureau, Moody’s
Analytics, fDi Intelligence data, Centre for Science and
Technology
Studies (CWTS) and Leiden University data, REGPAT,
Pitchbook, and SABRE.
At the same time, the manufacturing sector—once the
engine of export-led growth in places like Cleveland,
Detroit and St. Louis—has seen its share of output and
employment decline relative to other sectors of the
economy.71 Due to automation and strong competition
from abroad, manufacturing employment declined 2.1
percent annually since 2000. Today, manufacturing
accounts only for 7 percent of total employment in
this group.
American Middleweights have assets, however. They
house well-regarded research universities. Cities in
this group ranked third among all other groups in the
share of scientific publications in the top 10 percent of
most-cited academic journals. Additionally, one-third of
the working-age population in these markets boasts a
tertiary degree, ranking it fourth among all groups. The
combination of a highly skilled labor force and world-
class research universities is also strengthened by ven-
ture capital per capita, an indicator on which American
Middleweights ranked third among all their peers.
REDEFINING
GLOBAL CITIES
THE SEVEN TYPES
OF GLOBAL METRO
ECONOMIES
3 5
I N T E R N AT I O N A L
M I D D L E W E I G H T S
I
nternational Middleweights include a diverse group
of wealthy cities in Canada (Toronto, Vancouver),
Europe (Brussels, Berlin, Munich, Rome, Milan,
Munich), Asia (Kitakyushu-Fukuoka, Nagoya, Tel
Aviv), and Australia (Sydney, Melbourne). These 26
metros have an average population of 4.8 million,
output of $234 billion, and nominal GDP per capita
of $49,000, fifth among our groups.
International Middleweights are the most varied
group of metro economies. Cities like Toronto, Sydney,
Frankfurt, Madrid, and Copenhagen play a fundamental
role in the provision of business and financial services
in their national and regional economies. In parallel,
industrial centers such as Kitakyushu-Fukuoka, Nagoya,
Stuttgart, Karlsruhe, Milan, and Barcelona gener-
ate significant levels of manufacturing value added
in Japan, Germany, and Southern Europe, respec-
tively. Most have diversified tradable sectors that
tend to specialize in knowledge services, advanced
manufacturing, or some combination of both.
Map 8. International Middleweights, 2015
Figure 16. International Middleweights indicators, 2015 or most
recent year available
Download
speed
Aviation
passengers
Population
with tertiary
education
Venture
capital
investment
Patents
per capita
Scientific
research
impact
FDI
per capita
FDI stockTraded sector
productivity
differential
GDP
per worker
GDP
per capita
GDPGDP
per worker
GDP
per capita
GDP
Economic characteristics Economic growth Traded clusters
Innovation Talent Infrastructure connectivity
(+)
(-) Metro Average (n=123)(-) Metro Average (n=123)(-) Metro
Average (n=123)
Source: Oxford Economics, U.S. Census Bureau, Moody’s
Analytics, fDi Intelligence data, Centre for Science and
Technology
Studies (CWTS) and Leiden University data, REGPAT,
Pitchbook, and SABRE.
B R O O K I N G S
M E T R O P O L I TA N
P O L I CY
P R O G RA M
3 6
Several shared characteristics bind International
Middleweights. First, they are globally connected by
migration and capital flows. About 22 percent of the
population in these cities is foreign born, the high-
est share among any cluster. Similarly, these met-
ros boast the second highest level of foreign direct
investment per capita, with almost $2,000 dollars
of FDI stock per inhabitant. These metros are well-
educated (33 percent of the working-age population
has tertiary education), house elite universities (the
highest number of research universities of any group
on both an absolute and per capita basis), and gener-
ate new knowledge (third highest rate of patenting
intensity).
Table 9. International Middleweights economic indicators, 2015
Cities
Population 2015
(thousands)
Nominal GDP 2015
($ millions)
Nominal GDP per
capita 2015 ($)
Köln- Düsseldorf 11,488 548,379 47,735
Rotterdam-Amsterdam 7,146 397,399 55,610
Milan 7,722 380,609 49,286
Nagoya 9,049 377,075 41,672
Madrid 6,586 315,507 47,905
Toronto 6,124 292,432 47,750
Brussels 5,540 290,522 52,445
Frankfurt 4,483 270,396 60,321
Munich 3,981 265,693 66,739
Sydney 4,916 251,254 51,115
Rome 4,468 207,502 46,444
Vienna-Bratislava 3,822 200,062 52,341
Barcelona 4,711 197,889 42,010
Melbourne 4,527 197,774 43,690
Kitakyushu-Fukuoka 5,563 194,550 34,970
Stuttgart 3,166 193,143 61,013
Hamburg 3,188 186,506 58,499
Berlin 4,314 185,910 43,100
Karlsruhe 3,056 159,066 52,050
Montreal 4,058 157,734 38,872
Copenhagen-Malmö 3,045 151,041 49,610
Tel Aviv 3,699 144,875 39,162
Perth 2,080 139,282 66,959
Athens 3,844 138,715 36,082
Birmingham (UK) 3,869 132,439 34,233
Vancouver 2,502 114,447 45,738
International Middleweights Average 4,883 234,238 48,667
Source: Oxford Economics.
REDEFINING
GLOBAL CITIES
THE SEVEN TYPES
OF GLOBAL METRO
ECONOMIES
3 7
For International Middleweights, unfortunately,
another characterization they share is sluggish
economic growth. Between 2000 and 2015, output,
GDP per capita, and employment grew 1.6, 0.7, and
1.0 percent annually, each the slowest of any group.
The solid economic growth of metropolitan areas
in Australia (Perth, Sidney, and Melbourne), Canada
(Toronto and Vancouver), and Israel (Tel Aviv), whose
metro economies posted real output growth rates of
3 percent on average, contrasts starkly with the 1.1
percent experienced by their metropolitan peers in
Europe. Further, the international financial crisis of
2008-2009 divides the economic trajectory of this
group of cities. Output, GDP per capita, and employ-
ment all grew faster in the 2000-2007 period than in
the following years. As a result, 12 cities in this group
have yet to return to their pre-crisis GDP per capita
levels and five cities have yet to regain their pre-crisis
employment base. Further, in half of these markets,
employment was lower in 2015 than in 2005, reflect-
ing both a demographic transition as well as lower
participation in the labor market.
Figure 17: Total number of world ranked research universities
in metropolitan groups, 2010-2013
American Middleweights
Factory China
Global Giants
Asian Anchors
Knowledge Capitals
Emerging Gateways
International Middleweights
20
21
42
46
51
63
85
Source: Centre for Science and Technology Studies (CWTS) and
Leiden University.
“International Middleweights are the most varied
group of metro economies. Cities like Toronto, Sydney,
Frankfurt, Madrid, and Copenhagen play a funda mental
role in the provision of business and financial services
in their national and regional economies.”
ePortfolio Quality World Assignment (50 points)
This assignment introduces your Quality World to your
audience. According to William Glasser, American Psychiatrist,
the Quality World is the visualization of what we want for our
lives, the foundation that drives our dreams, goals, and actions.
For this assignment, you will display the three major elements
of your own Quality World as described in Chapter 1.
· The people you most want to be with
· The things you most want to own or experience
· The ideas or systems of belief that govern much of your
behavior
Also, include ideas you have about service to your community.
(i.e. What role does service play in your quality world? How
does service give meaning and purpose to your life?)
Remember, the elements you include in your Quality World
should be personally meaningful, but also healthy, balanced,
and ethical. Don’t just describe your Quality World, but SHOW
who you are, too. Include photos, images, audio or video, and/or
links to your (appropriate) social networking site or blog. Be
sure to cite the source of any images you borrow from the
Internet.
To prepare your assignment for submission to eCampus &
Portfolium (free eportfolio platform):
1. Create a new Microsoft Word document. Complete the
Quality World assignment and use the “Save As” function to
save the MS Word document as a .docx file on your computer’s
desktop.
2. Using the free Portfolium software, create an eportfolio and
upload this assignment to your eportfolio and name it (Ex.
Quality World Assignment). For additional resources, visit the
ePortfolio folder in eCampus. Once you publish your eportfolio
assignment (project) through Portfolium, you will be assigned a
unique URL (link) so anyone who has it can access your
eportfolio. Take note of your URL because you will need it
when you upload this assignment to eCampus. Follow the steps
(below) to upload this assignment to eCampus.
Manage Your ePortfolio Privacy Settings: Make your eportfolio
“public” so that your instructor can view your eportfolio. Be
aware of the content you choose to post since your portfolio
will be viewable on the World Wide Web.
Manage Your Assignment (Project) Privacy Settings: You must
make each assignment “public” when you are ready to publish.
This allows your instructor to view your eportfolio via the
unique URL assigned to your eportfolio. There is also an option
to use a private link.
Now, it’s time to upload your assignment to eCampus:
3. In eCampus, find the assignment link for this assignment,
click on it, and scroll to the Assignment Submission box. Click
Browse My Computer to find your saved document.
4. Select the document you want to submit to eCampus with
your mouse and click OPEN. You should now see the attached
file in eCampus. Go back to Portfolium to retrieve your public
eportfolio URL. Copy/paste your URL (link) from Portfolium to
eCampus so that your instructor can view your eportfolio using
your URL.
5. Lastly, find the SUBMIT button and click it. Now, your
instructor can see that you have turned in the assignment as an
attachment AND as a URL link. Do not copy/paste your full
draft into the Comments Box – use Browse My Computer to
attach the assignment file. If you need additional help
understanding how to attach a file, view this video.
You will repeat these instructions to submit your remaining
eportfolio assignments. At the end of the course, you will
showcase your final, completed eportfolio, which will include
all four assignments. For help with creating your ePortfolio,
visit the ePortfolio folder in eCampus.Quality World
Assignment Grading Criteria
Immigration and the American Industrial Revolution From 1880
to
1920
Charles Hirschman and
Department of Sociology and Center for Studies in Demography
and Ecology, University of
Washington, Seattle, WA 98195-3340
Elizabeth Mogford
Department of Sociology, Western Washington University,
Bellingham, WA 98225-9081
Abstract
In this study, we measure the contribution of immigrants and
their descendents to the growth and
industrial transformation of the American workforce in the age
of mass immigration from 1880 to
1920. The size and selectivity of the immigrant community, as
well as their disproportionate residence
in large cities, meant they were the mainstay of the American
industrial workforce. Immigrants and
their children comprised over half of manufacturing workers in
1920, and if the third generation (the
grandchildren of immigrants) are included, then more than two-
thirds of workers in the
manufacturing sector were of recent immigrant stock. Although
higher wages and better working
conditions might have encouraged more long-resident native-
born workers to the industrial economy,
the scale and pace of the American industrial revolution might
well have slowed. The closing of the
door to mass immigration in the 1920s did lead to increased
recruitment of native born workers,
particularly from the South, to northern industrial cities in the
middle decades of the 20th century.
1. Introduction
Within the span of a few decades from the late 19th to the early
20th century, the United States
was transformed from a predominately rural agrarian society to
an industrial economy centered
in large metropolitan cities. Prior to the American industrial
revolution, most Americans were
reared in largely isolated agricultural households and small
towns that were linked to the
external world by horse drawn wagons (Olmstead and Rhode
2000: 711). Except for towns
that were connected to railroads or water borne shipping,
isolation and the costs of overland
transportation meant that many rural communities were largely
self sufficient in food, clothing,
and many other essentials of everyday life. This changed
dramatically in the early decades of
the 20th century, as the supply and lowered costs of
manufactured goods created a consumer
revolution for both urban and rural households. Many of these
goods, which did not even exist
a few decades earlier, were manufactured, marketed, and
transported through a rapidly
expanding national network of rail lines and highways. By
1920, one half of northern farms
had automobiles and telephones (Olmstead and Rhode 2000:
712–713).
Contact Charles Hirschman at [email protected] and Elizabeth
Mogford at [email protected]
Earlier versions of this paper were presented at the 2006 annual
meetings of the Population Association of America and at
colloquia at
the Department of Sociology, University of British Columbia,
the Center for Studies in Demography and Ecology, University
of
Washington, and the Minnesota Population Center at the
University of Minnesota.
Publisher's Disclaimer: This is a PDF file of an unedited
manuscript that has been accepted for publication. As a service
to our customers
we are providing this early version of the manuscript. The
manuscript will undergo copyediting, typesetting, and review of
the resulting
proof before it is published in its final citable form. Please note
that during the production process errors may be discovered
which could
affect the content, and all legal disclaimers that apply to the
journal pertain.
NIH Public Access
Author Manuscript
Soc Sci Res. Author manuscript; available in PMC 2010
December 1.
Published in final edited form as:
Soc Sci Res. 2009 December 1; 38(4): 897–920.
doi:10.1016/j.ssresearch.2009.04.001.
N
IH
-P
A
A
uthor M
anuscript
N
IH
-P
A
A
uthor M
anuscript
N
IH
-P
A
A
uthor M
anuscript
Theses changes were the direct result of the American industrial
revolution that was founded
on rising investment, employment, and productivity in the
manufacturing sector. In 1880, when
the agricultural frontier had largely disappeared, almost one-
half of the American workers were
still farmers and only one in seven workers (less than 15%)
worked in manufacturing of any
sort. The industrial sector, as late as 1870, consisted primarily
of small firms and workshops
that relied on artisan technology to produce tools, furniture,
building materials, and other goods
for local markets (Abramovitz and David 2000: 45). Many small
industries, such as grain mills
and sawmills, were often located in rural areas close to flowing
rivers in order to power
machinery. Following the technological revolutions of the early
industrial age, workshops and
small foundries were supplemented by large factories engaged
in mass production. The
development of commercial electricity at the end of the 19th
century allowed industries to take
advantage of the labor supply in large cities. The scale of
change is illustrated by the rise in
the share of manufacturing horsepower generated by electrical
motors from 23% in 1909 to
77% in 1929 (Goldin and Katz 1998: 712).
Enormous gains in industrial productivity, accompanied by
institutional change and much
lower transportation costs, created national markets with goods
and people moving in every
direction. Perhaps the most consequential change of the
American industrial revolution was
the increasing urbanization of society and the shift of labor
from farms to factories and offices
(Guest 2005). In 1880, workers in agriculture outnumbered
industrial workers three to one, but
by 1920, the numbers were approximately equal. Employment in
the manufacturing sector
expanded four-fold from 2.5 to 10 million workers from 1880 to
1920.1
The decades surrounding 1900 were not only the age of
industrialization in the United States,
but were also the age of urbanization and immigration. The
1880s were the first decade in
American history, with the exception of the Civil War decade,
when the urban population
increased more than the rural population (in absolute numbers).
From 1880 to 1920, population
growth was concentrated in cities—the urban fraction expanded
from a little more than one
quarter of the national population to more than one half (Carter
et al. 2006: 1–105).
The pace of rural to urban migration of the native born picked
up during this era, but domestic
urbanward migrants were dwarfed by the flood of immigrants
coming to cities. From 1880 to
1920, the number of foreign born increased from almost 7
million to a little under 14 million
(Gibson and Jung 2006: 26). These figures, however,
underestimate the economic and
demographic contribution of immigration (Kuznets 1971b).
Immigrants inevitably lead to a
second generation—the children of immigrants—whose social,
cultural, and economic
characteristics are heavily influenced by their origins. Counting
the 23 million children of
immigrants2, in addition to the 14 million immigrants, means
that over one-third of the 105
million Americans in the 1920 population belonged to the
“immigrant community,” defined
as inclusive of the first and second generations.
1.1 Immigration, Urbanization, and Industrialization
Immigrants, as well as manufacturing enterprises, were
concentrated in the rapidly growing
cities of the Northeast and Midwest during the age of
industrialization (Gibson and Jung
2006: 72). In 1900, about three-quarters of the populations of
many large cities were composed
of immigrants and their children, including New York, Chicago,
Boston, Cleveland, San
Francisco, Buffalo, Milwaukee, and Detroit (Carpenter 1927:
27). Immigration and
industrialization were correlated, both spatially and temporally
in American history (Taeuber
1Industrial production experienced an almost five-fold
expansion of value added in manufacturing and mining from
1880 to 1915 (Davis
2006: 3-23-24 and 3-25). Manufacturing’s share of value added
in commodity production rose more rapidly from 1879 to 1894
than in
any other period of the 19th century (Fogel 1964: 121).
2The children of immigrants includes native born persons who
have at least one foreign born parent.
Hirschman and Mogford Page 2
Soc Sci Res. Author manuscript; available in PMC 2010
December 1.
N
IH
-P
A
A
uthor M
anuscript
N
IH
-P
A
A
uthor M
anuscript
N
IH
-P
A
A
uthor M
anuscript
and Taeuber 1971: 117), but is there a causal impact?
Addressing this question, the objective
of this analysis, requires consideration of the counterfactual of
what would have been the course
of the industrialization process in the United States if there had
not been an immigrant
workforce.
The most commonly cited reasons for the rapid American
industrial revolution are the
abundance of mineral resources, technological innovation, the
evolution of the American
system of manufacturing, railroads and lowered costs of
transportation, education and human
resources, and the rise of the managerial firm (Abramovitz and
David 2000; Chandler 1977;
Denison 1974; Hounshell 1984; Wright 1990). Among the
studies that address the relationship
between immigration and industrialization, few go beyond a
general or abstract discussion. In
a classic survey of the literature on the American industrial
revolution in the Cambridge
Economic History of the United States, the role of immigration
is summarized in a single
paragraph, which simply notes the overrepresentation of
immigrants in the manufacturing labor
force (Engerman and Sokoloff 2000: 387). There are some
studies that conclude that the flood
of immigration in the late 19th and early 20th centuries had an
adverse impact on the per-capita
economic growth, the wages of native workers, and diverted
domestic migration away from
industrializing cities (Hatton and Williamson 1998: Chapter 8;
Goldin 1994). However, other
researchers have questioned these conclusions and suggested
that immigrants had a generally
positive impact on the American economy and facilitated the
economic mobility of native born
workers during the age of industrialization (Carter and Sutch
1999; Haines 2000: 202; Muller
1993: 83–85; Thomas 1973: 174).
1.2 Research Objectives
In this study, we address two specific empirical questions,
namely: “What was the role of
immigration on changes in the industrial structure of the
American economy from 1880 to
1920?”, and “How much did immigrants and their descendents
(children and grandchildren)
contribute to the manufacturing sector in 1920?” The findings
reported here show that recent
immigrants and their descendents were the primary workforce in
the rapidly expanding
manufacturing economy of the early 20th century. Demographic
and economic pressures on
agricultural households in the late 19th and early 20th century
pushed an increasing share of
the children of farmers off the land, but only a minority were
willing to join “the pool of eastern
industrial and commercial labor” (Atack, Bateman, and Parker
2000: 322). When immigrant
labor was cutoff in the 1920s, the native poor population,
especially poor whites and blacks
from the South, began migrating to northern industrial cities in
much larger numbers. But in
the early 20th century, when manufacturing jobs were dirty,
dangerous, and heavily regimented,
immigrant workers were the mainstay of industrial employment.
Native born of native parentage (NBNP) Americans continued
to be over-represented in the
agricultural sector in the early 20th century, but they were also
well represented in many of the
better jobs in the public and business sectors that were also
expanding rapidly with the industrial
economy. The managerial elite during the age of
industrialization were almost exclusively
native born whites (Zunz 1982: 2).
2. How Might Immigration Affect Industrialization
There is a long list of potential factors—variables or
conditions—that might have caused the
American industrial revolution, including the discovery or
adoption of new technologies, the
availability and mobility of capital, the expansion of markets as
a result of new transportation
systems, added demand from a growing population and the
expansion of trade, increasing
entrepreneurship, stable political and institutional systems that
foster cheaper credit and the
enforcement of contracts, improvements in human capital and
meritocratic social mobility of
talent, the increasing division of labor in production, and the
specialization of enterprises (see
Hirschman and Mogford Page 3
Soc Sci Res. Author manuscript; available in PMC 2010
December 1.
N
IH
-P
A
A
uthor M
anuscript
N
IH
-P
A
A
uthor M
anuscript
N
IH
-P
A
A
uthor M
anuscript
Engerman and Gallman 2000, especially volume 2). This list,
which is neither exhaustive nor
mutually exclusive, does not specify which factors are
exogenous nor does it address the
question of which factors are absolutely necessary and which
may simply facilitate economic
growth and industrialization.
Without a comparative analysis across countries or regions, it is
impossible to test which factors
were necessary or sufficient conditions to cause
industrialization. Such studies are not always
definitive, however, because labor, capital, and other resources
can flow across regions and
countries. The analytical strategy adopted here is of a detailed
case study of one country, the
United States, with a primary focus on measuring the increasing
share of immigrants and their
descendents in the mobilization of labor during the American
industrial revolution from 1880
to 1920. The counterfactual, namely whether the domestic labor
supply would have been
sufficient for rapid industrial development in the absence of
immigration, cannot be directly
observed. Our strategy, which draws on theory and prior
research in addition to empirical
analysis, cannot fully adjudicate between competing
explanations. Our conclusion about the
centrality of immigrant labor is based on the fact that recent
immigrants and their descendents
were not just the majority of industrial workers, but the
overwhelming majority of workers in
the emerging manufacturing sector in early 20th century
America.
2.1 Economic Theory
Labor is an indispensable source of economic production, and
all other things being equal,
more labor contributes to more economic production. The
magnitude of the impact of
immigration on economic growth and welfare depends on the
availability of physical capital,
the human capital of immigrants and natives, and assumptions
about economies of scale
(Frieberg and Hunt 1995: 39–42; Smith and Edmonston 1997:
chapter 4). Although there was
neither a slackening of economic growth nor a slowdown in the
trend of rising wages of native
born workers during the age of mass immigration in the late
19th and early 20th century (Carter
and Sutch 1999: 314–344; Rees 1961), Hatton and Williamson
(1998: chapter 8) argued that
wages would have grown even faster in the absence of
immigration. Differences in the
interpretation (or speculation) of the economic impact of
immigration are typically based on
assumptions of possible effects rather than on measured
differences. There is a wide range of
mechanisms through which immigrants may affect labor markets
and the economy, more
generally.
One of the most fundamental effects of immigration is an
increase in the number of workers
relative to dependents in the population. Immigrants are
generally concentrated in the younger
working ages. Carter and Sutch (1999: 326) observe that well
over 70% of immigrants to the
United States during the peak years of the age of mass
immigration (1907 to 1910) were
between age 18 and 40. Even within the working-age
population, immigrants are more likely
to participate in the labor force than the native born population.
The age selectivity of
immigrants reduces the costs of social reproduction for a given
population size in the receiving
society. Although the costs of support for the dependent
population of children and the elderly
are generally borne privately by families, there are also public
subsidies for education and
health care. The costs of rearing and educating persons who
immigrate as young adults have
been borne by their foreign-resident families and their countries
of origin, and might be
considered a transfer payment to the taxpayers of the receiving
society.3
3“Considering the magnitude and duration of this movement, it
is difficult to exaggerate its importance as a factor in the
economic growth
of the United States. Since immigration brought in a large labor
force, the cost of whose rearing and training was borne
elsewhere, it
clearly represented an enormous capital investment that dwarfed
any capital inflows of the more orthodox type—a conclusion
that stands
with any reasonable estimate we can make of the money value
of labor.” (Kuznets 1971a: 357).
Hirschman and Mogford Page 4
Soc Sci Res. Author manuscript; available in PMC 2010
December 1.
N
IH
-P
A
A
uthor M
anuscript
N
IH
-P
A
A
uthor M
anuscript
N
IH
-P
A
A
uthor M
anuscript
In an ingenious analysis of the potential impact of the differing
age composition of immigrants
and the native born populations, Neal and Uselding (1972)
estimate the savings received by
the United States through immigration from 1790 to 1913
relative to the costs that would have
been incurred if all immigrants were replaced by children of the
native born population (this
counterfactual is posed by the “Walker hypothesis” that posits
that native born fertility was
depressed by the arrival of immigrants). Assuming these savings
had been invested (not
consumed by social reproduction), Neal and Uselding (1972:
87) conclude that immigration
had contributed from 13 to 42 percent of the capital stock of the
United States by 1912. Several
analysts have noted that the large number of immigrants in the
North in the 1860s provided
the manpower surplus that allowed the Union to triumph in the
Civil War (Gallman 1977: 31,
Muller 1993: 78–79).
2.2 Empirical Studies
In their study of the impact of immigration on American
industrialization and native born
workers, Hatton and Williamson (1998: chapter 8) asked
whether immigrants accelerated
industrialization by solving labor bottlenecks by entering high-
wage high-growth occupations
faster than native born workers (Hatton and Williamson 1998:
161–164). Based on their
findings that immigrants were more likely to be found in less
skilled occupations and in slower
growth occupations from 1890 to 1900, Hatton and Williamson
conclude that immigration did
not contribute to economic development and rapid
industrialization. However, other analysts
report that immigrants were no less skilled than native born
workers (Schachter 1972). The
real question, in our judgment, is not the skill level of
immigrants, but their role in filling the
demand for labor in manufacturing and other key sectors of
emerging industrial economy. The
central element of the industrial revolution is most
appropriately measured by shifts across
industrial sectors – the rise of manufacturing, in particular.
The other problem with Hatton and Williamson’s account is
their focus on relative growth as
the index of labor demand. Starting from a small base (or zero),
new industries may experience
extraordinarily rapid relative growth, but the absolute number
of added workers may be
relatively small. For example, the telephone industry grew over
80 times faster than the
workforce as a whole from 1880 to 1920, but the total growth
was only a quarter of a million
workers. On the other hand, the manufacturing sector grew
much less rapidly—only about 2.4
times as fast as the work force as a whole, but added about 7.5
million workers. Are immigrant
workers in manufacturing not to be considered part of the
“shock troops of structural
change” (Hatton and Williamson 1998: 161) simply because of
their relative share in the growth
in selected high demand occupations? The contribution of
immigrants might be evaluated
differently if the absolute numbers of workers in expanding
industries were counted. In this
analysis, we consider the contribution of immigrants to absolute
and relative changes in the
industrial structure.
One of the most important theoretical claims about the positive
impact of immigration on
industrialization centers on the creation of economies of
scales—both in the production of and
the demand for industrial goods (Abramovitz and David. 2000:
12; Carter and Sutch 1999:
331–332; Romer 1996). The creation of economies of scale was
possible only with the growth
of cities and urban industries. Before the age of
industrialization, per-capita productivity was
rarely increased by having large numbers of workers
concentrated in one location (Ward
1971: 90). Artisan labor in most industries, such as grain
B R O O K I N G SM E T R O P O L I TA N P O L I CY .docx

More Related Content

Similar to B R O O K I N G SM E T R O P O L I TA N P O L I CY .docx

GE3_FORUM #5.docx
GE3_FORUM #5.docxGE3_FORUM #5.docx
GE3_FORUM #5.docx
JulianneDasalla1
 
Hotspots 2025
Hotspots 2025Hotspots 2025
Hotspots 2025
Luis Taveras EMBA, MS
 
Globalisation Of Tourism Drivers And Outcomes
Globalisation Of Tourism  Drivers And OutcomesGlobalisation Of Tourism  Drivers And Outcomes
Globalisation Of Tourism Drivers And Outcomes
SD Paul
 
Unchained globalization by Dr.Mahboob ali khan Phd
Unchained globalization by Dr.Mahboob ali khan Phd Unchained globalization by Dr.Mahboob ali khan Phd
Unchained globalization by Dr.Mahboob ali khan Phd
Healthcare consultant
 
The Three Ages of Megacities
The Three Ages of MegacitiesThe Three Ages of Megacities
The Three Ages of Megacities
Ericsson
 
The Three Ages of Megacities
The Three Ages of MegacitiesThe Three Ages of Megacities
The Three Ages of Megacities
Ericsson
 
Mastering the Metro: How Metro Regions Can Win Friends and Influence Economies
Mastering the Metro: How Metro Regions Can Win Friends and Influence EconomiesMastering the Metro: How Metro Regions Can Win Friends and Influence Economies
Mastering the Metro: How Metro Regions Can Win Friends and Influence EconomiesJesse Budlong
 
Key factor of the stainable development.org
Key factor of the stainable development.orgKey factor of the stainable development.org
Key factor of the stainable development.org
LATTANABANPHOT CHOUNLAMUTY
 
Ey megatrends-report-2015
Ey megatrends-report-2015Ey megatrends-report-2015
Ey megatrends-report-2015
Anca-Maria Bucur
 
Plan-for-Economic-Growth-and-Jobs
Plan-for-Economic-Growth-and-JobsPlan-for-Economic-Growth-and-Jobs
Plan-for-Economic-Growth-and-JobsMichael Tavilla
 
Alarming population trends
Alarming population trendsAlarming population trends
Alarming population trends
Anil Sharma
 
DMCC Future of Trade
DMCC Future of TradeDMCC Future of Trade
DMCC Future of Trade
Francine Ongchangco
 
The Impact Of Economic Globalization
The Impact Of Economic GlobalizationThe Impact Of Economic Globalization
The Impact Of Economic Globalization
Jamie Boyd
 
Population Growth and Government Modernisation Efforts: The Case of GCC count...
Population Growth and Government Modernisation Efforts: The Case of GCC count...Population Growth and Government Modernisation Efforts: The Case of GCC count...
Population Growth and Government Modernisation Efforts: The Case of GCC count...
Arab Federation for Digital Economy
 
Globalization
GlobalizationGlobalization
Globalization
DostanShah
 
10619, 1052 AMGlobalization Is Not in RetreatPage 1 of .docx
10619, 1052 AMGlobalization Is Not in RetreatPage 1 of .docx10619, 1052 AMGlobalization Is Not in RetreatPage 1 of .docx
10619, 1052 AMGlobalization Is Not in RetreatPage 1 of .docx
aulasnilda
 
Ongoing Poverty in LEDCs and Transport Systems.docx
Ongoing Poverty in LEDCs and Transport Systems.docxOngoing Poverty in LEDCs and Transport Systems.docx
Ongoing Poverty in LEDCs and Transport Systems.docx
write22
 
The Problem of Urbanization Without Economic Growth - Bloomberg.pdf
The Problem of Urbanization Without Economic Growth - Bloomberg.pdfThe Problem of Urbanization Without Economic Growth - Bloomberg.pdf
The Problem of Urbanization Without Economic Growth - Bloomberg.pdf
BiniyamBekele6
 
Cities and growth, Gilles Duranton
Cities and growth, Gilles Duranton Cities and growth, Gilles Duranton
Cities and growth, Gilles Duranton
Structuralpolicyanalysis
 

Similar to B R O O K I N G SM E T R O P O L I TA N P O L I CY .docx (20)

GE3_FORUM #5.docx
GE3_FORUM #5.docxGE3_FORUM #5.docx
GE3_FORUM #5.docx
 
Hotspots 2025
Hotspots 2025Hotspots 2025
Hotspots 2025
 
Globalisation Of Tourism Drivers And Outcomes
Globalisation Of Tourism  Drivers And OutcomesGlobalisation Of Tourism  Drivers And Outcomes
Globalisation Of Tourism Drivers And Outcomes
 
Unchained globalization by Dr.Mahboob ali khan Phd
Unchained globalization by Dr.Mahboob ali khan Phd Unchained globalization by Dr.Mahboob ali khan Phd
Unchained globalization by Dr.Mahboob ali khan Phd
 
The Three Ages of Megacities
The Three Ages of MegacitiesThe Three Ages of Megacities
The Three Ages of Megacities
 
The Three Ages of Megacities
The Three Ages of MegacitiesThe Three Ages of Megacities
The Three Ages of Megacities
 
Mastering the Metro: How Metro Regions Can Win Friends and Influence Economies
Mastering the Metro: How Metro Regions Can Win Friends and Influence EconomiesMastering the Metro: How Metro Regions Can Win Friends and Influence Economies
Mastering the Metro: How Metro Regions Can Win Friends and Influence Economies
 
Key factor of the stainable development.org
Key factor of the stainable development.orgKey factor of the stainable development.org
Key factor of the stainable development.org
 
Ey megatrends-report-2015
Ey megatrends-report-2015Ey megatrends-report-2015
Ey megatrends-report-2015
 
Plan-for-Economic-Growth-and-Jobs
Plan-for-Economic-Growth-and-JobsPlan-for-Economic-Growth-and-Jobs
Plan-for-Economic-Growth-and-Jobs
 
Alarming population trends
Alarming population trendsAlarming population trends
Alarming population trends
 
DMCC Future of Trade
DMCC Future of TradeDMCC Future of Trade
DMCC Future of Trade
 
The Impact Of Economic Globalization
The Impact Of Economic GlobalizationThe Impact Of Economic Globalization
The Impact Of Economic Globalization
 
Population Growth and Government Modernisation Efforts: The Case of GCC count...
Population Growth and Government Modernisation Efforts: The Case of GCC count...Population Growth and Government Modernisation Efforts: The Case of GCC count...
Population Growth and Government Modernisation Efforts: The Case of GCC count...
 
Globalization
GlobalizationGlobalization
Globalization
 
10619, 1052 AMGlobalization Is Not in RetreatPage 1 of .docx
10619, 1052 AMGlobalization Is Not in RetreatPage 1 of .docx10619, 1052 AMGlobalization Is Not in RetreatPage 1 of .docx
10619, 1052 AMGlobalization Is Not in RetreatPage 1 of .docx
 
Trade openness and city interaction
Trade openness and city interactionTrade openness and city interaction
Trade openness and city interaction
 
Ongoing Poverty in LEDCs and Transport Systems.docx
Ongoing Poverty in LEDCs and Transport Systems.docxOngoing Poverty in LEDCs and Transport Systems.docx
Ongoing Poverty in LEDCs and Transport Systems.docx
 
The Problem of Urbanization Without Economic Growth - Bloomberg.pdf
The Problem of Urbanization Without Economic Growth - Bloomberg.pdfThe Problem of Urbanization Without Economic Growth - Bloomberg.pdf
The Problem of Urbanization Without Economic Growth - Bloomberg.pdf
 
Cities and growth, Gilles Duranton
Cities and growth, Gilles Duranton Cities and growth, Gilles Duranton
Cities and growth, Gilles Duranton
 

More from celenarouzie

Attaining ExpertiseYou are tr.docx
Attaining ExpertiseYou are tr.docxAttaining ExpertiseYou are tr.docx
Attaining ExpertiseYou are tr.docx
celenarouzie
 
attachment Chloe” is a example of the whole packet. Please follow t.docx
attachment Chloe” is a example of the whole packet. Please follow t.docxattachment Chloe” is a example of the whole packet. Please follow t.docx
attachment Chloe” is a example of the whole packet. Please follow t.docx
celenarouzie
 
AttachmentFor this discussionUse Ericksons theoretic.docx
AttachmentFor this discussionUse Ericksons theoretic.docxAttachmentFor this discussionUse Ericksons theoretic.docx
AttachmentFor this discussionUse Ericksons theoretic.docx
celenarouzie
 
Attachment Programs and Families Working Together Learn.docx
Attachment Programs and Families Working Together Learn.docxAttachment Programs and Families Working Together Learn.docx
Attachment Programs and Families Working Together Learn.docx
celenarouzie
 
Attachment and Emotional Development in InfancyThe purpose o.docx
Attachment and Emotional Development in InfancyThe purpose o.docxAttachment and Emotional Development in InfancyThe purpose o.docx
Attachment and Emotional Development in InfancyThe purpose o.docx
celenarouzie
 
ATTACHEMENT from 7.1 and 7.2 Go back to the Powerpoint for thi.docx
ATTACHEMENT from 7.1 and 7.2 Go back to the Powerpoint for thi.docxATTACHEMENT from 7.1 and 7.2 Go back to the Powerpoint for thi.docx
ATTACHEMENT from 7.1 and 7.2 Go back to the Powerpoint for thi.docx
celenarouzie
 
Attached the dataset Kaggle has hosted a data science competitio.docx
Attached the dataset Kaggle has hosted a data science competitio.docxAttached the dataset Kaggle has hosted a data science competitio.docx
Attached the dataset Kaggle has hosted a data science competitio.docx
celenarouzie
 
Attached you will find all of the questions.These are just like th.docx
Attached you will find all of the questions.These are just like th.docxAttached you will find all of the questions.These are just like th.docx
Attached you will find all of the questions.These are just like th.docx
celenarouzie
 
Attached the dataset Kaggle has hosted a data science compet.docx
Attached the dataset Kaggle has hosted a data science compet.docxAttached the dataset Kaggle has hosted a data science compet.docx
Attached the dataset Kaggle has hosted a data science compet.docx
celenarouzie
 
B. Answer Learning Exercises  Matching words parts 1, 2, 3,.docx
B. Answer Learning Exercises  Matching words parts 1, 2, 3,.docxB. Answer Learning Exercises  Matching words parts 1, 2, 3,.docx
B. Answer Learning Exercises  Matching words parts 1, 2, 3,.docx
celenarouzie
 
B)What is Joe waiting for in order to forgive Missy May in The Gild.docx
B)What is Joe waiting for in order to forgive Missy May in The Gild.docxB)What is Joe waiting for in order to forgive Missy May in The Gild.docx
B)What is Joe waiting for in order to forgive Missy May in The Gild.docx
celenarouzie
 
B)Blanche and Stella both view Stanley very differently – how do the.docx
B)Blanche and Stella both view Stanley very differently – how do the.docxB)Blanche and Stella both view Stanley very differently – how do the.docx
B)Blanche and Stella both view Stanley very differently – how do the.docx
celenarouzie
 
b) What is the largest value that can be represented by 3 digits usi.docx
b) What is the largest value that can be represented by 3 digits usi.docxb) What is the largest value that can be represented by 3 digits usi.docx
b) What is the largest value that can be represented by 3 digits usi.docx
celenarouzie
 
b$ E=EE#s{gEgE lEgEHEFs ig=ii 5i= l; i € 3 r i.Er1 b €€.docx
b$ E=EE#s{gEgE lEgEHEFs ig=ii 5i= l; i € 3 r  i.Er1 b €€.docxb$ E=EE#s{gEgE lEgEHEFs ig=ii 5i= l; i € 3 r  i.Er1 b €€.docx
b$ E=EE#s{gEgE lEgEHEFs ig=ii 5i= l; i € 3 r i.Er1 b €€.docx
celenarouzie
 
B A S I C L O G I C M O D E L D E V E L O P M E N T Pr.docx
B A S I C  L O G I C  M O D E L  D E V E L O P M E N T  Pr.docxB A S I C  L O G I C  M O D E L  D E V E L O P M E N T  Pr.docx
B A S I C L O G I C M O D E L D E V E L O P M E N T Pr.docx
celenarouzie
 
B H1. The first issue that jumped out to me is that the presiden.docx
B H1. The first issue that jumped out to me is that the presiden.docxB H1. The first issue that jumped out to me is that the presiden.docx
B H1. The first issue that jumped out to me is that the presiden.docx
celenarouzie
 
b l u e p r i n t i CONSUMER PERCEPTIONSHQW DQPerception.docx
b l u e p r i n t i CONSUMER PERCEPTIONSHQW DQPerception.docxb l u e p r i n t i CONSUMER PERCEPTIONSHQW DQPerception.docx
b l u e p r i n t i CONSUMER PERCEPTIONSHQW DQPerception.docx
celenarouzie
 
B L O C K C H A I N & S U P P LY C H A I N SS U N I L.docx
B L O C K C H A I N  &  S U P P LY  C H A I N SS U N I L.docxB L O C K C H A I N  &  S U P P LY  C H A I N SS U N I L.docx
B L O C K C H A I N & S U P P LY C H A I N SS U N I L.docx
celenarouzie
 
Año 15, núm. 43 enero – abril de 2012. Análisis 97 Orien.docx
Año 15, núm. 43  enero – abril de 2012. Análisis 97 Orien.docxAño 15, núm. 43  enero – abril de 2012. Análisis 97 Orien.docx
Año 15, núm. 43 enero – abril de 2012. Análisis 97 Orien.docx
celenarouzie
 
A report is a short, well-planned and concise document that is .docx
A report is a short, well-planned and concise document that is .docxA report is a short, well-planned and concise document that is .docx
A report is a short, well-planned and concise document that is .docx
celenarouzie
 

More from celenarouzie (20)

Attaining ExpertiseYou are tr.docx
Attaining ExpertiseYou are tr.docxAttaining ExpertiseYou are tr.docx
Attaining ExpertiseYou are tr.docx
 
attachment Chloe” is a example of the whole packet. Please follow t.docx
attachment Chloe” is a example of the whole packet. Please follow t.docxattachment Chloe” is a example of the whole packet. Please follow t.docx
attachment Chloe” is a example of the whole packet. Please follow t.docx
 
AttachmentFor this discussionUse Ericksons theoretic.docx
AttachmentFor this discussionUse Ericksons theoretic.docxAttachmentFor this discussionUse Ericksons theoretic.docx
AttachmentFor this discussionUse Ericksons theoretic.docx
 
Attachment Programs and Families Working Together Learn.docx
Attachment Programs and Families Working Together Learn.docxAttachment Programs and Families Working Together Learn.docx
Attachment Programs and Families Working Together Learn.docx
 
Attachment and Emotional Development in InfancyThe purpose o.docx
Attachment and Emotional Development in InfancyThe purpose o.docxAttachment and Emotional Development in InfancyThe purpose o.docx
Attachment and Emotional Development in InfancyThe purpose o.docx
 
ATTACHEMENT from 7.1 and 7.2 Go back to the Powerpoint for thi.docx
ATTACHEMENT from 7.1 and 7.2 Go back to the Powerpoint for thi.docxATTACHEMENT from 7.1 and 7.2 Go back to the Powerpoint for thi.docx
ATTACHEMENT from 7.1 and 7.2 Go back to the Powerpoint for thi.docx
 
Attached the dataset Kaggle has hosted a data science competitio.docx
Attached the dataset Kaggle has hosted a data science competitio.docxAttached the dataset Kaggle has hosted a data science competitio.docx
Attached the dataset Kaggle has hosted a data science competitio.docx
 
Attached you will find all of the questions.These are just like th.docx
Attached you will find all of the questions.These are just like th.docxAttached you will find all of the questions.These are just like th.docx
Attached you will find all of the questions.These are just like th.docx
 
Attached the dataset Kaggle has hosted a data science compet.docx
Attached the dataset Kaggle has hosted a data science compet.docxAttached the dataset Kaggle has hosted a data science compet.docx
Attached the dataset Kaggle has hosted a data science compet.docx
 
B. Answer Learning Exercises  Matching words parts 1, 2, 3,.docx
B. Answer Learning Exercises  Matching words parts 1, 2, 3,.docxB. Answer Learning Exercises  Matching words parts 1, 2, 3,.docx
B. Answer Learning Exercises  Matching words parts 1, 2, 3,.docx
 
B)What is Joe waiting for in order to forgive Missy May in The Gild.docx
B)What is Joe waiting for in order to forgive Missy May in The Gild.docxB)What is Joe waiting for in order to forgive Missy May in The Gild.docx
B)What is Joe waiting for in order to forgive Missy May in The Gild.docx
 
B)Blanche and Stella both view Stanley very differently – how do the.docx
B)Blanche and Stella both view Stanley very differently – how do the.docxB)Blanche and Stella both view Stanley very differently – how do the.docx
B)Blanche and Stella both view Stanley very differently – how do the.docx
 
b) What is the largest value that can be represented by 3 digits usi.docx
b) What is the largest value that can be represented by 3 digits usi.docxb) What is the largest value that can be represented by 3 digits usi.docx
b) What is the largest value that can be represented by 3 digits usi.docx
 
b$ E=EE#s{gEgE lEgEHEFs ig=ii 5i= l; i € 3 r i.Er1 b €€.docx
b$ E=EE#s{gEgE lEgEHEFs ig=ii 5i= l; i € 3 r  i.Er1 b €€.docxb$ E=EE#s{gEgE lEgEHEFs ig=ii 5i= l; i € 3 r  i.Er1 b €€.docx
b$ E=EE#s{gEgE lEgEHEFs ig=ii 5i= l; i € 3 r i.Er1 b €€.docx
 
B A S I C L O G I C M O D E L D E V E L O P M E N T Pr.docx
B A S I C  L O G I C  M O D E L  D E V E L O P M E N T  Pr.docxB A S I C  L O G I C  M O D E L  D E V E L O P M E N T  Pr.docx
B A S I C L O G I C M O D E L D E V E L O P M E N T Pr.docx
 
B H1. The first issue that jumped out to me is that the presiden.docx
B H1. The first issue that jumped out to me is that the presiden.docxB H1. The first issue that jumped out to me is that the presiden.docx
B H1. The first issue that jumped out to me is that the presiden.docx
 
b l u e p r i n t i CONSUMER PERCEPTIONSHQW DQPerception.docx
b l u e p r i n t i CONSUMER PERCEPTIONSHQW DQPerception.docxb l u e p r i n t i CONSUMER PERCEPTIONSHQW DQPerception.docx
b l u e p r i n t i CONSUMER PERCEPTIONSHQW DQPerception.docx
 
B L O C K C H A I N & S U P P LY C H A I N SS U N I L.docx
B L O C K C H A I N  &  S U P P LY  C H A I N SS U N I L.docxB L O C K C H A I N  &  S U P P LY  C H A I N SS U N I L.docx
B L O C K C H A I N & S U P P LY C H A I N SS U N I L.docx
 
Año 15, núm. 43 enero – abril de 2012. Análisis 97 Orien.docx
Año 15, núm. 43  enero – abril de 2012. Análisis 97 Orien.docxAño 15, núm. 43  enero – abril de 2012. Análisis 97 Orien.docx
Año 15, núm. 43 enero – abril de 2012. Análisis 97 Orien.docx
 
A report is a short, well-planned and concise document that is .docx
A report is a short, well-planned and concise document that is .docxA report is a short, well-planned and concise document that is .docx
A report is a short, well-planned and concise document that is .docx
 

Recently uploaded

Fish and Chips - have they had their chips
Fish and Chips - have they had their chipsFish and Chips - have they had their chips
Fish and Chips - have they had their chips
GeoBlogs
 
Model Attribute Check Company Auto Property
Model Attribute  Check Company Auto PropertyModel Attribute  Check Company Auto Property
Model Attribute Check Company Auto Property
Celine George
 
Template Jadual Bertugas Kelas (Boleh Edit)
Template Jadual Bertugas Kelas (Boleh Edit)Template Jadual Bertugas Kelas (Boleh Edit)
Template Jadual Bertugas Kelas (Boleh Edit)
rosedainty
 
2024.06.01 Introducing a competency framework for languag learning materials ...
2024.06.01 Introducing a competency framework for languag learning materials ...2024.06.01 Introducing a competency framework for languag learning materials ...
2024.06.01 Introducing a competency framework for languag learning materials ...
Sandy Millin
 
Phrasal Verbs.XXXXXXXXXXXXXXXXXXXXXXXXXX
Phrasal Verbs.XXXXXXXXXXXXXXXXXXXXXXXXXXPhrasal Verbs.XXXXXXXXXXXXXXXXXXXXXXXXXX
Phrasal Verbs.XXXXXXXXXXXXXXXXXXXXXXXXXX
MIRIAMSALINAS13
 
Overview on Edible Vaccine: Pros & Cons with Mechanism
Overview on Edible Vaccine: Pros & Cons with MechanismOverview on Edible Vaccine: Pros & Cons with Mechanism
Overview on Edible Vaccine: Pros & Cons with Mechanism
DeeptiGupta154
 
GIÁO ÁN DẠY THÊM (KẾ HOẠCH BÀI BUỔI 2) - TIẾNG ANH 8 GLOBAL SUCCESS (2 CỘT) N...
GIÁO ÁN DẠY THÊM (KẾ HOẠCH BÀI BUỔI 2) - TIẾNG ANH 8 GLOBAL SUCCESS (2 CỘT) N...GIÁO ÁN DẠY THÊM (KẾ HOẠCH BÀI BUỔI 2) - TIẾNG ANH 8 GLOBAL SUCCESS (2 CỘT) N...
GIÁO ÁN DẠY THÊM (KẾ HOẠCH BÀI BUỔI 2) - TIẾNG ANH 8 GLOBAL SUCCESS (2 CỘT) N...
Nguyen Thanh Tu Collection
 
Chapter 3 - Islamic Banking Products and Services.pptx
Chapter 3 - Islamic Banking Products and Services.pptxChapter 3 - Islamic Banking Products and Services.pptx
Chapter 3 - Islamic Banking Products and Services.pptx
Mohd Adib Abd Muin, Senior Lecturer at Universiti Utara Malaysia
 
How libraries can support authors with open access requirements for UKRI fund...
How libraries can support authors with open access requirements for UKRI fund...How libraries can support authors with open access requirements for UKRI fund...
How libraries can support authors with open access requirements for UKRI fund...
Jisc
 
Digital Tools and AI for Teaching Learning and Research
Digital Tools and AI for Teaching Learning and ResearchDigital Tools and AI for Teaching Learning and Research
Digital Tools and AI for Teaching Learning and Research
Vikramjit Singh
 
special B.ed 2nd year old paper_20240531.pdf
special B.ed 2nd year old paper_20240531.pdfspecial B.ed 2nd year old paper_20240531.pdf
special B.ed 2nd year old paper_20240531.pdf
Special education needs
 
Operation Blue Star - Saka Neela Tara
Operation Blue Star   -  Saka Neela TaraOperation Blue Star   -  Saka Neela Tara
Operation Blue Star - Saka Neela Tara
Balvir Singh
 
Palestine last event orientationfvgnh .pptx
Palestine last event orientationfvgnh .pptxPalestine last event orientationfvgnh .pptx
Palestine last event orientationfvgnh .pptx
RaedMohamed3
 
The approach at University of Liverpool.pptx
The approach at University of Liverpool.pptxThe approach at University of Liverpool.pptx
The approach at University of Liverpool.pptx
Jisc
 
Instructions for Submissions thorugh G- Classroom.pptx
Instructions for Submissions thorugh G- Classroom.pptxInstructions for Submissions thorugh G- Classroom.pptx
Instructions for Submissions thorugh G- Classroom.pptx
Jheel Barad
 
MARUTI SUZUKI- A Successful Joint Venture in India.pptx
MARUTI SUZUKI- A Successful Joint Venture in India.pptxMARUTI SUZUKI- A Successful Joint Venture in India.pptx
MARUTI SUZUKI- A Successful Joint Venture in India.pptx
bennyroshan06
 
Ethnobotany and Ethnopharmacology ......
Ethnobotany and Ethnopharmacology ......Ethnobotany and Ethnopharmacology ......
Ethnobotany and Ethnopharmacology ......
Ashokrao Mane college of Pharmacy Peth-Vadgaon
 
Basic phrases for greeting and assisting costumers
Basic phrases for greeting and assisting costumersBasic phrases for greeting and assisting costumers
Basic phrases for greeting and assisting costumers
PedroFerreira53928
 
ESC Beyond Borders _From EU to You_ InfoPack general.pdf
ESC Beyond Borders _From EU to You_ InfoPack general.pdfESC Beyond Borders _From EU to You_ InfoPack general.pdf
ESC Beyond Borders _From EU to You_ InfoPack general.pdf
Fundacja Rozwoju Społeczeństwa Przedsiębiorczego
 
Cambridge International AS A Level Biology Coursebook - EBook (MaryFosbery J...
Cambridge International AS  A Level Biology Coursebook - EBook (MaryFosbery J...Cambridge International AS  A Level Biology Coursebook - EBook (MaryFosbery J...
Cambridge International AS A Level Biology Coursebook - EBook (MaryFosbery J...
AzmatAli747758
 

Recently uploaded (20)

Fish and Chips - have they had their chips
Fish and Chips - have they had their chipsFish and Chips - have they had their chips
Fish and Chips - have they had their chips
 
Model Attribute Check Company Auto Property
Model Attribute  Check Company Auto PropertyModel Attribute  Check Company Auto Property
Model Attribute Check Company Auto Property
 
Template Jadual Bertugas Kelas (Boleh Edit)
Template Jadual Bertugas Kelas (Boleh Edit)Template Jadual Bertugas Kelas (Boleh Edit)
Template Jadual Bertugas Kelas (Boleh Edit)
 
2024.06.01 Introducing a competency framework for languag learning materials ...
2024.06.01 Introducing a competency framework for languag learning materials ...2024.06.01 Introducing a competency framework for languag learning materials ...
2024.06.01 Introducing a competency framework for languag learning materials ...
 
Phrasal Verbs.XXXXXXXXXXXXXXXXXXXXXXXXXX
Phrasal Verbs.XXXXXXXXXXXXXXXXXXXXXXXXXXPhrasal Verbs.XXXXXXXXXXXXXXXXXXXXXXXXXX
Phrasal Verbs.XXXXXXXXXXXXXXXXXXXXXXXXXX
 
Overview on Edible Vaccine: Pros & Cons with Mechanism
Overview on Edible Vaccine: Pros & Cons with MechanismOverview on Edible Vaccine: Pros & Cons with Mechanism
Overview on Edible Vaccine: Pros & Cons with Mechanism
 
GIÁO ÁN DẠY THÊM (KẾ HOẠCH BÀI BUỔI 2) - TIẾNG ANH 8 GLOBAL SUCCESS (2 CỘT) N...
GIÁO ÁN DẠY THÊM (KẾ HOẠCH BÀI BUỔI 2) - TIẾNG ANH 8 GLOBAL SUCCESS (2 CỘT) N...GIÁO ÁN DẠY THÊM (KẾ HOẠCH BÀI BUỔI 2) - TIẾNG ANH 8 GLOBAL SUCCESS (2 CỘT) N...
GIÁO ÁN DẠY THÊM (KẾ HOẠCH BÀI BUỔI 2) - TIẾNG ANH 8 GLOBAL SUCCESS (2 CỘT) N...
 
Chapter 3 - Islamic Banking Products and Services.pptx
Chapter 3 - Islamic Banking Products and Services.pptxChapter 3 - Islamic Banking Products and Services.pptx
Chapter 3 - Islamic Banking Products and Services.pptx
 
How libraries can support authors with open access requirements for UKRI fund...
How libraries can support authors with open access requirements for UKRI fund...How libraries can support authors with open access requirements for UKRI fund...
How libraries can support authors with open access requirements for UKRI fund...
 
Digital Tools and AI for Teaching Learning and Research
Digital Tools and AI for Teaching Learning and ResearchDigital Tools and AI for Teaching Learning and Research
Digital Tools and AI for Teaching Learning and Research
 
special B.ed 2nd year old paper_20240531.pdf
special B.ed 2nd year old paper_20240531.pdfspecial B.ed 2nd year old paper_20240531.pdf
special B.ed 2nd year old paper_20240531.pdf
 
Operation Blue Star - Saka Neela Tara
Operation Blue Star   -  Saka Neela TaraOperation Blue Star   -  Saka Neela Tara
Operation Blue Star - Saka Neela Tara
 
Palestine last event orientationfvgnh .pptx
Palestine last event orientationfvgnh .pptxPalestine last event orientationfvgnh .pptx
Palestine last event orientationfvgnh .pptx
 
The approach at University of Liverpool.pptx
The approach at University of Liverpool.pptxThe approach at University of Liverpool.pptx
The approach at University of Liverpool.pptx
 
Instructions for Submissions thorugh G- Classroom.pptx
Instructions for Submissions thorugh G- Classroom.pptxInstructions for Submissions thorugh G- Classroom.pptx
Instructions for Submissions thorugh G- Classroom.pptx
 
MARUTI SUZUKI- A Successful Joint Venture in India.pptx
MARUTI SUZUKI- A Successful Joint Venture in India.pptxMARUTI SUZUKI- A Successful Joint Venture in India.pptx
MARUTI SUZUKI- A Successful Joint Venture in India.pptx
 
Ethnobotany and Ethnopharmacology ......
Ethnobotany and Ethnopharmacology ......Ethnobotany and Ethnopharmacology ......
Ethnobotany and Ethnopharmacology ......
 
Basic phrases for greeting and assisting costumers
Basic phrases for greeting and assisting costumersBasic phrases for greeting and assisting costumers
Basic phrases for greeting and assisting costumers
 
ESC Beyond Borders _From EU to You_ InfoPack general.pdf
ESC Beyond Borders _From EU to You_ InfoPack general.pdfESC Beyond Borders _From EU to You_ InfoPack general.pdf
ESC Beyond Borders _From EU to You_ InfoPack general.pdf
 
Cambridge International AS A Level Biology Coursebook - EBook (MaryFosbery J...
Cambridge International AS  A Level Biology Coursebook - EBook (MaryFosbery J...Cambridge International AS  A Level Biology Coursebook - EBook (MaryFosbery J...
Cambridge International AS A Level Biology Coursebook - EBook (MaryFosbery J...
 

B R O O K I N G SM E T R O P O L I TA N P O L I CY .docx

  • 1. B R O O K I N G S M E T R O P O L I TA N P O L I CY P R O G RA M 6 I . I N T R O D U C T I O N A s the global economy has become more integrated and urbanized, fueled in large part by technology, major cities and metropolitan areas have become key engines of economic growth. The 123 largest metro areas in the world generate nearly one third of global output with only 13 percent of the world’s population. In this urban-centered world, the classic notion of a global city has been upended. This report introduces a redefined map of global cities, drawing on a new
  • 2. typology that demonstrates how metro areas vary in the ways they attract and amass economic drivers and contribute to global economic growth in distinct ways. New concerns about economic stagnation—in both developing and developed economies—add urgency to mapping the role of the world’s cities and the extent to which they are well-positioned to deliver the next round of global growth.1 Instead of a ranking or indexed score, which many prior cities indices and reports have capably deliv- ered,2 this analysis differentiates the assets and challenges faced by seven types of global cities. This perspective reveals that all major cities are indeed global; they participate as critical nodes in an integrated marketplace and are shaped by global currents. But cities also operate from much differ- ent starting points and experience diverse economic trajectories. Concerns about global growth, productiv-
  • 3. ity, and wages are not monolithic, and so this typology can inform the variety of paths cities take to address these challenges. For metro leaders, this typology can also ensure better application of peer com- parisons, enable the identification of more relevant global innovations to local challenges, and reinforce a city-region’s relative role and performance to inform economic strategies that ensure ongoing prosperity. This report proceeds in four parts. In the following section, Part II, we explore the three global forces of urbanization, globalization, and technological change, and how together they are demanding that city- regions focus on five core factors—traded clusters, innovation, talent, infrastructure connectivity, and governance—to bolster their economic competitive- ness. Building on these factors, Part III outlines the data and methods deployed to create the metropoli- tan typology. Part IV explores the collective economic
  • 4. clout of the metro areas in our sample and introduces the new typology of global cities. Finally, Part V explores the future investments, policies, and strate- gies required for each grouping of metro areas. Within the typology framework, we explore the priorities for action going forward, including the implications for governance. REDEFINING GLOBAL CITIES THE SEVEN TYPES OF GLOBAL METRO ECONOMIES 7 U R B A N I Z AT I O N The world is becoming more urban, placing cities at the center of global economic development. The share of global population in metropolitan areas has grown
  • 5. from 29 percent in 1950 to well over half today, and it is predicted to reach 66 percent by mid-century.4 History indicates that urbanization both accompanies and facilitates economic transition from agricul- ture to manufacturing and services, activities that tend to demand clusters of labor and capital as well as the proximity to other firms that cities provide. Urbanization and industrialization, therefore, tend to occur in concert. These twin forces, which revolu- tionized Europe and North America in the late 19th century and early 20th century, have now touched Asia and Latin America. However, this process is not preordained. Africa’s urbanization, for instance, has not been accompanied by widespread industrializa- tion.5 Notwithstanding Africa’s challenges, millions of rural residents each week flock to urban regions in the Global South in search of the living standards that new production and service jobs provide. Since
  • 6. 2010 annual urban populations have grown fastest in Africa (3.55 percent) and Asia (2.50 percent), greatly exceeding the pace of urban growth in North America (1.04 percent) and Europe (0.33 percent).6 The pressures and opportunities accompanying urbanization will be felt most intensely and directly in the Global South, but the knock-on effects will be worldwide. Urbanization in developing economies has resulted in a much greater number of urban areas in which firms and workers can thrive. In techni- cal terms, agglomeration externalities—the benefits that accrue to firms, workers, and local economies from clustering—now exist in many more parts of the world.7 As a result, along with their growing human footprint, metro areas are flexing even greater economic muscle on the world stage. Overall, the 50 percent of the world’s population that lives in urban I I . G L O B A L M E G A T R E N D S A N D C I T I E S
  • 7. T hree significant forces—urbanization, global integration, and techno- logical change—are reshaping the international economy.3 We focus on these three forces because they are distinctly positioning cities as the world’s competitive economic units while simultaneously redefining what it takes for them to excel in today’s economy. B R O O K I N G S M E T R O P O L I TA N P O L I CY P R O G RA M 8 areas produces roughly 80 percent of the world’s total output.8 Urbanization, however, comes with risks if it is unman- aged. Rapid population influxes in the megacities of
  • 8. Africa, Latin America, and Southeast Asia are strain- ing the ability of local governments to provide basic housing, transportation, energy, water, and sewage infrastructure.9 The world will need to invest $57 trillion in new infrastructure by 2030 to keep pace with expected growth, the bulk of which will occur in the developing world.10 If the negative externalities of congestion, insecurity, and health risks overwhelm the positive agglomeration externalities that cities provide, countries run the risk of urbanizing without growth.11 The rise of developing metro areas creates both chal- lenges and opportunities for developed world cities. There is now more direct competition for firms and talent, but metro areas in developed markets can also look to developing metros with expanding populations and wealth for new sources of demand. Brookings’ Homi Kharas and Geoffrey Gertz project that China and India, which account for only 5 percent of global
  • 9. middle-class consumption today, could together account for nearly half of that consumption by 2050, with most of it occurring in their cities.12 G L O B A L I Z AT I O N Global integration, a defining trend of the postwar era, is intensifying.13 The volume of goods, services, and investments between countries increased from $5 trillion in 1990 to $30 trillion in 2014, or from 24 percent to 39 percent of global gross domestic prod- uct (GDP).14 Moreover, the nature of global exchange seems to be shifting. While goods trade has stagnated in recent years, cross-border flows of data and infor- mation have grown robustly.15 Broadly measured, these connections matter. Countries that are more internationally connected can expect to increase GDP growth by up to 40 percent more than less-connected countries.16 These findings affirm a wide array of economic literature
  • 10. citing the benefits of participating in global flows of trade, investment, and talent. Much of these benefits stem from the presence of globally-engaged firms. Local companies that embed themselves in global value chains gain access to high-quality imports, lowering their overall costs and allowing them to become more globally competitive. This process tends to boost productivity and wages.17 Firms selling internationally inject new wealth from abroad that, when spent locally, creates a multiplier effect in the regional economy, spurring new jobs, growth, and fur- ther tax revenue to be reinvested locally.18 Households living in metro areas open to trade are able to access a greater diversity of goods made elsewhere.19 Furthermore, global exchange is how regions with fewer industrial capabilities often obtain the knowl- edge required to move up the economic ladder, create new jobs, and boost productivity.20
  • 11. But cities also bear the brunt of the dislocations caused by global integration. For instance, China’s insertion into the global trading system resulted in significant job losses in U.S. labor markets that specialize in manufacturing.21 In the developing world, there is an argument to be made that the globaliza- tion of labor, trade, and capital markets, along with bringing new knowledge and technologies, has con- tributed to economic instability and rising inequities within nations.22 Indeed, even those cities that have thrived in a more globally integrated world are experiencing challenges of unevenly shared prosperity. As Saskia Sassen has argued, the rise of the globally integrated city has coincided with the rise of the unequal city, across both developed and developing countries.23 Indeed, the Organization for Economic Cooperation and Development (OECD) has found that inequality tends
  • 12. to be higher and rising more quickly in large cities than in their surrounding nations due to skills’ distri- bution and the rise of high earners.24 Inequality may limit upward mobility and overall economic growth if it hinders investments in education and skills among earners at the bottom of the income distribution.25 Recognizing these costs is an important and urgent matter for public policy. But barring adoption of severe isolationist policies, global integration will con- tinue apace, and all cities must respond accordingly. REDEFINING GLOBAL CITIES THE SEVEN TYPES OF GLOBAL METRO ECONOMIES 9 T E C H N O L O G I C A L C H A N G E
  • 13. The information technology revolution, digitization, and labor-saving automation are altering modes of communication, the processes firms use to create and deliver products and services, and the very nature of work itself.26 The scale of these technological changes is signifi- cant and the pace of change has been relentless. The McKinsey Global Institute predicts that 12 emerg- ing technologies will generate an annual economic impact of up to $33 trillion by 2025.27 A recent Brookings study found that many of these technolo- gies will be developed and deployed within a set of 50 “advanced” industries, characterized by a reliance on high levels of research and development (R&D) and significant numbers of science, technology, engineer- ing, and mathematics (STEM) workers.28 Advanced industries matter because they drive pro- ductivity growth in an environment in which overall
  • 14. productivity growth has been lackluster.29 The aver- age worker in advanced industries is twice as produc- tive as the average worker outside the sector, due to these firms’ unique abilities to productively utilize new technologies and platforms. This productivity dif- ferential matters because it allows workers within the sector to earn wages double those of workers outside of it.30 Cities that can foster environments in which highly productive firms and workers can thrive enjoy the associated wage benefits. Risks accompany these high-tech breakthroughs, however. In the United States, a useful proxy for other advanced economies, already demonstrated technolo- gies have the potential to automate 45 percent of work activities in the United States.31 Indicative of the deployment by advanced industries of labor-saving technology, employment in advanced industries in U.S. cities has been flat since 1980, even while
  • 15. the sector’s value-added growth has soared. And technology-induced labor market changes are not a challenge just for the developed world. Increased automation in manufacturing is one reason why developing countries are deindustrializing at much lower levels of income. This trend suggests that manufacturing may not provide the same on-ramp for lower-income countries going forward, and the economic and political consequences of this shift may be significant.32 Especially as populations age and workforces retire, productivity growth, rather than labor force growth, will have to do the heavy lifting to maintain overall economic growth, especially in developed metro areas. In a study of 20 large national economies, the McKinsey Global Institute estimates that, to achieve global growth rates comparable to those experienced over the last 50 years, productivity growth will need
  • 16. to be 80 percent faster to compensate for slowing employment growth.33 Since technology appears to be such a critical input to worker, firm, and industry- level productivity, cities must understand and adapt to its impact. These three trends underscore a new economic real- ity for cities. For starters, urbanization has placed developing metro areas alongside their more devel- oped peers as the main sites for economic growth and development. This shift means that understanding global market currents requires an understanding of the economic dynamics playing out in the world’s cities. The opportunities and pressures of global integration mean that, to deliver prosperity for their residents, cities must proactively adapt and position workers, industries, and communities for the upsides of global engagement by investing in a competitive traded sector, maintaining infrastructure connec-
  • 17. tivity, and being open to global flows of capital and talent. To manage technological change and reap the productivity gains that will improve living standards, cities must cultivate innovation systems, skilled workforces, and digital infrastructure. All of these competitiveness assets must be stewarded by good governance and a stable business environment.34 B R O O K I N G S M E T R O P O L I TA N P O L I CY P R O G RA M 1 0 A framework for regional competitiveness Infrastructure Enablers Governance Trade
  • 18. Innovation TalentInnovationInnovation TalentTalentTalent Prosperity Source: Brookings Institution, RW Ventures, and McKinsey and Company. I I I . D A T A A N D M E T H O D S D E F I N I N G A N D M E A S U R I N G C O M P E T I T I V E N E S S FA C T O R S Given this global environment, this report focuses on the assets that matter for a metro economy’s com- petitiveness. We draw on the Harvard Business School definition of a competitive market as one in which firms can compete successfully in the global economy while supporting high and rising living standards for local households.35 Competitive regions are, by this definition, supportive environments for both compa- nies and people. This report draws on a five-factor competitiveness framework—tradable clusters, innovation, talent, infrastructure, and governance. Globally competitive
  • 19. traded sectors, innovation ecosystems, and skilled labor are the key drivers of overall productivity, employment creation, and income growth. “Enablers” support these drivers: well-connected infrastructure and reliable governance, public services, and the business environment (see box).36 Focusing on these fundamentals positions metropolitan economies to compete based on the distinct long-term value their industries and people can provide, and avoids economic strategies that attract firms through “race- to-the-bottom” techniques that compete via one-time tax breaks or low wages. REDEFINING GLOBAL CITIES THE SEVEN TYPES OF GLOBAL METRO
  • 20. ECONOMIES 1 1 Measuring competitiveness factors Tradable clusters: Tradable industries are a critical driver of prosperity and competitiveness. These industries are typically anchored by globally engaged firms, which have valuable spillovers for local economies. The traded sector can be measured in several ways. We measure tradable industries using data on greenfield foreign direct investment (i.e., investments that bring new plants or offices), which is inextricably bound up with traded industry clusters, and the productivity differential (measured as output per worker) between a metro area’s traded sector and that traded sector nationwide.37 Due to data limitations at the metropolitan scale, we are unable to standardize and measure domestic investments across industries or include data on global trade flows. Innovation: A region’s innovative capacity and levels of entrepreneurship both have implications for its ability to develop and deploy commercial applications, start new businesses, and maintain
  • 21. industrial competitiveness in the face of disruptive technological change.38 We measure innovation through patenting, venture capital flows, and the scientific impact of research universities.39 Talent: Human capital—the stock of knowledge, skills, expertise, and capacities embedded in the labor force—is of critical importance to enhancing productivity, raising incomes, and driving economic growth. We measure talent through the share of population with tertiary education.40 Infrastructure connectivity: Infrastructure connectivity matters for regional competitiveness because firms rely upon global access, both physically and digitally, to participate in the efficiencies of global value chains. We measure infrastructure connectivity through aviation passenger flows and internet download speeds.41 Due to data limitations we are unable to utilize standardized indicators on other important infrastructure metrics such as the quality of freight and logistics systems, roads, and public transit.
  • 22. Governance: Governance matters for competitiveness because proactive government, public, and civic groups can marshal investment from a variety of domestic and international sources to enable new growth strategies. Similarly, the efficiency with which government can deliver services and investments matters; highly fragmented metro areas tend to be less productive than their more cohesive counterparts. Central, provincial, and municipal governments also have unique and complementary roles to play in enabling firms and their wider regions to succeed in global markets.42 However, data limitations limit our ability to quantitatively measure governance in this report. S E L E C T I O N A N D D E F I N I T I O N O F M E T R O P O L I TA N A R E A S We deploy new, standardized metropolitan-level data to measure these factors for 123 large metro areas. This sample constitutes the largest metropolitan economies in the world in 2015 at purchasing power parity (PPP) rates for which data on these factors were available.43 With a few exceptions, these metro
  • 23. areas all tend to have economies larger than $100 billion in nominal terms. The sample’s average popula- tion is 7.6 million. As previous studies have shown, including Brookings’ own Global MetroMonitor and those by the McKinsey Global Institute and the World Bank, global growth is not solely powered by these large metro economies; in fact, small and mid-sized cities matter greatly.44 Data limitations, however, pre- vent us from analyzing a larger sample of economies B R O O K I N G S M E T R O P O L I TA N P O L I CY P R O G RA M 1 2 on all these factors. Given these limitations, we focus on the largest city-regions because they uniquely concentrate the assets that undergird global growth.
  • 24. They are the main infrastructure connection points to second- and third-tier cities. They cluster universities, skilled workers, and other innovation assets that yield the positive externalities and knowledge spillovers that generate endogenous growth.45 This study uses the general definition of a metro- politan area as an economic region comprising one or more cities and their surrounding areas, all linked by economic and commuting ties (see Appendix A). These definitions are the same as those used in previ- ous versions of Brookings’ Global MetroMonitor. We use the terms city, city-region, metro, metro area, and metro economy interchangeably to describe eco- nomic regions. M E T R O P O L I TA N T Y P O L O G Y A significant body of research has sought to classify global cities and measure their economic competitive- ness. This literature began with the seminal work of
  • 25. scholars like Peter Hall, John Friedmann and, most famously, Saskia Sassen, each of whom documented the unique role of a select handful of cities as the command and control centers of global finance.46 That work has since been extended. Perhaps the most commonly known classification of global cities comes from the research group Globalization and World Cities (GaWC), which has provided a rich theoretical and analytical understanding of how cities engage in the global economy through their unique concentra- tions of advanced services firms.47 In their capacity as analysts and investors, multilateral institutions like OECD and the World Bank offer valuable, rigor- ous assessments of growth and competitiveness in global metro areas. Greg Clark and Tim Moonen have found more than 200 indexes that have a global cities focus.48 In a summary of global city rankings, the Chicago
  • 26. Council on Global Affairs notes “how methodologies, definitions, data use, and conclusions vary wildly from ranking to ranking.” It also notes “biases and challenges common to many indexes, including the author’s perspective, lack of reliable and interna- tionally comparable data, and the routine presence of lagging indicators.”49 That report concludes that city officials and policymakers seek out assessments based on standardized data, look beyond topline rank- ings, and uncover comparative strengths and weak- nesses using relevant peers as a baseline comparison. Against the backdrop of these previous efforts, we develop a metropolitan typology based on regional economic characteristics and competitiveness factors. Classifying and identifying peers allows policymakers and stakeholders to better understand the position of their economies in a globalized context as well as to conduct constructive benchmarking. To select peers
  • 27. we utilized a combination of principal components analysis (PCA), k-means clustering, and agglomera- tive hierarchical clustering.50 These commonly used data science techniques allowed us to group metro areas with their closest peers given a set of economic and competitiveness indicators. We used 35 variables in the PCA analysis (see Table 1). We do not include change-over-time metrics in the clustering algorithm, but analyze change variables within and across metropolitan groupings to summarize key trends. For more details, see Appendix A. This report creates metropolitan groupings based on these factors, summarizes the distinguishing characteristics of each group, and then examines trends within each using a range of indicators. It is important to clarify the two ways in which we use these data. First, we use point-in-time data to create the metropolitan typology. Those indicators and their
  • 28. vintage are outlined in Table 1. Second, we examine change-over-time trends for these same indicators within the analysis. The variables used to measure competitiveness factors come from a variety of sources, including public and private datasets, and as a result the periods for which we can measure key characteristics vary considerably. The analysis of economic and industrial characteristics looks at data between 2000 and 2015; for flows of greenfield FDI we use data corresponding to 2009-2015; for venture capital flows we use data for 2006-2015; for patents we look at stock of patents between 2008 and 2012; REDEFINING GLOBAL CITIES THE SEVEN TYPES OF GLOBAL METRO ECONOMIES
  • 29. 1 3 to measure impact of university research we use the 2010-2013 period; the analysis of population with tertiary education corresponds to 2014 or latest year available; aviation passengers uses data for 2004 and 2014; and internet average download speed corresponds to the 2008- 2015 period. For a more detailed description of the data sources please see Appendix A. Table 1. Indicators used in the clustering algorithm, 2015 or most recent year available Dimension Indicator Source Economic and Industrial Characteristics Population, 2015 Oxford Economics, U.S. Census Bureau Gross domestic product, 2015 Oxford Economics, Moody's Analytics Gross domestic product per capita, 2015 Oxford Economics, Moody's Analytics,
  • 30. U.S. Census Bureau Output per worker, 2015 Oxford Economics, Moody's Analytics Industry share of overall output, 2015 Oxford Economics, Moody's Analytics Industry output per worker, 2015 Oxford Economics, Moody's Analytics Traded Clusters Greenfield foreign direct investment, 2009- 2015 fDi Intelligence data Greenfield foreign direct investment per capita, 2009-2015 Greenfield foreign direct investment jobs created, 2009-2015 Innovation Share of total publications in top 10 percent cited papers, 2010-2013 Centre for Science and Technology Studies (CWTS) and Leiden University dataShare of total publications done with industry, 2010-2013 Total patents, 2008-2012 REGPAT
  • 31. Total patents per capita, 2008-2012 Venture capital investments, millions of dollars per 1,000 inhabitants, 2006-2015 Pitchbook Venture capital investments, millions of dollars, 2006-2015 Talent Share of population 15+ with tertiary education, 2014 or latest year available Oxford Economics, U.S. Census Bureau Infrastructure Connectivity Total aviation passengers, 2014 SABRE Total aviation passengers per capita, 2014 Average internet download speed, 2015 Net Index Governance Data not available across all metro areas N/A Source: Oxford Economics, U.S. Census Bureau, Moody’s Analytics, fDi Intelligence data, Centre for Science and Technology Studies (CWTS) and Leiden University data, REGPAT, Pitchbook, and SABRE.
  • 32. B R O O K I N G S M E T R O P O L I TA N P O L I CY P R O G RA M 1 4 These metros concentrate economic activity because they house the competitiveness assets required to drive global growth. They have attracted more than $5.4 trillion in greenfield FDI since 2009, more than one-quarter of the global total; six of the top 10 larg- est inflows were destined for the Asian metros of Singapore, Shanghai, Hong Kong, Beijing, Suzhou, and Chongqing. When controlling for population size, FDI concentrations are still greatest in many of these Asian metros, but smaller metro economies in North America (Austin and Vancouver), Europe (Birmingham and Barcelona), and Australia (Sydney) also join the top 10.
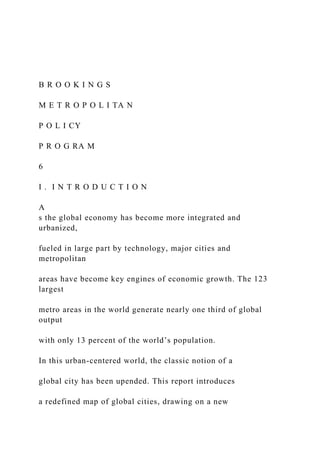
  • 33. The top 123 metro economies are critical generators of new scientific research and innovation. Together, they account for 44 percent of the world’s most scientifically impactful research universities, gener- ate 65 percent of all patents, and attract 82 percent of all venture capital. The largest patent-producing metros are among the largest economies in the world, including Tokyo, Seoul-Incheon, Shenzhen, Osaka, and San Jose. However, in terms of patents per capita a smaller set of highly innovative cities rises to the top: San Jose, San Diego, San Francisco, Boston, and Stuttgart. Many of these metro areas I V. M A P P I N G T H E E C O N O M I C A S S E T S O F G L O B A L C I T I E S T he world’s large metropolitan areas are notable in their economic primacy. With about 13 percent of the world’s people, 123 large metro economies generate nearly one-third of global economic output. Nearly
  • 34. all of the 123 largest metro economies studied in our analysis generate more than $100 billion in annual economic output (in nominal terms), led by Tokyo ($1.6 trillion) and New York ($1.5 trillion).51 Figure 1. Global share of competitiveness factors, 123 largest metros, 2015 or most recent year available Airports in Top 50 by Passenger Traffic Venture Capital Stock PatentsResearch Universities Global Output FDI flowGlobal
  • 35. Population 86% 82% 65% 44% 32% 27% 13% Source: Oxford Economics, U.S. Census Bureau, Moody’s Analytics, fDi Intelligence data, Centre for Science and Technology Studies (CWTS) and Leiden University data, REGPAT, and Pitchbook. REDEFINING GLOBAL CITIES THE SEVEN TYPES OF GLOBAL METRO ECONOMIES 1 5 are also among the most educated in the world.
  • 36. San Jose, San Francisco, and Boston join Singapore, London, Washington, and Madrid as the metros with the highest shares of their populations with tertiary education. These metros also concentrate much of the world’s critical infrastructure. In 2014, airports in these metro areas transported more than 4.9 billion air passen- gers. The largest metro economies in the world, which house multiple large airports, move the most avia- tion passengers. New York, London, Shanghai, Los Angeles, Tokyo, Beijing, Chicago, and Atlanta had the highest passenger volumes in 2014. The 123-metro sample contains 86 percent of the world’s 50 busiest international airports. T H E S E V E N T Y P E S O F G L O B A L C I T I E S This collective economic clout, however, masks the significant variation in which competiveness factors
  • 37. are distributed across these cities. While each met- ropolitan economy in our sample possesses a unique trade, innovation, talent, and infrastructure connectiv- ity profile, the distribution of these assets reveals a clear typology of places. We used advanced statistical techniques to cluster metro economies based on their size, industrial structure, and competitiveness fac- tors. In some cases, these groupings align to specific regions, like in China or the United States. But just as often the groupings unite metro economies from dif- ferent parts of the world, showcasing that they share more in common with far-flung counterparts than with their regional neighbors. And while we include only point-in-time measures in the clustering algo- rithm, the resulting groupings perform quite similarly on growth metrics. Map 1. Seven Types of Global Cities, 2015 123 Largest Metropolitan Areas Groups
  • 38. Factory China Knowledge Capitals Emerging Gateways Asian Anchors Global Giants American Middleweights International Middleweights B R O O K I N G S M E T R O P O L I TA N P O L I CY P R O G RA M 1 6 When grouped into seven metropolitan categories, the distinct competitive positions of the world’s larg- est metro economies become sharper, and the result is a resource that peer metropolitan areas can utilize for common solutions and investments to enhance
  • 39. economic growth: ä Global Giants: six large, wealthy hubs with concen- trations of corporate headquarters; they serve as the command and control centers for the world’s largest advanced economies. ä Asian Anchors: five large, business and financial nodes anchoring inward investment into the Asia- Pacific and Russia. ä Emerging Gateways: 28 large business and transportation entry points for major national and regional emerging markets in Africa, Asia, Eastern Europe, and Latin America. ä Factory China: 22 second- and third-tier Chinese cities distinctly reliant on export-intensive manu- facturing to power economic growth and global engagement. ä Knowledge Capitals: 19 mid-sized, highly produc- tive knowledge creation centers in the United
  • 40. States and Europe with talented workforces and elite research universities. ä American Middleweights: 16 mid-sized U.S. metro areas striving for a post-recession niche in the global economy. ä International Middleweights: 26 mid-sized cities in Australia, Canada, and Europe globally con- nected by people and investment flows, but where growth has lagged after the financial crisis. Table 2. Seven types of global cities, 2015 Group name Metro areas Number of observations Global Giants London, Los Angeles, New York, Osaka-Kobe, Paris, and Tokyo 6 Asian Anchors Beijing, Hong Kong, Moscow, Seoul-Incheon, Shanghai, and Singapore 6 Emerging Gateways
  • 41. Ankara, Brasilia, Busan-Ulsan, Cape Town, Chongqing, Delhi, East Rand, Guangzhou, Hangzhou, Istanbul, Jinan, Johannesburg, Katowice-Ostrava, Mexico City, Monterrey, Mumbai, Nanjing, Ningbo, Pretoria, Rio de Janeiro, Saint Petersburg, Santiago, Sao Paulo, Shenzhen, Tianjin, Warsaw, Wuhan, and Xi'an. 28 Factory China Changchun, Changsha, Changzhou, Chengdu, Dalian, Dongguan, Foshan, Fuzhou, Haerbin, Hefei, Nantong, Qingdao, Shenyang, Shijiazhuang, Suzhou, Tangshan, Wenzhou, Wuxi, Xuzhou, Yantai, Zhengzhou, and Zibo 22 Knowledge Capitals Atlanta, Austin, Baltimore, Boston, Chicago, Dallas, Denver, Hartford, Houston, Minneapolis, Philadelphia, Portland, San Diego, San Francisco, San Jose, Seattle, Stockholm, Washington DC, and Zurich
  • 42. 19 American Middleweights Charlotte, Cincinnati, Cleveland, Columbus, Detroit, Indianapolis, Kansas City, Miami, Orlando, Phoenix, Pittsburgh, Riverside, Sacramento, San Antonio, St. Louis, and Tampa 16 International Middleweights Brussels, Copenhagen-Malmö, Frankfurt, Hamburg, Karlsruhe, Köln-Düsseldorf, Milan, Munich, Nagoya, Rome, Rotterdam-Amsterdam, Stuttgart, Vienna- Bratislava, Athens, Barcelona, Berlin, Birmingham, (UK), Kitakyushu-Fukuoka, Madrid, Melbourne, Montreal, Perth, Sydney, Tel Aviv, Toronto, and Vancouver 26
  • 43. REDEFINING GLOBAL CITIES THE SEVEN TYPES OF GLOBAL METRO ECONOMIES 1 7 G L O B A L G I A N T S G lobal Giants serve as the command and con- trol centers of the world’s largest advanced nations. This group includes the largest cities in the United States (New York and Los Angeles), Japan (Tokyo and Osaka-Kobe), France (Paris), and the United Kingdom (London). These metro areas not only serve as the main entry points for their extremely powerful nations, but as the world’s most significant concentrations of wealth, corporate deci- sion making, and international exchange.
  • 44. The first characteristic that binds these metro areas together is their size. On average, Global Giants house 19.4 million residents and generate over $1 trillion in real output, three times more than the next largest set of economies, the Asian Anchors. If they were a single country, they would be the world’s third largest economy. Beyond their overall economic clout, these metro economies are highly productive and generate enormous wealth. They have the second highest aver- age nominal GDP per person ($58,000) and GDP per worker ($116,000) among the metro groups, behind only the Knowledge Capitals. These wealth levels stem from the concentration of financial and business services, which generate 41 percent of gross value added (GVA), on average, in this group. About 20 percent of the Forbes Global Map 2. Global Giants, 2015 Figure 2. Global Giant indicators, 2015 or most recent year available
  • 46. GDPGDP per worker GDP per capita GDP Economic characteristics Economic growth Traded clusters Innovation Talent Infrastructure connectivity (+) (-) Metro Average (n=123)(-) Metro Average (n=123)(-) Metro Average (n=123) Source: Oxford Economics, U.S. Census Bureau, Moody’s Analytics, fDi Intelligence data, Centre for Science and Technology Studies (CWTS) and Leiden University data, REGPAT, Pitchbook, and SABRE. B R O O K I N G S M E T R O P O L I TA N P O L I CY P R O G RA M 1 8
  • 47. Table 3. Global Giants economic indicators, 2015 Cities Population 2015 (thousands) Nominal GDP 2015 ($ millions) Nominal GDP per capita 2015 ($) Tokyo 37,004 1,623,904 43,884 New York 20,182 1,492,242 73,938 Los Angeles 13,340 927,562 69,532 London 14,855 831,100 55,947 Paris 12,524 818,522 65,354 Osaka-Kobe 18,640 680,997 36,535 Global Giants Average 19,424 1,062,388 57,532 Source: Oxford Economics, U.S. Census Bureau, and Moody’s Analytics. Figure 3. Average metropolitan gross domestic product, 2015 American
  • 49. Figure 4. Gross value added by type of service, 2015 Other Sectors Business, Financial, Professional Services Factory China Emerging Gateways American Middleweights International Middleweights Knowledge Capitals Asian Anchors
  • 50. Global Giants 88% 74% 69%68% 64% 60%59% 12% 26% 31%32%36% 40%41% Source: Oxford Economics, U.S. Census Bureau, and Moody’s Analytics. REDEFINING GLOBAL CITIES THE SEVEN TYPES OF GLOBAL METRO ECONOMIES 1 9 2000 and 18 percent of global firms with more than
  • 51. $1 billion in revenue, plus five of the world’s seven largest stock exchanges by market capitalization, are headquartered in these six markets. Dense clusters of advanced-producer-services firms in law, accounting, management consulting, and advertising have formed to support the complex decision making occurring in the financial markets and board rooms of multina- tional firms.53 These are also the world’s major nodes for flows of people, capital, and knowledge. In 2014, over 800 million aviation passengers traveled through these markets, by far the highest total of any grouping. Global travelers often stay to live and work; a little under one in six residents of a Global Giant is foreign born.54 Capital flows seamlessly through Global Giants. Foreign investors parked an average of $25 billion in these markets between 2009 and 2015, the second highest after the Asian Anchors. Finally, knowledge
  • 52. creation is increasingly a major function of these metro economies. Among the seven types of metro areas, Global Giants have the highest education levels, the second highest patenting rates, and the second highest share of high-impact scientific publications in their universities. Every metro area except Osaka is among the top 15 globally in terms of digital data flows.55 And venture capital investment data reveal that they are also sites for budding entrepreneurship, especially London and New York.56 By nearly every measure these cities are globally inte- grated and fluent. Saskia Sassen mainstreamed the phrase “global city” in her 1991 book about London, New York, and Tokyo. The world’s mobile talent and capital seek them out, and they have benefited from multiple cycles of high demand.57 Paris is regularly cited in this class of global city, but Los Angeles and Osaka may be more surprising additions given that
  • 53. they are not generally considered among the world’s leading financial hubs. However, they loom large on the global stage by dint of their shear economic weight—Los Angeles and Osaka are the fifth and sixth largest metro economies in the world, respectively. B R O O K I N G S M E T R O P O L I TA N P O L I CY P R O G RA M 2 0 A S I A N A N C H O R S A sian Anchors include five Pacific-facing metro areas—Beijing, Hong Kong, Seoul-Incheon, Shanghai, and Singapore— as well as Moscow, which, while more aligned with Europe, falls in this group due to its similarity in size, wealth, and reliance
  • 54. on business and financial services with many of these Asian metro economies.58 Asian Anchors have many of the same characteristics as their established coun- terparts in Europe, Japan, and the United States, but are not yet as wealthy and globally connected. The rise of the metros in this group has everything to do with the rise of Asia. The ascent of the Asian Tiger economies followed by the gradual liberalization of China and Russia positioned these cities as the gate- ways between the global investment community and their fast-growing nations. Those foreign investment streams brought new industries and capabilities to many of these cities, which have since been bolstered by local investments in infrastructure and skills. Asian Anchors are now among the cities with the larg- est concentrations of people and market activity in the Map 3. Asian Anchors, 2015 Figure 5. Asian Anchors indicators, 2015 or most recent year available
  • 56. GDPGDP per worker GDP per capita GDP Economic characteristics Economic growth Traded clusters Innovation Talent Infrastructure connectivity (+) (-) Metro Average (n=123)(-) Metro Average (n=123)(-) Metro Average (n=123) Source: Oxford Economics, U.S. Census Bureau, Moody’s Analytics, fDi Intelligence data, Centre for Science and Technology Studies (CWTS) and Leiden University data, REGPAT, Pitchbook, and SABRE. REDEFINING GLOBAL CITIES THE SEVEN TYPES OF GLOBAL METRO ECONOMIES
  • 57. 2 1 world. These metros have an average population of 16.1 million residents and an average GDP of $668 billion, the second largest figures among the seven groups. GDP per capita in these regions has grown by a robust 4.2 percent per year since 2000. On average residents of the Asian Anchors are now firmly rooted in the global middle class. Interestingly, this average masks significant differences in nominal GDP per capita among the wealthiest metros in this group, Singapore ($84,000) and Hong Kong ($57,000), and the lowest-income metros, Shanghai ($33,000) and Beijing ($30,000). In line with convergence theory, the lower-income city-regions in this group have seen the fastest income growth since 2000. Despite their disparities in wealth, several character- istics bind this group, especially the five Asian metro areas. First, the generous inflows of FDI distinguish
  • 58. these regions from the rest of the world. On average, $46 billion in greenfield FDI entered each of these markets between 2009 and 2015, nearly double the average of the next highest grouping. No metro areas in the world attracted more FDI than Hong Kong and Singapore during this period, and Beijing and Shanghai were not far behind. These cities provide a distinct value proposition for foreign investment: they afford access to a rapidly growing Asian consumer market; they provide strong infrastructure connec- tivity—Asian Anchors rank second in total aviation Table 4. Asian Anchors economic indicators, 2015 Cities Population 2015 (thousands) Nominal GDP 2015 ($ millions) Nominal GDP per capita
  • 59. 2015 ($) Seoul-Incheon 25,095 903,466 36,002 Shanghai 24,768 809,507 32,684 Moscow 12,194 749,686 61,482 Beijing 21,876 663,590 30,335 Singapore 5,546 468,087 84,399 Hong Kong 7,295 413,999 56,751 Asian Anchors Average 16,129 668,056 50,276 Source: Oxford Economics. Figure 6. Greenfield foreign direct investment in metropolitan groups (millions of $US), 2009-2015 American Middleweights Knowledge Capitals Factory China International Middleweights
  • 60. Emerging Gateways Global Giants Asian Anchors $2,414 $4,671$5,894 $8,681 $10,823 $25,417 $45,966 Source: Brookings analysis of fDi Intelligence and Oxford Economics data. B R O O K I N G S M E T R O P O L I TA N P O L I CY P R O G RA M
  • 61. 2 2 passengers, behind Global Giants, and first in average internet download speed and relatively well-educated workforces; and they offer a more conducive regula- tory and political environment than many peers in the region.59 It is notable that Moscow has not kept pace with the other Asian metros in this category in regard to FDI attraction. These metro areas, along with Tokyo and Osaka- Kobe, are where Asia’s business gets done. About 32 percent of gross value added in these six metros is generated by financial and business services, 10 per- cent of Global 2000 firms are headquartered in these markets, and major stock exchanges are located in Shanghai, Hong Kong, and Seoul. Singapore is a sig- nificant financial trading hub in its own right. And 41 percent of Moscow’s GVA is in financial and business services.
  • 62. Yet, labor productivity in this sector is only about one- third as high as in Global Giants, revealing that much work needs to be done to move further up the value- added chain. These metro areas are not yet on par with their Western counterparts in terms of patenting intensity or the scientific impact of their universities, although they can be considered the innovation hubs of their respective countries. Beijing and Shanghai together generate 23 percent of China’s patents, Moscow generates 55 percent of Russia’s, and Seoul- Incheon generates 67 percent of South Korea’s. Patents per capita increased by 78 percent across Asian Anchors between 2007 and 2012. And the share of scientific publications generated in these markets that can be considered high-impact increased by 18 percent between 2009 and 2013, the second fastest increase among the seven groupings.
  • 63. REDEFINING GLOBAL CITIES THE SEVEN TYPES OF GLOBAL METRO ECONOMIES 2 3 E M E R G I N G G AT E WAY S E merging Gateways are 28 large metropolitan areas from developing economies that serve as the business, transportation, and oftentimes political centers of their countries and regions. Nearly one-third of the cities in this group are the official capital of their respective countries (e.g., Ankara, Brasilia, Cape Town, Mexico City, Pretoria, Santiago, and Warsaw). In fact, eight of the metropolitan areas in this group serve as the financial centers of their countries and house the largest national stock exchange. Many of these cities served as the focal
  • 64. point of their national economies as the countries liberalized their markets for flows of trade, invest- ment, and people at the end of the 20th century.60 Additionally some of these cities also serve as gateways for entire regions, as is the case for São Paulo in financial and business services within South America61; Istanbul connecting the Middle East and Europe; Johannesburg as the business hub of sub- Saharan Africa; and Shenzhen as a major complemen- tary business hub in China to Beijing, Hong Kong, and Shanghai.62 Map 4. Emerging Gateways, 2015 Figure 7. Emerging Gateways indicators, 2015 or most recent year available Download speed Aviation passengers Population with tertiary
  • 65. education Venture capital investment Patents per capita Scientific research impact FDI per capita FDI stockTraded sector productivity differential GDP per worker GDP per capita GDPGDP per worker GDP per capita GDP
  • 66. Economic characteristics Economic growth Traded clusters Innovation Talent Infrastructure connectivity (+) (-) Metro Average (n=123)(-) Metro Average (n=123)(-) Metro Average (n=123) Source: Oxford Economics, U.S. Census Bureau, Moody’s Analytics, fDi Intelligence data, Centre for Science and Technology Studies (CWTS) and Leiden University data, REGPAT, Pitchbook, and SABRE. B R O O K I N G S M E T R O P O L I TA N P O L I CY P R O G RA M 24 Metropolitan areas in this group house on aver age 10 million inhabitants and have an average GDP of $265 billion, with some megacities boasting economies of more than $400 billion (São Paulo, Guangzhou, Shenzhen, Mexico City, Tianjin, Istanbul,
  • 67. and Chongqing). The average inhabitant of these metro areas entered the global middle class over the past 15 years. Real GDP per capita in Emerging Gateways has grown 5.5 percent annually since 2000 (second fastest after Factory China metros). Nominal GDP per capita now stands at around $28,000. Asian metro areas in this group experienced greater GDP per capita gains (8.1 percent annually) between 2000 and 2015 than did their Latin American (3.2 percent) and African counterparts (3.6 percent). Table 5. Emerging Gateways economic indicators, 2015 Cities Population 2015 (thousands) Nominal GDP 2015 ($ millions) Nominal GDP per capita 2015 ($)
  • 68. Sao Paulo 21,175 579,473 27,366 Guangzhou 13,155 523,554 39,800 Shenzhen 10,816 490,761 45,374 Mexico City 21,099 485,621 23,017 Tianjin 15,646 477,808 30,538 Istanbul 14,627 449,388 30,723 Chongqing 30,159 425,472 14,108 Delhi 23,513 396,449 16,861 Wuhan 10,261 323,517 31,529 Busan-Ulsan 7,812 305,931 39,160 Hangzhou 8,922 274,969 30,820 Nanjing 8,245 271,934 32,983 Rio de Janeiro 12,172 233,238 19,162 Ningbo 7,724 233,000 30,166 Mumbai 21,799 221,192 10,147 Santiago 7,300 213,908 29,303 Jinan 7,066 174,317 24,671 Warsaw 2,901 164,068 56,564
  • 69. Xi’an 8,606 160,578 18,658 Brasilia 4,076 159,587 39,150 Saint Petersburg 5,190 158,084 30,459 Monterrey 4,404 140,512 31,906 Katowice-Ostrava 5,008 136,218 27,200 Ankara 5,226 133,934 25,630 Johannesburg 4,725 94,096 19,913 Cape Town 3,976 66,599 16,750 East Rand 3,306 62,492 18,904 Pretoria 3,200 61,240 19,141 Emerging Gateways Average 10,432 264,926 27,857 Source: Oxford Economics. REDEFINING GLOBAL CITIES THE SEVEN TYPES OF GLOBAL METRO ECONOMIES
  • 70. 2 5 These regions disproportionately concentrate their nation’s competitiveness assets. All the cities in this group have a higher share of their working-age population with tertiary education compared to their national economies. Many are home to their nation’s only globally relevant research universities. Cities like Istanbul, Santiago, São Paulo, and Shenzhen account for more than 40 percent of all the patents produced in their countries. Business, professional, and techni- cal services accounted for 25 percent of total output in these metro areas. However, the productivity of the average worker in this sector is one fifth that of their peer metros in the Knowledge Capitals, Global Giants, and American Middleweight group. Emerging Gateways are the entry points for global flows of people and capital. They typically house the best-connected international airports of their nations.
  • 71. In 2014 all the airports in these metropolitan areas transported 800 million passengers, up from the 273 million in 2004. In fact, the average metro, which in 2014 transported 28 million passengers per year, up from 9 million passengers in 2004, registered the second fastest annual passenger growth rate—3.5 percent—among all groups, behind only Factory China. Metropolitan areas in this group received FDI flows of $58 billion between 2009 and 2015, but on a per capita basis these investment flows trail most of the other metro groups. They are not yet on par with the Global Giants in terms of international business or with Knowledge Capitals in terms of global innovation, although their prominence is growing quickly. FDI flows doubled between 2011 and 2015, and the stock of venture capital investment grew by 300 percent, from $4.3 billion in 2010 to $14.1 billion in 2015. Figure 8. Output per worker in business, financial, and
  • 72. professional services in metropolitan groups, (thousands of real USD), 201563 Emerging Gateways Asian Anchors International Middleweights American Middleweights Global Giants Knowledge Capitals 53 66 158 229 248 254 Source: Brookings analysis of Oxford Economics data. Figure 9. Aviation passengers compound annual growth in metropolitan groups, 2004-2014 American Middleweights Knowledge Capitals
  • 73. Global Giants International Middleweights Asian Anchors Emerging Gateways Factory China 0.2% 0.3% 0.4% 1.0% 2.3% 3.5% 7.1% Source: Brookings analysis of SABRE data. B R O O K I N G S M E T R O P O L I TA N P O L I CY P R O G RA M
  • 74. 2 6 FA C T O R Y C H I N A F actory China comprises Chinese manufacturing hubs, and the 22 cities are a good represen- tation of the geographic diversity of China’s industrial revolution. Factory China includes metros on China’s east coast (Hefei and Nantong), inland regions (Chengdu and Zibo), and the Pearl River Delta (Foshan and Dongguan).64 The metro areas in Factory China are second- and third-tier population centers that are growing quickly. The typical city in this group has an average popula- tion of 8 million and a nominal GDP of $205 billion. Output and employment have grown in these met- ros by an outstanding 12.6 and 4.7 percent annually between 2000 and 2015, the fastest pace among our seven groups. Real GDP per capita has expanded
  • 75. fivefold since 2000, from $2,500 to $12,000, rooting these metros firmly in the global middle class. Map 5. Factory China, 2015 Figure 10. Factory China indicators, 2015 or most recent year available Download speed Aviation passengers Population with tertiary education Venture capital investment Patents per capita Scientific research impact FDI per capita FDI stockTraded sector
  • 76. productivity differential GDP per worker GDP per capita GDPGDP per worker GDP per capita GDP Economic characteristics Economic growth Traded clusters Innovation Talent Infrastructure connectivity (+) (-) Metro Average (n=123)(-) Metro Average (n=123)(-) Metro Average (n=123) Source: Oxford Economics, U.S. Census Bureau, Moody’s Analytics, fDi Intelligence data, Centre for Science and Technology Studies (CWTS) and Leiden University data, REGPAT, Pitchbook, and SABRE. REDEFINING
  • 77. GLOBAL CITIES THE SEVEN TYPES OF GLOBAL METRO ECONOMIES 2 7 The most salient feature of this group is the extreme reliance on manufacturing, which accounts for nearly 40 percent of total output in the typical Factory China city, the highest among all groups. In fact, Factory China cities were more manufacturing-intensive in 2015 than they were in 2000, when manufacturing accounted only for 30 percent of their GDP. With only 25 percent of national population, Factory China met- ros generate one-third ($800 billion) of China’s total manufacturing value added. Factory China metro areas plug into the global econ- omy as nodes in international manufacturing supply chains, typically providing goods to wealthier con-
  • 78. sumer markets in advanced economies. Multinational corporations like Unilever (operating in Hefei), Goodyear (Dalian), Samsung (Dongguan), DuPont (Dongguan and Changshu), Intel (Dalian), Pfizer (Dalian and Hangzhou), and Dell (Chengdu) anchor manufacturing operations in Factory China.65 This specialization has proved effective in building wealth and moving millions of Chinese households into the global middle class. But growth has come with significant environmental costs. The heavy industrial Table 6. Factory China economic indicators, 2015 Cities Population 2015 (thousands) Nominal GDP 2015 ($ millions) Nominal GDP per capita 2015 ($)
  • 79. Suzhou 10,658 440,255 41,306 Chengdu 14,407 306,458 21,272 Wuxi 6,526 269,957 41,368 Qingdao 9,054 265,789 29,357 Changsha 7,308 245,571 33,604 Dalian 6,942 245,161 35,317 Foshan 7,424 234,737 31,620 Shenyang 8,257 230,103 27,869 Zhengzhou 9,203 209,690 22,784 Tangshan 7,803 190,743 24,446 Dongguan 8,466 186,042 21,976 Yantai 7,057 183,501 26,003 Nantong 7,357 169,781 23,079 Changchun 7,601 162,933 21,435 Fuzhou 7,444 159,572 21,437 Haerbin 10,669 159,238 14,926 Hefei 6,043 156,989 25,979 Shijiazhuang 10,644 156,264 14,681
  • 80. Xuzhou 8,660 149,682 17,284 Changzhou 4,727 147,281 31,155 Wenzhou 9,275 131,441 14,172 Zibo 4,633 123,273 26,608 Factory China Average 8,189 205,657 25,804 Source: Oxford Economics. B R O O K I N G S M E T R O P O L I TA N P O L I CY P R O G RA M 2 8 activity has resulted in pollutant levels that are 40 times above what the World Health Organization recommends, and 40 percent of China’s rivers are polluted.66 Currently, business, financial, and professional ser- vices—economic activities typically associated with
  • 81. urban agglomeration—account for only 12 percent of total output in this group, well below the average of 32 percent for the other groups. The lack of economic diversification partly explains why cities in this cluster rank last in flows of FDI, venture capital attraction, and international passengers. Additionally, only 13 of the cities in this group house a top-ranked research university. Factory China metros file only 0.03 patents per 10,000 employees, and less than 10 percent of the population 15 years or older has tertiary education. Figure 11. Manufacturing share of real gross value added in metropolitan groups, 2015 Global Giants American Middleweights Knowledge Capitals International Middleweights Asian Anchors Emerging Gateways Factory China
  • 82. 10.1% 10.7% 12.4% 14.5% 17.4% 23.7% 39.5% Source: Brookings analysis of Oxford Economics and Moody’s Analytics data. “Factory China metro areas plug into the global econ omy as nodes in international manufacturing supply chains, typically providing goods to wealthier con sumer markets in advanced economies.” REDEFINING GLOBAL CITIES THE SEVEN TYPES OF GLOBAL METRO ECONOMIES
  • 83. 2 9 K N O W L E D G E C A P I TA L S K nowledge Capitals tend to be mid-sized population centers that are among the wealthiest and most productive in the world. This group of 19 metropolitan economies has an average population of 4.2 million, the second smallest group by population. But because they are so productive, these metro areas have the third highest average economic output ($283 billion) and the highest nominal GDP per capita ($69,000) and GDP per worker ($136,000) of any group. Map 6. Knowledge Capitals, 2015 Figure 12. Knowledge Capitals indicators, 2015 or most recent year available Download speed Aviation passengers
  • 84. Population with tertiary education Venture capital investment Patents per capita Scientific research impact FDI per capita FDI stockTraded sector productivity differential GDP per worker GDP per capita GDPGDP per worker GDP per capita
  • 85. GDP Economic characteristics Economic growth Traded clusters Innovation Talent Infrastructure connectivity (+) (-) Metro Average (n=123)(-) Metro Average (n=123)(-) Metro Average (n=123) Source: Oxford Economics, U.S. Census Bureau, Moody’s Analytics, fDi Intelligence data, Centre for Science and Technology Studies (CWTS) and Leiden University data, REGPAT, Pitchbook, and SABRE. B R O O K I N G S M E T R O P O L I TA N P O L I CY P R O G RA M 3 0 Knowledge Capitals are the world’s leading knowl- edge creation centers. They compete in the highest value-added segments of the economy, relying on their significant stock of human capital, innovative
  • 86. universities and entrepreneurs, and relatively sound infrastructure connectivity. These places are supremely well educated: 41 per- cent of their 15-and-over population has obtained a college degree. Many of these are graduates from the elite research universities that anchor these metro economies’ distinct positions in science and technol- ogy. Universities in this group boast the largest share of highly cited scientific publications. Of the 100 most scientifically impactful universities in the world, 20 are located in these cities. Scientific research tends to translate to new inven- tions in these regions, which have the highest average rates of patenting in the world. With only about 1 percent of the world’s population, Knowledge Capitals generated 16 percent of global patents between 2008 and 2012; shares were even higher in information technology (22 percent) and life sciences (19 per-
  • 87. cent). Led by San Jose, San Francisco, and Boston, Knowledge Capitals also have, by far, the highest ven- ture capital investment rates per capita in the world. More than half of all global venture capital funding flowed to these 19 markets over the past decade. Finally, controlling for their population size, these metro economies have the greatest volume of avia- tion passengers in the world, signifying the substan- tial flows of business and leisure travelers flocking Table 7. Knowledge Capitals economic indicators, 2015 Cities Population 2015 (thousands) Nominal GDP 2015 ($ millions) Nominal GDP per capita 2015 ($) Chicago 9,551 582,496 60,988
  • 88. Houston 6,657 505,218 75,893 Dallas 7,103 458,043 64,488 Washington 6,098 454,088 74,469 San Francisco 4,656 375,055 80,551 Boston 4,774 370,731 77,651 Philadelphia 6,070 363,644 59,910 Atlanta 5,711 310,822 54,427 Seattle 3,734 285,634 76,504 Minneapolis 3,525 227,417 64,523 San Diego 3,300 217,562 65,938 San Jose 1,977 180,757 91,437 Denver 2,814 179,882 63,916 Baltimore 2,797 178,121 63,673 Stockholm 2,615 167,911 64,223 Portland, Ore. 2,389 159,219 66,640 Zurich 1,972 135,596 68,761 Austin 2,001 119,234 59,591 Hartford 1,211 101,787 84,029
  • 89. Knowledge Capitals 4,155 282,801 69,348 Source: Oxford Economics, U.S. Census Bureau, and Moody’s Analytics. REDEFINING GLOBAL CITIES THE SEVEN TYPES OF GLOBAL METRO ECONOMIES 3 1 to these places. However, foreign direct investment inflows are not as substantial as in other groupings, revealing that, for all their assets, many of these mid- sized metros must proactively assert their visibility in the global marketplace. Knowledge Capitals overwhelmingly are located in the United States. All but two (Stockholm and Zurich) are U.S. cities, including well-known coastal innova-
  • 90. tion hubs like Boston, San Francisco, San Jose, and Seattle. But they also include metro economies in the Midwest (Chicago, Minneapolis-St. Paul) and the South (Atlanta, Austin, Dallas, Houston), which now tend to compete in technology-intensive advanced industries across both manufacturing and services.67 Stockholm and Zurich represent two of Europe’s wealthiest and most productive economies, specializing in profes- sional, scientific, and technical services; finance; and information technology. Overall, output per worker in these metro areas is 9 percent higher than in the next most productive metro grouping. Not only are Knowledge Capitals more productive than the rest of their advanced economy peers, but the gap is widening. Between 2000 and 2015, growth in annual GDP per capita and GDP per worker aver- aged 0.9 and 1.4 percent, respectively, in Knowledge Capitals. This is by no means a blistering pace, but
  • 91. these growth rates are 37 percent and 69 percent faster, respectively, then average growth rates across the other three developed-economy groupings. Figure 13. Global Share of innovation assets in Knowledge Capital metros, 2015 or most recent year available Venture CapitalPatentsTop 750 Research Universities Population 50% 16% 6% 1% Source: Brookings analysis of Oxford Economics, U.S. Census Bureau, Centre for Science and Technology Studies (CWTS) and Leiden University, REGPAT, and Pitchbook. “Knowledge Capitals are the world’s leading knowl edge creation centers. They compete in the highest value-added segments of the economy, relying on their significant stock of human capital,
  • 92. innovative universities and entrepreneurs, and relatively sound infrastructure connectivity.” B R O O K I N G S M E T R O P O L I TA N P O L I CY P R O G RA M 3 2 A M E R I C A N M I D D L E W E I G H T S S ixteen cities form the American Middleweights. Metropolitan areas in this group are almost evenly divided between mid-sized production cen- ters in America’s North and East (Cincinnati, Cleveland, Pittsburgh, Indianapolis, Detroit) and Southern cities that have experienced significant population growth (Miami, Phoenix, Orlando, St. Louis, Tampa, Sacramento). The average metropolitan area has 3 million inhabitants, generates $149 billion in nominal
  • 93. output, and has a nominal GDP per capita of $52,000. Growth in overall output (1.6 percent), GDP per capita (0.4 percent), and employment (0.7 percent) has lagged most other metro groupings between 2000 and 2015, perhaps due partly to the high concen- tration of non-traded clusters in their economies. American Middleweights have the highest concen- tration of local services (health care, real estate, education, and public services), accounting for 28 percent of output and 42 percent of employment. Moreover, their tradable industries tend to be less productive than national averages. While many of the cities in this group are still finding their global niche, they all maintain at least one globally relevant Map 7. American Middleweights, 2015 Figure 14. American Middleweights indicators, 2015 or most recent year available Download speed
  • 94. Aviation passengers Population with tertiary education Venture capital investment Patents per capita Scientific research impact FDI per capita FDI stockTraded sector productivity differential GDP per worker GDP per capita GDPGDP per worker
  • 95. GDP per capita GDP Economic characteristics Economic growth Traded clusters Innovation Talent Infrastructure connectivity (+) (-) Metro Average (n=123)(-) Metro Average (n=123)(-) Metro Average (n=123) Source: Oxford Economics, U.S. Census Bureau, Moody’s Analytics, fDi Intelligence data, Centre for Science and Technology Studies (CWTS) and Leiden University data, REGPAT, Pitchbook, and SABRE. REDEFINING GLOBAL CITIES THE SEVEN TYPES OF GLOBAL METRO ECONOMIES 3 3 export sector. For instance, Charlotte, Detroit, and
  • 96. Phoenix are among the leading metro exporters of engine and power equipment, motor vehicles, and semiconductors, respectively. As a group, American Middleweights increased their exports by 1.9 percent per year between 2008 and 2014, slightly below the national average of 2.4 percent in the same period.68 The prevalence of local services accentuated the impact of the 2008 economic and financial crisis, particularly in Sunbelt cities that relied heavily on construction and real estate development to power economic growth.69 Between 2008 and 2010 the construction sector shrank 11 percent per year, the highest drop among all the groups, while the average home lost 29 percent of its value between 2008 and 2012.70 Cities like Detroit, Miami, Orlando, and Phoenix saw home price declines of more than 30 percent. Table 8. American Middleweights economic indicators, 2015 Cities
  • 97. Population 2015 (thousands) Nominal GDP 2015 ($ millions) Nominal GDP per capita 2015 ($) Miami 6,012 282,514 46,989 Detroit 4,302 218,080 50,692 Phoenix 4,575 214,809 46,958 Riverside 4,489 167,864 37,393 St. Louis 2,812 146,024 51,937 Pittsburgh 2,353 141,339 60,066 Tampa 2,975 140,263 47,144 Charlotte 2,426 131,636 54,253 Sacramento 2,274 126,103 55,449 Orlando 2,387 125,898 52,740 Cleveland 2,061 117,493 57,013 Cincinnati 2,158 115,552 53,553
  • 98. Indianapolis 1,989 114,936 57,791 San Antonio 2,384 113,910 47,779 Columbus 2,022 113,875 56,328 Kansas City 2,087 110,456 52,914 American Middleweights 2,957 148,797 51,812 Source: U.S. Census Bureau and Moody’s Analytics. “American Middleweights have a base of educated workers, research universities and hospitals, and trad able clusters. Aligning these assets to improve export competitiveness through coordinated economic strat egies will be critical if these metros are to compete in global markets.” B R O O K I N G S
  • 99. M E T R O P O L I TA N P O L I CY P R O G RA M 3 4 Figure 15a. Share of output in traded sectors in metropolitan groups, 2015 American Middleweights International Middleweights Knowledge Capitals Global Giants Asian Anchors Emerging Gateways Factory China 51% 54% 57% 57% 60%
  • 100. 61% 69% Figure 15b. Share of output in local services in metropolitan groups, 2015 Factory China Asian Anchors Emerging Gateways Global Giants Knowledge Capitals International Middleweights American Middleweights 10% 13% 17% 22% 24% 25% 28% Source: Oxford Economics, U.S. Census Bureau, Moody’s
  • 101. Analytics, fDi Intelligence data, Centre for Science and Technology Studies (CWTS) and Leiden University data, REGPAT, Pitchbook, and SABRE. At the same time, the manufacturing sector—once the engine of export-led growth in places like Cleveland, Detroit and St. Louis—has seen its share of output and employment decline relative to other sectors of the economy.71 Due to automation and strong competition from abroad, manufacturing employment declined 2.1 percent annually since 2000. Today, manufacturing accounts only for 7 percent of total employment in this group. American Middleweights have assets, however. They house well-regarded research universities. Cities in this group ranked third among all other groups in the share of scientific publications in the top 10 percent of most-cited academic journals. Additionally, one-third of the working-age population in these markets boasts a
  • 102. tertiary degree, ranking it fourth among all groups. The combination of a highly skilled labor force and world- class research universities is also strengthened by ven- ture capital per capita, an indicator on which American Middleweights ranked third among all their peers. REDEFINING GLOBAL CITIES THE SEVEN TYPES OF GLOBAL METRO ECONOMIES 3 5 I N T E R N AT I O N A L M I D D L E W E I G H T S I nternational Middleweights include a diverse group of wealthy cities in Canada (Toronto, Vancouver), Europe (Brussels, Berlin, Munich, Rome, Milan, Munich), Asia (Kitakyushu-Fukuoka, Nagoya, Tel
  • 103. Aviv), and Australia (Sydney, Melbourne). These 26 metros have an average population of 4.8 million, output of $234 billion, and nominal GDP per capita of $49,000, fifth among our groups. International Middleweights are the most varied group of metro economies. Cities like Toronto, Sydney, Frankfurt, Madrid, and Copenhagen play a fundamental role in the provision of business and financial services in their national and regional economies. In parallel, industrial centers such as Kitakyushu-Fukuoka, Nagoya, Stuttgart, Karlsruhe, Milan, and Barcelona gener- ate significant levels of manufacturing value added in Japan, Germany, and Southern Europe, respec- tively. Most have diversified tradable sectors that tend to specialize in knowledge services, advanced manufacturing, or some combination of both. Map 8. International Middleweights, 2015 Figure 16. International Middleweights indicators, 2015 or most recent year available
  • 105. GDPGDP per worker GDP per capita GDP Economic characteristics Economic growth Traded clusters Innovation Talent Infrastructure connectivity (+) (-) Metro Average (n=123)(-) Metro Average (n=123)(-) Metro Average (n=123) Source: Oxford Economics, U.S. Census Bureau, Moody’s Analytics, fDi Intelligence data, Centre for Science and Technology Studies (CWTS) and Leiden University data, REGPAT, Pitchbook, and SABRE. B R O O K I N G S M E T R O P O L I TA N P O L I CY P R O G RA M 3 6
  • 106. Several shared characteristics bind International Middleweights. First, they are globally connected by migration and capital flows. About 22 percent of the population in these cities is foreign born, the high- est share among any cluster. Similarly, these met- ros boast the second highest level of foreign direct investment per capita, with almost $2,000 dollars of FDI stock per inhabitant. These metros are well- educated (33 percent of the working-age population has tertiary education), house elite universities (the highest number of research universities of any group on both an absolute and per capita basis), and gener- ate new knowledge (third highest rate of patenting intensity). Table 9. International Middleweights economic indicators, 2015 Cities Population 2015 (thousands)
  • 107. Nominal GDP 2015 ($ millions) Nominal GDP per capita 2015 ($) Köln- Düsseldorf 11,488 548,379 47,735 Rotterdam-Amsterdam 7,146 397,399 55,610 Milan 7,722 380,609 49,286 Nagoya 9,049 377,075 41,672 Madrid 6,586 315,507 47,905 Toronto 6,124 292,432 47,750 Brussels 5,540 290,522 52,445 Frankfurt 4,483 270,396 60,321 Munich 3,981 265,693 66,739 Sydney 4,916 251,254 51,115 Rome 4,468 207,502 46,444 Vienna-Bratislava 3,822 200,062 52,341 Barcelona 4,711 197,889 42,010 Melbourne 4,527 197,774 43,690
  • 108. Kitakyushu-Fukuoka 5,563 194,550 34,970 Stuttgart 3,166 193,143 61,013 Hamburg 3,188 186,506 58,499 Berlin 4,314 185,910 43,100 Karlsruhe 3,056 159,066 52,050 Montreal 4,058 157,734 38,872 Copenhagen-Malmö 3,045 151,041 49,610 Tel Aviv 3,699 144,875 39,162 Perth 2,080 139,282 66,959 Athens 3,844 138,715 36,082 Birmingham (UK) 3,869 132,439 34,233 Vancouver 2,502 114,447 45,738 International Middleweights Average 4,883 234,238 48,667 Source: Oxford Economics. REDEFINING GLOBAL CITIES THE SEVEN TYPES
  • 109. OF GLOBAL METRO ECONOMIES 3 7 For International Middleweights, unfortunately, another characterization they share is sluggish economic growth. Between 2000 and 2015, output, GDP per capita, and employment grew 1.6, 0.7, and 1.0 percent annually, each the slowest of any group. The solid economic growth of metropolitan areas in Australia (Perth, Sidney, and Melbourne), Canada (Toronto and Vancouver), and Israel (Tel Aviv), whose metro economies posted real output growth rates of 3 percent on average, contrasts starkly with the 1.1 percent experienced by their metropolitan peers in Europe. Further, the international financial crisis of 2008-2009 divides the economic trajectory of this group of cities. Output, GDP per capita, and employ- ment all grew faster in the 2000-2007 period than in
  • 110. the following years. As a result, 12 cities in this group have yet to return to their pre-crisis GDP per capita levels and five cities have yet to regain their pre-crisis employment base. Further, in half of these markets, employment was lower in 2015 than in 2005, reflect- ing both a demographic transition as well as lower participation in the labor market. Figure 17: Total number of world ranked research universities in metropolitan groups, 2010-2013 American Middleweights Factory China Global Giants Asian Anchors Knowledge Capitals Emerging Gateways International Middleweights 20 21 42
  • 111. 46 51 63 85 Source: Centre for Science and Technology Studies (CWTS) and Leiden University. “International Middleweights are the most varied group of metro economies. Cities like Toronto, Sydney, Frankfurt, Madrid, and Copenhagen play a funda mental role in the provision of business and financial services in their national and regional economies.” ePortfolio Quality World Assignment (50 points) This assignment introduces your Quality World to your audience. According to William Glasser, American Psychiatrist, the Quality World is the visualization of what we want for our lives, the foundation that drives our dreams, goals, and actions. For this assignment, you will display the three major elements of your own Quality World as described in Chapter 1. · The people you most want to be with · The things you most want to own or experience · The ideas or systems of belief that govern much of your behavior Also, include ideas you have about service to your community. (i.e. What role does service play in your quality world? How does service give meaning and purpose to your life?) Remember, the elements you include in your Quality World should be personally meaningful, but also healthy, balanced,
  • 112. and ethical. Don’t just describe your Quality World, but SHOW who you are, too. Include photos, images, audio or video, and/or links to your (appropriate) social networking site or blog. Be sure to cite the source of any images you borrow from the Internet. To prepare your assignment for submission to eCampus & Portfolium (free eportfolio platform): 1. Create a new Microsoft Word document. Complete the Quality World assignment and use the “Save As” function to save the MS Word document as a .docx file on your computer’s desktop. 2. Using the free Portfolium software, create an eportfolio and upload this assignment to your eportfolio and name it (Ex. Quality World Assignment). For additional resources, visit the ePortfolio folder in eCampus. Once you publish your eportfolio assignment (project) through Portfolium, you will be assigned a unique URL (link) so anyone who has it can access your eportfolio. Take note of your URL because you will need it when you upload this assignment to eCampus. Follow the steps (below) to upload this assignment to eCampus. Manage Your ePortfolio Privacy Settings: Make your eportfolio “public” so that your instructor can view your eportfolio. Be aware of the content you choose to post since your portfolio will be viewable on the World Wide Web. Manage Your Assignment (Project) Privacy Settings: You must make each assignment “public” when you are ready to publish. This allows your instructor to view your eportfolio via the unique URL assigned to your eportfolio. There is also an option to use a private link. Now, it’s time to upload your assignment to eCampus: 3. In eCampus, find the assignment link for this assignment, click on it, and scroll to the Assignment Submission box. Click Browse My Computer to find your saved document. 4. Select the document you want to submit to eCampus with your mouse and click OPEN. You should now see the attached
  • 113. file in eCampus. Go back to Portfolium to retrieve your public eportfolio URL. Copy/paste your URL (link) from Portfolium to eCampus so that your instructor can view your eportfolio using your URL. 5. Lastly, find the SUBMIT button and click it. Now, your instructor can see that you have turned in the assignment as an attachment AND as a URL link. Do not copy/paste your full draft into the Comments Box – use Browse My Computer to attach the assignment file. If you need additional help understanding how to attach a file, view this video. You will repeat these instructions to submit your remaining eportfolio assignments. At the end of the course, you will showcase your final, completed eportfolio, which will include all four assignments. For help with creating your ePortfolio, visit the ePortfolio folder in eCampus.Quality World Assignment Grading Criteria Immigration and the American Industrial Revolution From 1880 to 1920 Charles Hirschman and Department of Sociology and Center for Studies in Demography and Ecology, University of Washington, Seattle, WA 98195-3340 Elizabeth Mogford Department of Sociology, Western Washington University, Bellingham, WA 98225-9081 Abstract In this study, we measure the contribution of immigrants and
  • 114. their descendents to the growth and industrial transformation of the American workforce in the age of mass immigration from 1880 to 1920. The size and selectivity of the immigrant community, as well as their disproportionate residence in large cities, meant they were the mainstay of the American industrial workforce. Immigrants and their children comprised over half of manufacturing workers in 1920, and if the third generation (the grandchildren of immigrants) are included, then more than two- thirds of workers in the manufacturing sector were of recent immigrant stock. Although higher wages and better working conditions might have encouraged more long-resident native- born workers to the industrial economy, the scale and pace of the American industrial revolution might well have slowed. The closing of the door to mass immigration in the 1920s did lead to increased recruitment of native born workers, particularly from the South, to northern industrial cities in the middle decades of the 20th century. 1. Introduction Within the span of a few decades from the late 19th to the early 20th century, the United States was transformed from a predominately rural agrarian society to an industrial economy centered in large metropolitan cities. Prior to the American industrial revolution, most Americans were reared in largely isolated agricultural households and small towns that were linked to the external world by horse drawn wagons (Olmstead and Rhode 2000: 711). Except for towns that were connected to railroads or water borne shipping, isolation and the costs of overland transportation meant that many rural communities were largely
  • 115. self sufficient in food, clothing, and many other essentials of everyday life. This changed dramatically in the early decades of the 20th century, as the supply and lowered costs of manufactured goods created a consumer revolution for both urban and rural households. Many of these goods, which did not even exist a few decades earlier, were manufactured, marketed, and transported through a rapidly expanding national network of rail lines and highways. By 1920, one half of northern farms had automobiles and telephones (Olmstead and Rhode 2000: 712–713). Contact Charles Hirschman at [email protected] and Elizabeth Mogford at [email protected] Earlier versions of this paper were presented at the 2006 annual meetings of the Population Association of America and at colloquia at the Department of Sociology, University of British Columbia, the Center for Studies in Demography and Ecology, University of Washington, and the Minnesota Population Center at the University of Minnesota. Publisher's Disclaimer: This is a PDF file of an unedited manuscript that has been accepted for publication. As a service to our customers we are providing this early version of the manuscript. The manuscript will undergo copyediting, typesetting, and review of the resulting proof before it is published in its final citable form. Please note that during the production process errors may be discovered which could affect the content, and all legal disclaimers that apply to the journal pertain.
  • 116. NIH Public Access Author Manuscript Soc Sci Res. Author manuscript; available in PMC 2010 December 1. Published in final edited form as: Soc Sci Res. 2009 December 1; 38(4): 897–920. doi:10.1016/j.ssresearch.2009.04.001. N IH -P A A uthor M anuscript N IH -P A A uthor M anuscript N IH -P A
  • 117. A uthor M anuscript Theses changes were the direct result of the American industrial revolution that was founded on rising investment, employment, and productivity in the manufacturing sector. In 1880, when the agricultural frontier had largely disappeared, almost one- half of the American workers were still farmers and only one in seven workers (less than 15%) worked in manufacturing of any sort. The industrial sector, as late as 1870, consisted primarily of small firms and workshops that relied on artisan technology to produce tools, furniture, building materials, and other goods for local markets (Abramovitz and David 2000: 45). Many small industries, such as grain mills and sawmills, were often located in rural areas close to flowing rivers in order to power machinery. Following the technological revolutions of the early industrial age, workshops and small foundries were supplemented by large factories engaged in mass production. The development of commercial electricity at the end of the 19th century allowed industries to take advantage of the labor supply in large cities. The scale of change is illustrated by the rise in the share of manufacturing horsepower generated by electrical motors from 23% in 1909 to 77% in 1929 (Goldin and Katz 1998: 712). Enormous gains in industrial productivity, accompanied by
  • 118. institutional change and much lower transportation costs, created national markets with goods and people moving in every direction. Perhaps the most consequential change of the American industrial revolution was the increasing urbanization of society and the shift of labor from farms to factories and offices (Guest 2005). In 1880, workers in agriculture outnumbered industrial workers three to one, but by 1920, the numbers were approximately equal. Employment in the manufacturing sector expanded four-fold from 2.5 to 10 million workers from 1880 to 1920.1 The decades surrounding 1900 were not only the age of industrialization in the United States, but were also the age of urbanization and immigration. The 1880s were the first decade in American history, with the exception of the Civil War decade, when the urban population increased more than the rural population (in absolute numbers). From 1880 to 1920, population growth was concentrated in cities—the urban fraction expanded from a little more than one quarter of the national population to more than one half (Carter et al. 2006: 1–105). The pace of rural to urban migration of the native born picked up during this era, but domestic urbanward migrants were dwarfed by the flood of immigrants coming to cities. From 1880 to 1920, the number of foreign born increased from almost 7 million to a little under 14 million (Gibson and Jung 2006: 26). These figures, however, underestimate the economic and demographic contribution of immigration (Kuznets 1971b).
  • 119. Immigrants inevitably lead to a second generation—the children of immigrants—whose social, cultural, and economic characteristics are heavily influenced by their origins. Counting the 23 million children of immigrants2, in addition to the 14 million immigrants, means that over one-third of the 105 million Americans in the 1920 population belonged to the “immigrant community,” defined as inclusive of the first and second generations. 1.1 Immigration, Urbanization, and Industrialization Immigrants, as well as manufacturing enterprises, were concentrated in the rapidly growing cities of the Northeast and Midwest during the age of industrialization (Gibson and Jung 2006: 72). In 1900, about three-quarters of the populations of many large cities were composed of immigrants and their children, including New York, Chicago, Boston, Cleveland, San Francisco, Buffalo, Milwaukee, and Detroit (Carpenter 1927: 27). Immigration and industrialization were correlated, both spatially and temporally in American history (Taeuber 1Industrial production experienced an almost five-fold expansion of value added in manufacturing and mining from 1880 to 1915 (Davis 2006: 3-23-24 and 3-25). Manufacturing’s share of value added in commodity production rose more rapidly from 1879 to 1894 than in any other period of the 19th century (Fogel 1964: 121). 2The children of immigrants includes native born persons who have at least one foreign born parent. Hirschman and Mogford Page 2
  • 120. Soc Sci Res. Author manuscript; available in PMC 2010 December 1. N IH -P A A uthor M anuscript N IH -P A A uthor M anuscript N IH -P A A uthor M anuscript
  • 121. and Taeuber 1971: 117), but is there a causal impact? Addressing this question, the objective of this analysis, requires consideration of the counterfactual of what would have been the course of the industrialization process in the United States if there had not been an immigrant workforce. The most commonly cited reasons for the rapid American industrial revolution are the abundance of mineral resources, technological innovation, the evolution of the American system of manufacturing, railroads and lowered costs of transportation, education and human resources, and the rise of the managerial firm (Abramovitz and David 2000; Chandler 1977; Denison 1974; Hounshell 1984; Wright 1990). Among the studies that address the relationship between immigration and industrialization, few go beyond a general or abstract discussion. In a classic survey of the literature on the American industrial revolution in the Cambridge Economic History of the United States, the role of immigration is summarized in a single paragraph, which simply notes the overrepresentation of immigrants in the manufacturing labor force (Engerman and Sokoloff 2000: 387). There are some studies that conclude that the flood of immigration in the late 19th and early 20th centuries had an adverse impact on the per-capita economic growth, the wages of native workers, and diverted domestic migration away from industrializing cities (Hatton and Williamson 1998: Chapter 8; Goldin 1994). However, other
  • 122. researchers have questioned these conclusions and suggested that immigrants had a generally positive impact on the American economy and facilitated the economic mobility of native born workers during the age of industrialization (Carter and Sutch 1999; Haines 2000: 202; Muller 1993: 83–85; Thomas 1973: 174). 1.2 Research Objectives In this study, we address two specific empirical questions, namely: “What was the role of immigration on changes in the industrial structure of the American economy from 1880 to 1920?”, and “How much did immigrants and their descendents (children and grandchildren) contribute to the manufacturing sector in 1920?” The findings reported here show that recent immigrants and their descendents were the primary workforce in the rapidly expanding manufacturing economy of the early 20th century. Demographic and economic pressures on agricultural households in the late 19th and early 20th century pushed an increasing share of the children of farmers off the land, but only a minority were willing to join “the pool of eastern industrial and commercial labor” (Atack, Bateman, and Parker 2000: 322). When immigrant labor was cutoff in the 1920s, the native poor population, especially poor whites and blacks from the South, began migrating to northern industrial cities in much larger numbers. But in the early 20th century, when manufacturing jobs were dirty, dangerous, and heavily regimented, immigrant workers were the mainstay of industrial employment. Native born of native parentage (NBNP) Americans continued
  • 123. to be over-represented in the agricultural sector in the early 20th century, but they were also well represented in many of the better jobs in the public and business sectors that were also expanding rapidly with the industrial economy. The managerial elite during the age of industrialization were almost exclusively native born whites (Zunz 1982: 2). 2. How Might Immigration Affect Industrialization There is a long list of potential factors—variables or conditions—that might have caused the American industrial revolution, including the discovery or adoption of new technologies, the availability and mobility of capital, the expansion of markets as a result of new transportation systems, added demand from a growing population and the expansion of trade, increasing entrepreneurship, stable political and institutional systems that foster cheaper credit and the enforcement of contracts, improvements in human capital and meritocratic social mobility of talent, the increasing division of labor in production, and the specialization of enterprises (see Hirschman and Mogford Page 3 Soc Sci Res. Author manuscript; available in PMC 2010 December 1. N IH -P A
  • 124. A uthor M anuscript N IH -P A A uthor M anuscript N IH -P A A uthor M anuscript Engerman and Gallman 2000, especially volume 2). This list, which is neither exhaustive nor mutually exclusive, does not specify which factors are exogenous nor does it address the question of which factors are absolutely necessary and which may simply facilitate economic growth and industrialization.
  • 125. Without a comparative analysis across countries or regions, it is impossible to test which factors were necessary or sufficient conditions to cause industrialization. Such studies are not always definitive, however, because labor, capital, and other resources can flow across regions and countries. The analytical strategy adopted here is of a detailed case study of one country, the United States, with a primary focus on measuring the increasing share of immigrants and their descendents in the mobilization of labor during the American industrial revolution from 1880 to 1920. The counterfactual, namely whether the domestic labor supply would have been sufficient for rapid industrial development in the absence of immigration, cannot be directly observed. Our strategy, which draws on theory and prior research in addition to empirical analysis, cannot fully adjudicate between competing explanations. Our conclusion about the centrality of immigrant labor is based on the fact that recent immigrants and their descendents were not just the majority of industrial workers, but the overwhelming majority of workers in the emerging manufacturing sector in early 20th century America. 2.1 Economic Theory Labor is an indispensable source of economic production, and all other things being equal, more labor contributes to more economic production. The magnitude of the impact of immigration on economic growth and welfare depends on the availability of physical capital, the human capital of immigrants and natives, and assumptions about economies of scale
  • 126. (Frieberg and Hunt 1995: 39–42; Smith and Edmonston 1997: chapter 4). Although there was neither a slackening of economic growth nor a slowdown in the trend of rising wages of native born workers during the age of mass immigration in the late 19th and early 20th century (Carter and Sutch 1999: 314–344; Rees 1961), Hatton and Williamson (1998: chapter 8) argued that wages would have grown even faster in the absence of immigration. Differences in the interpretation (or speculation) of the economic impact of immigration are typically based on assumptions of possible effects rather than on measured differences. There is a wide range of mechanisms through which immigrants may affect labor markets and the economy, more generally. One of the most fundamental effects of immigration is an increase in the number of workers relative to dependents in the population. Immigrants are generally concentrated in the younger working ages. Carter and Sutch (1999: 326) observe that well over 70% of immigrants to the United States during the peak years of the age of mass immigration (1907 to 1910) were between age 18 and 40. Even within the working-age population, immigrants are more likely to participate in the labor force than the native born population. The age selectivity of immigrants reduces the costs of social reproduction for a given population size in the receiving society. Although the costs of support for the dependent population of children and the elderly are generally borne privately by families, there are also public subsidies for education and
  • 127. health care. The costs of rearing and educating persons who immigrate as young adults have been borne by their foreign-resident families and their countries of origin, and might be considered a transfer payment to the taxpayers of the receiving society.3 3“Considering the magnitude and duration of this movement, it is difficult to exaggerate its importance as a factor in the economic growth of the United States. Since immigration brought in a large labor force, the cost of whose rearing and training was borne elsewhere, it clearly represented an enormous capital investment that dwarfed any capital inflows of the more orthodox type—a conclusion that stands with any reasonable estimate we can make of the money value of labor.” (Kuznets 1971a: 357). Hirschman and Mogford Page 4 Soc Sci Res. Author manuscript; available in PMC 2010 December 1. N IH -P A A uthor M anuscript N
  • 128. IH -P A A uthor M anuscript N IH -P A A uthor M anuscript In an ingenious analysis of the potential impact of the differing age composition of immigrants and the native born populations, Neal and Uselding (1972) estimate the savings received by the United States through immigration from 1790 to 1913 relative to the costs that would have been incurred if all immigrants were replaced by children of the native born population (this counterfactual is posed by the “Walker hypothesis” that posits that native born fertility was depressed by the arrival of immigrants). Assuming these savings had been invested (not consumed by social reproduction), Neal and Uselding (1972: 87) conclude that immigration
  • 129. had contributed from 13 to 42 percent of the capital stock of the United States by 1912. Several analysts have noted that the large number of immigrants in the North in the 1860s provided the manpower surplus that allowed the Union to triumph in the Civil War (Gallman 1977: 31, Muller 1993: 78–79). 2.2 Empirical Studies In their study of the impact of immigration on American industrialization and native born workers, Hatton and Williamson (1998: chapter 8) asked whether immigrants accelerated industrialization by solving labor bottlenecks by entering high- wage high-growth occupations faster than native born workers (Hatton and Williamson 1998: 161–164). Based on their findings that immigrants were more likely to be found in less skilled occupations and in slower growth occupations from 1890 to 1900, Hatton and Williamson conclude that immigration did not contribute to economic development and rapid industrialization. However, other analysts report that immigrants were no less skilled than native born workers (Schachter 1972). The real question, in our judgment, is not the skill level of immigrants, but their role in filling the demand for labor in manufacturing and other key sectors of emerging industrial economy. The central element of the industrial revolution is most appropriately measured by shifts across industrial sectors – the rise of manufacturing, in particular. The other problem with Hatton and Williamson’s account is their focus on relative growth as the index of labor demand. Starting from a small base (or zero),
  • 130. new industries may experience extraordinarily rapid relative growth, but the absolute number of added workers may be relatively small. For example, the telephone industry grew over 80 times faster than the workforce as a whole from 1880 to 1920, but the total growth was only a quarter of a million workers. On the other hand, the manufacturing sector grew much less rapidly—only about 2.4 times as fast as the work force as a whole, but added about 7.5 million workers. Are immigrant workers in manufacturing not to be considered part of the “shock troops of structural change” (Hatton and Williamson 1998: 161) simply because of their relative share in the growth in selected high demand occupations? The contribution of immigrants might be evaluated differently if the absolute numbers of workers in expanding industries were counted. In this analysis, we consider the contribution of immigrants to absolute and relative changes in the industrial structure. One of the most important theoretical claims about the positive impact of immigration on industrialization centers on the creation of economies of scales—both in the production of and the demand for industrial goods (Abramovitz and David. 2000: 12; Carter and Sutch 1999: 331–332; Romer 1996). The creation of economies of scale was possible only with the growth of cities and urban industries. Before the age of industrialization, per-capita productivity was rarely increased by having large numbers of workers concentrated in one location (Ward 1971: 90). Artisan labor in most industries, such as grain