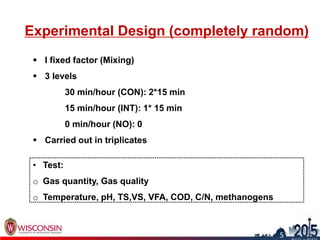
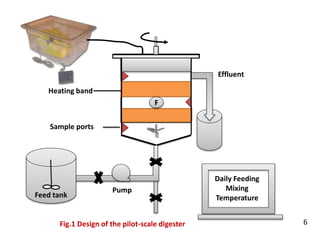
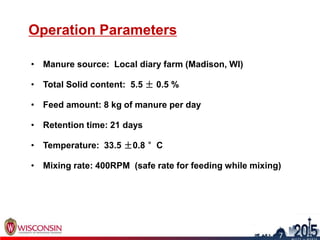
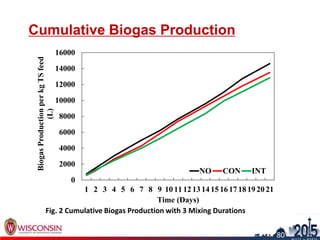
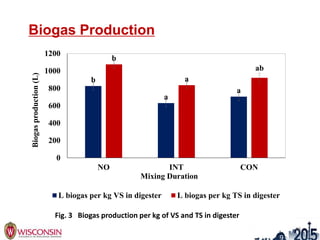
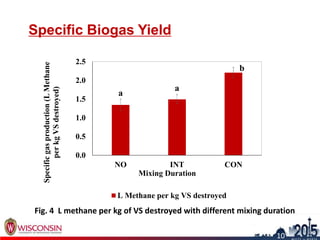
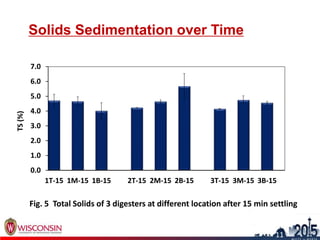
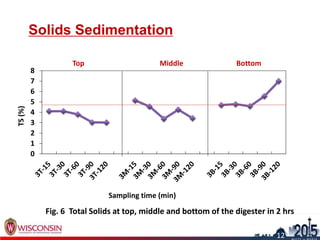
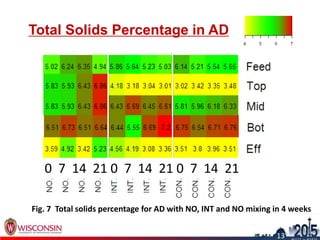
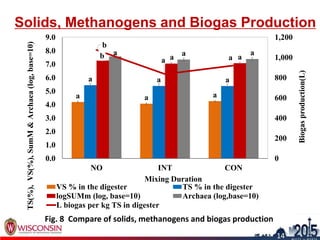
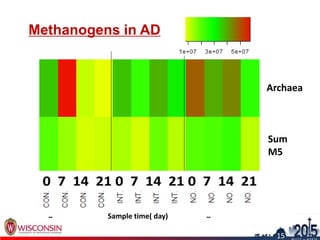
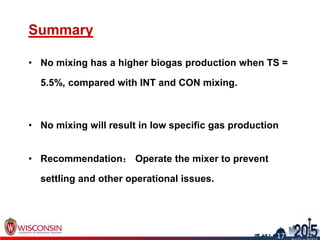
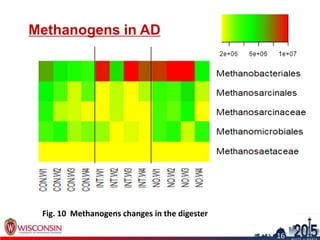
Effects of Mixing Duration on Biogas
Production and Methanogen Distribution
in Dairy Manure Anaerobic Digesters
Prepared by: Hui Wang, Rebecca A. Larson
March 31, 2015 1
Mixing and its Role in AD
Mechanical Mixer
Gas Recirculation
 Start: Heukelekian, 1931, Shaking
 Contact: Biomass and substrate
 Particle size
 Diffusion limitation
 Stratification
 Temperature
 Sedimentation
 Scum
 Inhibitory substance
Source: Chapman, 1989; Parkin and Owen, 1986; Lema et al., 1991, Stenstrom et al., 1983 2
1
Why Study Mixing Duration?
 Intensity
 Duration
 Location
 Diameter
Energy consumption =
~ 54% to run the biogas plants
5-10% of the energy produced from biogas
Source: Dachs Rehm 2006, FAL 2005
Less energy consumption
More biogas production
3
2
Previous Studies on Mixing Duration
 No decrease in gas production with discontinued mixing,
1979
 Continuously mixing produced 8-10% higher CH4 than
2h/d mixing,1982
 2h/3h and 1h/28h mixing produced ~20% more biogas
than continuously mixing, 2013
Coppinger, 1979, Hruska, 1982, Kowalczyk 2013 4
3
Hypothesis and Objective
 Loading rate: Mixing duration is not critical at low TS
< 10%, Karim 2005
 Retention time (RT): Discontinued mixing causes solids
accumulation which impacts RT
 Microbial community structure
How does mixing duration impact biogas production,
solids and methanogens distribution?
5
4
Experimental Design (completely random)
 I fixed factor (Mixing)
 3 levels
30 min/hour (CON): 2*15 min
15 min/hour (INT): 1* 15 min
0 min/hour (NO): 0
 Carried out in triplicates
• Test:
o Gas quantity, Gas quality
o Temperature, pH, TS,VS, VFA, COD, C/N, methanogens
6
5
Fig.1 Design of the pilot-scale digester
Feed tank
Effluent
Pump
F
Sample ports
Heating band
Daily Feeding
Mixing
Temperature
6
Operation Parameters
• Manure source: Local diary farm (Madison, WI)
• Total Solid content: 5.5 ± 0.5 %
• Feed amount: 8 kg of manure per day
• Retention time: 21 days
• Temperature: 33.5 ±0.8 °C
• Mixing rate: 400RPM (safe rate for feeding while mixing)
8
7
Cumulative Biogas Production
0
2000
4000
6000
8000
10000
12000
14000
16000
1 2 3 4 5 6 7 8 9 101112131415161718192021
BiogasProductionperkgTSfeed
(L)
Time (Days)
NO CON INT
9
80
Fig. 2 Cumulative Biogas Production with 3 Mixing Durations
Biogas Production
b
a
a
b
a
ab
0
200
400
600
800
1000
1200
NO INT CON
Biogasproduction(L)
Mixing Duration
L biogas per kg VS in digester L biogas per kg TS in digester
10
Fig. 3 Biogas production per kg of VS and TS in digester
Specific Biogas Yield
a
a
b
0.0
0.5
1.0
1.5
2.0
2.5
NO INT CON
Specificgasproduction(LMethane
perkgVSdestroyed)
Mixing Duration
L Methane per kg VS destroyed
11
10
Fig. 4 L methane per kg of VS destroyed with different mixing duration
Solids Sedimentation over Time
0.0
1.0
2.0
3.0
4.0
5.0
6.0
7.0
1T-15 1M-15 1B-15 2T-15 2M-15 2B-15 3T-15 3M-15 3B-15
TS(%)
Fig. 5 Total Solids of 3 digesters at different location after 15 min settling
12
11
Solids Sedimentation
0
1
2
3
4
5
6
7
8
TS(%)
Sampling time (min)
Top Middle Bottom
Fig. 6 Total Solids at top, middle and bottom of the digester in 2 hrs
13
12
Total Solids Percentage in AD
14
13
Fig. 7 Total solids percentage for AD with NO, INT and NO mixing in 4 weeks
0 7 14 21 0 7 14 21 0 7 14 21
Solids, Methanogens and Biogas Production
a a a
a a a
b a a
a a a
b
a a
0
200
400
600
800
1,000
1,200
0.0
1.0
2.0
3.0
4.0
5.0
6.0
7.0
8.0
9.0
NO INT CON
Biogasproduction(L)
Mixing Duration
VS % in the digester TS % in the digester
logSUMm (log, base=10) Archaea (log,base=10)
L biogas per kg TS in digester
TS(%),VS(%),SumM&Archaea(log,base=10)
15
14
Fig. 8 Compare of solids, methanogens and biogas production
Methanogens in AD
16
15
Fig. 9 Archaea and sum of 5 tested Methanogens
Archaea
Sum
M5
Sample time( day)
Summary
• No mixing has a higher biogas production when TS =
5.5%, compared with INT and CON mixing.
• No mixing will result in low specific gas production
• Recommendation: Operate the mixer to prevent
settling and other operational issues.
17
17
18
Methanogens in AD
19
16
Fig. 10 Methanogens changes in the digester
Limitations
• This study does not take the whole range of mixing
duration: 0,1/4,2/4 . might also need ¾ and 4/4
20
17

Effects of Mixing Duration on Biogas Production and Methanogen Distribution in Dairy Manure Anaerobic Digesters

  • 1.
    Effects of MixingDuration on Biogas Production and Methanogen Distribution in Dairy Manure Anaerobic Digesters Prepared by: Hui Wang, Rebecca A. Larson March 31, 2015 1
  • 2.
    Mixing and itsRole in AD Mechanical Mixer Gas Recirculation  Start: Heukelekian, 1931, Shaking  Contact: Biomass and substrate  Particle size  Diffusion limitation  Stratification  Temperature  Sedimentation  Scum  Inhibitory substance Source: Chapman, 1989; Parkin and Owen, 1986; Lema et al., 1991, Stenstrom et al., 1983 2 1
  • 3.
    Why Study MixingDuration?  Intensity  Duration  Location  Diameter Energy consumption = ~ 54% to run the biogas plants 5-10% of the energy produced from biogas Source: Dachs Rehm 2006, FAL 2005 Less energy consumption More biogas production 3 2
  • 4.
    Previous Studies onMixing Duration  No decrease in gas production with discontinued mixing, 1979  Continuously mixing produced 8-10% higher CH4 than 2h/d mixing,1982  2h/3h and 1h/28h mixing produced ~20% more biogas than continuously mixing, 2013 Coppinger, 1979, Hruska, 1982, Kowalczyk 2013 4 3
  • 5.
    Hypothesis and Objective Loading rate: Mixing duration is not critical at low TS < 10%, Karim 2005  Retention time (RT): Discontinued mixing causes solids accumulation which impacts RT  Microbial community structure How does mixing duration impact biogas production, solids and methanogens distribution? 5 4
  • 6.
    Experimental Design (completelyrandom)  I fixed factor (Mixing)  3 levels 30 min/hour (CON): 2*15 min 15 min/hour (INT): 1* 15 min 0 min/hour (NO): 0  Carried out in triplicates • Test: o Gas quantity, Gas quality o Temperature, pH, TS,VS, VFA, COD, C/N, methanogens 6 5
  • 7.
    Fig.1 Design ofthe pilot-scale digester Feed tank Effluent Pump F Sample ports Heating band Daily Feeding Mixing Temperature 6
  • 8.
    Operation Parameters • Manuresource: Local diary farm (Madison, WI) • Total Solid content: 5.5 ± 0.5 % • Feed amount: 8 kg of manure per day • Retention time: 21 days • Temperature: 33.5 ±0.8 °C • Mixing rate: 400RPM (safe rate for feeding while mixing) 8 7
  • 9.
    Cumulative Biogas Production 0 2000 4000 6000 8000 10000 12000 14000 16000 12 3 4 5 6 7 8 9 101112131415161718192021 BiogasProductionperkgTSfeed (L) Time (Days) NO CON INT 9 80 Fig. 2 Cumulative Biogas Production with 3 Mixing Durations
  • 10.
    Biogas Production b a a b a ab 0 200 400 600 800 1000 1200 NO INTCON Biogasproduction(L) Mixing Duration L biogas per kg VS in digester L biogas per kg TS in digester 10 Fig. 3 Biogas production per kg of VS and TS in digester
  • 11.
    Specific Biogas Yield a a b 0.0 0.5 1.0 1.5 2.0 2.5 NOINT CON Specificgasproduction(LMethane perkgVSdestroyed) Mixing Duration L Methane per kg VS destroyed 11 10 Fig. 4 L methane per kg of VS destroyed with different mixing duration
  • 12.
    Solids Sedimentation overTime 0.0 1.0 2.0 3.0 4.0 5.0 6.0 7.0 1T-15 1M-15 1B-15 2T-15 2M-15 2B-15 3T-15 3M-15 3B-15 TS(%) Fig. 5 Total Solids of 3 digesters at different location after 15 min settling 12 11
  • 13.
    Solids Sedimentation 0 1 2 3 4 5 6 7 8 TS(%) Sampling time(min) Top Middle Bottom Fig. 6 Total Solids at top, middle and bottom of the digester in 2 hrs 13 12
  • 14.
    Total Solids Percentagein AD 14 13 Fig. 7 Total solids percentage for AD with NO, INT and NO mixing in 4 weeks 0 7 14 21 0 7 14 21 0 7 14 21
  • 15.
    Solids, Methanogens andBiogas Production a a a a a a b a a a a a b a a 0 200 400 600 800 1,000 1,200 0.0 1.0 2.0 3.0 4.0 5.0 6.0 7.0 8.0 9.0 NO INT CON Biogasproduction(L) Mixing Duration VS % in the digester TS % in the digester logSUMm (log, base=10) Archaea (log,base=10) L biogas per kg TS in digester TS(%),VS(%),SumM&Archaea(log,base=10) 15 14 Fig. 8 Compare of solids, methanogens and biogas production
  • 16.
    Methanogens in AD 16 15 Fig.9 Archaea and sum of 5 tested Methanogens Archaea Sum M5 Sample time( day)
  • 17.
    Summary • No mixinghas a higher biogas production when TS = 5.5%, compared with INT and CON mixing. • No mixing will result in low specific gas production • Recommendation: Operate the mixer to prevent settling and other operational issues. 17 17
  • 18.
  • 19.
    Methanogens in AD 19 16 Fig.10 Methanogens changes in the digester
  • 20.
    Limitations • This studydoes not take the whole range of mixing duration: 0,1/4,2/4 . might also need ¾ and 4/4 20 17

Editor's Notes

  • #8 http://www.wettipgasmeter.com/images/meter_photo_500.jpg
  • #10 14608 12835 13490 NO INT CON
  • #12 CH4% 58.15 62.73 62.35 NO INT CON VS d% 123.2 100.6 100.6
  • #18 However, this study does not correlate to mixing intensity. Further studies is recommended to study the correlation about mixing duration, mixing intensity, mixer location as well as other parameters using a CFD model.
  • #20 Pathway. Genomes copies per gram In taxonomy, the Methanosarcinales are an order of the Methanomicrobia.[1] In the taxonomy of microorganisms, the Methanomicrobia are a class of the Euryarchaeota.[1] In taxonomy, the Methanosarcinaceae are a family of the Methanosarcinales.[1] In the taxonomy of microorganisms, the Methanomicrobiales are an order of the Methanomicrobia.[1] In taxonomy, the Methanosaetaceae are a family of the Methanosarcinales.[1]