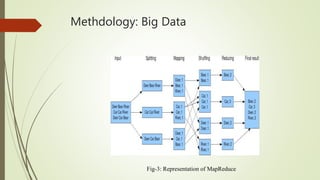
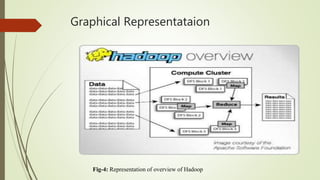
Walmart :forecasting model
Sharda Kumari
Mukesh Butekar
Mohit Mathur
Deepak Kumar
Rohan Mohan
Shubham Mankar
Vipul
Demand Forecasting
Role of forecasting
Planning process
Need of Forecast
Forecasting Methods
Qualitative Methods
Based on opinions
Quantitative Methods
Based on mathematical formulae &
statistics
Qualitative Methods
Delphi Technique
2. Sales Force Opinions
3. User Expectation Method/Survey of Buyer
Intentions Method
Quantitative Methods
1. Moving Average Method
2. Exponential Smoothing Method
3. Regression Method
Walmart: Sales force Composite
 Many household products are sold by various subsidiaries of the retail store network which
are geographically located at various locations.
 Supply chain inefficiencies will occur at different locations when the market potential will
not evaluated by the retailers. Many times it is not easy for the retailers to understand the
market condition at various geographical locations.
 The organization of retail store network has to understand the market conditions to
intensify its goods to be bought and sold so that many number of customers get attracted
in that direction. Business forecast helps retailers to visualize the big picture by forecasting
the sales we get a general idea of coming years if any changes are needed then those
changes are done in the retail store’s objective so that success is achieved more profitably .
Walmart: Sales force Composite
• It also helps the customers to be happy by providing the products desired by them
in desired time, when the customers are happy then they prefer the store that
provides all the resources they need to their satisfaction by this the sales in the
particular store in which the customers purchase more items increases causing more
profit.
• The forecasting of sales helps to know the retailers the demand of the product.
• understanding the retail store business’s driving factors by analyzing the sales data
of Walmart store that is geographically located at various locations and the forecast
of sales for coming 39 weeks is done.
• By sales forecasting composite the retail networks are supported so that the
resources can be managed efficiently.
IMPLEMENTATION OF SALES FORECASTING
 Sales Forecasting System Architecture
 Architecture is the most important aspect of any system.
 Fig.1 represents the system architecture.

Walmart :Forecasting method
Fig-2: The forecasting process
The Forecasting Process
 The process of forecasting is a group of methods to predict the sales. It is initiated after
determining the objective,selection of dependent and independent variables are done. The
forecasting results like sales data or the number of employees to be appointed in the upcoming
year. The market factor include the factors like products existence in the store, its quality and the
demand of the item .
 Market index is a market factor that is expressed as the amount of percentage relatively with
some base content. When the market index is increased then the industry sales is increased. The
index consists of many market factors like price, population of the area, personal income that is
disposable .
 Then in the forecasting process the procedures of forecast and methods that are useful for data
analysis are determined .If the procedures were not used in prior then the firm may want to test
the procedures. Then gathering and analyzing of data is done. Certain assumptions are made
about the forecasted sales. Then the sales forecast is finalized as the time passes and the results
are evaluated.

Methdology: Big Data
Fig-3: Representation of MapReduce
Graphical Representataion
Fig-4: Representation of overview of Hadoop
the combination of all graphs
Fig-6: the combination of all graphs, Fig-6: a represents sales and store, Fig-6: b represents store, departments, sales bubble
chart, Fig-6: c represents weekly sales and departments, Fig-6: d represents weekly sales and year (daily sales)
Sales Force Composite using Tableau
Fig-7: the sales and stores in Tableau
Fig-8: the representation of sales in stores by bubble chart in Tableau
Conclusion
Shopping malls / shopping centers plan to attract the customers to the store and make profit to the
maximum extent by them.
Once the customers enter the stores they are attracted then definitely they shop more by the special
offers and obtain the desired items which are available in the favorable cost and satisfy them.
If the products as per the needs of the customers then it can make maximum profit the retailers can
also make the changes in the operations, objectives of the store that cause loss and efficient
methods can be applied to gain more profit by observing the history of data the existing stores a
clear idea of sales can be known like seasonality trend and randomness.
The advantage of forecasting is to know the number of employees should be appointed to meet the
production level. Sales drop is bad thing forecasting sales helps to analyze it and it can overcome
through the sales drop to remain in the competition forecast plays a vital role.

Walmart

  • 1.
    Walmart :forecasting model ShardaKumari Mukesh Butekar Mohit Mathur Deepak Kumar Rohan Mohan Shubham Mankar Vipul
  • 2.
    Demand Forecasting Role offorecasting Planning process Need of Forecast
  • 3.
    Forecasting Methods Qualitative Methods Basedon opinions Quantitative Methods Based on mathematical formulae & statistics
  • 4.
    Qualitative Methods Delphi Technique 2.Sales Force Opinions 3. User Expectation Method/Survey of Buyer Intentions Method
  • 5.
    Quantitative Methods 1. MovingAverage Method 2. Exponential Smoothing Method 3. Regression Method
  • 6.
    Walmart: Sales forceComposite  Many household products are sold by various subsidiaries of the retail store network which are geographically located at various locations.  Supply chain inefficiencies will occur at different locations when the market potential will not evaluated by the retailers. Many times it is not easy for the retailers to understand the market condition at various geographical locations.  The organization of retail store network has to understand the market conditions to intensify its goods to be bought and sold so that many number of customers get attracted in that direction. Business forecast helps retailers to visualize the big picture by forecasting the sales we get a general idea of coming years if any changes are needed then those changes are done in the retail store’s objective so that success is achieved more profitably .
  • 7.
    Walmart: Sales forceComposite • It also helps the customers to be happy by providing the products desired by them in desired time, when the customers are happy then they prefer the store that provides all the resources they need to their satisfaction by this the sales in the particular store in which the customers purchase more items increases causing more profit. • The forecasting of sales helps to know the retailers the demand of the product. • understanding the retail store business’s driving factors by analyzing the sales data of Walmart store that is geographically located at various locations and the forecast of sales for coming 39 weeks is done. • By sales forecasting composite the retail networks are supported so that the resources can be managed efficiently.
  • 8.
    IMPLEMENTATION OF SALESFORECASTING  Sales Forecasting System Architecture  Architecture is the most important aspect of any system.  Fig.1 represents the system architecture. 
  • 9.
    Walmart :Forecasting method Fig-2:The forecasting process
  • 10.
    The Forecasting Process The process of forecasting is a group of methods to predict the sales. It is initiated after determining the objective,selection of dependent and independent variables are done. The forecasting results like sales data or the number of employees to be appointed in the upcoming year. The market factor include the factors like products existence in the store, its quality and the demand of the item .  Market index is a market factor that is expressed as the amount of percentage relatively with some base content. When the market index is increased then the industry sales is increased. The index consists of many market factors like price, population of the area, personal income that is disposable .  Then in the forecasting process the procedures of forecast and methods that are useful for data analysis are determined .If the procedures were not used in prior then the firm may want to test the procedures. Then gathering and analyzing of data is done. Certain assumptions are made about the forecasted sales. Then the sales forecast is finalized as the time passes and the results are evaluated. 
  • 11.
    Methdology: Big Data Fig-3:Representation of MapReduce
  • 12.
  • 13.
    the combination ofall graphs Fig-6: the combination of all graphs, Fig-6: a represents sales and store, Fig-6: b represents store, departments, sales bubble chart, Fig-6: c represents weekly sales and departments, Fig-6: d represents weekly sales and year (daily sales)
  • 14.
    Sales Force Compositeusing Tableau Fig-7: the sales and stores in Tableau
  • 15.
    Fig-8: the representationof sales in stores by bubble chart in Tableau
  • 16.
    Conclusion Shopping malls /shopping centers plan to attract the customers to the store and make profit to the maximum extent by them. Once the customers enter the stores they are attracted then definitely they shop more by the special offers and obtain the desired items which are available in the favorable cost and satisfy them. If the products as per the needs of the customers then it can make maximum profit the retailers can also make the changes in the operations, objectives of the store that cause loss and efficient methods can be applied to gain more profit by observing the history of data the existing stores a clear idea of sales can be known like seasonality trend and randomness. The advantage of forecasting is to know the number of employees should be appointed to meet the production level. Sales drop is bad thing forecasting sales helps to analyze it and it can overcome through the sales drop to remain in the competition forecast plays a vital role.