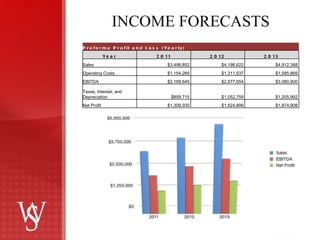
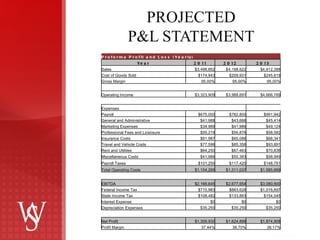
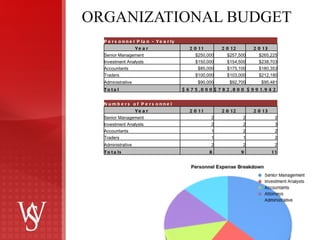
The following presentation represents the fundamental business model employed by the executive leaders of Wall Street Equities Co. Ltd., which represents our strategy to build a successful company.
INTRODUCTION Wall Street Equities Co. Ltd. , a  Canadian, United Arab Emirates and London based Company is seeking $10,000,000 of equity financing to develop its facilities  and launch business operations. The Founder, Mr. Mark Sutter, expects that the business will sell an 80% ownership interest in the business in exchange for the capital sought. Wall Street Equities Co. Ltd. will generate approximate yearly returns of 30% per annum compounded. Wall Street Equities Co. Ltd. will maintain a diverse portfolio of investments in marketable securities, mortgage assets, and other income and capital appreciation producing assets that will ensure the continued profitability of the Hedge Fund despite the current recessing economic conditions.
MANAGEMENT OVERVIEW MARK A. SUTTER President/CEO Mark Sutter has more than 20 years experience in the investment banking industry and has managed over $100 million in client assets.  As head of trading at several brokerage firms, Mark is directly responsible for taking more than 50 companies public through mergers, acquisitions and initial public offerings. His most recent accomplishments include forming Global Financial Strategies and Four Peaks Ventures, and turning them into powerhouse investment banking firms, specializing in consulting, venture capital, mergers and acquisitions, investor relations and public offerings.  Through his expertise he has brought the operations of these businesses to profitability within their first year of operations.
INCOME FORECASTS Proforma Profit and Loss (Yearly)     Year 2011 2012 2013 Sales $3,498,852  $4,198,622  $4,912,388  Operating Costs $1,154,265  $1,311,037  $1,585,869  EBITDA $2,169,645  $2,677,654  $3,080,900  Taxes, Interest, and Depreciation $859,715  $1,052,759  $1,205,992  Net Profit $1,309,930  $1,624,896  $1,874,908
PROJECTED P&L STATEMENT Proforma Profit and Loss (Yearly)     Year 2011 2012 2013 Sales $3,498,852 $4,198,622 $4,912,388 Cost of Goods Sold $174,943 $209,931 $245,619 Gross Margin 95.00% 95.00% 95.00%     Operating Income $3,323,909 $3,988,691 $4,666,769 Expenses       Payroll $675,000 $782,800 $991,942 General and Administrative $41,988 $43,668 $45,414 Marketing Expenses $34,989 $41,986 $49,124 Professional Fees and Licensure $55,219 $56,876 $58,582 Insurance Costs $61,987 $65,086 $68,341 Travel and Vehicle Costs $77,596 $85,356 $93,891 Rent and Utilities $64,250 $67,463 $70,836 Miscellaneous Costs $41,986 $50,383 $58,949 Payroll Taxes $101,250 $117,420 $148,791 Total Operating Costs $1,154,265 $1,311,037 $1,585,869 EBITDA $2,169,645 $2,677,654 $3,080,900 Federal Income Tax $715,983 $883,626 $1,016,697 State Income Tax $108,482 $133,883 $154,045 Interest Expense $0 $0 $0 Depreciation Expenses $35,250 $35,250 $35,250 Net Profit $1,309,930 $1,624,896 $1,874,908 Profit Margin 37.44% 38.70% 38.17%
ORGANIZATIONAL BUDGET Personnel Plan - Yearly       Year 2011 2012 2013 Senior Management $250,000 $257,500 $265,225 Investment Analysts $150,000 $154,500 $238,703 Accountants $85,000 $175,100 $180,353 Traders $100,000 $103,000 $212,180 Administrative $90,000 $92,700 $95,481 Total $675,000 $782,800 $991,942 Numbers of Personnel        Year 2011 2012 2013 Senior Management 2 2 2 Investment Analysts 2 2 3 Accountants 1 2 2 Traders 1 1 2 Administrative 2 2 2 Totals 8 9 11
ORGANIZATION OVERVIEW Management Investment Operations Capital Raising Investment Analysis Trading Operations Administrative Staff Accounting Sales & Marketing Administrative
PROJECTED CASH FLOW ANALYSIS Proforma Cash Flow Analysis - Yearly     Year 2011 2012 2013 Cash From Operations $1,345,180 $1,660,146 $1,910,158 Cash From Receivables $0 $0 $0 Operating Cash Inflow $1,345,180 $1,660,146 $1,910,158 Other Cash Inflows Equity Investment $10,000,000 $0 $0 Increased Borrowings $0 $0 $0 Sales of Business Assets $0 $0 $0 A/P Increases $37,902 $43,587 $50,125 Total Other Cash Inflows $10,037,902 $43,587 $50,125 Total Cash Inflow $11,383,082 $1,703,733 $1,960,283 Cash Outflows Repayment of Principal $0 $0 $0 A/P Decreases $24,897 $29,876 $35,852 A/R Increases $0 $0 $0 Asset Purchases  $8,875,000 $996,087 $1,146,095 Dividends $0 $581,051 $668,555 Total Cash Outflows $8,899,897 $1,607,015 $1,850,502 Net Cash Flow $2,483,185 $96,718 $109,782 Cash Balance $2,483,185 $2,579,903 $2,689,684
PROJECTED BALANCE SHEET Proforma Balance Sheet - Yearly       Year 2011 2012 2013 Assets Cash  $2,483,185 $2,579,903 $2,689,684 Amortized Development/Expansion Costs $250,000 $349,609 $464,218 Investment Portfolio $10,200,000 $14,980,246 $21,615,837 FF&E  $125,000 $224,609 $339,218 Accumulated Depreciation ($35,250) ($70,500) ($105,750) Total Assets $13,022,935 $18,063,866 $25,003,208 Liabilities and Equity Accounts Payable $13,005  $26,716  $40,990  Long Term Liabilities $0 $0 $0 Other Liabilities  $0 $0 $0 Total Liabilities $13,005 $26,716 $40,990 Net Worth $13,009,930 $18,037,150 $24,962,219 Total Liabilities and Equity $13,022,935 $18,063,866 $25,003,208
ADDITIONAL SUPPORTING MATERIAL Thank you for your review and consideration in  Wall Street Equities Co. Ltd.  Please see our  “Business Plan”  and  “Offering Memorandum”  for further explanation to  the material and details herein. Canadian Administrative office: 2 Temperance St, Suite 209, Toronto, ONT M5H 1Y51/3/11  Tel +1-416-623 -9615 Mark Sutter CEO & President  Tel:+1 (480) 628 5910  Efax:+1 (206) 299 7269     Office of Dubai Office 23, CNN Building,  Media City, Dubai, United Arab Emirates Email:  [email_address]

Wall street equities co 1. ltd. presentation

  • 1.
    The following presentationrepresents the fundamental business model employed by the executive leaders of Wall Street Equities Co. Ltd., which represents our strategy to build a successful company.
  • 2.
    INTRODUCTION Wall StreetEquities Co. Ltd. , a Canadian, United Arab Emirates and London based Company is seeking $10,000,000 of equity financing to develop its facilities and launch business operations. The Founder, Mr. Mark Sutter, expects that the business will sell an 80% ownership interest in the business in exchange for the capital sought. Wall Street Equities Co. Ltd. will generate approximate yearly returns of 30% per annum compounded. Wall Street Equities Co. Ltd. will maintain a diverse portfolio of investments in marketable securities, mortgage assets, and other income and capital appreciation producing assets that will ensure the continued profitability of the Hedge Fund despite the current recessing economic conditions.
  • 3.
    MANAGEMENT OVERVIEW MARKA. SUTTER President/CEO Mark Sutter has more than 20 years experience in the investment banking industry and has managed over $100 million in client assets. As head of trading at several brokerage firms, Mark is directly responsible for taking more than 50 companies public through mergers, acquisitions and initial public offerings. His most recent accomplishments include forming Global Financial Strategies and Four Peaks Ventures, and turning them into powerhouse investment banking firms, specializing in consulting, venture capital, mergers and acquisitions, investor relations and public offerings. Through his expertise he has brought the operations of these businesses to profitability within their first year of operations.
  • 4.
    INCOME FORECASTS ProformaProfit and Loss (Yearly)     Year 2011 2012 2013 Sales $3,498,852 $4,198,622 $4,912,388 Operating Costs $1,154,265 $1,311,037 $1,585,869 EBITDA $2,169,645 $2,677,654 $3,080,900 Taxes, Interest, and Depreciation $859,715 $1,052,759 $1,205,992 Net Profit $1,309,930 $1,624,896 $1,874,908
  • 5.
    PROJECTED P&L STATEMENTProforma Profit and Loss (Yearly)     Year 2011 2012 2013 Sales $3,498,852 $4,198,622 $4,912,388 Cost of Goods Sold $174,943 $209,931 $245,619 Gross Margin 95.00% 95.00% 95.00%     Operating Income $3,323,909 $3,988,691 $4,666,769 Expenses       Payroll $675,000 $782,800 $991,942 General and Administrative $41,988 $43,668 $45,414 Marketing Expenses $34,989 $41,986 $49,124 Professional Fees and Licensure $55,219 $56,876 $58,582 Insurance Costs $61,987 $65,086 $68,341 Travel and Vehicle Costs $77,596 $85,356 $93,891 Rent and Utilities $64,250 $67,463 $70,836 Miscellaneous Costs $41,986 $50,383 $58,949 Payroll Taxes $101,250 $117,420 $148,791 Total Operating Costs $1,154,265 $1,311,037 $1,585,869 EBITDA $2,169,645 $2,677,654 $3,080,900 Federal Income Tax $715,983 $883,626 $1,016,697 State Income Tax $108,482 $133,883 $154,045 Interest Expense $0 $0 $0 Depreciation Expenses $35,250 $35,250 $35,250 Net Profit $1,309,930 $1,624,896 $1,874,908 Profit Margin 37.44% 38.70% 38.17%
  • 6.
    ORGANIZATIONAL BUDGET PersonnelPlan - Yearly       Year 2011 2012 2013 Senior Management $250,000 $257,500 $265,225 Investment Analysts $150,000 $154,500 $238,703 Accountants $85,000 $175,100 $180,353 Traders $100,000 $103,000 $212,180 Administrative $90,000 $92,700 $95,481 Total $675,000 $782,800 $991,942 Numbers of Personnel       Year 2011 2012 2013 Senior Management 2 2 2 Investment Analysts 2 2 3 Accountants 1 2 2 Traders 1 1 2 Administrative 2 2 2 Totals 8 9 11
  • 7.
    ORGANIZATION OVERVIEW ManagementInvestment Operations Capital Raising Investment Analysis Trading Operations Administrative Staff Accounting Sales & Marketing Administrative
  • 8.
    PROJECTED CASH FLOWANALYSIS Proforma Cash Flow Analysis - Yearly     Year 2011 2012 2013 Cash From Operations $1,345,180 $1,660,146 $1,910,158 Cash From Receivables $0 $0 $0 Operating Cash Inflow $1,345,180 $1,660,146 $1,910,158 Other Cash Inflows Equity Investment $10,000,000 $0 $0 Increased Borrowings $0 $0 $0 Sales of Business Assets $0 $0 $0 A/P Increases $37,902 $43,587 $50,125 Total Other Cash Inflows $10,037,902 $43,587 $50,125 Total Cash Inflow $11,383,082 $1,703,733 $1,960,283 Cash Outflows Repayment of Principal $0 $0 $0 A/P Decreases $24,897 $29,876 $35,852 A/R Increases $0 $0 $0 Asset Purchases $8,875,000 $996,087 $1,146,095 Dividends $0 $581,051 $668,555 Total Cash Outflows $8,899,897 $1,607,015 $1,850,502 Net Cash Flow $2,483,185 $96,718 $109,782 Cash Balance $2,483,185 $2,579,903 $2,689,684
  • 9.
    PROJECTED BALANCE SHEETProforma Balance Sheet - Yearly       Year 2011 2012 2013 Assets Cash $2,483,185 $2,579,903 $2,689,684 Amortized Development/Expansion Costs $250,000 $349,609 $464,218 Investment Portfolio $10,200,000 $14,980,246 $21,615,837 FF&E $125,000 $224,609 $339,218 Accumulated Depreciation ($35,250) ($70,500) ($105,750) Total Assets $13,022,935 $18,063,866 $25,003,208 Liabilities and Equity Accounts Payable $13,005 $26,716 $40,990 Long Term Liabilities $0 $0 $0 Other Liabilities $0 $0 $0 Total Liabilities $13,005 $26,716 $40,990 Net Worth $13,009,930 $18,037,150 $24,962,219 Total Liabilities and Equity $13,022,935 $18,063,866 $25,003,208
  • 10.
    ADDITIONAL SUPPORTING MATERIALThank you for your review and consideration in Wall Street Equities Co. Ltd. Please see our “Business Plan” and “Offering Memorandum” for further explanation to the material and details herein. Canadian Administrative office: 2 Temperance St, Suite 209, Toronto, ONT M5H 1Y51/3/11 Tel +1-416-623 -9615 Mark Sutter CEO & President Tel:+1 (480) 628 5910 Efax:+1 (206) 299 7269     Office of Dubai Office 23, CNN Building, Media City, Dubai, United Arab Emirates Email: [email_address]