Download to read offline
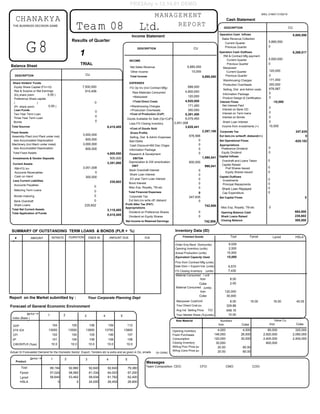
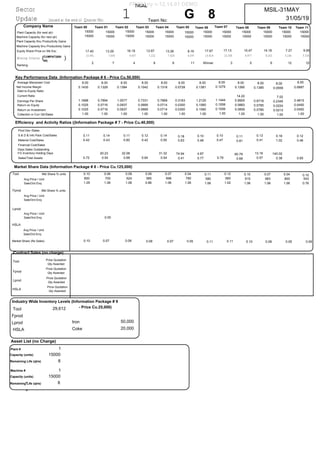

This document provides financial information for Team 08 Ltd. including income statements, balance sheets, cash flow statements, and key performance indicators for the current quarter. It shows information on revenues, expenses, assets, liabilities, cash flows, and various ratios to analyze the company's financial performance and position.


