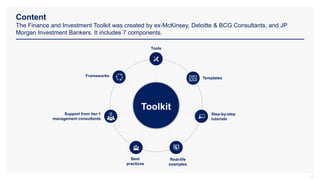
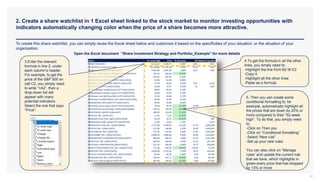
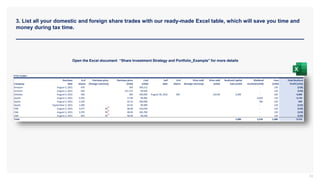
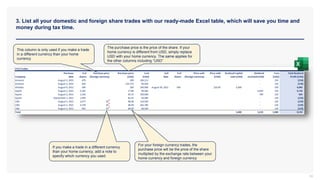
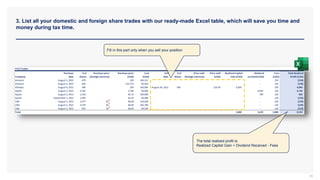
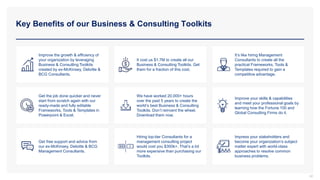
The Finance and Investment Toolkit was created by ex-consultants and investment bankers to help users with various finance and investment related tasks. It includes frameworks, tools, templates, tutorials, examples and best practices covering areas such as building business cases, financial models, financial statements, valuation, and investment strategies. The toolkit aims to assist users in getting project approval, estimating financials, analyzing performance, creating business plans, prioritizing initiatives, and more. It provides Excel templates and step-by-step guidance for tasks like developing budgets, modeling cash flow, and monitoring investment opportunities.
Finance and Investment Toolkit - Framework, Best Practices and TemplatesAurelien Domont, MBA
This Toolkit was created by ex-McKinsey & Deloitte Consultants, and JP Morgan Investment Bankers, after more than 1,000 hours of work. It is considered the world's best & most comprehensive Finance & Investment Toolkit. It includes all the Frameworks, Tools & Templates required to improve the capability of your organization and boost your career. You can download the entire Toolkit in Powerpoint and Excel at www.slidebooks.com
This Toolkit was created by ex-McKinsey, Deloitte and BCG Consultants and Entrepreneurs, after more than 4,000 hours of work. It is considered the world's best & most comprehensive Entrepreneurship Toolkit. It includes all the Frameworks, Tools & Templates required to build, run and scale your own Business and excel as an Entrepreneur.
This Powerpoint presentation is only a small preview of our Toolkit.
You can download the entire Toolkit in Powerpoint and Excel at www.domontconsulting.com
Building Your Financial Model Key Startup Metrics David Ehrenberg
Does your financial model explain how your business really works? Give you clear insight into the financial health of your startup? Tell a story that inspires investor confidence and will help you to raise capital?
As Guy Kawasaki said so well in his entrepreneurial bible Art of the Start, “the point of financial projections is to tell a story with numbers—a story about opportunity, resource requirements, market forces, growth, milestone achievements, and profits."
This Slideshare presentation is a partial preview of the full business document. To view and download the full document, please go here:
http://flevy.com/browse/business-document/business-case-development-framework-199
The Business Case is an instrumental tool in both justifying a project (requiring a capital budgeting decision), as well as measuring the project's success. The Business Case model typically takes the form of an Excel spreadsheet and quantifies the financial components of the project, projecting key metrics for making any important business decision: Net Present Value (NPV), Return on Investment (ROI), Payback Period, Cost of Investment.
If a project has been justified by the Business Case (both financially and non-financially) and receives the go-ahead from executives, the Business Case model is then continuously maintained and adjusted to track the project?s progress against the initial financial projections and assumptions. This model then becomes a working document used during the project management process.
This toolkit will detail the process of creating a robust Business Case. It also includes a working sample Business Case model (in Microsoft Excel).
Financial Modeling, Planning & Analysis Toolkit and TemplatesAurelien Domont, MBA
This Toolkit was created by ex-JP Morgan Investment Bankers, and McKinsey & Deloitte Consultants, after more than 4,000 hours of work. It includes all the Frameworks, Best Practices & Templates required to build strong Financial Modeling, Planning & Analysis capabilities within your organization. Build a success story such as Apple and Google, who gained a competitive advantage by mastering Financial Modeling, Planning & Analysis.
This Powerpoint presentation is only a small preview of our Toolkit.
You can download the entire Toolkit in Powerpoint and Excel at www.domontconsulting.com
Strategic Planning Toolkit - Framework, Best Practices and TemplatesAurelien Domont, MBA
This Strategic Planning Toolkit was created by ex-McKinsey, Deloitte and BCG Strategy Consultants, after more than 2,000 hours of work. It is considered the world's best & most comprehensive Strategic Planning Toolkit. It includes all the Frameworks, Analysis Tools & Document Templates required to improve your Strategic Planning capability, and become the subject matter expert of your organization. This Slideshare Powerpoint presentation is only a small preview of our Toolkit. You can download the entire Toolkit in Powerpoint and Excel at www.slidebooks.com
[Insert Company Name]Investor Report Prepared by [Your Name]TatianaMajor22
[Insert Company Name]
Investor Report
Prepared by [Your Name]
Instructions: Replace all text in brackets with your own information.
1
Introduction
[Outline your company’s business and your vision for its future.]
2
Introduce the company and its business. What is your vision for the future of the business? What do you hope to achieve? Where do you see the company in five years or ten?
2
Purpose
[Explain the purpose of this report and what you hope to convey about the company and its financials.]
3
[What do you plan to communicate, and why should your investors pay attention? In other words, try to persuade your investors that the accounting information you are about to share is important.]
3
Methods and Approach
[Explain some management accounting methods and how your report and the data it represents adheres to industry standards and the AICPA code of ethics.]
4
[Explain some management accounting methods you used to determine your costing strategy, evaluate your financial information, etc., and explain how your methods of generating information adhere to industry standards and AICPA’s code of ethics. In other words, why should your investors trust that you are delivering accurate financial data and that your decision-making process has been ethical?]
4
Financial Strategy
5
5
Costing System
[Outline why the job order costing system works best for the business.]
6
[Explain in detail the use of job order costing for this business. Why is it suited for your business? Be sure to compare and contrast the various costing systems you learned about in this course as part of your defense.]
6
Selling Prices
[List the selling price you chose for each product.]
7
[Explain and defend the selling prices that you established for each product. Why did you choose these selling prices? Be sure to reference your cost-volume-profit analysis in your defense]
7
Contribution Margin
[Copy and paste your completed table from the “Contribution Margin Analysis” tab of your Project Workbook.]
8
[Share and explain your contribution margin per unit. How did you arrive at these numbers? Be sure to reference your cost-volume-profit analysis in your defense. ]
8
Target Profits
[Copy and paste the completed table from the “Break-Even Analysis” tab of your Project Workbook.]
9
[Specify the break-even points you determined for achieving different target profit levels. Then, explain and defend the target profits you selected for each area of your business. Be sure to reference your cost-volume-profit analysis in your defense.]
9
Financial Statements
10
10
Statement of Cost of Goods Sold
[Copy and paste your table from the “COGS” tab of your completed Project Workbook.]
11
[Compare the actual cost of goods sold over the last month and evaluate the company’s performance against the budgeted benchmarks. Are the numbers close to what you expected? Interpret the performance and explain what happened.]
11
Income Statement
[C ...
Warren Buffet Value Investing Strategy Toolkit and Excel TemplatesAurelien Domont, MBA
This Toolkit was created by former JP Morgan Investment Bankers, and McKinsey & Deloitte Consultants, after more than 3,000 hours of work studying Warren Buffet. It includes all the Frameworks, Best Practices, Templates and Excel Tools required to define and implement Warren Buffet’s value investing strategy step by step. Outperform the market by simply investing in good or great companies, fairly or undervalued, and perfectly understood.
This Powerpoint presentation is only a small preview of our Toolkit.
You can download the entire Toolkit in Powerpoint and Excel at www.domontconsulting.com
The Impact of Artificial Intelligence on Modern Society.pdfssuser3e63fc
Just a game Assignment 3
1. What has made Louis Vuitton's business model successful in the Japanese luxury market?
2. What are the opportunities and challenges for Louis Vuitton in Japan?
3. What are the specifics of the Japanese fashion luxury market?
4. How did Louis Vuitton enter into the Japanese market originally? What were the other entry strategies it adopted later to strengthen its presence?
5. Will Louis Vuitton have any new challenges arise due to the global financial crisis? How does it overcome the new challenges?Assignment 3
1. What has made Louis Vuitton's business model successful in the Japanese luxury market?
2. What are the opportunities and challenges for Louis Vuitton in Japan?
3. What are the specifics of the Japanese fashion luxury market?
4. How did Louis Vuitton enter into the Japanese market originally? What were the other entry strategies it adopted later to strengthen its presence?
5. Will Louis Vuitton have any new challenges arise due to the global financial crisis? How does it overcome the new challenges?
Want to move your career forward? Looking to build your leadership skills while helping others learn, grow, and improve their skills? Seeking someone who can guide you in achieving these goals?
You can accomplish this through a mentoring partnership. Learn more about the PMISSC Mentoring Program, where you’ll discover the incredible benefits of becoming a mentor or mentee. This program is designed to foster professional growth, enhance skills, and build a strong network within the project management community. Whether you're looking to share your expertise or seeking guidance to advance your career, the PMI Mentoring Program offers valuable opportunities for personal and professional development.
Watch this to learn:
* Overview of the PMISSC Mentoring Program: Mission, vision, and objectives.
* Benefits for Volunteer Mentors: Professional development, networking, personal satisfaction, and recognition.
* Advantages for Mentees: Career advancement, skill development, networking, and confidence building.
* Program Structure and Expectations: Mentor-mentee matching process, program phases, and time commitment.
* Success Stories and Testimonials: Inspiring examples from past participants.
* How to Get Involved: Steps to participate and resources available for support throughout the program.
Learn how you can make a difference in the project management community and take the next step in your professional journey.
About Hector Del Castillo
Hector is VP of Professional Development at the PMI Silver Spring Chapter, and CEO of Bold PM. He's a mid-market growth product executive and changemaker. He works with mid-market product-driven software executives to solve their biggest growth problems. He scales product growth, optimizes ops and builds loyal customers. He has reduced customer churn 33%, and boosted sales 47% for clients. He makes a significant impact by building and launching world-changing AI-powered products. If you're looking for an engaging and inspiring speaker to spark creativity and innovation within your organization, set up an appointment to discuss your specific needs and identify a suitable topic to inspire your audience at your next corporate conference, symposium, executive summit, or planning retreat.
About PMI Silver Spring Chapter
We are a branch of the Project Management Institute. We offer a platform for project management professionals in Silver Spring, MD, and the DC/Baltimore metro area. Monthly meetings facilitate networking, knowledge sharing, and professional development. For event details, visit pmissc.org.
Operating system. short answes and Interview questions .pdf
Finance and Investment Toolkit
1. Finance and Investment Toolkit
Overview and Approach
Created by ex-McKinsey, Deloitte &
BCG Consultants, and JP Morgan
Investment Bankers
2. Content
The Finance and Investment Toolkit was created by ex-McKinsey, Deloitte & BCG Consultants, and JP
Morgan Investment Bankers. It includes 7 components.
2
Tools
Templates
Step-by-step
tutorials
Real-life
examples
Best
practices
Support from tier-1
management consultants
Frameworks
Toolkit
3. Objectives
The Finance and Investment Toolkit includes frameworks, tools, templates, tutorials, real-life examples, and
best practices to help you:
3
1. Get your project approved by the executive committee with our ready-made business case including sections such as "Business opportunity and
suggested solution", "Project objectives, scope, and approach", "Project deliverables and business outcomes", "Strategic alignment", "Dependencies and
constraints ", "Risk assessment and mitigation", "Change impact assessment", "Project costs", "Benefits", "Net present value", and "Key success factors“.
2. Build simple or sophisticated financial models to estimate the financials of your project or new venture: revenue, cost savings, cash flow, net present
value (NPV), return on investment (ROI), internal rate of return (IRR), payback period, weighted average cost of capital(WACC), project capex, profit and loss
(P&L), economic value added (EVA), etc.
3. Build your 3 financial statements using our simple or sophisticated ready-made income statements, cash flow statements, and balance sheets.
4. Build a “3 financial statement” model that links your 3 financial statements together and includes different scenarios.
5. Analyze the 3 financial statements and a company’s performance by leveraging key financial ratios such as efficiency ratios, solvency ratios, liquidity
ratios, profitability ratios, leverage ratios, and return on investment ratios.
6. Create a robust business and financial plan including sections such as “Problem to solve and solution”, “Mission, vision, and strategic objectives”, “Target
market”, “Market analysis”, “Competitor analysis”, “Marketing plan”, “Business structure”, “Profit and loss forecast”, “Cash flow forecast”, and “Balance sheet
forecast”.
7. Identify the key drivers of your profit to easily explain your profit growth or profit decline and act accordingly.
8. Prioritize your initiatives based on impact and effort.
9. Create a monthly budget to monitor the expenses and the revenue of your team or project.
10. Value businesses based on the top 4 valuation methods: Discounted cash flow(DCF) analysis, discounted future earnings analysis, precedent transaction
analysis, and comparable company analysis.
11. Define your share investment strategy by leveraging our real-life example based on the thinking of some of the best share investors of all time such as
Warren Buffet, Charlie Munger, Ray Dalio, and Bill Ackman.
12. Create a share watchlist in 1 Excel sheet linked to the stock market to monitor investing opportunities with indicators automatically changing colors when
the price of a share becomes more attractive.
13. List all your domestic and foreign share trades with our ready-made Excel table, which will save you time and money during tax time.
14. Display the true performance of your stock portfolio with a ready-made Excel table and dashboard commonly used by hedge funds.
4. In the next slides, you’ll see a small preview of the objectives highlighted
below.
4
1. Get your project approved by the executive committee with our ready-made business case including sections such as "Business opportunity and
suggested solution", "Project objectives, scope, and approach", "Project deliverables and business outcomes", "Strategic alignment", "Dependencies and
constraints ", "Risk assessment and mitigation", "Change impact assessment", "Project costs", "Benefits", "Net present value", and "Key success factors“.
2. Build simple or sophisticated financial models to estimate the financials of your project or new venture: revenue, cost savings, cash flow, net present
value (NPV), return on investment (ROI), internal rate of return (IRR), payback period, weighted average cost of capital(WACC), project capex, profit and loss
(P&L), economic value added (EVA), etc.
3. Build your 3 financial statements using our simple or sophisticated ready-made income statements, cash flow statements, and balance sheets.
4. Build a “3 financial statement” model that links your 3 financial statements together and includes different scenarios.
5. Analyze the 3 financial statements and a company’s performance by leveraging key financial ratios such as efficiency ratios, solvency ratios, liquidity
ratios, profitability ratios, leverage ratios, and return on investment ratios.
6. Create a robust business and financial plan including sections such as “Problem to solve and solution”, “Mission, vision, and strategic objectives”, “Target
market”, “Market analysis”, “Competitor analysis”, “Marketing plan”, “Business structure”, “Profit and loss forecast”, “Cash flow forecast”, and “Balance sheet
forecast”.
7. Identify the key drivers of your profit to easily explain your profit growth or profit decline and act accordingly.
8. Prioritize your initiatives based on impact and effort.
9. Create a monthly budget to monitor the expenses and the revenue of your team or project.
10. Value businesses based on the top 4 valuation methods: Discounted cash flow(DCF) analysis, discounted future earnings analysis, precedent transaction
analysis, and comparable company analysis.
11. Define your share investment strategy by leveraging our real-life example based on the thinking of some of the best share investors of all time such as
Warren Buffet, Charlie Munger, Ray Dalio, and Bill Ackman.
12. Create a share watchlist in 1 Excel sheet linked to the stock market to monitor investing opportunities with indicators automatically changing colors when
the price of a share becomes more attractive.
13. List all your domestic and foreign share trades with our ready-made Excel table, which will save you time and money during tax time.
14. Display the true performance of your stock portfolio with a ready-made Excel table and dashboard commonly used by hedge funds.
5. Change Impact
High Impact
Net Present Value
$8M
Number of Resources
12
Change Manager
John Doe
Cash Flow (US $ millions)
Project Sponsor
John Doe
Intangible Benefits
Insert your own text
Project Costs
$4M
Tangible Benefits
$14M
Project Manager
John Doe
Strategic Alignment
Insert the strategic objectives that the project is
aligned with
Lean Business Case
Project name:
Project description:
5
(5.1)
1.8
4.6
6.9
9.9
Year 1 Year 2 Year 3 Year 4 Year 5
This Lean Business Case is very
important, as your CEO and senior
executives may not have time to deep
dive into more details. It is the first
section of the business case, but is
often done at the end.
6. Objectives
• Replace this text with your own text
Deliverable examples
Key Business Outcomes
• Replace this text with your own text
Key Deliverables
• Replace this text with your own text
Key Activities and Milestones
• Replace this text with your own text
Project Deliverables and Business Outcomes
Zooming in on Phase I
6
1
2
3
Replace these images with
images of your own deliverables
so your stakeholders can better
imagine what will be done.
7. Overview
The Excel document “Lean Financial Model” includes 5 Excel sheets where you will have to input
your data, and 2 Excel “output” sheets that will automatically update based on your input
7
Input your data in these 5 Excel sheets
These 2 output sheets will be automatically
updated based on your input
Project Initial Investment
Project Costs
Additional Revenue Generated
Cost Savings
WACC
Project Financials Summary
Project Cash Flow Chart
8. Timeframe
Description
The most common timeframe to estimate the financial performance of a project is 5 years. Year 0 is the present day. Year 1 represents the first
12 months. Year 2 represents the period between 12 months and 24 months, etc.
8
9. In the next slides, you’ll see a small preview of the objectives highlighted
below.
9
1. Get your project approved by the executive committee with our ready-made business case including sections such as "Business opportunity and
suggested solution", "Project objectives, scope, and approach", "Project deliverables and business outcomes", "Strategic alignment", "Dependencies and
constraints ", "Risk assessment and mitigation", "Change impact assessment", "Project costs", "Benefits", "Net present value", and "Key success factors“.
2. Build simple or sophisticated financial models to estimate the financials of your project or new venture: revenue, cost savings, cash flow, net present
value (NPV), return on investment (ROI), internal rate of return (IRR), payback period, weighted average cost of capital(WACC), project capex, profit and loss
(P&L), economic value added (EVA), etc.
3. Build your 3 financial statements using our simple or sophisticated ready-made income statements, cash flow statements, and balance sheets.
4. Build a “3 financial statement” model that links your 3 financial statements together and includes different scenarios.
5. Analyze the 3 financial statements and a company’s performance by leveraging key financial ratios such as efficiency ratios, solvency ratios, liquidity
ratios, profitability ratios, leverage ratios, and return on investment ratios.
6. Create a robust business and financial plan including sections such as “Problem to solve and solution”, “Mission, vision, and strategic objectives”, “Target
market”, “Market analysis”, “Competitor analysis”, “Marketing plan”, “Business structure”, “Profit and loss forecast”, “Cash flow forecast”, and “Balance sheet
forecast”.
7. Identify the key drivers of your profit to easily explain your profit growth or profit decline and act accordingly.
8. Prioritize your initiatives based on impact and effort.
9. Create a monthly budget to monitor the expenses and the revenue of your team or project.
10. Value businesses based on the top 4 valuation methods: Discounted cash flow(DCF) analysis, discounted future earnings analysis, precedent transaction
analysis, and comparable company analysis.
11. Define your share investment strategy by leveraging our real-life example based on the thinking of some of the best share investors of all time such as
Warren Buffet, Charlie Munger, Ray Dalio, and Bill Ackman.
12. Create a share watchlist in 1 Excel sheet linked to the stock market to monitor investing opportunities with indicators automatically changing colors when
the price of a share becomes more attractive.
13. List all your domestic and foreign share trades with our ready-made Excel table, which will save you time and money during tax time.
14. Display the true performance of your stock portfolio with a ready-made Excel table and dashboard commonly used by hedge funds.
10. Links between the income statement and the cash flow statement
10
From income statement…
Revenue
Cost of goods sold
Gross profit
Operating expenses
EBITDA
Depreciation and amortization
EBIT
Interest
Income tax expense
Net income(adjusted)
Net income
Dividend payout
Net income after distribution
… to cash flow statement
Net income adjusted
Depreciation and amortization
Deferred income taxes
Changes in accounts receivable
Changes in inventory
Changes in accounts payable
Changes in accrued liabilities
CAPEX
Other investing activities
Debt
Dividends paid
Equity issuances(buybacks)
Total change in cash
Operating
activities
Investing
activities
Financing
activities
11. There are 6 categories of financial ratio that can be used to analyze a company’s
performance
11
1.Efficiency
ratios
2.Solvency
ratios
3.Liquidity
ratios
4.Profitability
ratios
5.Leverage
ratios
6.Return on
investment
ratios
12. 1.Efficiency ratios are typically used to analyze how well a company uses its
assets and liabilities internally
12
1365 / turnover ratio gives you the days outstanding
2The average equals the value at the beginning of the year + the value at the end of the year divided by 2
Formula2 Definition2 Result
Ratio1
COGS / Average inventory The length of time it takes a company to sell inventory Insert your own text
Inventory turnover
ratio
Sales / Average accounts
receivable
The length of time it takes a company to collect accounts
receivable
Insert your own text
Accounts receivable
turnover ratio
COGS / Average accounts
payable
The length of time it takes a company to pay its creditors Insert your own text
Accounts payable
turnover ratio
Sales / Average net assets The efficiency of asset usage within a company Insert your own text
Asset turnover ratio
Sales / Average fixed assets The efficiency of fixed asset usage within a company Insert your own text
Fixed asset turnover
ratio
Sales / Average working
capital
How effectively is a company using its working capital
(= current assets – current liabilities) to generate sales
Insert your own text
Working capital
turnover ratio
13. See below additional screenshots from the Toolkit
13
Profit & Loss Forecast for small businesses Profit & Loss for large organizations
14. In the next slides, you’ll see a small preview of the objective highlighted
below.
14
1. Get your project approved by the executive committee with our ready-made business case including sections such as "Business opportunity and
suggested solution", "Project objectives, scope, and approach", "Project deliverables and business outcomes", "Strategic alignment", "Dependencies and
constraints ", "Risk assessment and mitigation", "Change impact assessment", "Project costs", "Benefits", "Net present value", and "Key success factors“.
2. Build simple or sophisticated financial models to estimate the financials of your project or new venture: revenue, cost savings, cash flow, net present
value (NPV), return on investment (ROI), internal rate of return (IRR), payback period, weighted average cost of capital(WACC), project capex, profit and loss
(P&L), economic value added (EVA), etc.
3. Build your 3 financial statements using our simple or sophisticated ready-made income statements, cash flow statements, and balance sheets.
4. Build a “3 financial statement” model that links your 3 financial statements together and includes different scenarios.
5. Analyze the 3 financial statements and a company’s performance by leveraging key financial ratios such as efficiency ratios, solvency ratios, liquidity
ratios, profitability ratios, leverage ratios, and return on investment ratios.
6. Create a robust business and financial plan including sections such as “Problem to solve and solution”, “Mission, vision, and strategic objectives”, “Target
market”, “Market analysis”, “Competitor analysis”, “Marketing plan”, “Business structure”, “Profit and loss forecast”, “Cash flow forecast”, and “Balance sheet
forecast”.
7. Identify the key drivers of your profit to easily explain your profit growth or profit decline and act accordingly.
8. Prioritize your initiatives based on impact and effort.
9. Create a monthly budget to monitor the expenses and the revenue of your team or project.
10. Value businesses based on the top 4 valuation methods: Discounted cash flow(DCF) analysis, discounted future earnings analysis, precedent transaction
analysis, and comparable company analysis.
11. Define your share investment strategy by leveraging our real-life example based on the thinking of some of the best share investors of all time such as
Warren Buffet, Charlie Munger, Ray Dalio, and Bill Ackman.
12. Create a share watchlist in 1 Excel sheet linked to the stock market to monitor investing opportunities with indicators automatically changing colors when
the price of a share becomes more attractive.
13. List all your domestic and foreign share trades with our ready-made Excel table, which will save you time and money during tax time.
14. Display the true performance of your stock portfolio with a ready-made Excel table and dashboard commonly used by hedge funds.
15. Competitor
Analysis
Marketing
Plan
Financial
Plan
Mission, Vision,
and Strategic
Objectives
Executive Summary
One-Pager Business Plan
Market Analysis
Customer
Segments
Business
Structure
Problem to Solve
& Solution
Insert your own text
Capital required:
Source of capital:
Revenue streams:
Cost structure:
The best practice is to have
between 1 and 2 slides for the
Executive Summary.
Even though the Executive
Summary is usually done at the
end, it should be placed at the
beginning of your Business Plan.
15
16. Strategy Map
Example of a Strategy Map
Financial
Perspective
Customer
Internal Process
Learning
&
Growth
Strategic objectives
Increase
revenue
Increase profit
Increase number
of customers
Increase revenue
per customer
Decrease cost
Decrease fixed
cost
Decrease
variable cost
Significantly below target
Slightly below target
Meeting target or above target
Increase
customer
satisfaction
Become a
trusted brand
Sell new
products
Understand
customer
segments
Shift to digital
channel
Decrease
delivery time
Create new
products
Improve
employee
satisfaction
Improve
customer
information
Create a customer-
focused culture
Align the
organization
16
17. In the next slides, you’ll see a small preview of the objectives highlighted
below.
17
1. Get your project approved by the executive committee with our ready-made business case including sections such as "Business opportunity and
suggested solution", "Project objectives, scope, and approach", "Project deliverables and business outcomes", "Strategic alignment", "Dependencies and
constraints ", "Risk assessment and mitigation", "Change impact assessment", "Project costs", "Benefits", "Net present value", and "Key success factors“.
2. Build simple or sophisticated financial models to estimate the financials of your project or new venture: revenue, cost savings, cash flow, net present
value (NPV), return on investment (ROI), internal rate of return (IRR), payback period, weighted average cost of capital(WACC), project capex, profit and loss
(P&L), economic value added (EVA), etc.
3. Build your 3 financial statements using our simple or sophisticated ready-made income statements, cash flow statements, and balance sheets.
4. Build a “3 financial statement” model that links your 3 financial statements together and includes different scenarios.
5. Analyze the 3 financial statements and a company’s performance by leveraging key financial ratios such as efficiency ratios, solvency ratios, liquidity
ratios, profitability ratios, leverage ratios, and return on investment ratios.
6. Create a robust business and financial plan including sections such as “Problem to solve and solution”, “Mission, vision, and strategic objectives”, “Target
market”, “Market analysis”, “Competitor analysis”, “Marketing plan”, “Business structure”, “Profit and loss forecast”, “Cash flow forecast”, and “Balance sheet
forecast”.
7. Identify the key drivers of your profit to easily explain your profit growth or profit decline and act accordingly.
8. Prioritize your initiatives based on impact and effort.
9. Create a monthly budget to monitor the expenses and the revenue of your team or project.
10. Value businesses based on the top 4 valuation methods: Discounted cash flow(DCF) analysis, discounted future earnings analysis, precedent transaction
analysis, and comparable company analysis.
11. Define your share investment strategy by leveraging our real-life example based on the thinking of some of the best share investors of all time such as
Warren Buffet, Charlie Munger, Ray Dalio, and Bill Ackman.
12. Create a share watchlist in 1 Excel sheet linked to the stock market to monitor investing opportunities with indicators automatically changing colors when
the price of a share becomes more attractive.
13. List all your domestic and foreign share trades with our ready-made Excel table, which will save you time and money during tax time.
14. Display the true performance of your stock portfolio with a ready-made Excel table and dashboard commonly used by hedge funds.
18. The problem we are trying to solve is a profitability problem. To solve it,
we need a profitability framework
18
“Why has the
company’s profit
decreased by 10%?”
“Should we enter the
Chinese market?”
“Should we introduce
this new product X?”
“Should we acquire
company Y?”
Profitability problem
Entering a new
market problem
Introducing a new
product problem
M&A problem
19. Table of Contents
Step 1: Define the situation, complication, and main question to answer
Step 2: Identify the best framework to use to solve the problem
Step 3: Understand how to use the profitability framework
Step 4: Apply the profitability framework to the company
Step 5: Apply the profitability framework to the industry
Step 6: Provide conclusion and recommendations
Best practices
Real-life examples
Templates
19
20. Objective and description of a profitability framework
20
The objective of the profitability framework is to highlight the fundamental profit drivers in a
business.
The framework breaks down the problem into smaller pieces to understand the key drivers of the
declining profit.
The framework basically breaks down the profit of a company into this simple equation:
Profit = Revenue – Cost
Then, it breaks down the revenue and the cost of the company into smaller pieces.
The profitability framework is very visual way of seeing what’s wrong.
21. Standard example of a profitability framework
21
Profit
Units produced
Cost per unit
Revenue
Cost
Price per unit
# of units sold
Variable costs
Fixed costs
22. How to create a profitability framework
22
1. Choose your first layer to break down the company profit. Most of the time, the first layer will be
“Revenue” and “Cost”
2. Choose your revenue model. For example, it can be:
• Price * Quantity
• # of transactions * Average transaction value
3. Choose your cost structure. For example, it can be:
• Fixed cost + Variable cost
• A value chain-based cost structure (e.g., raw material cost, manufacturing cost, distribution, sales and
marketing cost, and customer service)
4. Deep dive into the most important revenue and cost drivers
23. Table of Contents
Step 1: Define the situation, complication, and main question to answer
Step 2: Identify the best framework to use to solve the problem
Step 3: Understand how to use the profitability framework
Step 4: Apply the profitability framework to the company
Step 5: Apply the profitability framework to the industry
Step 6: Provide conclusion and recommendations
Best practices
Real-life examples
Templates
23
24. When we apply the profitability problem framework to our problem, we can
notice that the # of units sold is the main driver of the declining profit
24
Company
Profit
Revenue
Cost
Price per unit
# of units sold
Variable costs
Units produced
Cost per unit
Fixed costs
$1.8M (-10%)
$1.2M (0%)
$3M (-10%)
$0.2M (0%)
$1M (0%)
$1 (0%)
1M (0%)
1.5M (-10%)
$2 (0%)
The # of units sold is the main driver
of the declining profit
Note: The percentage numbers represent the variation compared to last year.
25. In the next slides, you’ll see a small preview of the objective highlighted
below.
25
1. Get your project approved by the executive committee with our ready-made business case including sections such as "Business opportunity and
suggested solution", "Project objectives, scope, and approach", "Project deliverables and business outcomes", "Strategic alignment", "Dependencies and
constraints ", "Risk assessment and mitigation", "Change impact assessment", "Project costs", "Benefits", "Net present value", and "Key success factors“.
2. Build simple or sophisticated financial models to estimate the financials of your project or new venture: revenue, cost savings, cash flow, net present
value (NPV), return on investment (ROI), internal rate of return (IRR), payback period, weighted average cost of capital(WACC), project capex, profit and loss
(P&L), economic value added (EVA), etc.
3. Build your 3 financial statements using our simple or sophisticated ready-made income statements, cash flow statements, and balance sheets.
4. Build a “3 financial statement” model that links your 3 financial statements together and includes different scenarios.
5. Analyze the 3 financial statements and a company’s performance by leveraging key financial ratios such as efficiency ratios, solvency ratios, liquidity
ratios, profitability ratios, leverage ratios, and return on investment ratios.
6. Create a robust business and financial plan including sections such as “Problem to solve and solution”, “Mission, vision, and strategic objectives”, “Target
market”, “Market analysis”, “Competitor analysis”, “Marketing plan”, “Business structure”, “Profit and loss forecast”, “Cash flow forecast”, and “Balance sheet
forecast”.
7. Identify the key drivers of your profit to easily explain your profit growth or profit decline and act accordingly.
8. Prioritize your initiatives based on impact and effort.
9. Create a monthly budget to monitor the expenses and the revenue of your team or project.
10. Value businesses based on the top 4 valuation methods: Discounted cash flow(DCF) analysis, discounted future earnings analysis, precedent transaction
analysis, and comparable company analysis.
11. Define your share investment strategy by leveraging our real-life example based on the thinking of some of the best share investors of all time such as
Warren Buffet, Charlie Munger, Ray Dalio, and Bill Ackman.
12. Create a share watchlist in 1 Excel sheet linked to the stock market to monitor investing opportunities with indicators automatically changing colors when
the price of a share becomes more attractive.
13. List all your domestic and foreign share trades with our ready-made Excel table, which will save you time and money during tax time.
14. Display the true performance of your stock portfolio with a ready-made Excel table and dashboard commonly used by hedge funds.
26. Introduction
26
A discounted cash flow (DCF) analysis is a valuation method used to estimate the attractiveness of an investment opportunity. DCF analysis
uses future free cash flow projections and discounts them to arrive at a present value estimate, which is used to evaluate the potential for
investment.
You can conduct a DCF analysis by following these 5 steps:
Estimate the total unlevered free cash flow using our excel template
1
Calculate the total net present value of the total unlevered free cash flow using our Excel template
2
Calculate the weighted cost of capital using our Excel template
3
Calculate the terminal value with both the EBIDTA and PERPETUITY methods using our Excel template
4
Calculate the DCF total valuation with both the EBIDTA and PERPETUITY methods using our Excel template
5
27. Step 1 - Estimate the total unlevered free cash flow using our Excel
template
27
2013A 2014A 2015A 2016E 2017E 2018E 2019E 2020E
Unlevered Free Cash Flow
EBIT $3,966 $4,453 $4,952 $5,449 $5,927
Depreciation & Amortization $1,000 $1,000 $1,000 $1,000 $1,000
Deferred Taxes $200 $200 $200 $200 $200
Changes in Working Capital $159 $159 $159 $159 $159
Capital Expenditures ($1,100) ($1,100) ($1,100) ($1,100) ($1,100)
Taxes ($2,560) ($2,874) ($3,196) ($3,517) ($3,826)
Total Unlevered Free Cash Flow $1,666 $1,838 $2,015 $2,191 $2,361
Discounted Cash Flow (DCF) Valuation
In US$ millions
Period ending June 30
Actuals Estimates
Adjust the actual and projected years.
Taking 3 historical years and 5 projected
years is usually a good trade-off between
being comprehensive and effective
Ideally, all these figures should be pulled from either the
income statement or the balance sheet
Adjust the line items if required, depending
on the context of the company
28. In the next slides, you’ll see a small preview of the objectives highlighted
below.
28
1. Get your project approved by the executive committee with our ready-made business case including sections such as "Business opportunity and
suggested solution", "Project objectives, scope, and approach", "Project deliverables and business outcomes", "Strategic alignment", "Dependencies and
constraints ", "Risk assessment and mitigation", "Change impact assessment", "Project costs", "Benefits", "Net present value", and "Key success factors“.
2. Build simple or sophisticated financial models to estimate the financials of your project or new venture: revenue, cost savings, cash flow, net present
value (NPV), return on investment (ROI), internal rate of return (IRR), payback period, weighted average cost of capital(WACC), project capex, profit and loss
(P&L), economic value added (EVA), etc.
3. Build your 3 financial statements using our simple or sophisticated ready-made income statements, cash flow statements, and balance sheets.
4. Build a “3 financial statement” model that links your 3 financial statements together and includes different scenarios.
5. Analyze the 3 financial statements and a company’s performance by leveraging key financial ratios such as efficiency ratios, solvency ratios, liquidity
ratios, profitability ratios, leverage ratios, and return on investment ratios.
6. Create a robust business and financial plan including sections such as “Problem to solve and solution”, “Mission, vision, and strategic objectives”, “Target
market”, “Market analysis”, “Competitor analysis”, “Marketing plan”, “Business structure”, “Profit and loss forecast”, “Cash flow forecast”, and “Balance sheet
forecast”.
7. Identify the key drivers of your profit to easily explain your profit growth or profit decline and act accordingly.
8. Prioritize your initiatives based on impact and effort.
9. Create a monthly budget to monitor the expenses and the revenue of your team or project.
10. Value businesses based on the top 4 valuation methods: Discounted cash flow(DCF) analysis, discounted future earnings analysis, precedent transaction
analysis, and comparable company analysis.
11. Define your share investment strategy by leveraging our real-life example based on the thinking of some of the best share investors of all time such as
Warren Buffet, Charlie Munger, Ray Dalio, and Bill Ackman.
12. Create a share watchlist in 1 Excel sheet linked to the stock market to monitor investing opportunities with indicators automatically changing colors when
the price of a share becomes more attractive.
13. List all your domestic and foreign share trades with our ready-made Excel table, which will save you time and money during tax time.
14. Display the true performance of your stock portfolio with a ready-made Excel table and dashboard commonly used by hedge funds.
29. 1. Define your share investment strategy by leveraging our real-life example based on the thinking of some of
the best share investors of all time such as Warren Buffet, Charlie Munger, Ray Dalio, and Bill Ackman.
29
A share investment strategy usually includes an overarching goal and a set of guiding principles that will help you improve the quality of your investment decisions
and, as a result, your returns.
See below a real-life example based on the thinking of some of the best share investors of all time such as Warren Buffet, Charlie Munger, Ray Dalio, and Bill
Ackman. Of course, you will need to use some of your own guiding principles based on the specificities of your situation, or the situation of your organization.
However, we highly recommend that you reuse many of the guiding principles presented in our example. We listed 29 guiding principles so you have a long list of
examples that you can reuse, but you don’t need to have so many; for example, a list of 12 guiding principles can do the job perfectly.
Open the Excel document “Share Investment Strategy and Portfolio_Example” for more details
30. 2. Create a share watchlist in 1 Excel sheet linked to the stock market to monitor investing opportunities with
indicators automatically changing color when the price of a share becomes more attractive.
30
To create this share watchlist, you can simply reuse the Excel sheet below and customize it based on the specificities of your situation, or the situation of your
organization.
Open the Excel document “Share Investment Strategy and Portfolio_Example” for more details
31. 2. Create a share watchlist in 1 Excel sheet linked to the stock market to monitor investing opportunities with
indicators automatically changing color when the price of a share becomes more attractive.
31
To create this share watchlist, you can simply reuse the Excel sheet below and customize it based on the specificities of your situation, or the situation of your
organization.
Open the Excel document “Share Investment Strategy and Portfolio_Example” for more details
1.List in the first column
the companies or ETF
you are considering
investing in if they reach
an attractive price.
Then, highlight the
column and click on the
"Data” tab and then on
“Stock”. This will
connect the companies
or ETF with the different
stock exchanges
2.Name each column
with an indicator that you
want to follow.
Please note that Excel
will automatically update
your table with many
details such as:
32. 2. Create a share watchlist in 1 Excel sheet linked to the stock market to monitor investing opportunities with
indicators automatically changing color when the price of a share becomes more attractive.
32
To create this share watchlist, you can simply reuse the Excel sheet below and customize it based on the specificities of your situation, or the situation of your
organization.
Open the Excel document “Share Investment Strategy and Portfolio_Example” for more details
3.Enter the relevant
formula in line 2, under
each column’s header.
For example, to get the
price of the S&P 500 on
cell C2, you simply need
to write “=A2”, then a
drop-down list will
appear with many
potential indicators.
Select the one that says
“Price”:
4.To get the formula in all the other
lines, you simply need to:
-Highlight the line from B2 till E2
-Copy it
-Highlight all the other lines
-Paste as a formula
5. Then you can create some
conditional formatting to, for
example, automatically highlight all
the prices that are down by 20% or
more compared to their “52-week
high”. To do that, you simply need
to:
-Click on Then you
-Click on “Conditional formatting”
-Select “New rule”
-Set up your new rules
You can also click on “Manage
rules” and update the current rule
that we have, which highlights in
green every price that has dropped
by 13% or more
33. 3. List all your domestic and foreign share trades with our ready-made Excel table, which will save you time and
money during tax time.
33
Open the Excel document “Share Investment Strategy and Portfolio_Example” for more details
34. 3. List all your domestic and foreign share trades with our ready-made Excel table, which will save you time and
money during tax time.
34
This column is only used if you make a trade
in a different currency than your home
currency
If you make a trade in a different currency
than your home currency, add a note to
specify which currency you used.
The purchase price is the price of the share. If your
home currency is different from USD, simply replace
USD with your home currency. The same applies for
the other columns including “USD”
For your foreign currency trades, the
purchase price will be the price of the share
multiplied by the exchange rate between your
home currency and foreign currency
35. 3. List all your domestic and foreign share trades with our ready-made Excel table, which will save you time and
money during tax time.
35
Fill in this part only when you sell your position
The total realized profit is:
Realized Capital Gain + Dividend Received - Fees
36. 4. Display the true performance of your stock portfolio with a ready-made Excel table commonly used by hedge
funds.
36
Open the Excel document “Share Investment Strategy and Portfolio_Example” for more details
37. 4. Display the true performance of your stock portfolio with a ready-made Excel table commonly used by hedge
funds.
37
List in the first column all the companies or ETF which are part of your portfolio.
Then, highlight the column and click on the “Data” tab and then on “Stock”. This will
connect the companies or ETF with the different stock exchanges
Add the total
number of
shares you
currently have
Add the total cost
If your home currency is
different than USD, replace
“USD” with your own
currency
This column will
automatically update once
you inputted your number
of shares and cost
Replace this text with your
personal name or your
company name
Add your dividend and fees
based on the data inputted in
the previous Excel sheet
All the other columns will
automatically update
38. 4. Display the true performance of your stock portfolio with a ready-made Excel table and dashboard commonly
used by hedge funds.
38
This number has already been
calculated in a previous sheet
The unrealized profit is the unrealized
capital gain.
39. 4. Display the true performance of your stock portfolio with a ready-made Excel table and dashboard commonly
used by hedge funds.
39
All the charts will automatically update based on the tables previously created
40. Structure of the Toolkit
The Finance and Investment Toolkit includes 400 PowerPoint slides and 75 Excel sheets categorized into 9
folders that you can download on your device immediately after your purchase.
40
400 editable PowerPoint slides* 75 editable Excel sheets*
+
*Please note that the number of PowerPoint slides and Excel sheets listed is the number of unique slides and sheets. For example, a PowerPoint slide
that has been duplicated to facilitate our clients’ understanding only counts for 1 slide.
1
Overview and
Approach
2
Business Case
and Financial
Model
3
Financial Statement
Analysis
4
Business and
Financial Plan
5
Profitability
Problem
7
Monthly
Budget
6
Initiative Prioritization
Matrix
8
Business
Valuation
9
Share
Investment
41. Interested in more than 1 Toolkit? You can access all our Toolkits for half the
price with the Gold Business & Consulting Package
www.slidebooks.com
Gold Business & Consulting Package
Learn More
41
42. Key Benefits of our Business & Consulting Toolkits
42
Improve the growth & efficiency of
your organization by leveraging
Business & Consulting Toolkits
created by ex-McKinsey, Deloitte &
BCG Consultants.
It cost us $1.7M to create all our
Business & Consulting Toolkits. Get
them for a fraction of this cost.
It’s like hiring Management
Consultants to create all the
practical Frameworks, Tools &
Templates required to gain a
competitive advantage.
Get the job done quicker and never
start from scratch again with our
ready-made and fully editable
Frameworks, Tools & Templates in
Powerpoint & Excel.
We have worked 20,000+ hours
over the past 5 years to create the
world’s best Business & Consulting
Toolkits. Don’t reinvent the wheel.
Download them now.
Improve your skills & capabilities
and meet your professional goals by
learning how the Fortune 100 and
Global Consulting Firms do it.
Get free support and advice from
our ex-McKinsey, Deloitte & BCG
Management Consultants.
Hiring top-tier Consultants for a
management consulting project
would cost you $300k+. That’s a lot
more expensive than purchasing our
Toolkits.
Impress your stakeholders and
become your organization’s subject
matter expert with world-class
approaches to resolve common
business problems.
43. What our clients say about our Toolkits
Reviews imported from Facebooks, Amazon and Klaviyo
43
See more reviews >
44. 44
Trusted by small and large organizations Customer satisfaction
Number of countries leveraging our Business & Consulting Toolkits
160+
Number of professionals already
leveraging our Business &
Consulting Toolkits
200,000+
4.8
Daily rate of our ex-McKinsey,
Deloitte and BCG Management
Consultants
$3k-$4k
Join the 200,000+ Executives, Consultants & Entrepreneurs already leveraging our
Business & Consulting Toolkits to improve the performance of their organization and
boost their own career.
45. Need more help?
Hire one of our Management Consultants for $3,000 a day
See more Management Consultants
46. This was just a small preview.
www.slidebooks.com
46