Download to read offline
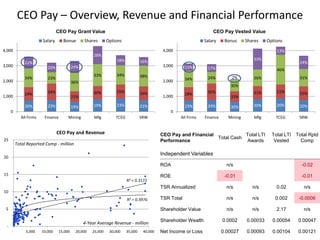
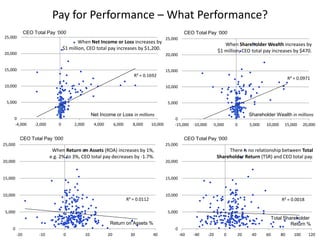

This document analyzes the relationship between CEO pay and company financial performance and shareholder returns. It finds: - CEO pay is most strongly correlated with net income, with CEO pay increasing by $1,200 for every $1 million increase in net income. - CEO pay also increases by $470 for every $1 million increase in shareholder wealth. - Higher return on assets (ROA) is weakly correlated with lower CEO pay, with pay decreasing by $1.7 for every 1% increase in ROA. - Total shareholder return (TSR) shows no clear correlation with CEO pay levels.


