Download as PDF, PPTX
![The well-known Helpful tools Devil in the details Examples
strace and ltrace
# strace -f -p <pid1> [-p <pid2>]
[pid 18178] getpeername(6, <unfinished ...>
[pid 18178] <... getpeername resumed> {sa_family=AF_INET, sin_port=htons(48881),
sin_addr=inet_addr("127.0.0.1")}, [16]) = 0
[pid 18178] alarm(7) = 0
[pid 18178] read(6, "ZBXD1", 5) = 5
[pid 18178] read(6, "v0000000", 8) = 8
[pid 18178] read(6, "agent.pingn", 2047) = 11
# ltrace -f -p <pid1> [-p <pid2>]
getpeername(6, 0x7ffca5381ce0, 0x7ffca5381ca4, 0x7ffca5385fdf) = 0
strchr("127.0.0.1", ’,’) = nil
getaddrinfo("127.0.0.1", nil, 0x7ffca5381cb0, 0x7ffca5381ca8) = 0
freeaddrinfo(0xa1b0a0) = <void>
alarm(7) = 0
read(6, "ZBXD001", 5) = 5
read(6, "v", 8) = 8
read(6, "agent.pingn", 2047) = 11
alarm(0) = 7
strlen("agent.pingn") = 11](https://image.slidesharecdn.com/volkerfroehlich-150916072917-lva1-app6891/75/Volker-Frohlich-How-to-Debug-Common-Agent-Issues-12-2048.jpg)
![The well-known Helpful tools Devil in the details Examples
tcpdump
# tcpdump -i lo -nn port 10050
00:20:34.065579 IP 127.0.0.1.49134 > 127.0.0.1.10050: Flags [S], seq 640796155
00:20:34.065599 IP 127.0.0.1.10050 > 127.0.0.1.49134: Flags [S.], seq 2538515492
00:20:34.065612 IP 127.0.0.1.49134 > 127.0.0.1.10050: Flags [.], ack 1
00:20:34.065636 IP 127.0.0.1.49134 > 127.0.0.1.10050: Flags [P.], seq 1:6
00:20:34.065644 IP 127.0.0.1.10050 > 127.0.0.1.49134: Flags [.], ack 6
00:20:34.065670 IP 127.0.0.1.10050 > 127.0.0.1.49134: Flags [.], ack 14
00:20:34.065687 IP 127.0.0.1.49134 > 127.0.0.1.10050: Flags [P.], seq 14:25, ack 1
...](https://image.slidesharecdn.com/volkerfroehlich-150916072917-lva1-app6891/75/Volker-Frohlich-How-to-Debug-Common-Agent-Issues-13-2048.jpg)
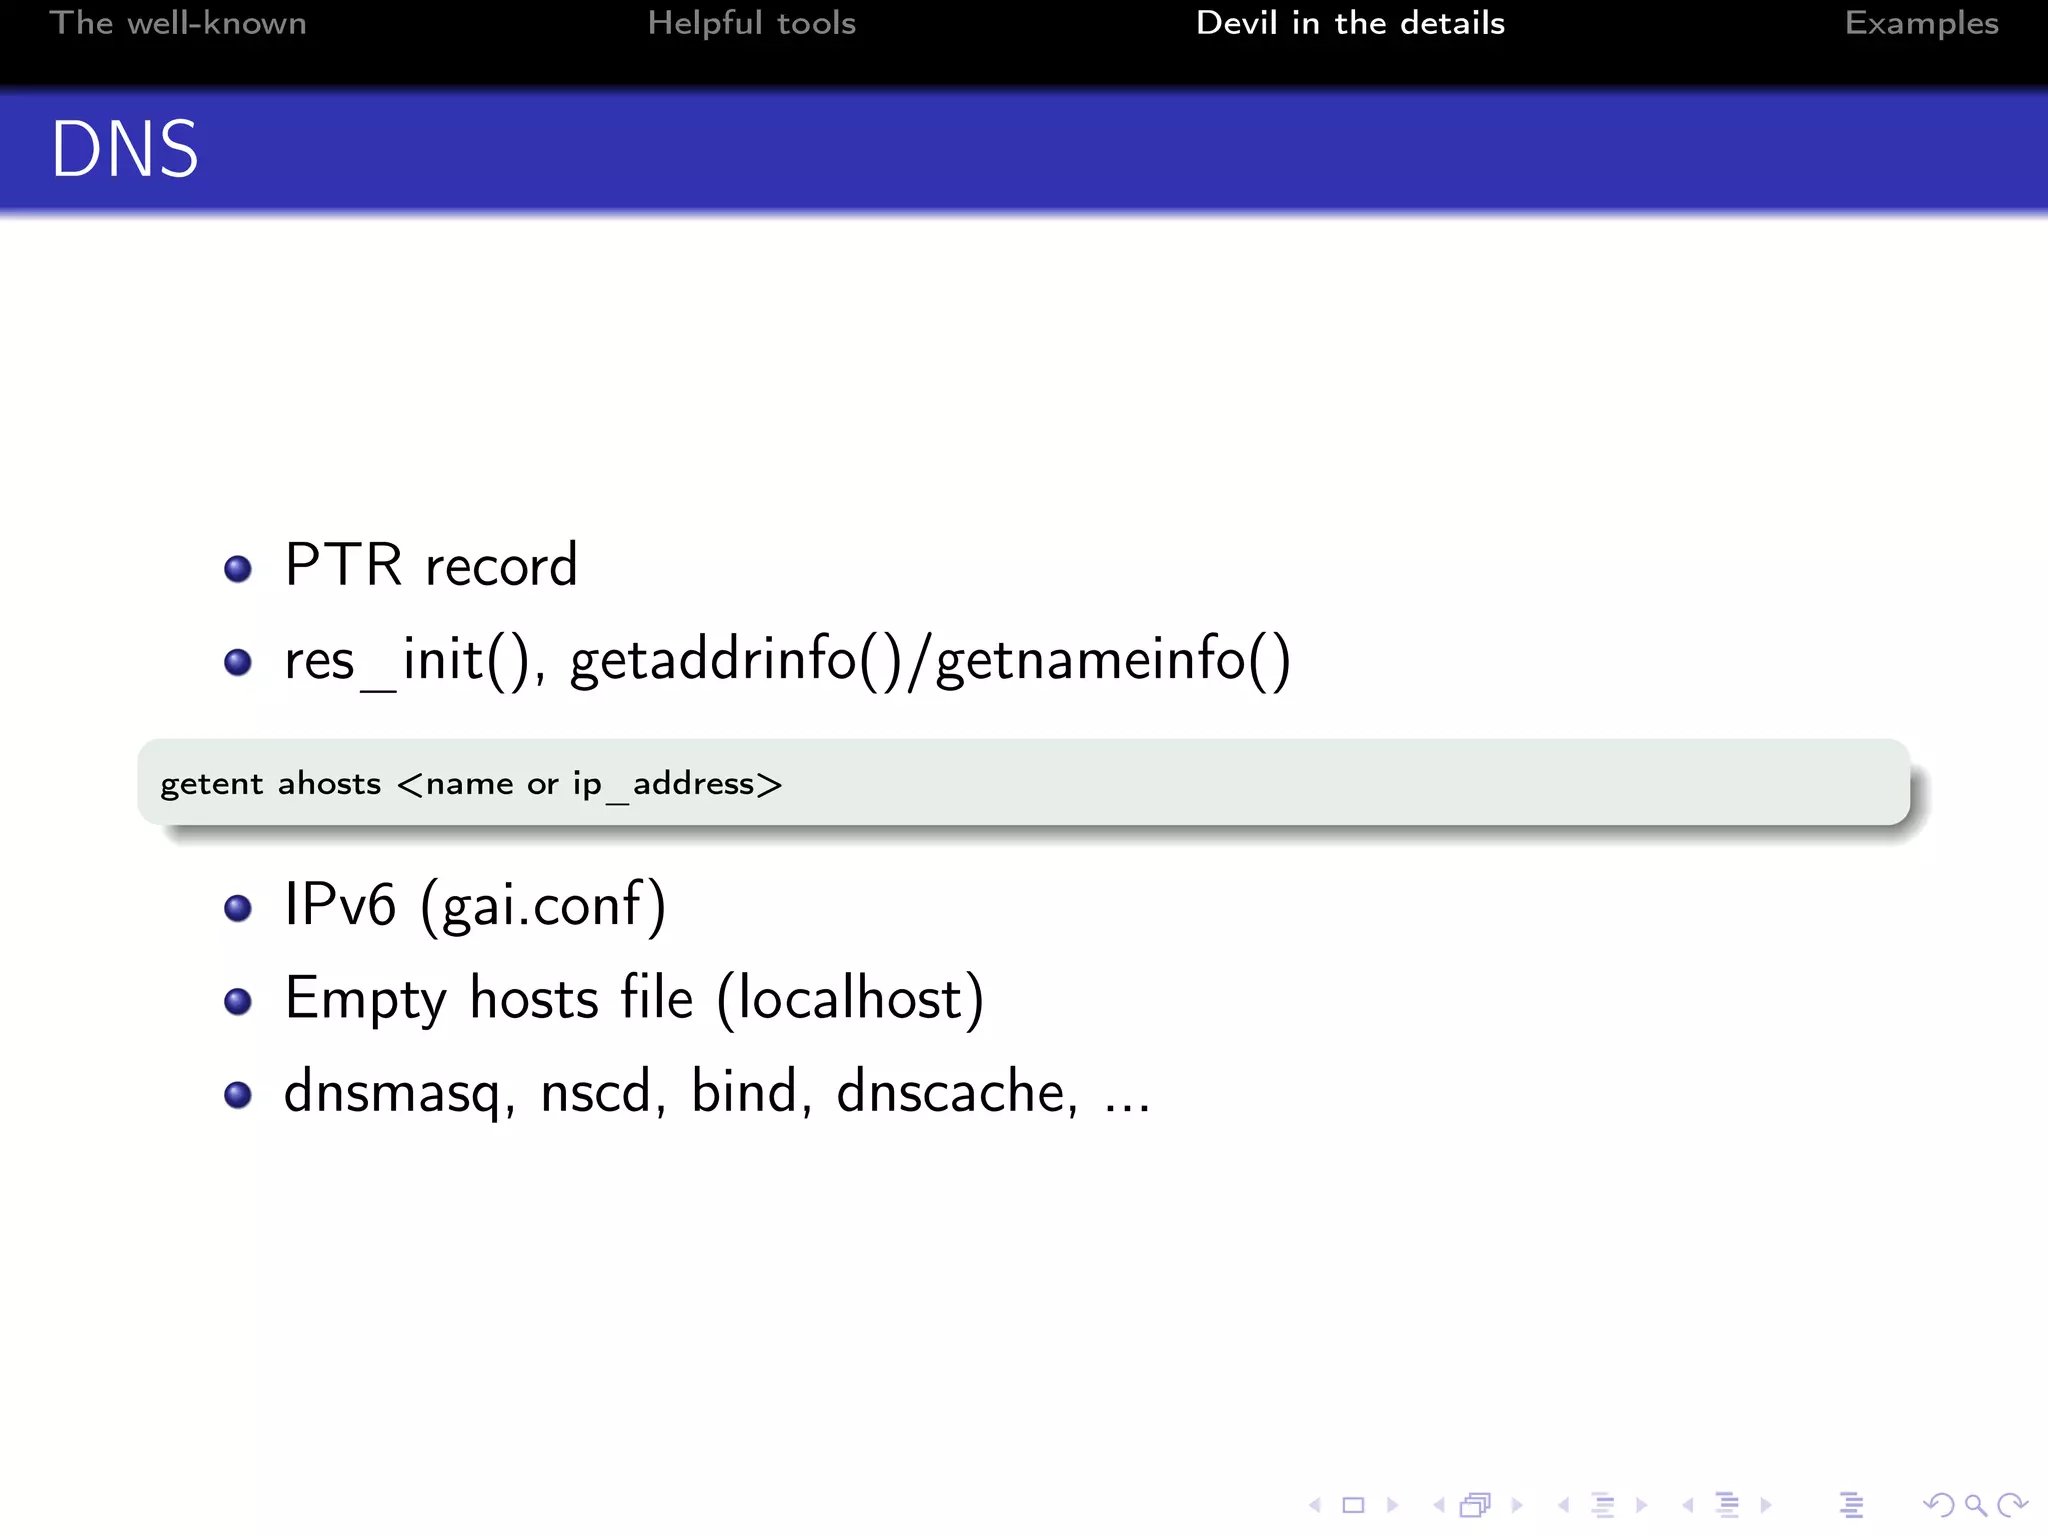
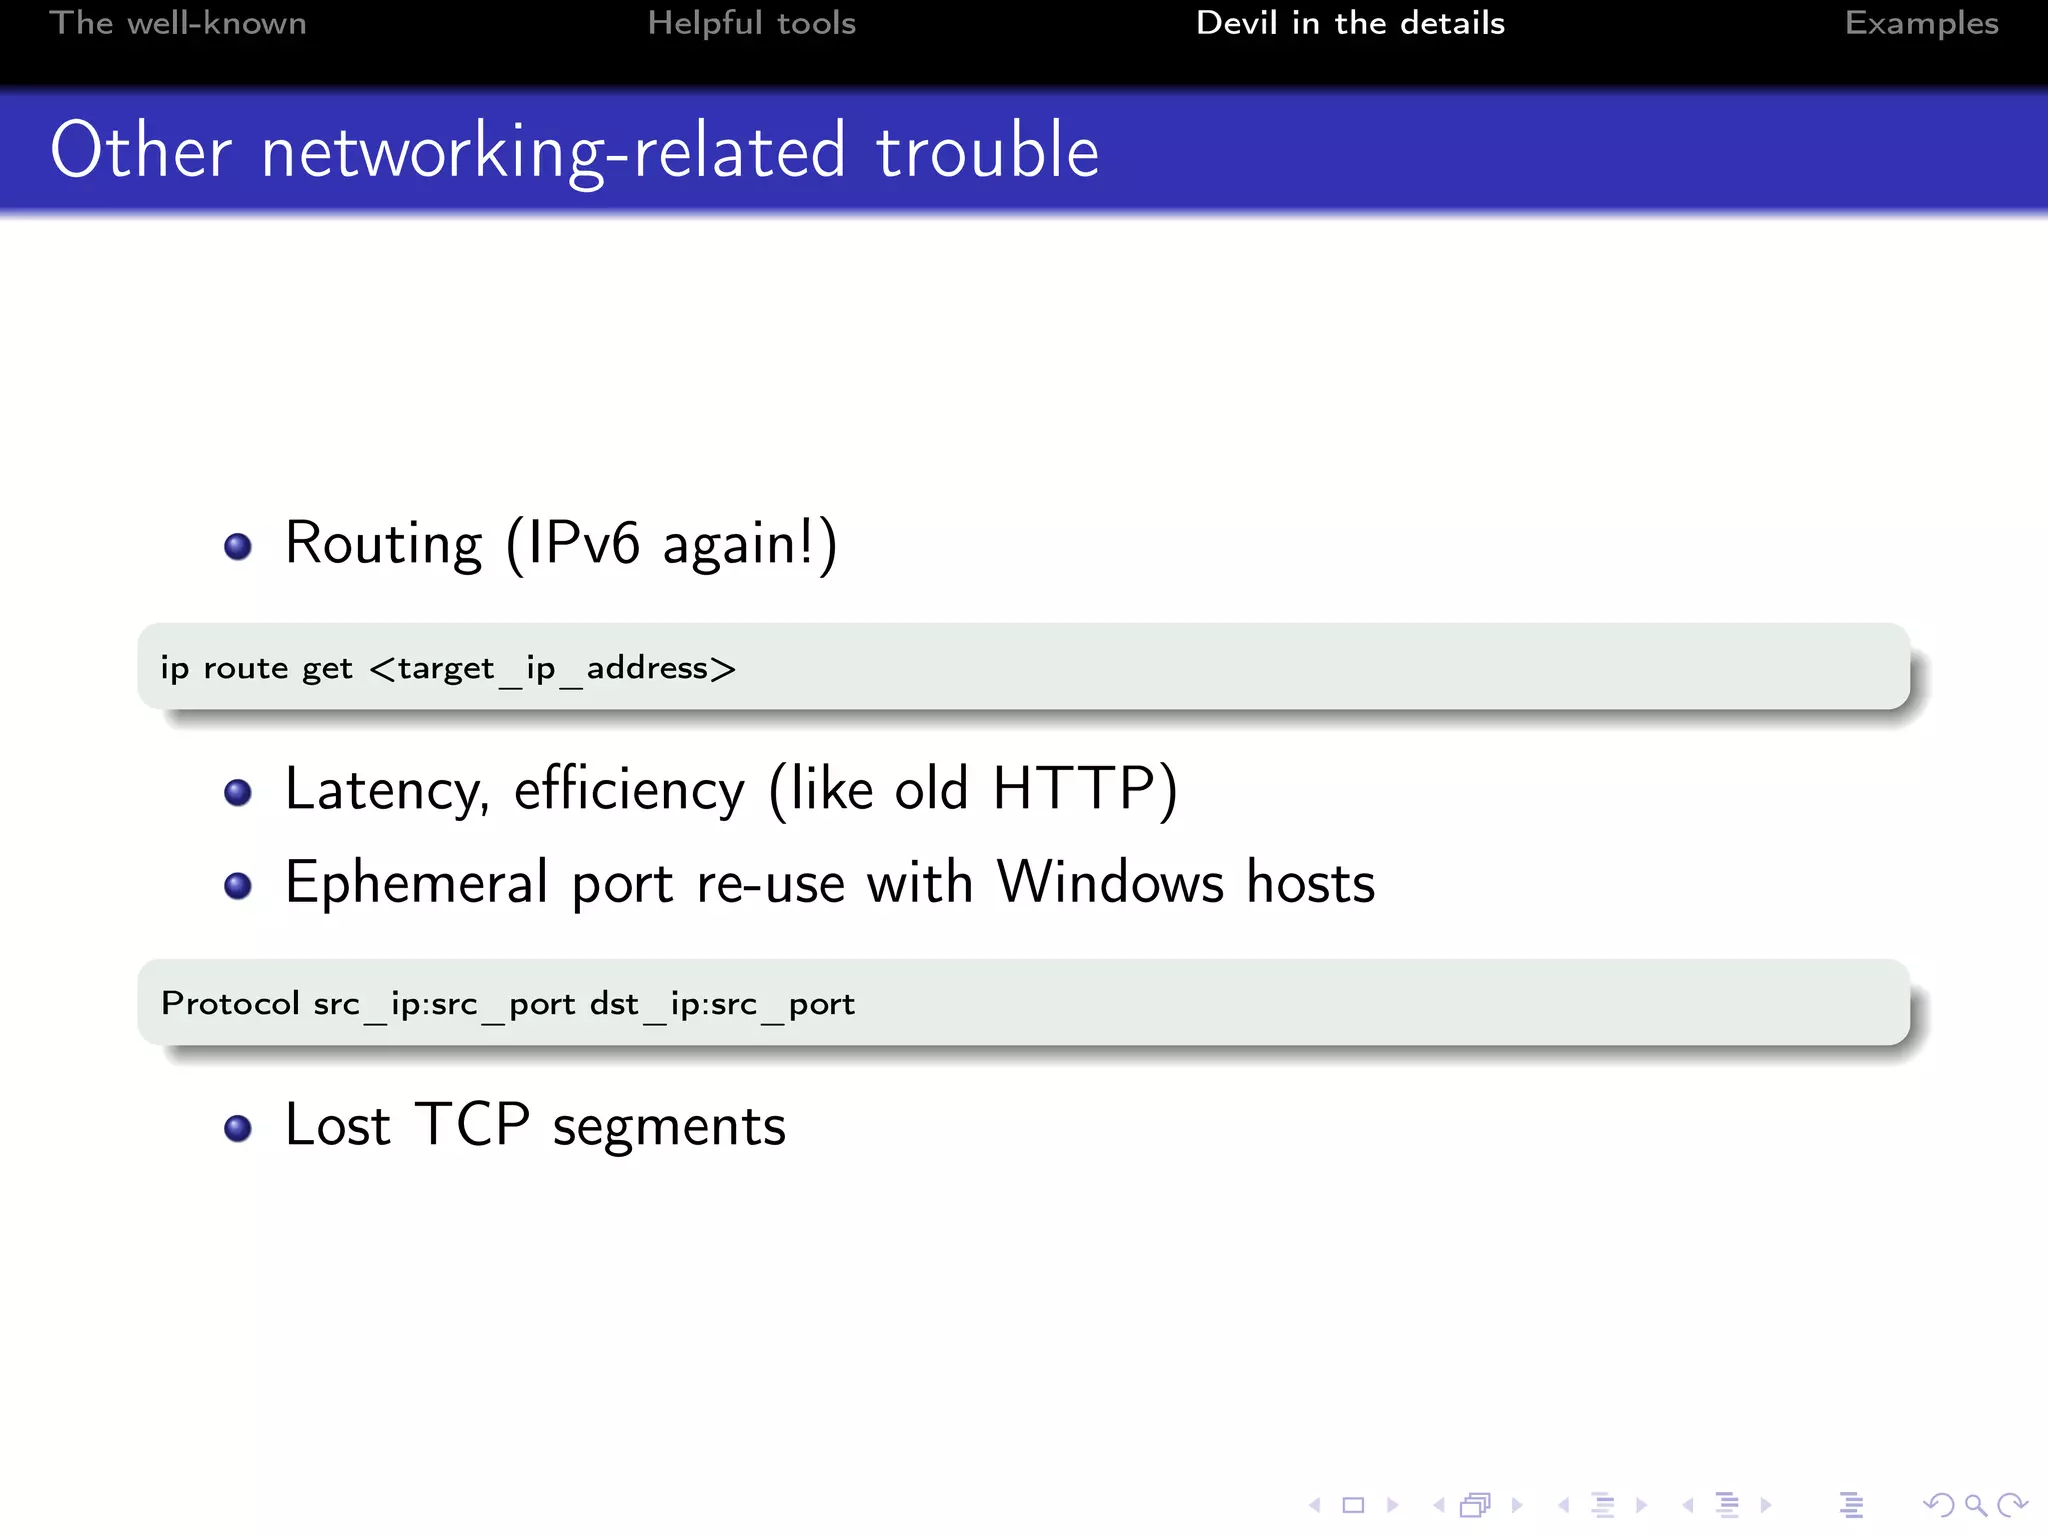
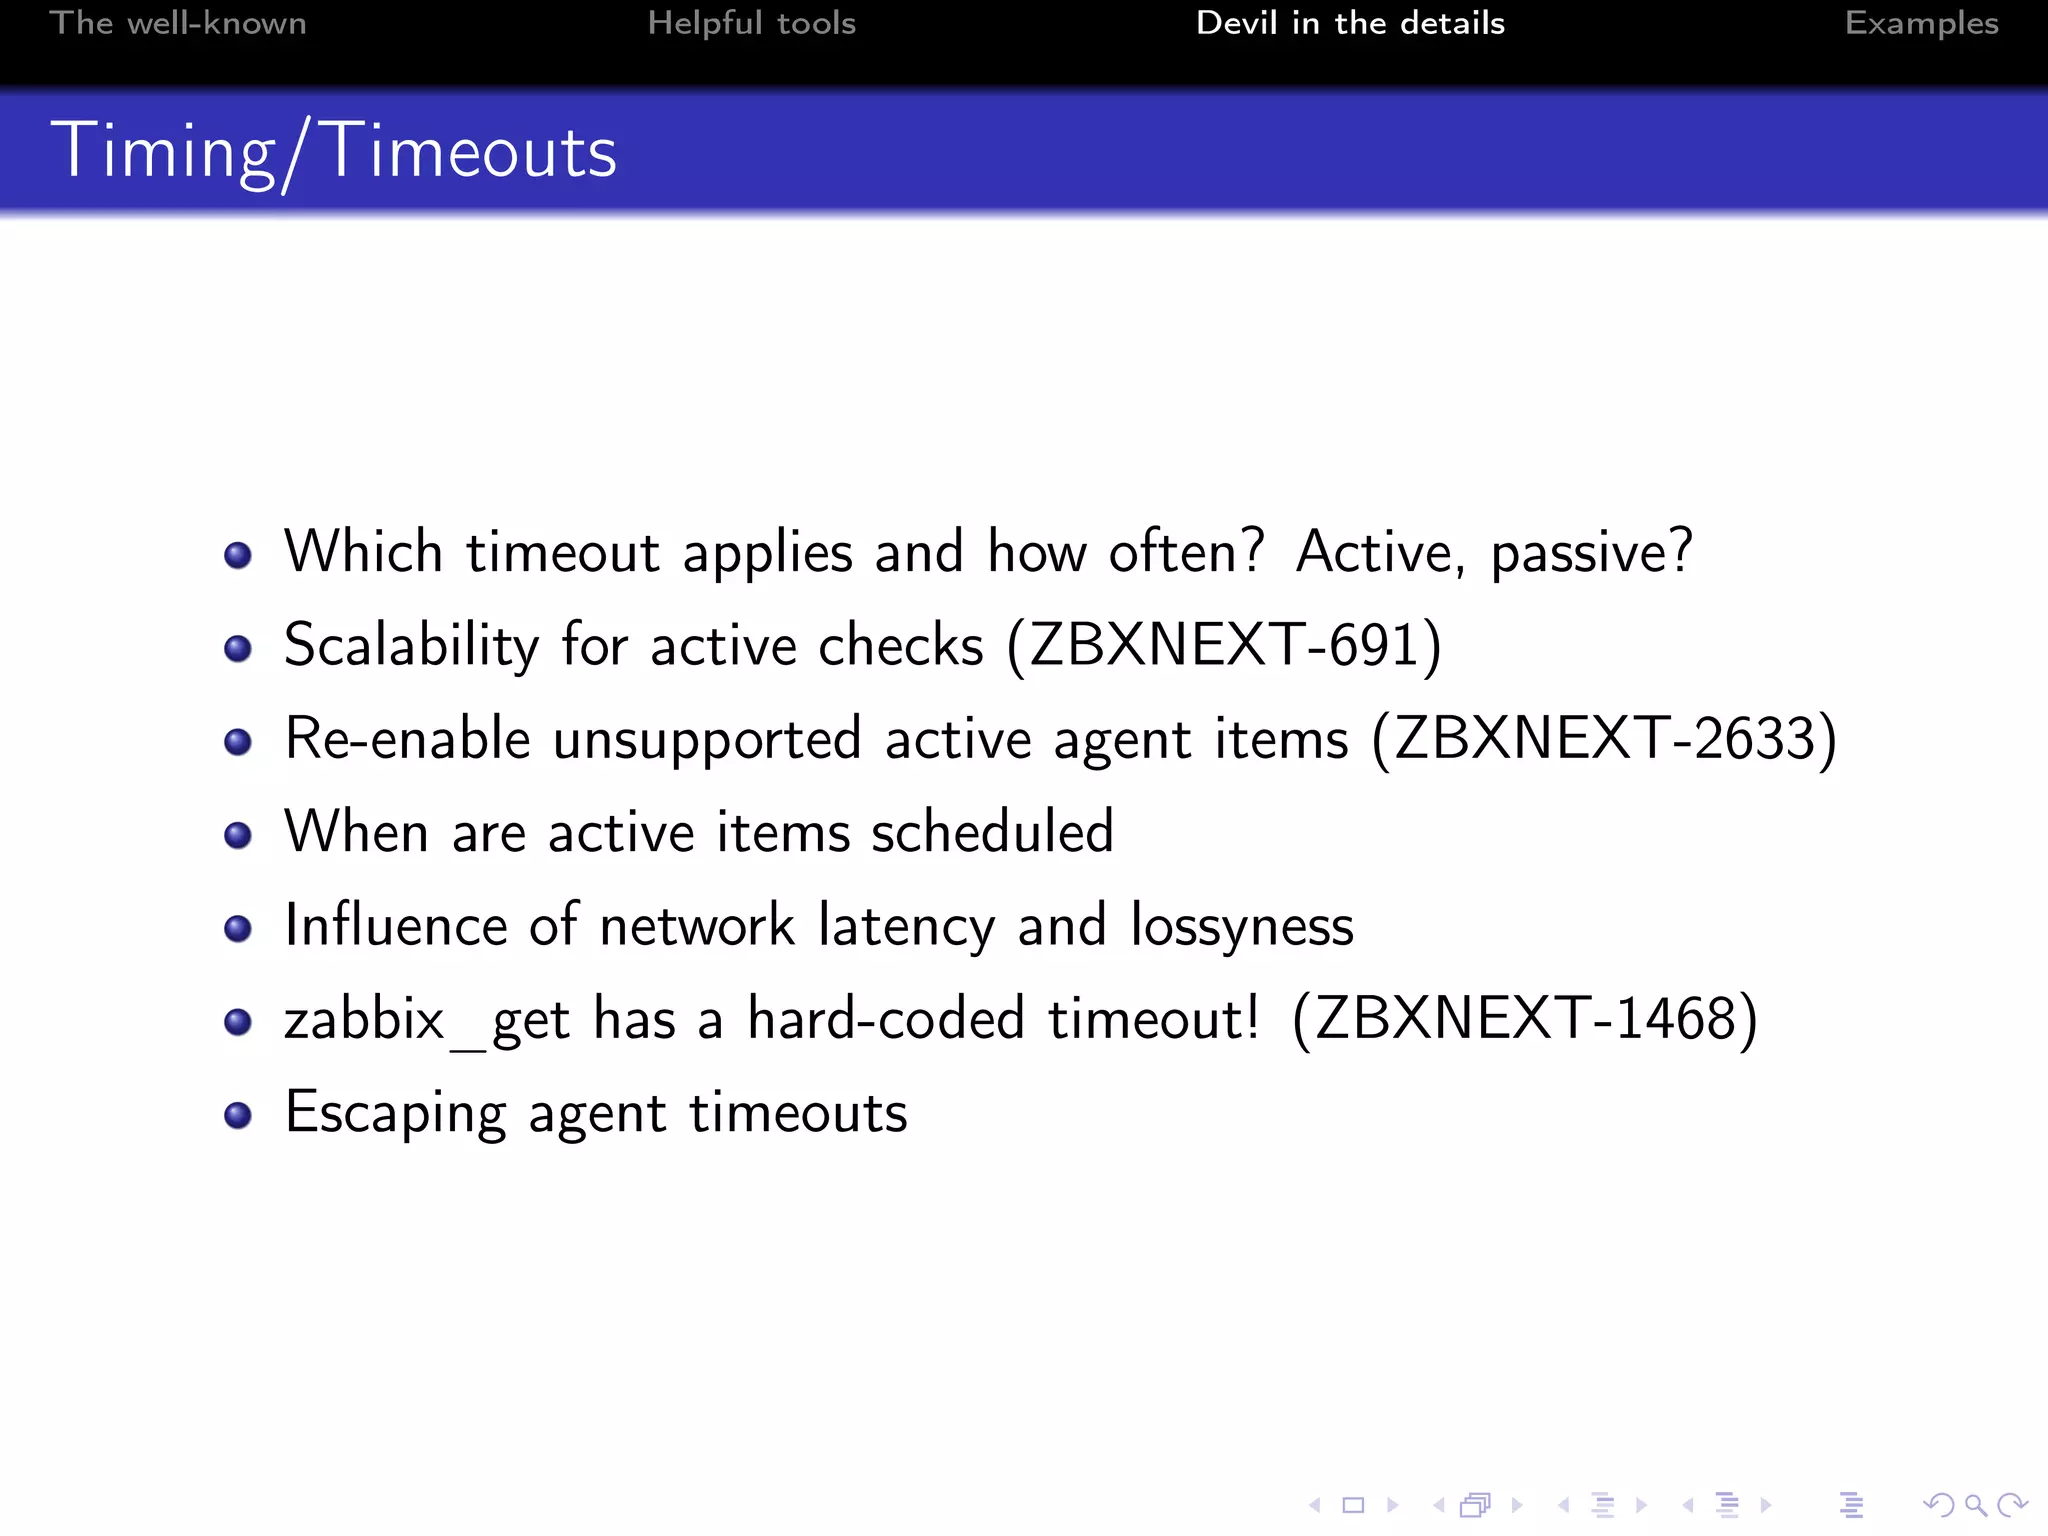
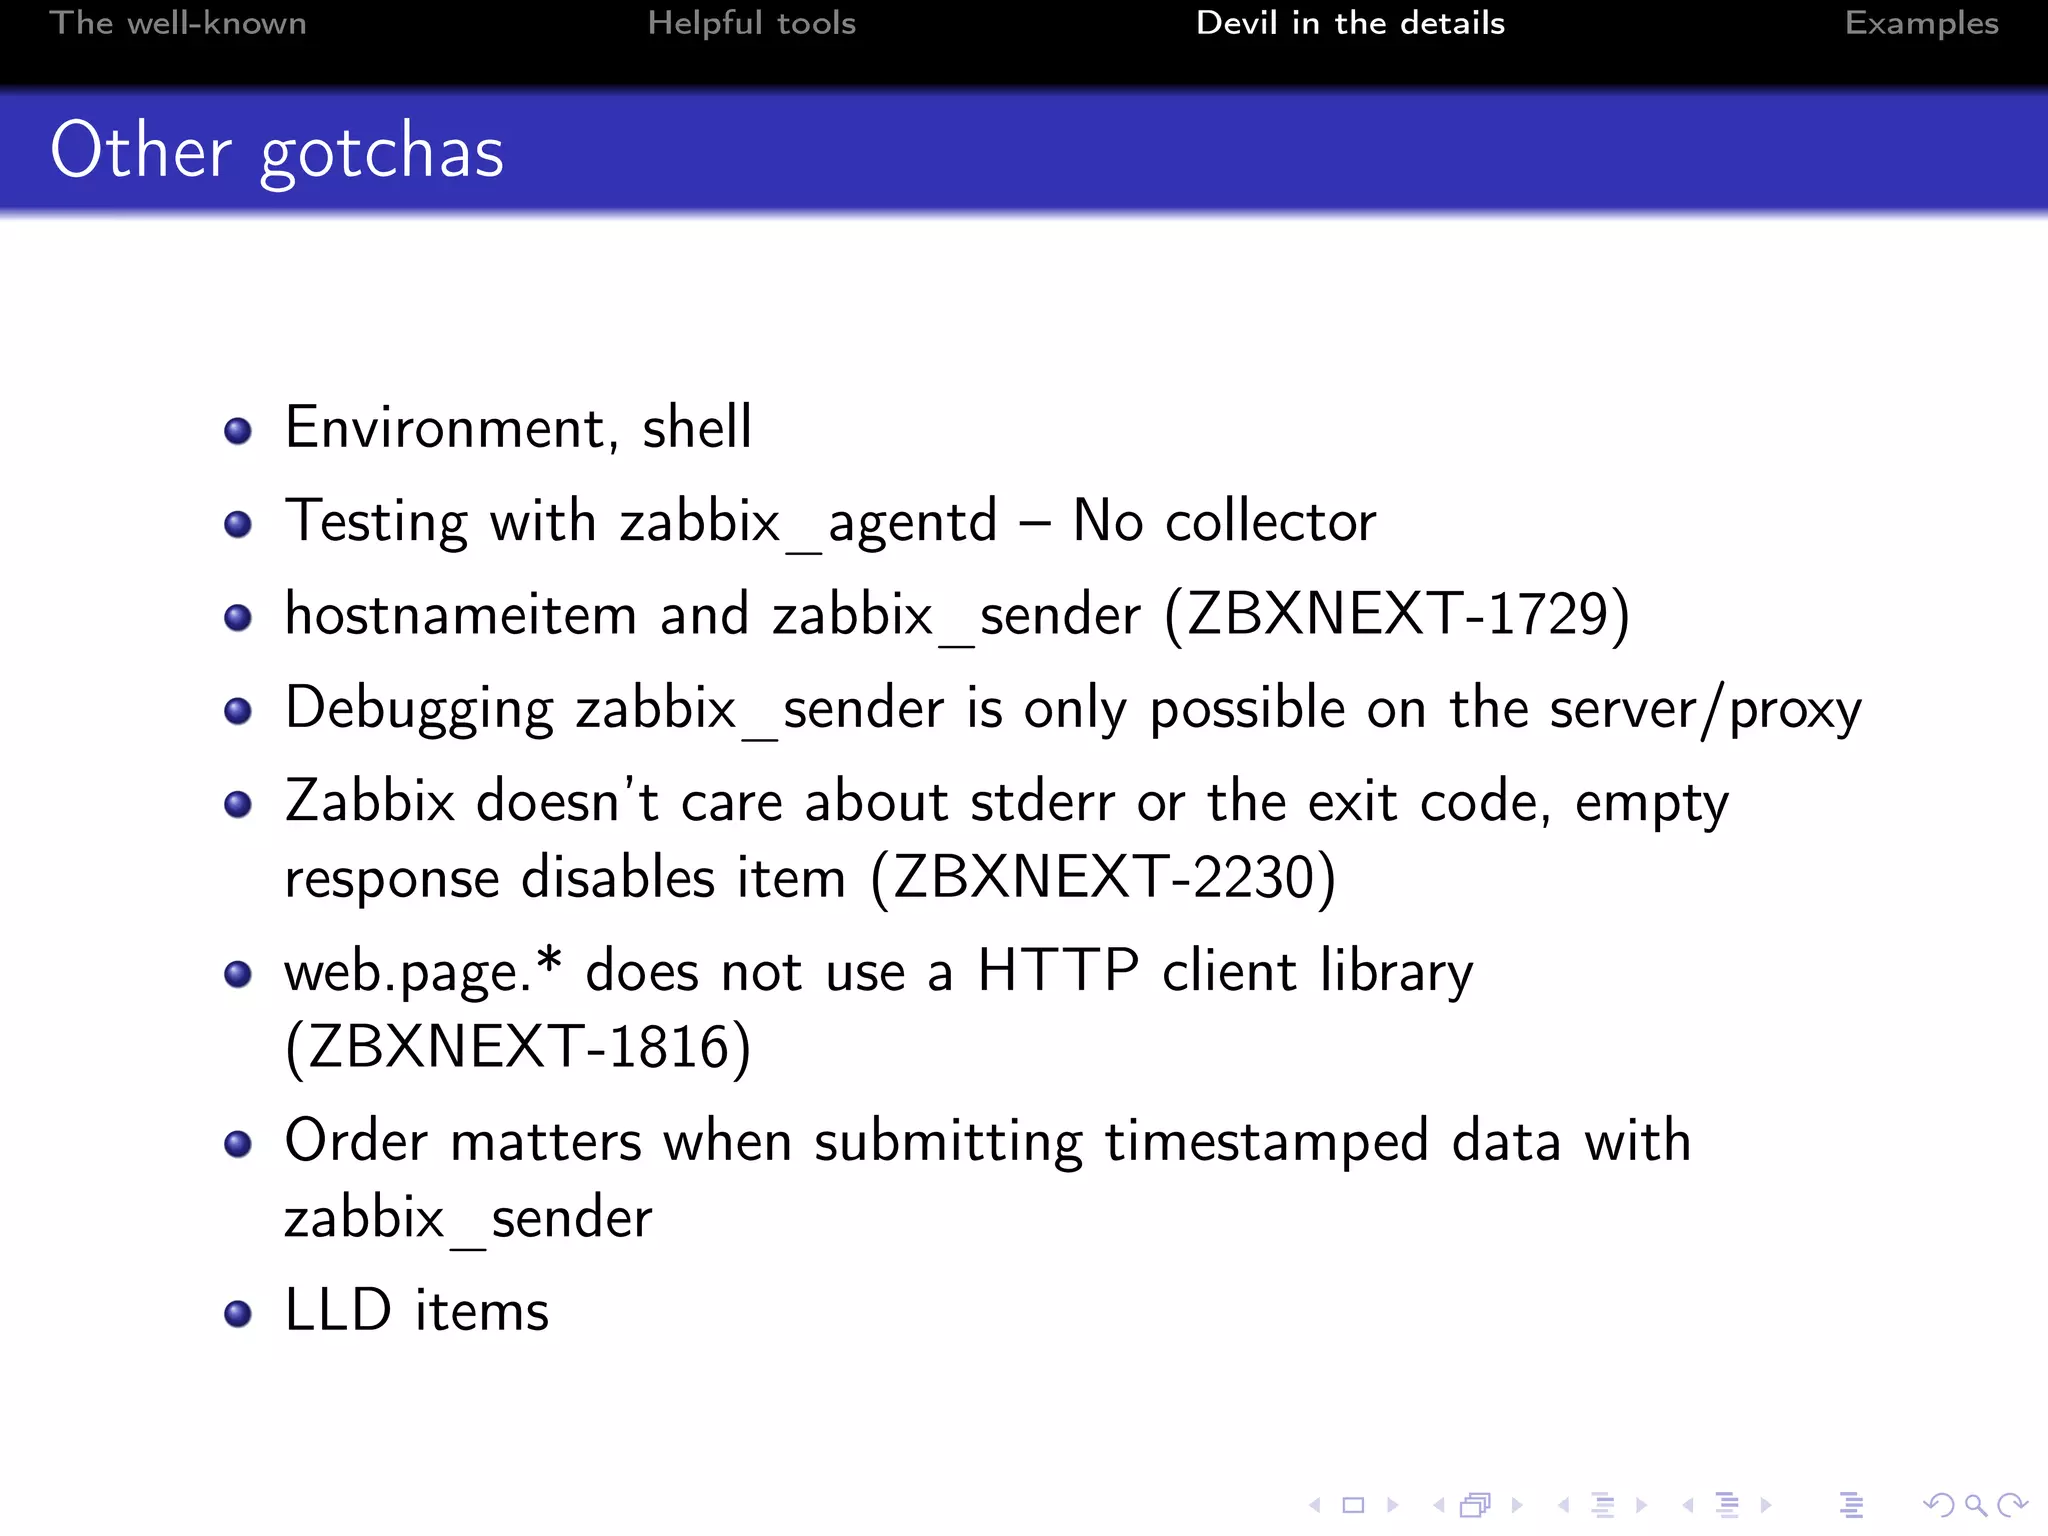
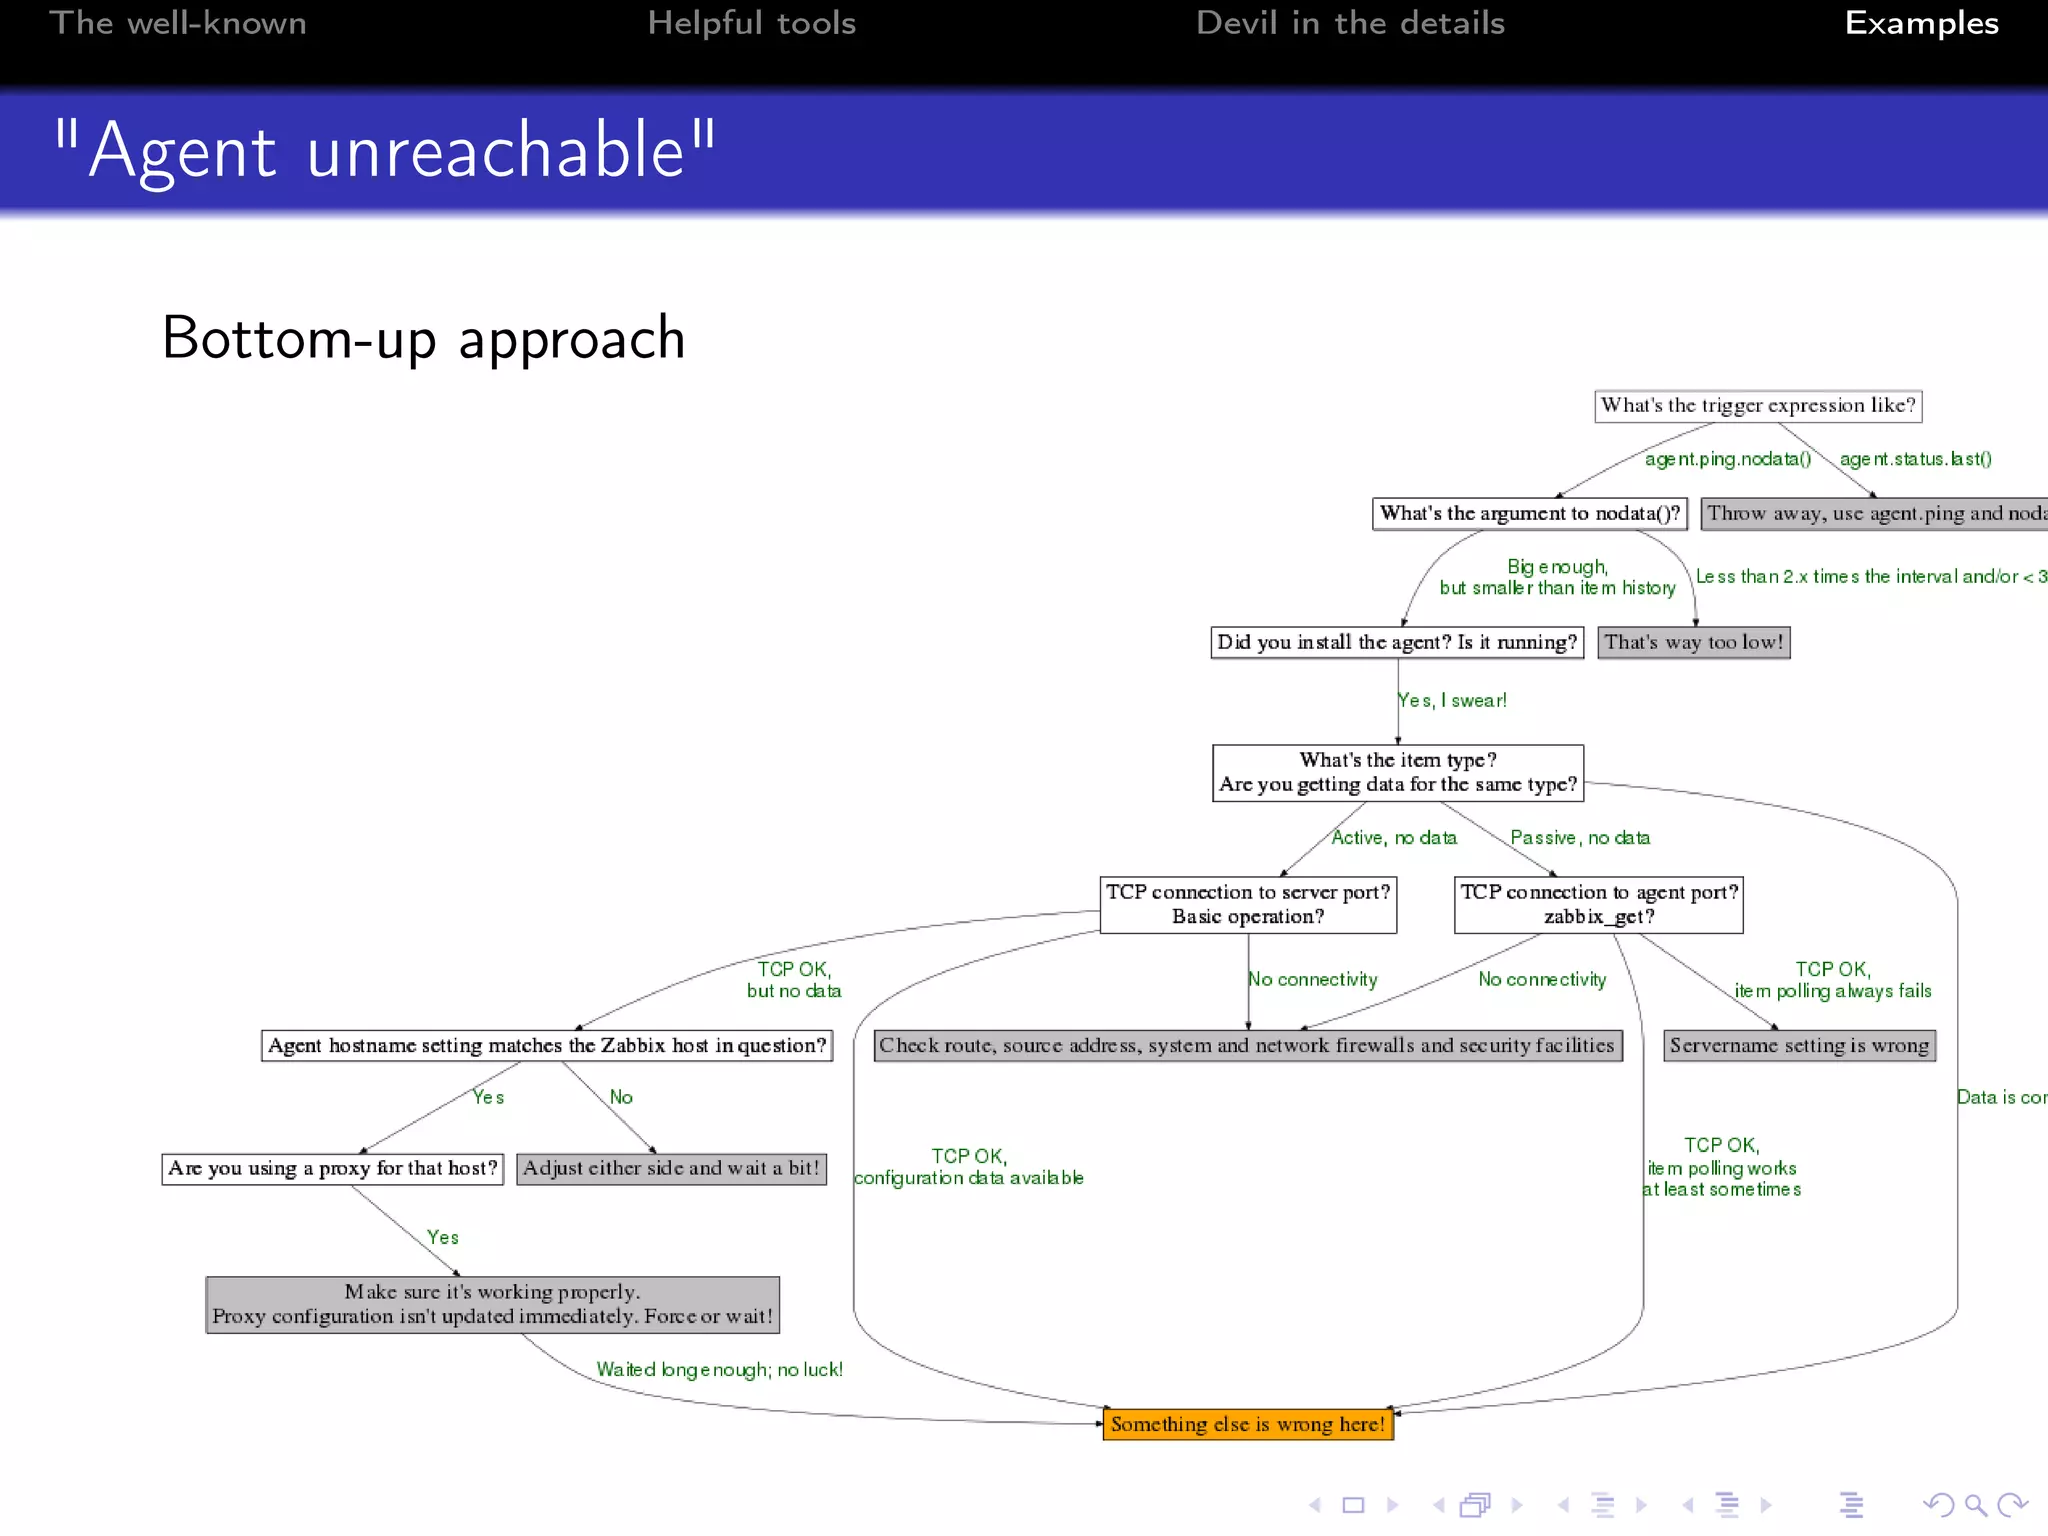
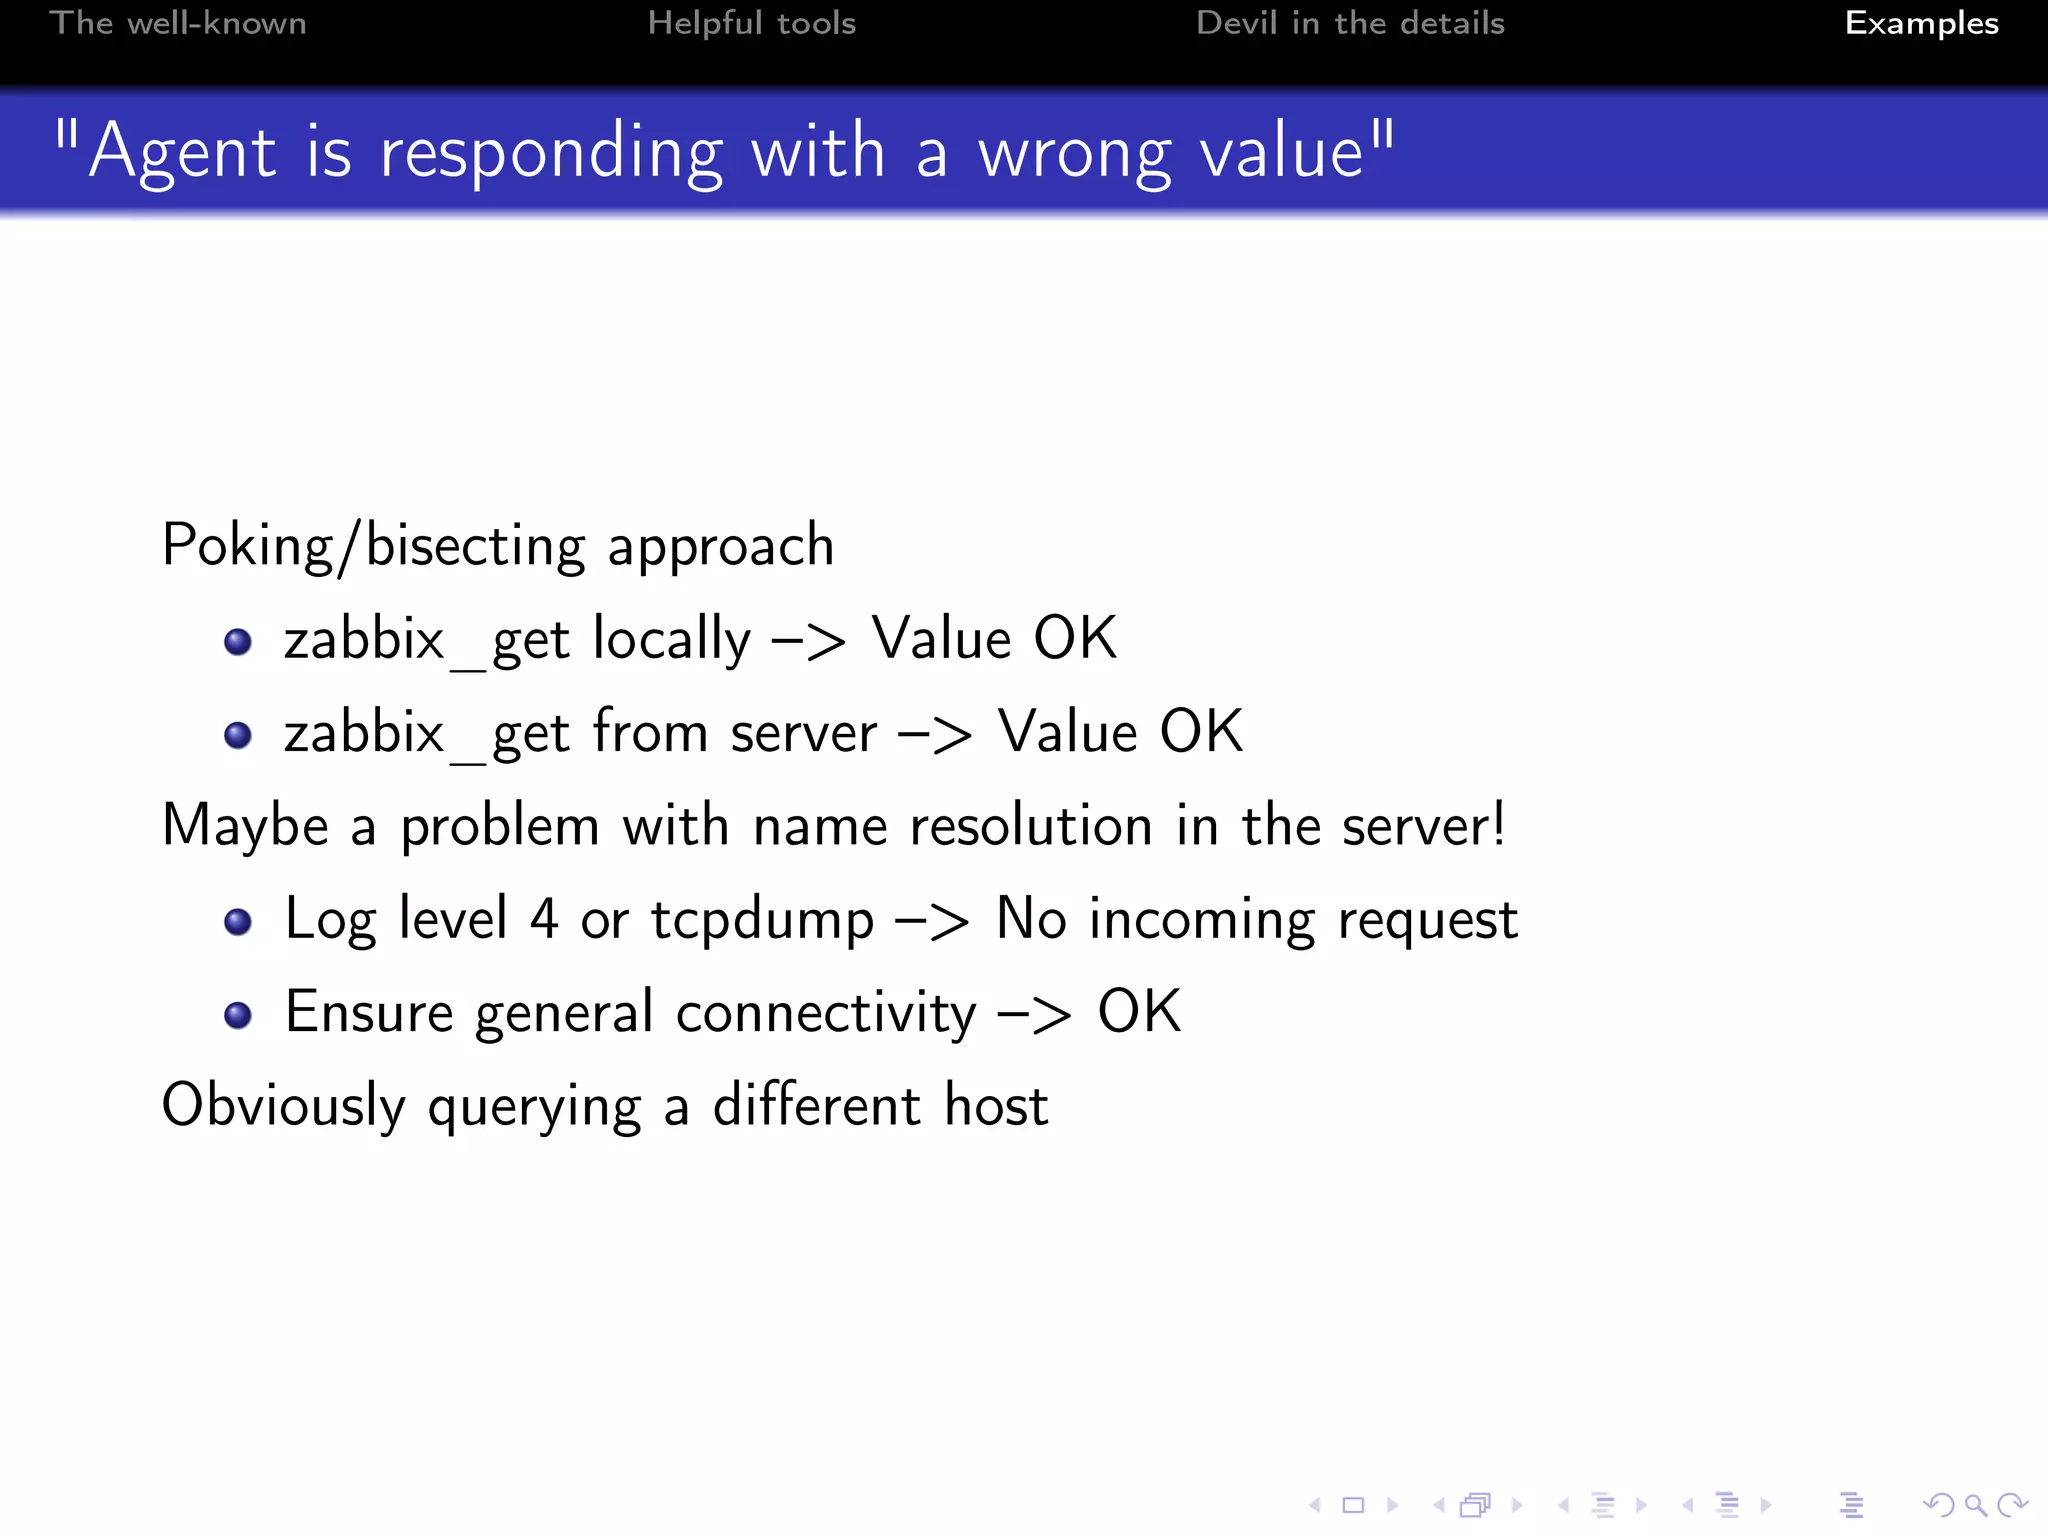
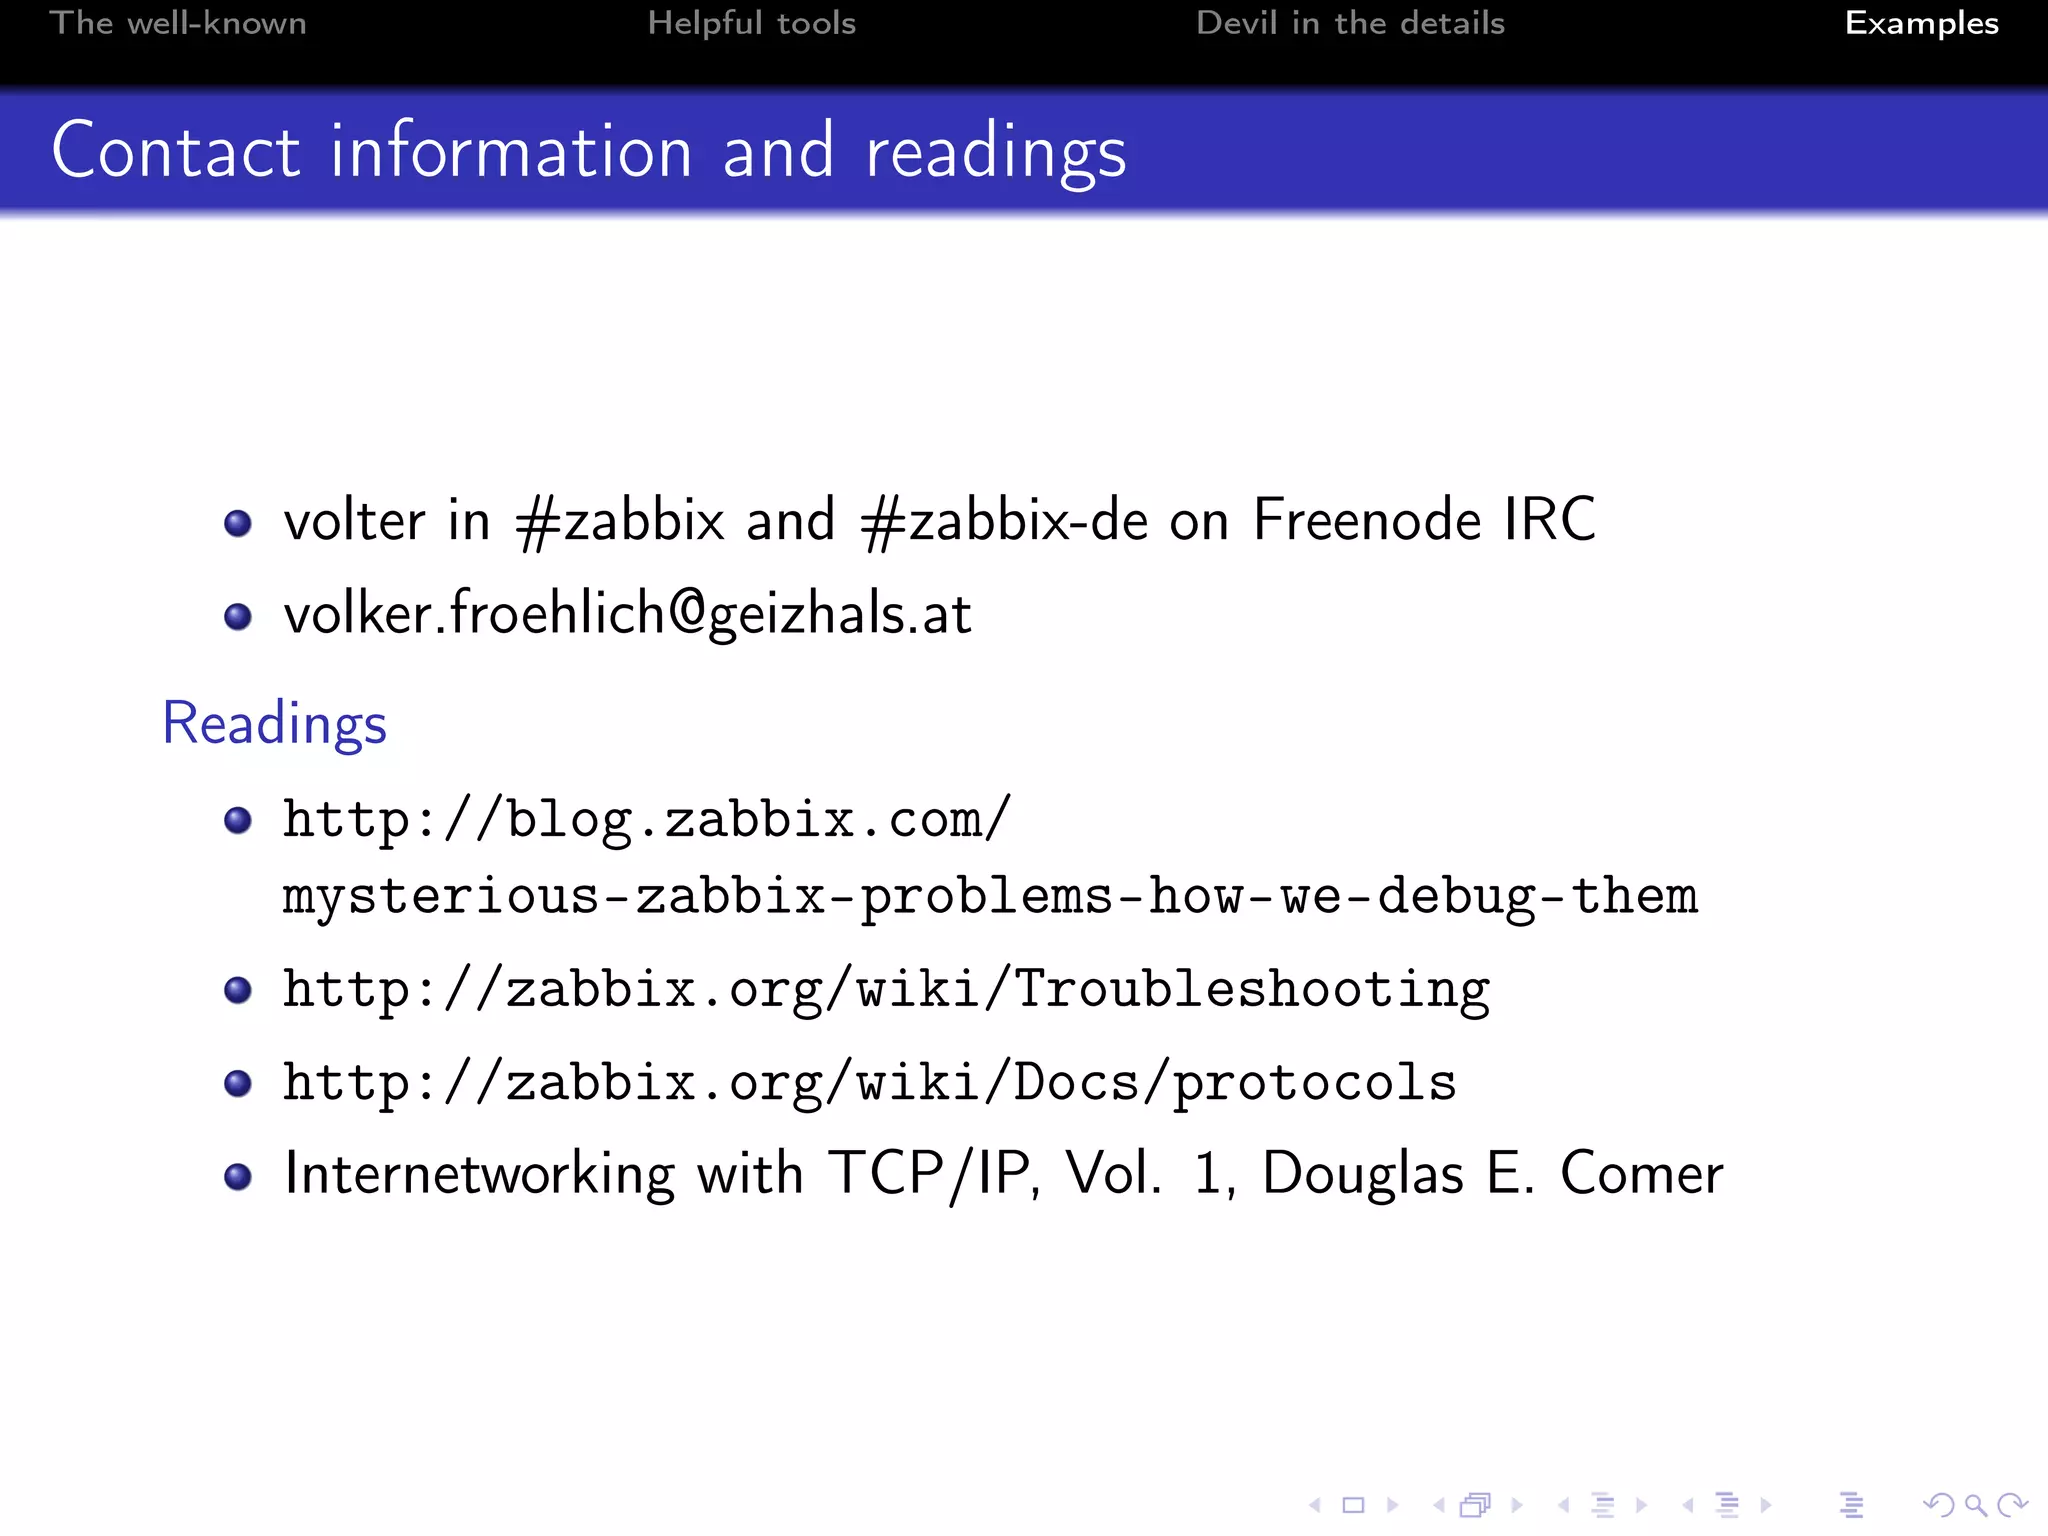

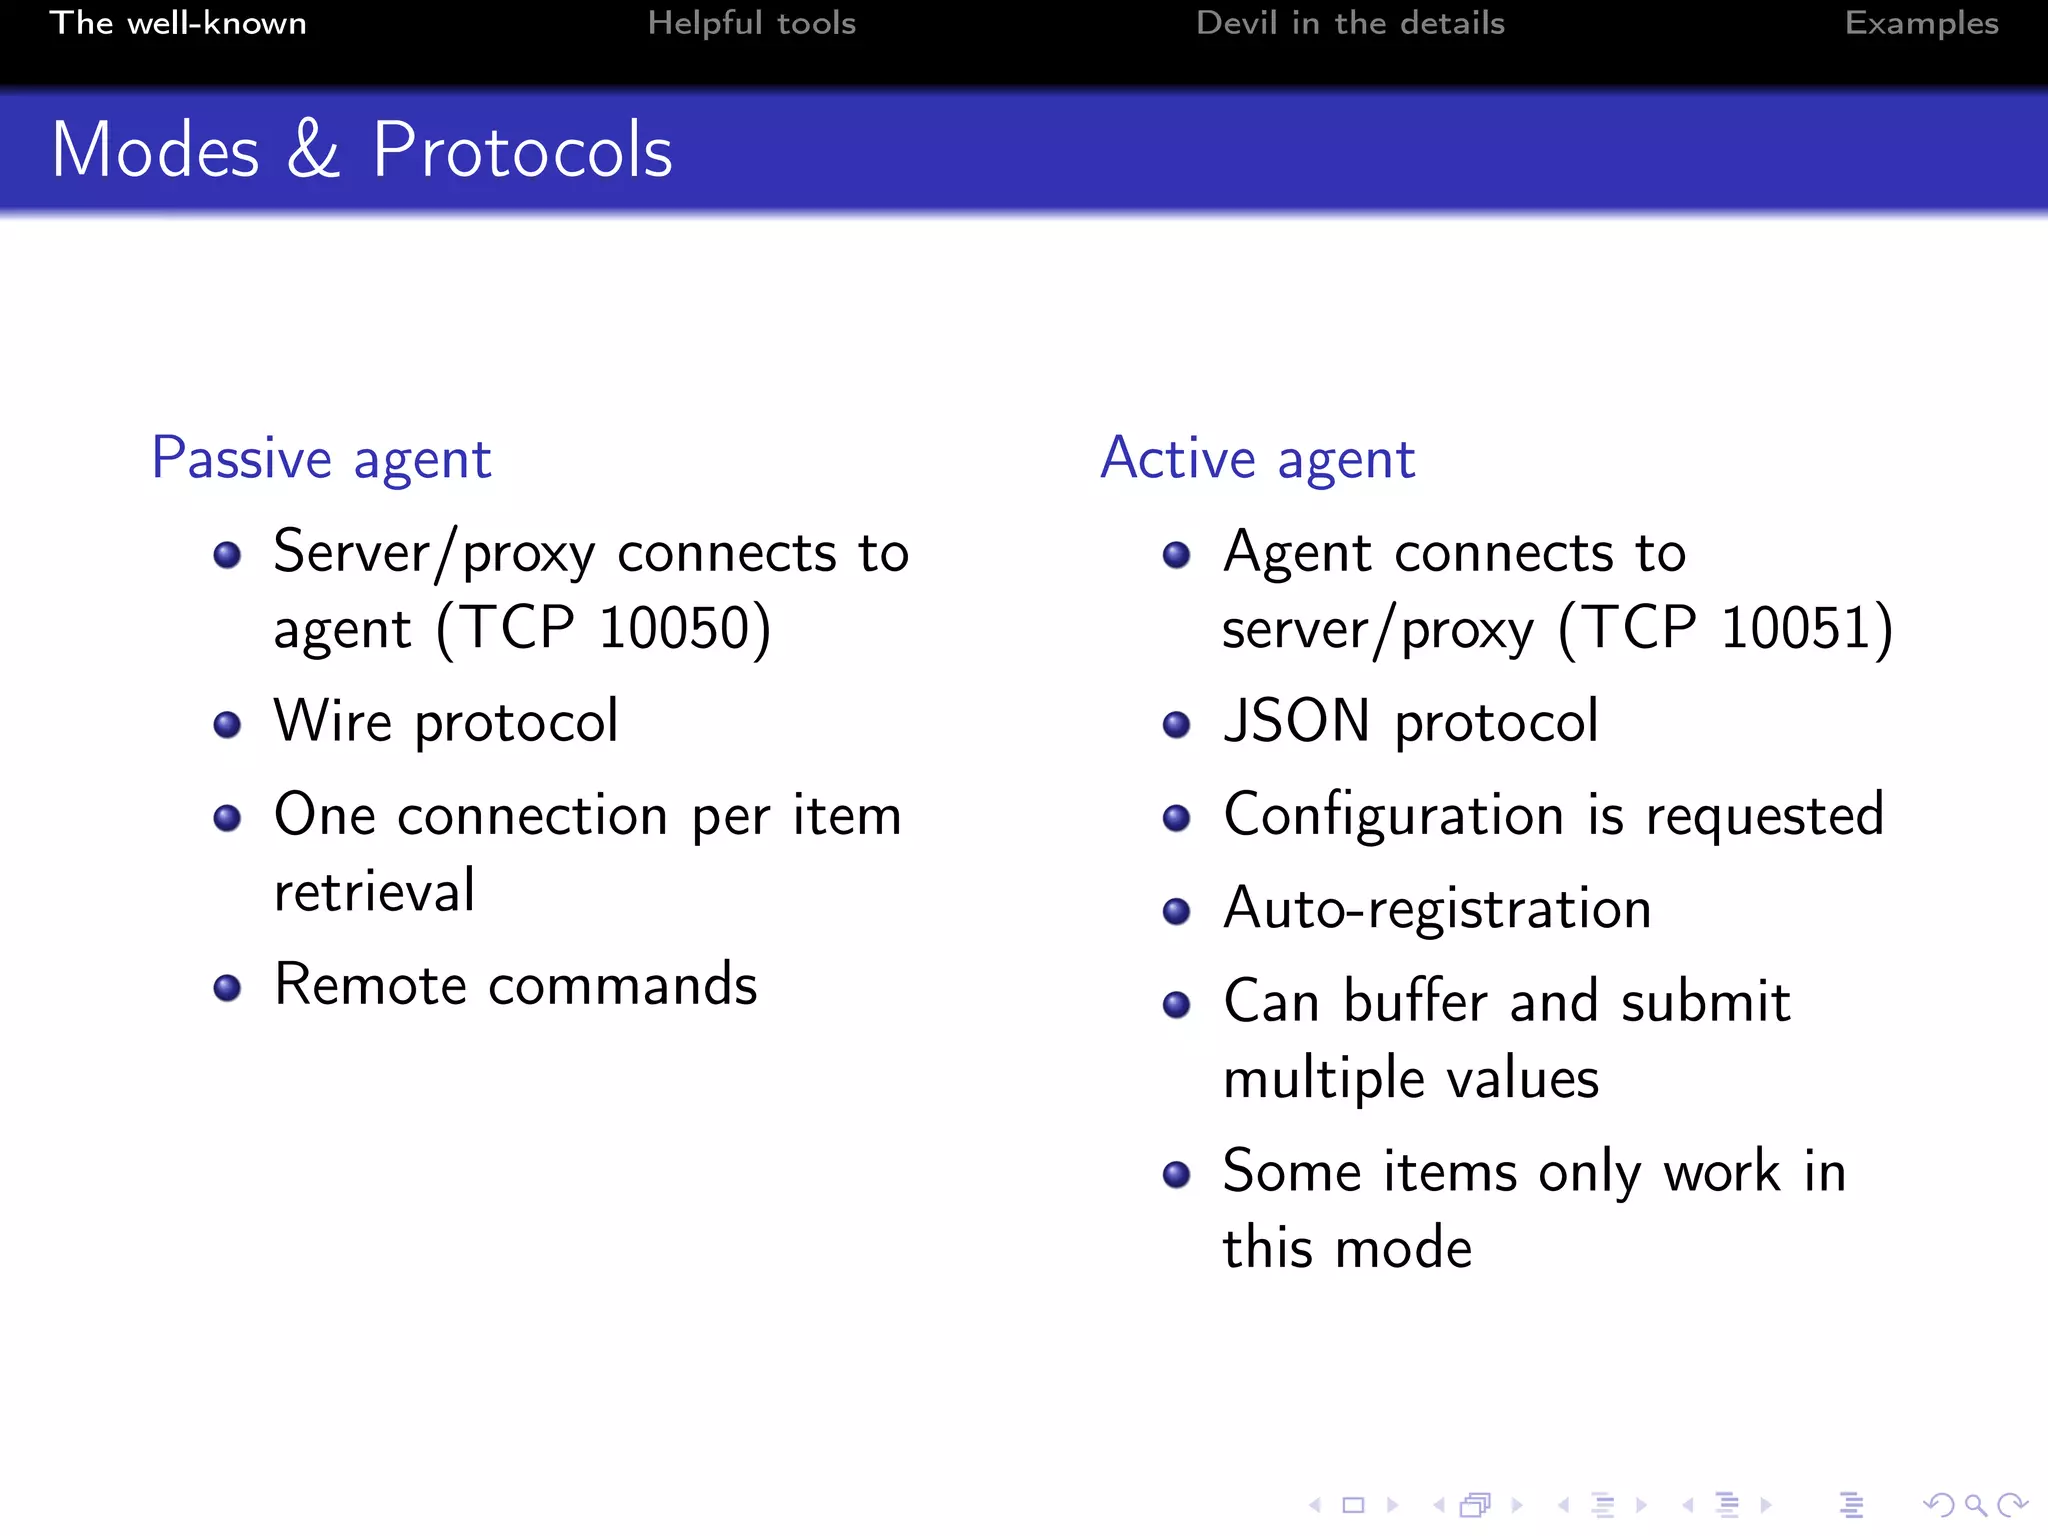
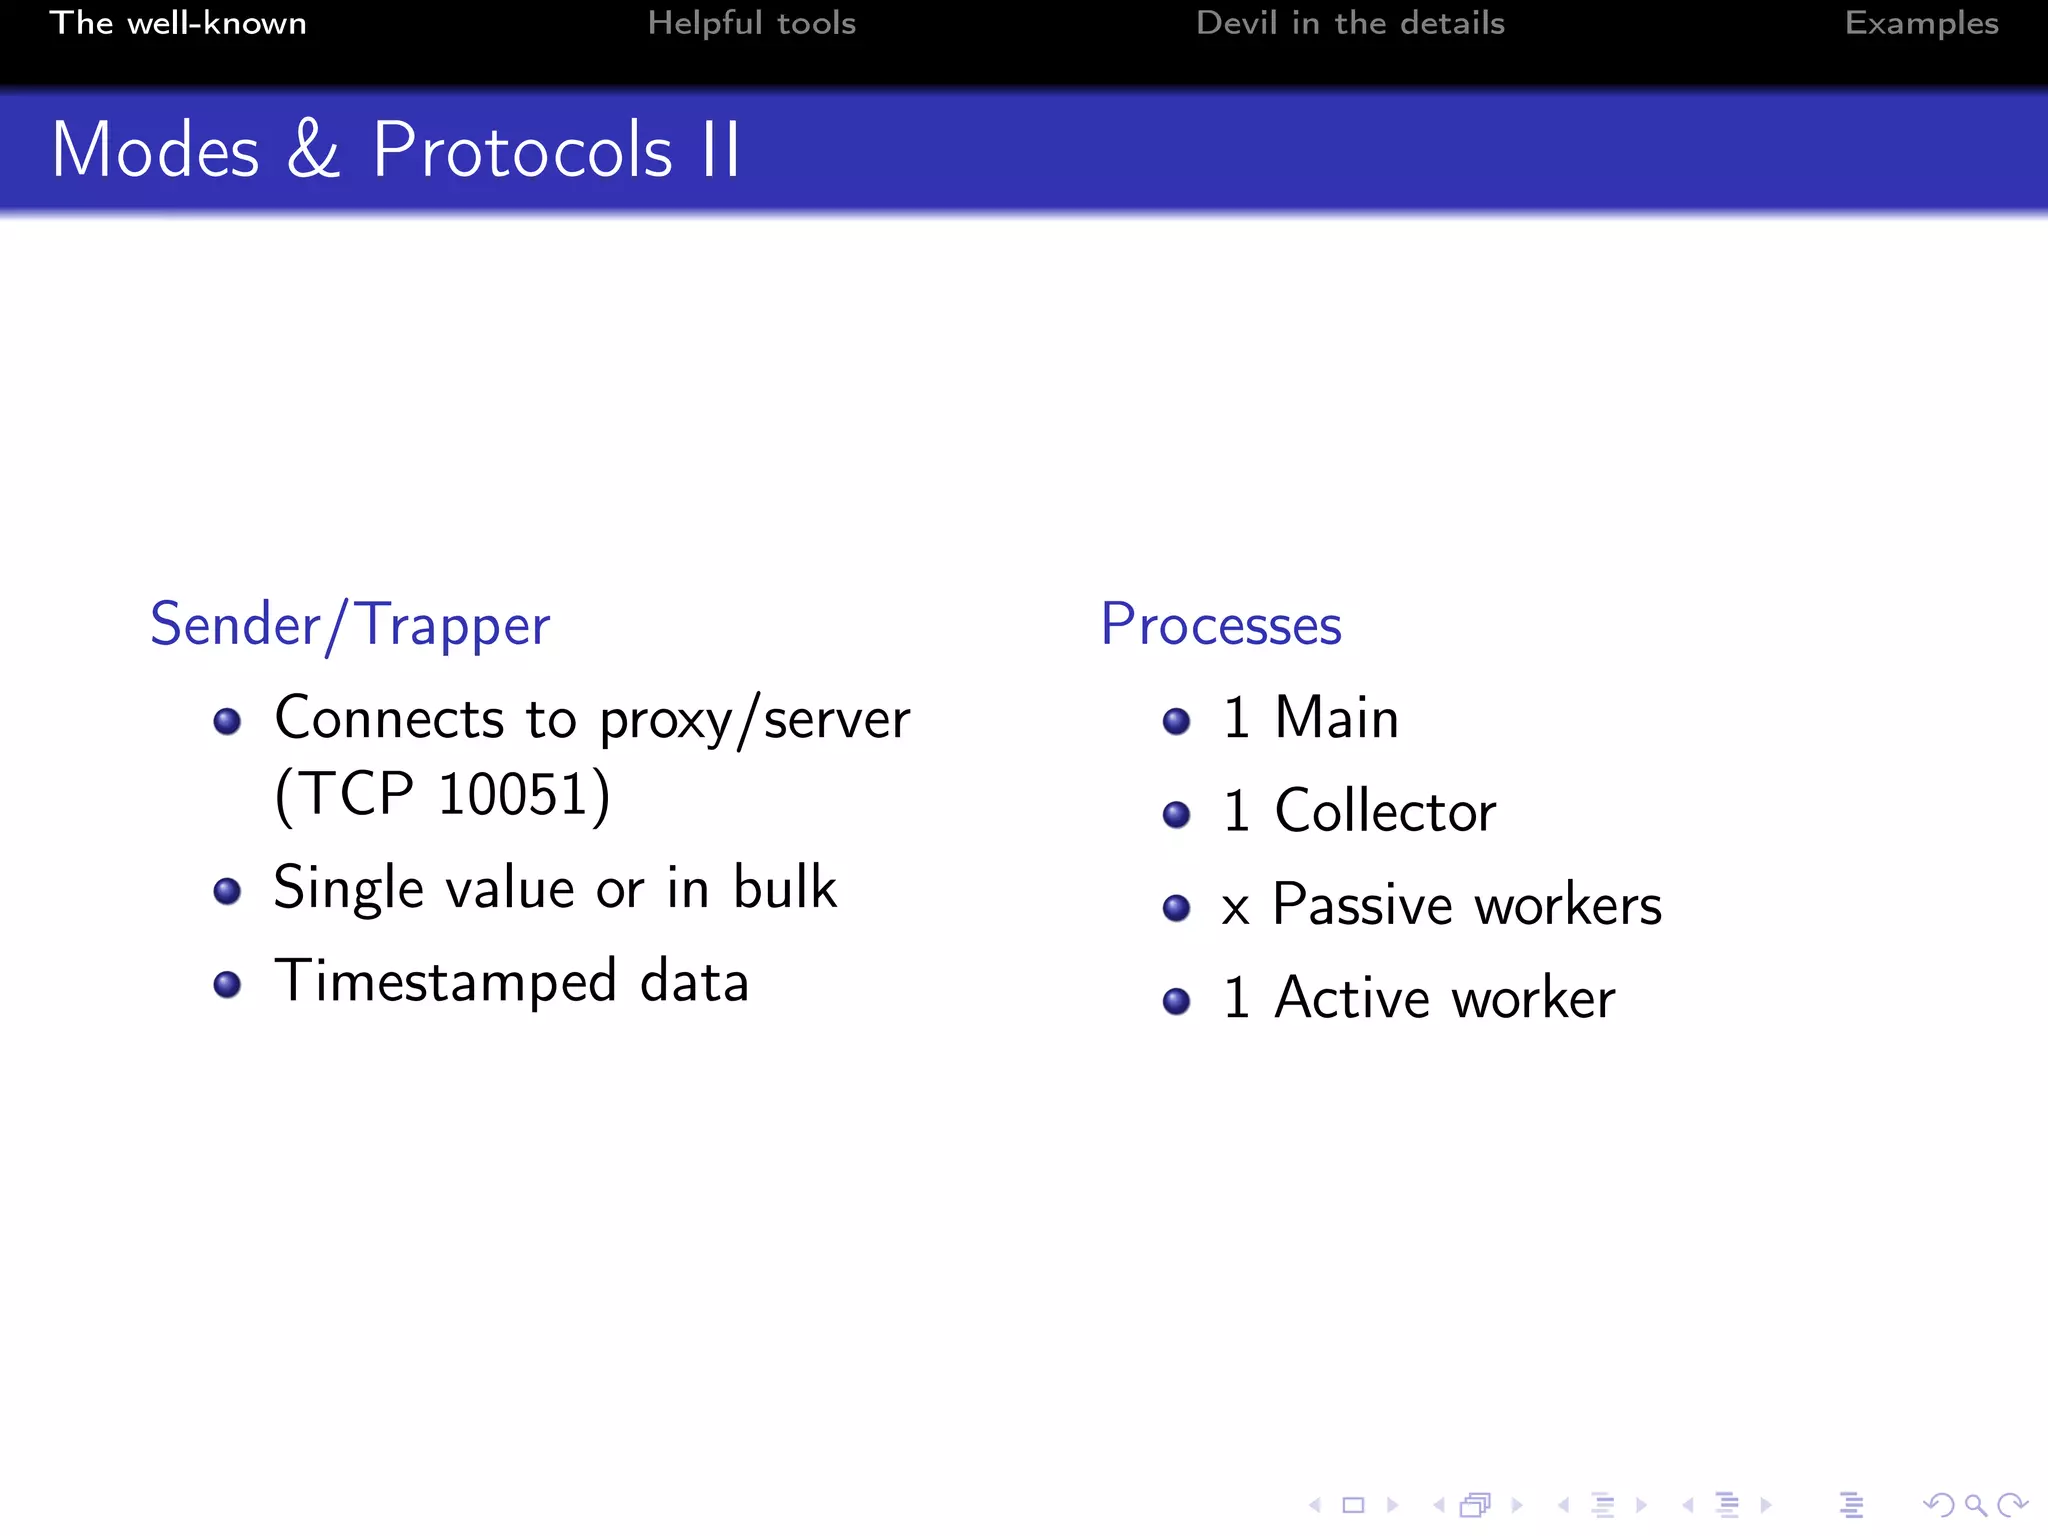
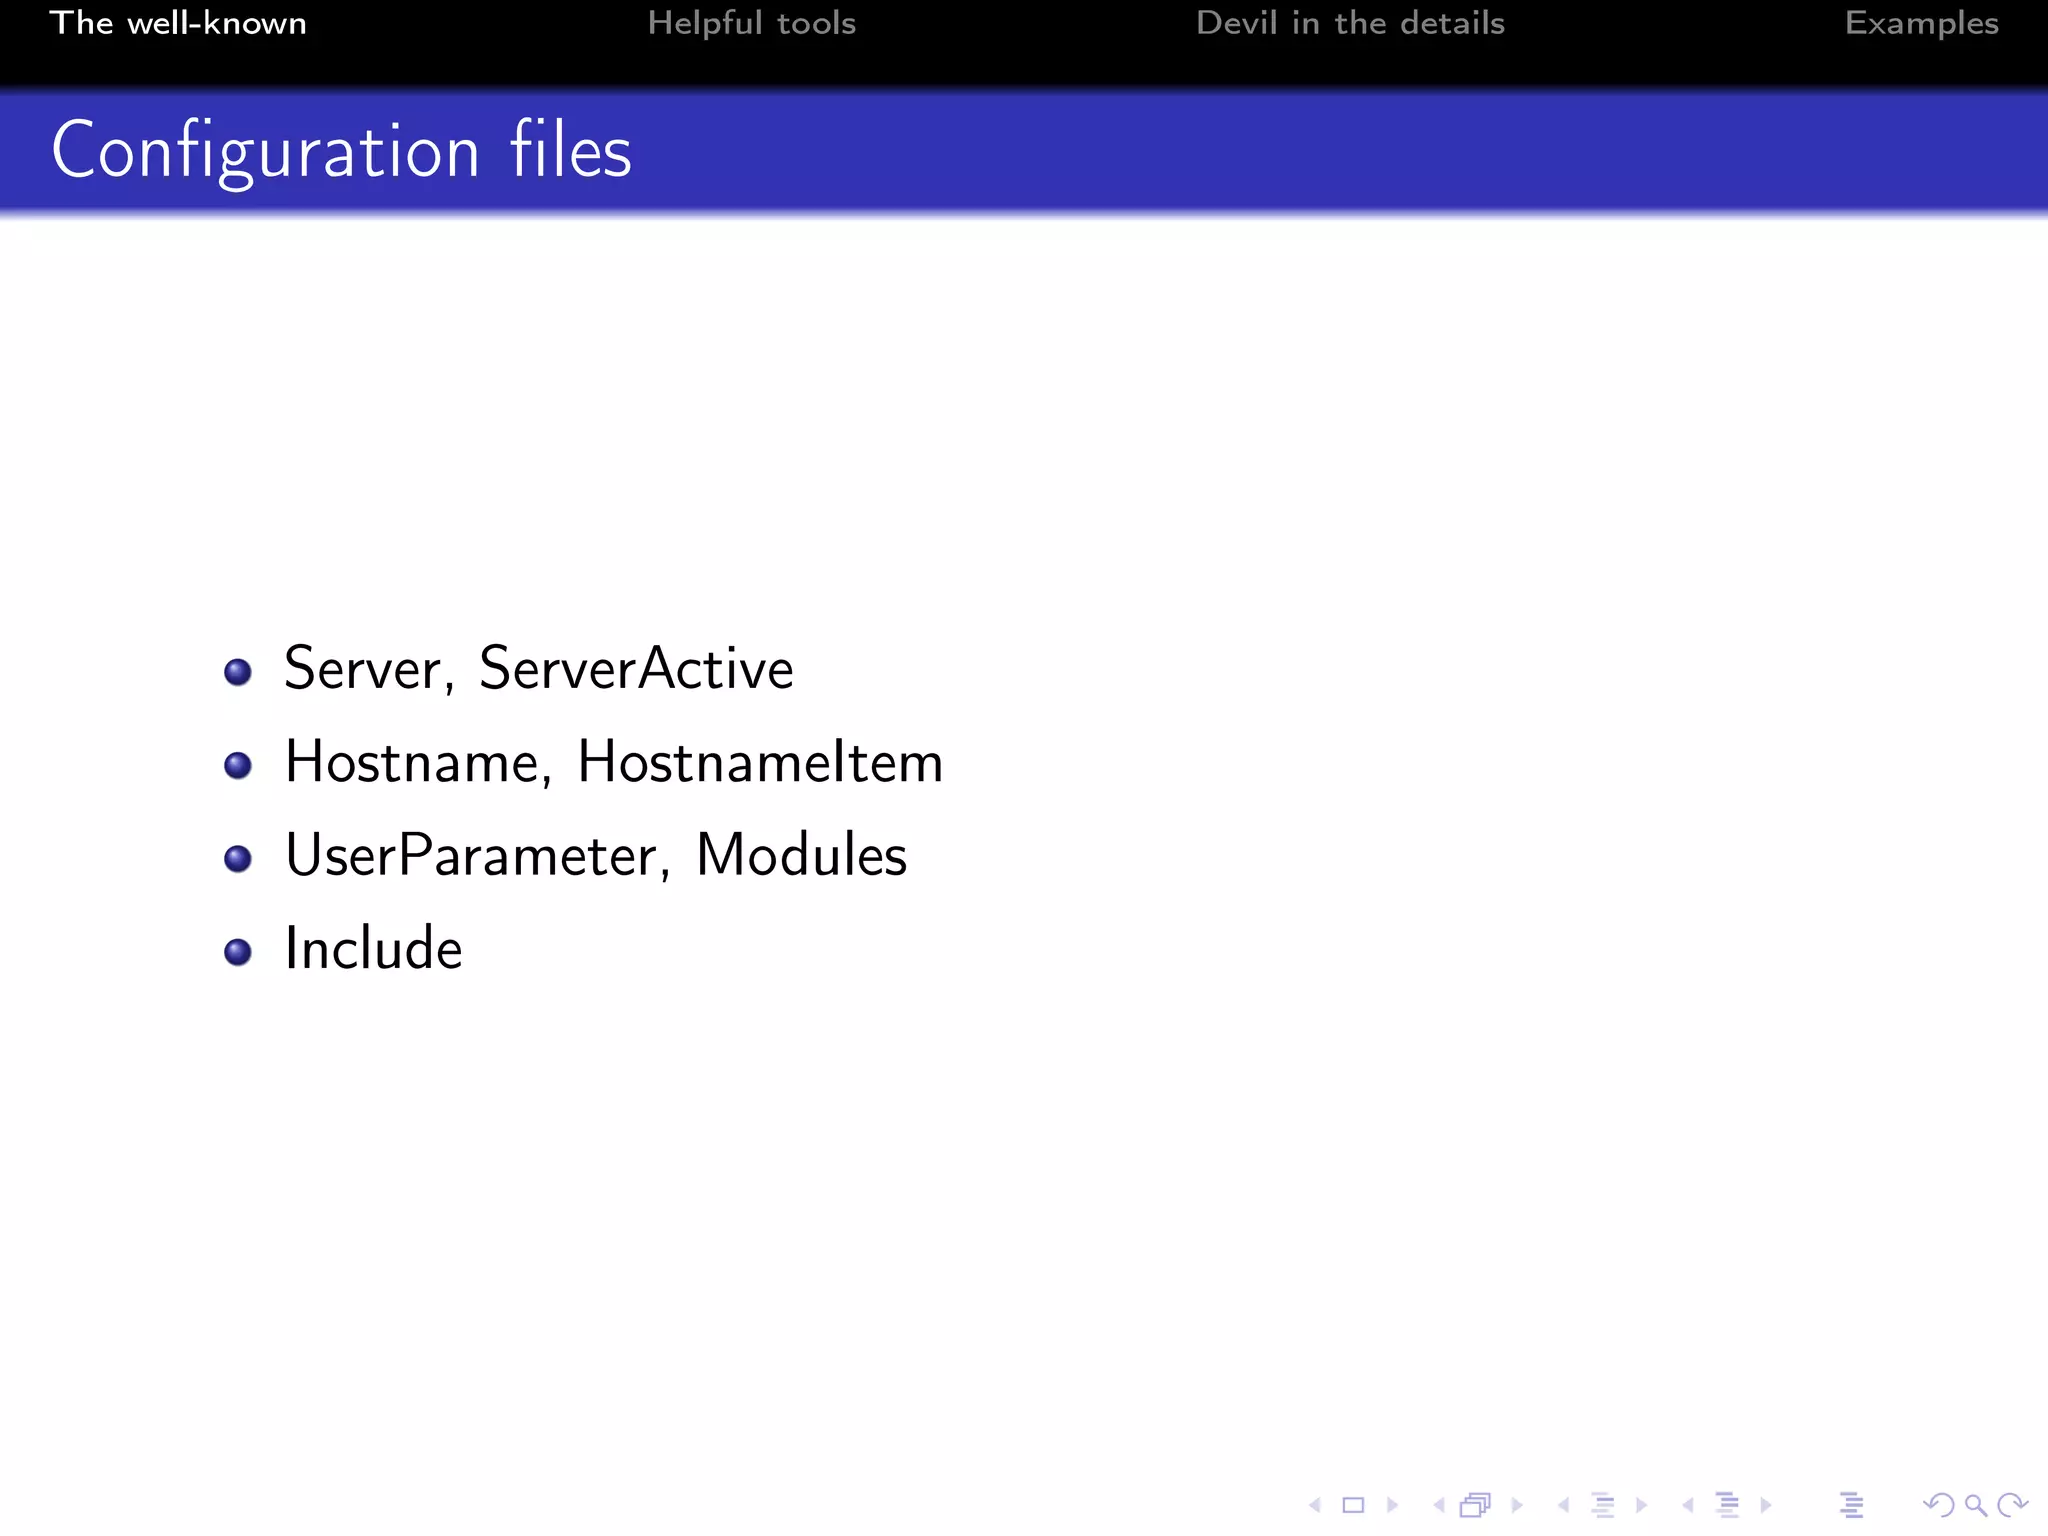
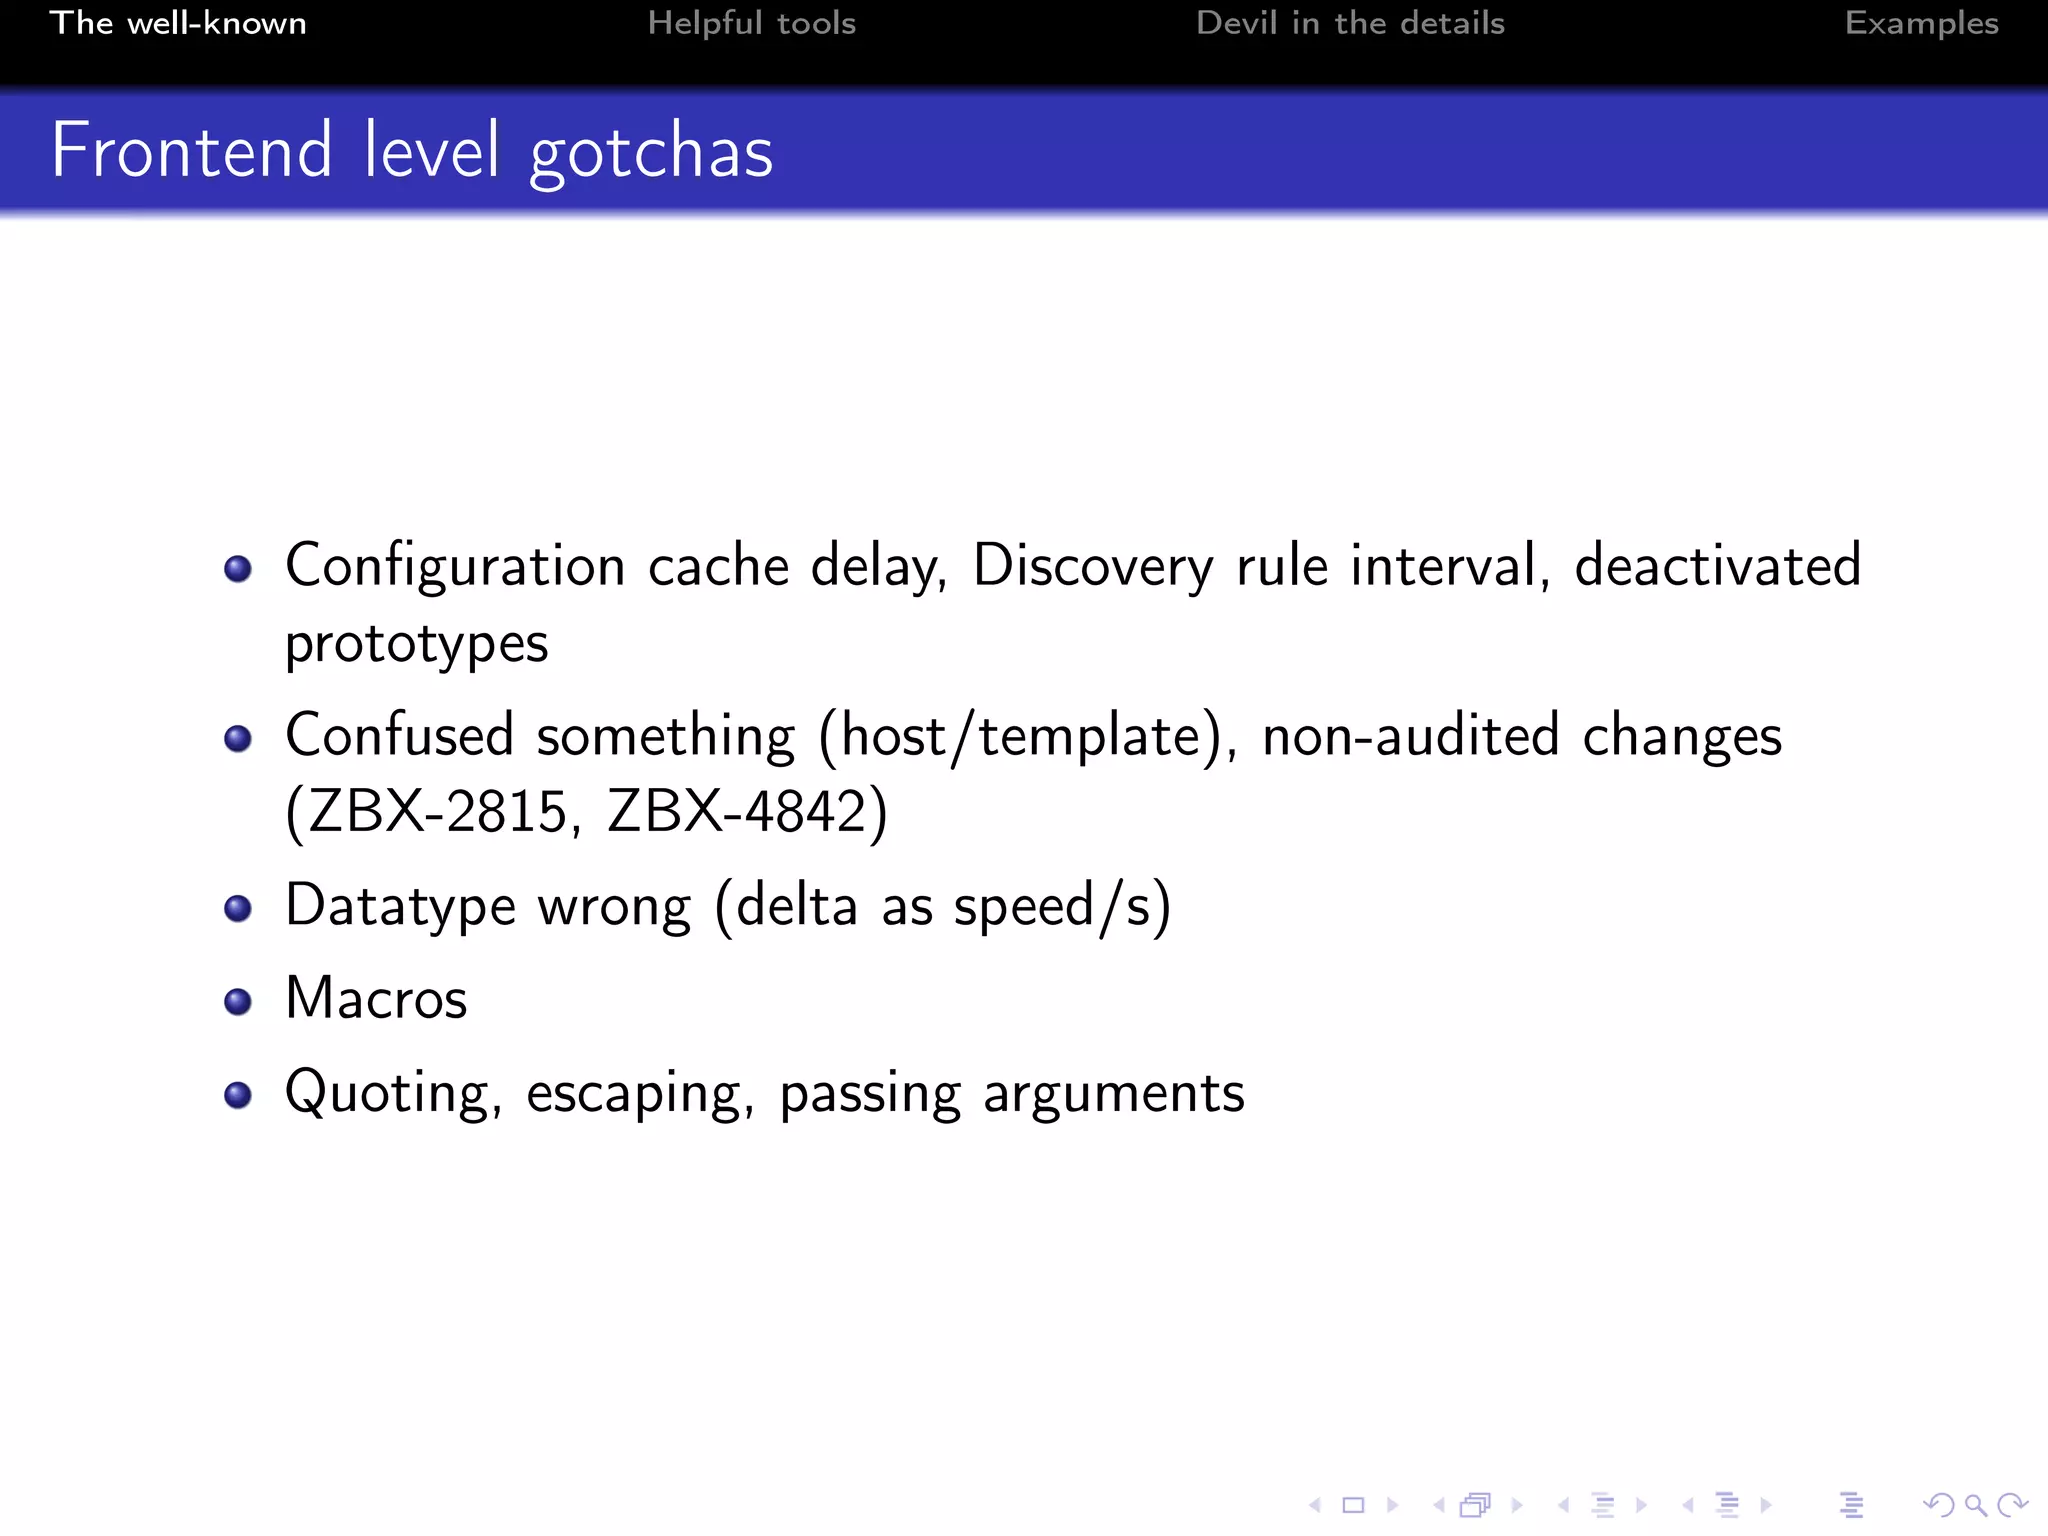
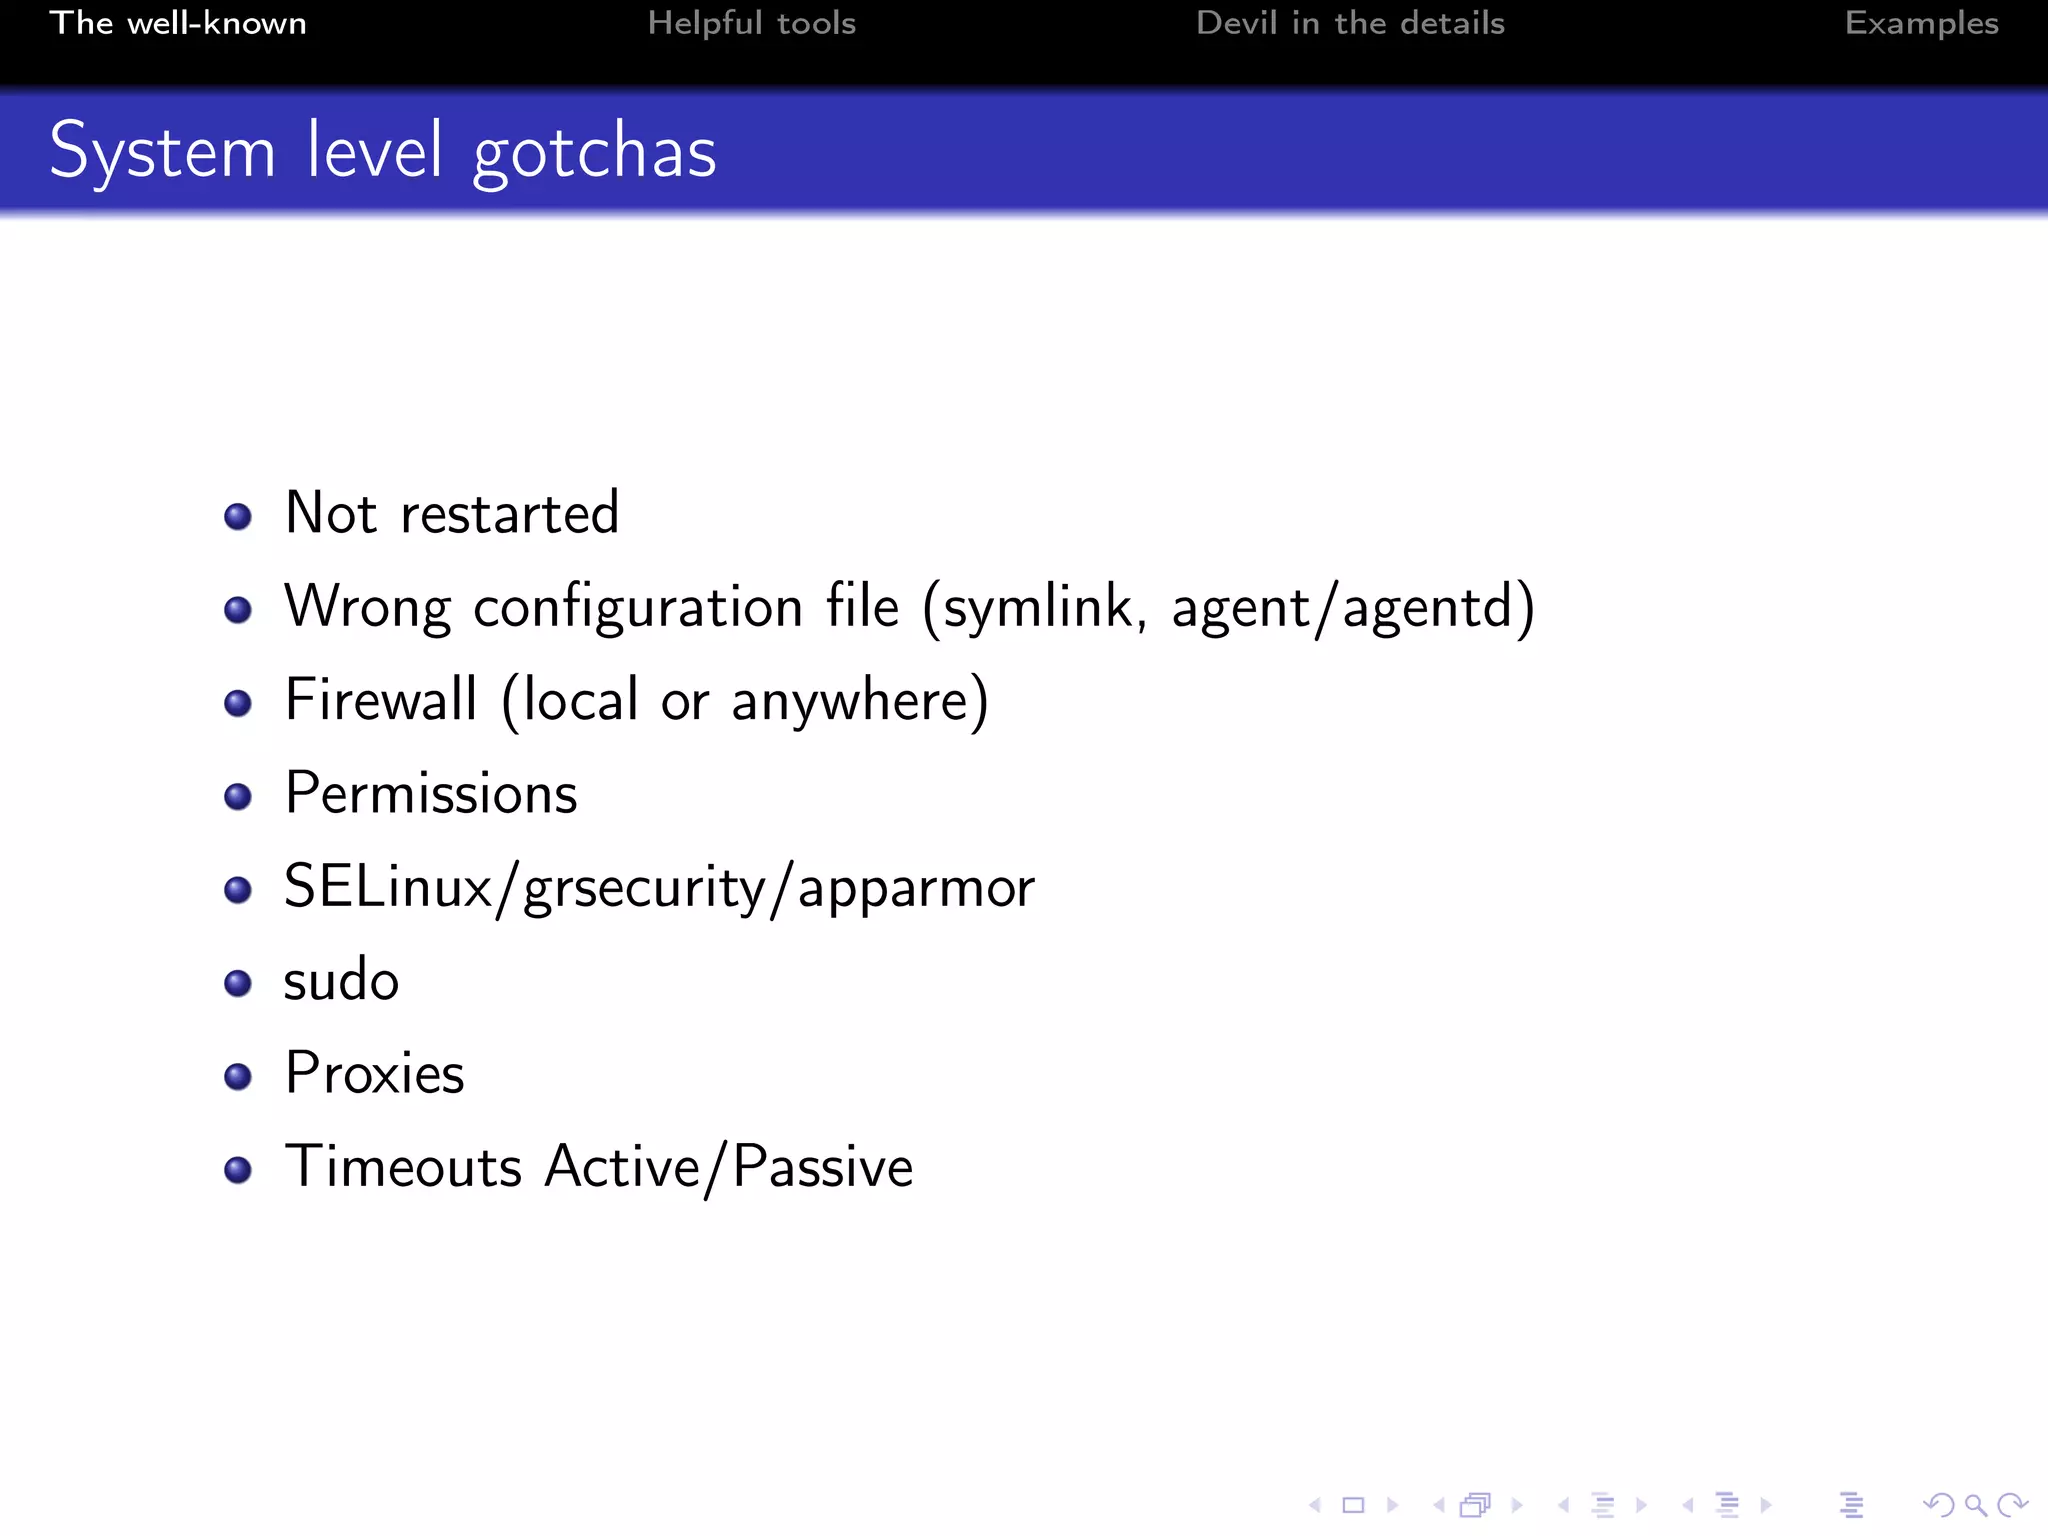
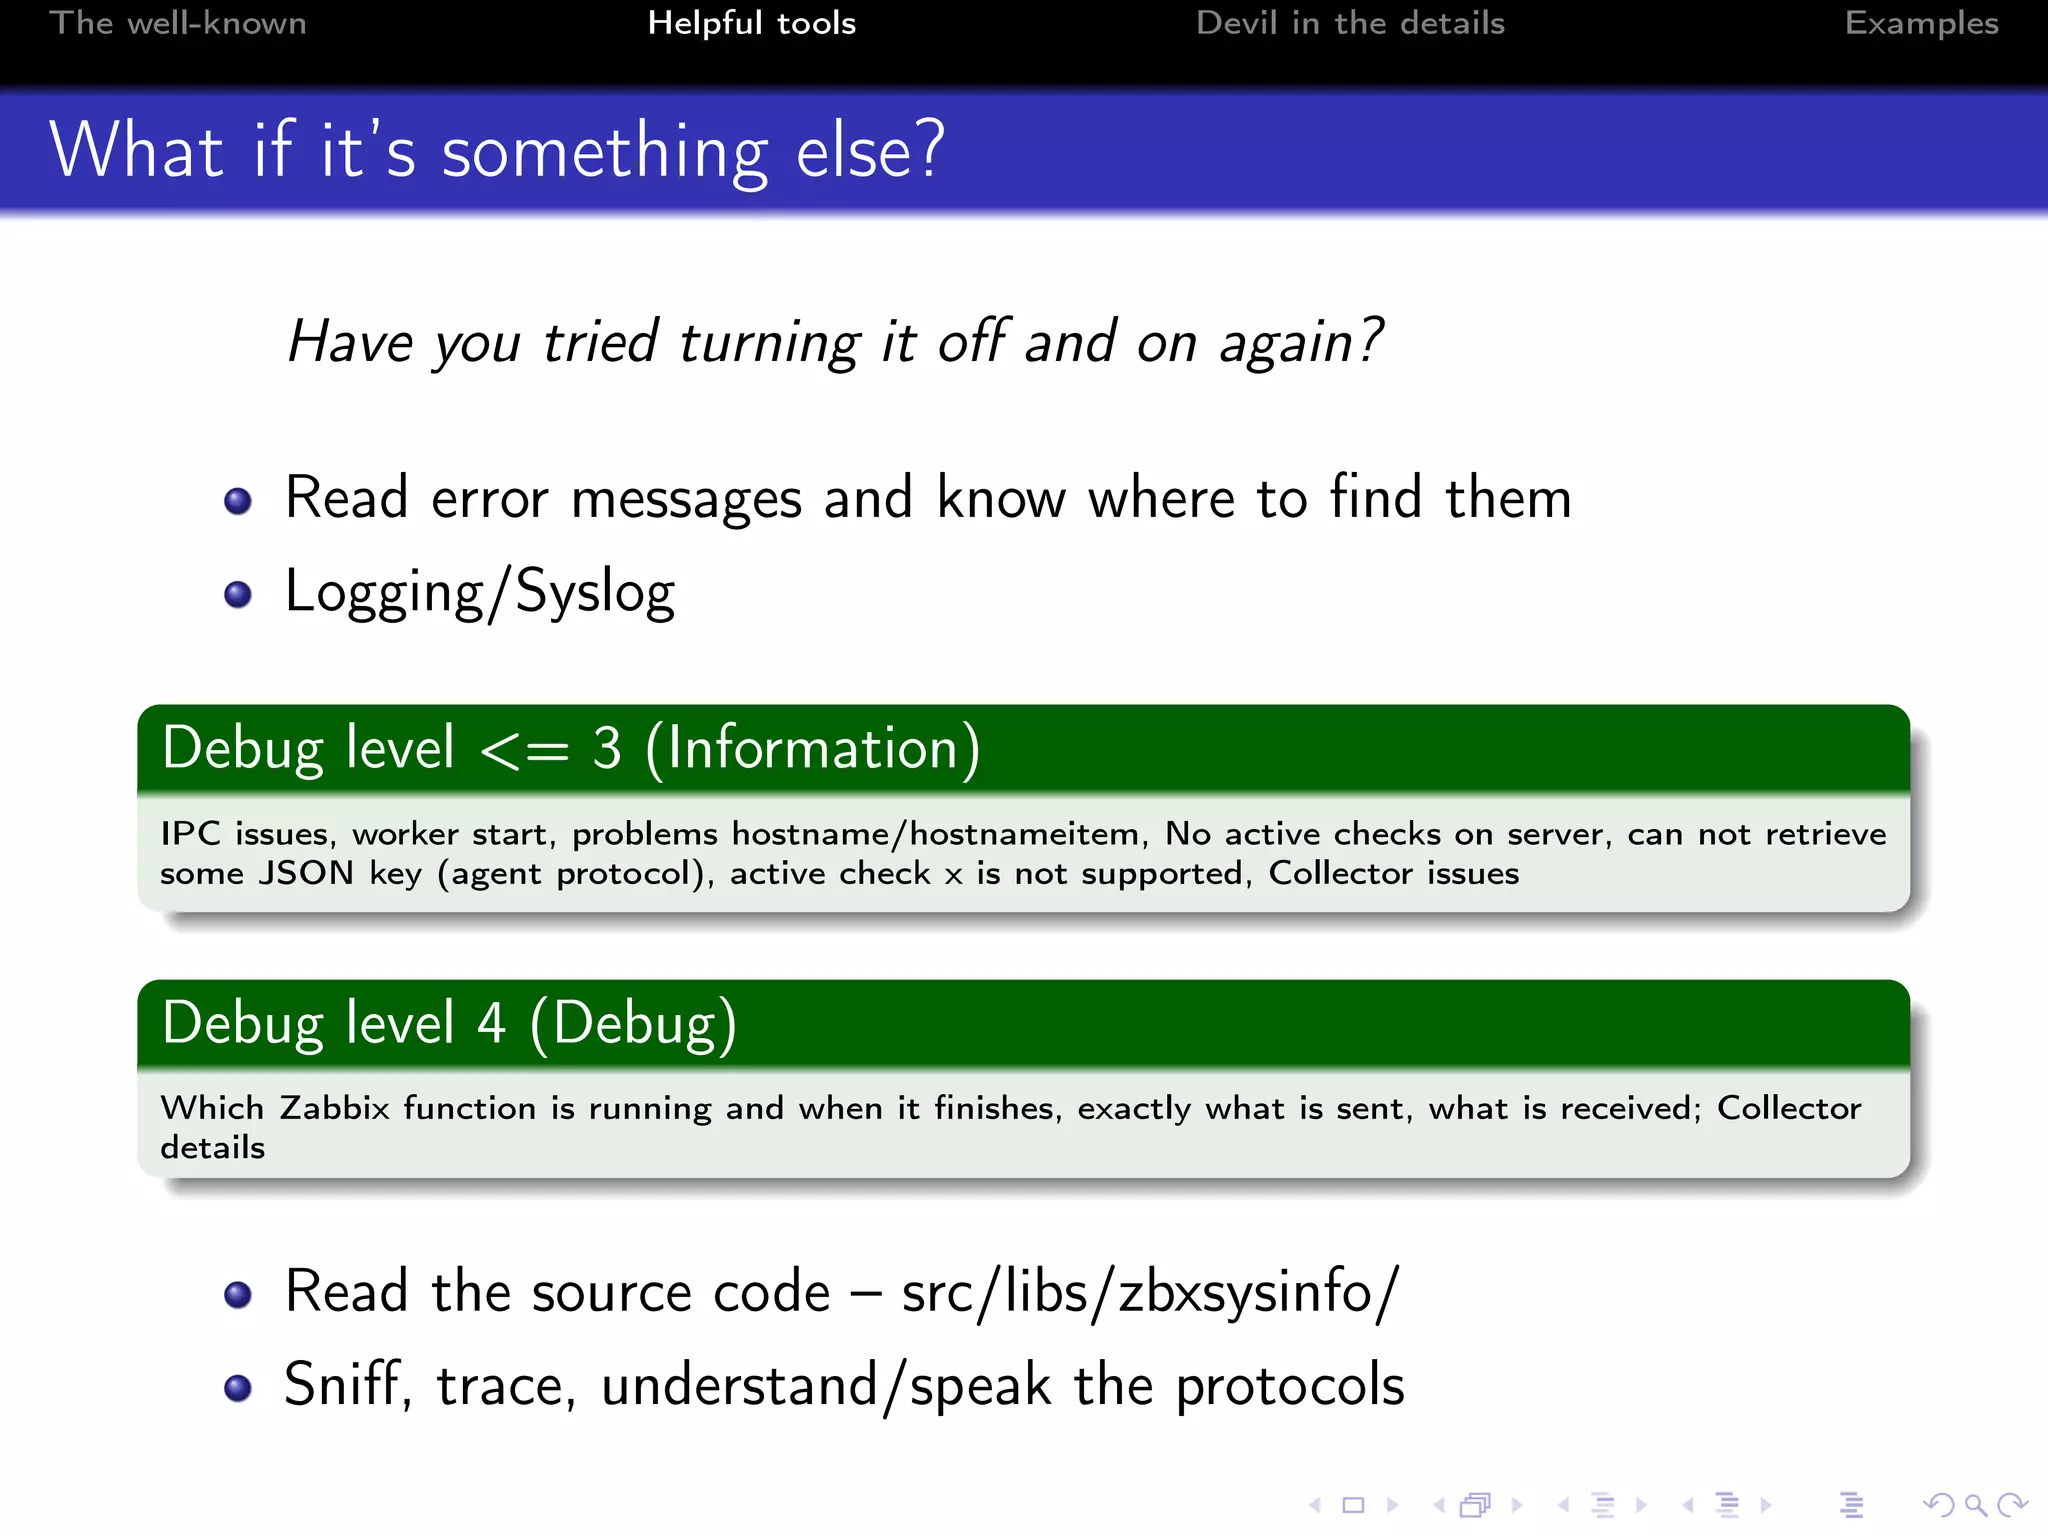
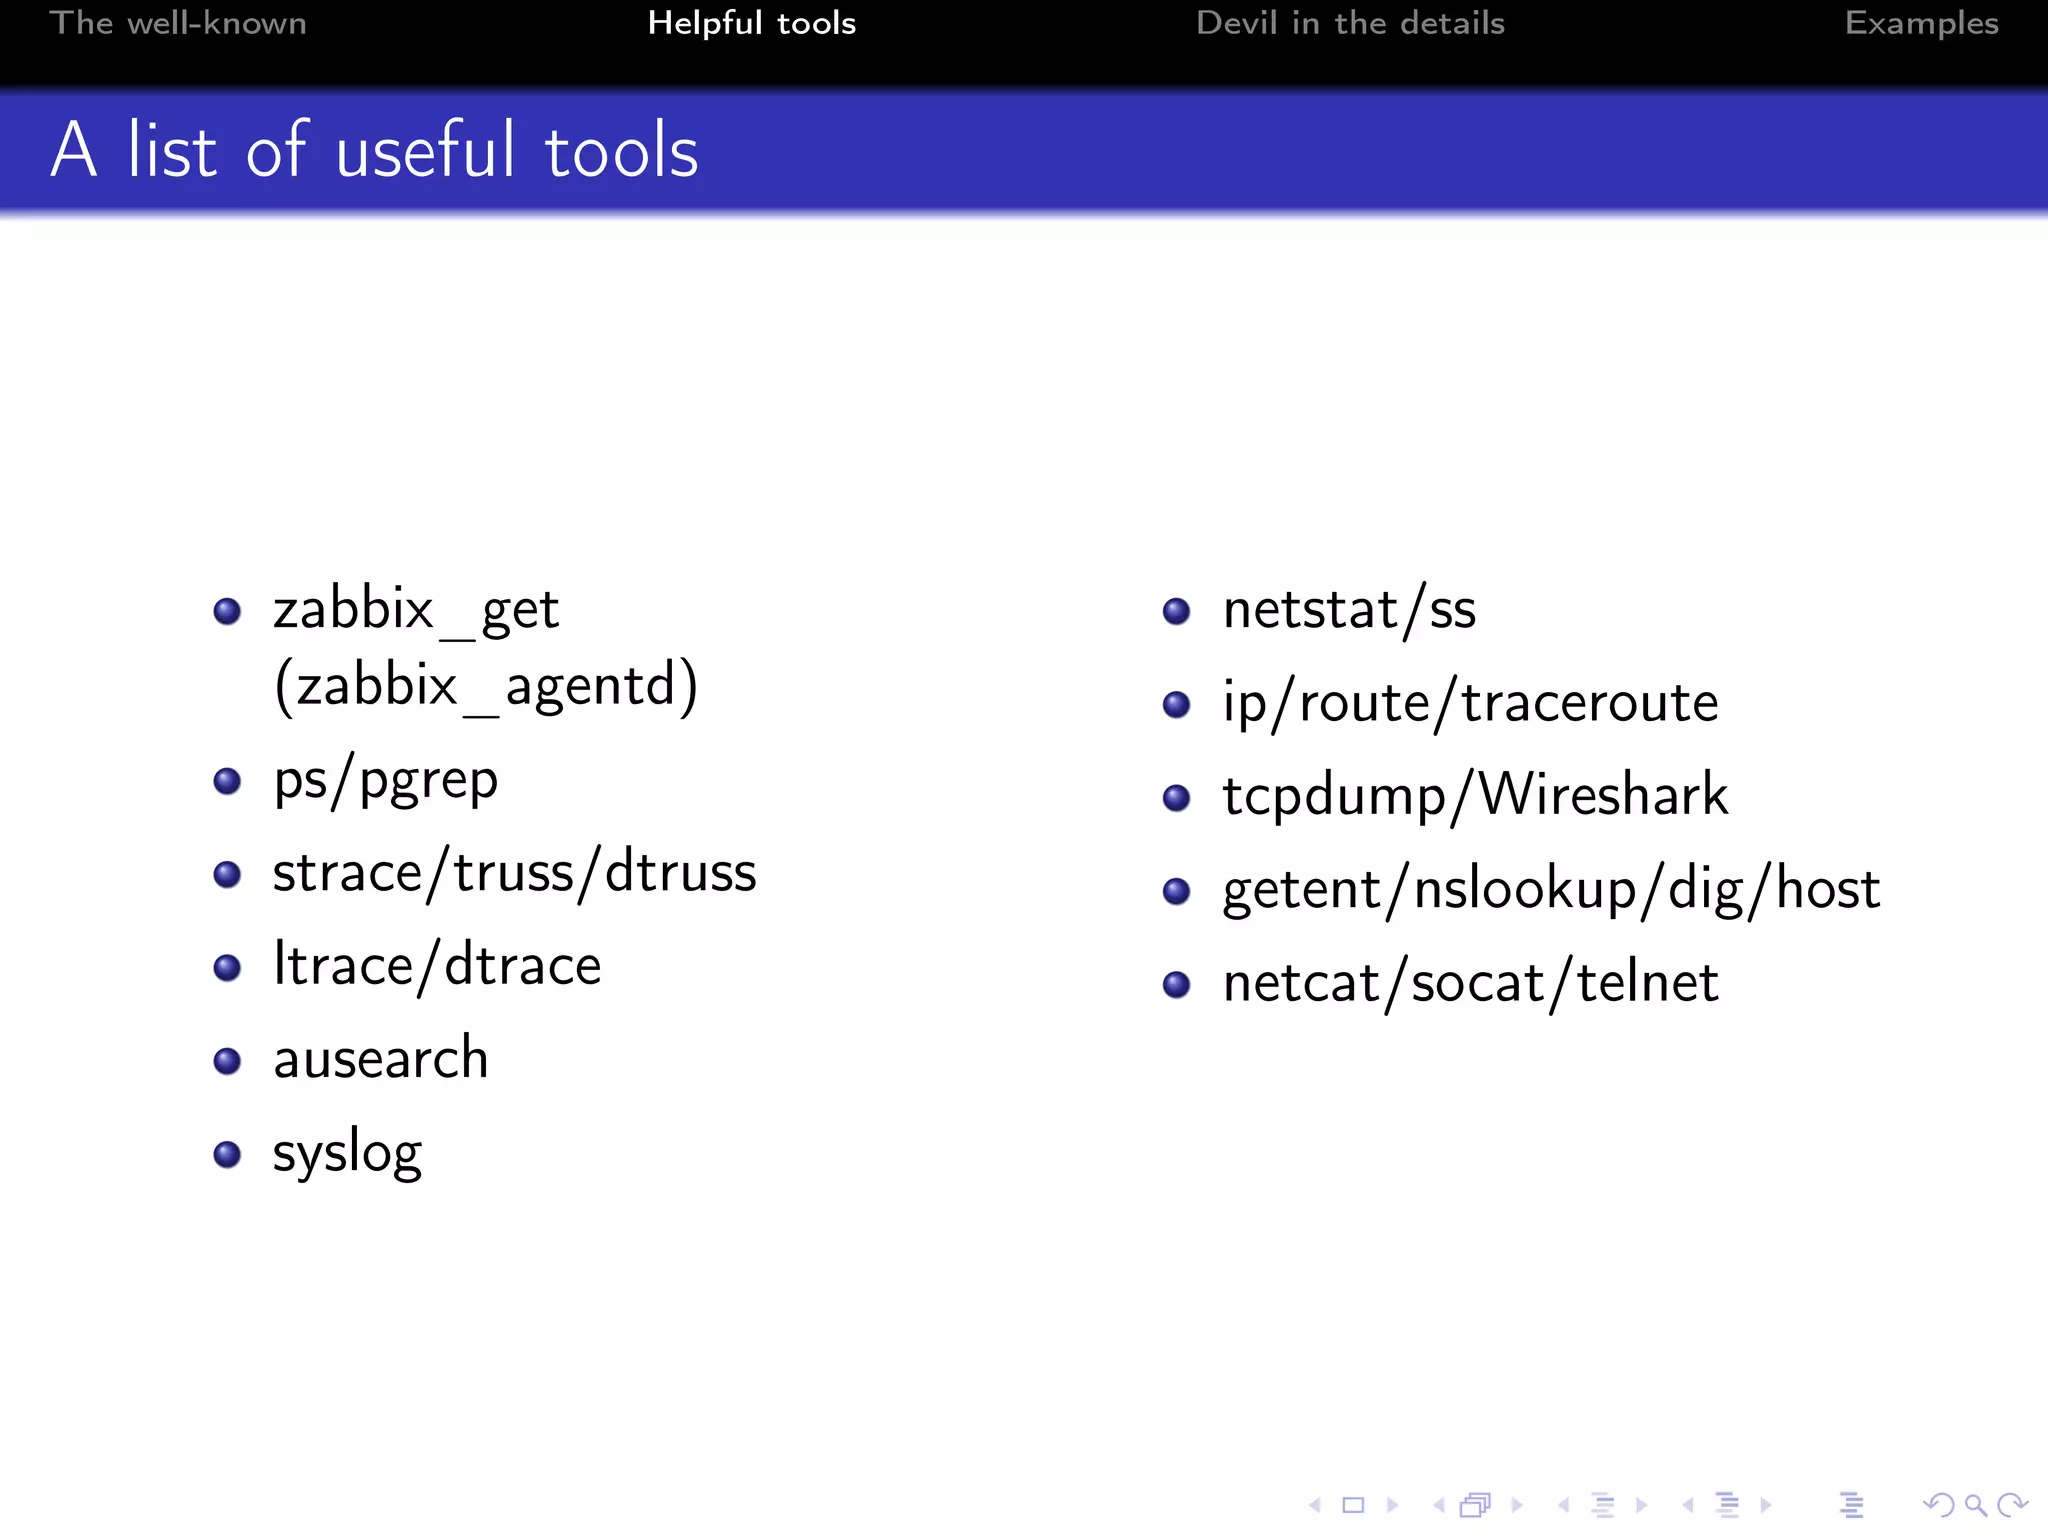
The document provides guidelines for debugging common issues associated with Zabbix agents, detailing the different modes and protocols of communication, as well as configuration challenges. It emphasizes the importance of understanding internal workings and highlights tools and commands that can assist in identifying and resolving issues. Furthermore, it discusses common pitfalls at system and frontend levels, along with best practices for troubleshooting agent connectivity and value accuracy.


![[DSC Europe 25] Behzad Hosseini - AI Agents in the Wild: Deploying Models tha...](https://cdn.slidesharecdn.com/ss_thumbnails/3qtejajvsjqrzwfept2c-10-251212103250-7f2b1068-thumbnail.jpg?width=640&height=640&fit=bounds)


![[DSC Europe 25] Vladimir Jelic - The AI-Driven Security Shift From Reactive D...](https://cdn.slidesharecdn.com/ss_thumbnails/6g5gj25mtjwayniqem1t-6-251209104645-7a5a5fc6-thumbnail.jpg?width=640&height=640&fit=bounds)

![[DSC Europe 25] Kaja Kandare - LLM as a judge.pptx](https://cdn.slidesharecdn.com/ss_thumbnails/arxyccaxsdsd1ba99wjw-7-251212104007-2b4e3f64-thumbnail.jpg?width=640&height=640&fit=bounds)
![[DSC Europe 25] Miodrag Pesovic & Vladislav Radonjic - Federated Data Archite...](https://cdn.slidesharecdn.com/ss_thumbnails/gsbe3y5it5uhndi4e08e-1-251212103249-f1008e0c-thumbnail.jpg?width=640&height=640&fit=bounds)
![[DSC Europe 25] Marko Krstic - Understanding the AI Threat Landscape - Risks,...](https://cdn.slidesharecdn.com/ss_thumbnails/tiyim1ins5jvbrvzpzla-2-251209104645-c69d3553-thumbnail.jpg?width=640&height=640&fit=bounds)
![[DSC Europe 25] Hans Kleinsman - The Compliance Gearbox: How Tax Tech Mediate...](https://cdn.slidesharecdn.com/ss_thumbnails/dxdytie1toel0hr90bjs-2-251212103250-174fdbe7-thumbnail.jpg?width=640&height=640&fit=bounds)

![[DSC Europe 25] Dusan Nesic - Securing Tomorrow’s Infrastructure: Why Cyber-P...](https://cdn.slidesharecdn.com/ss_thumbnails/qikbszfftyowjm2q6duw-1-251211083848-8f2ead6b-thumbnail.jpg?width=640&height=640&fit=bounds)

![[DSC Europe 25] Dunja Adzic Jovanovic - AI and Cybersecurity: Defending Data ...](https://cdn.slidesharecdn.com/ss_thumbnails/o1zylpbhrtwnixxq2xj8-7-251211083048-185086f6-thumbnail.jpg?width=640&height=640&fit=bounds)
![[DSC Europe 25] Katherine Forrest - AI NOW: Understanding the Velocity of Cha...](https://cdn.slidesharecdn.com/ss_thumbnails/wvvbruqfrci0sfq9xwgb-4-251212104007-e5ad1987-thumbnail.jpg?width=640&height=640&fit=bounds)