Download as PDF, PPTX


![Get internal stats
• Real number of VPS
• zabbix[wcache, values, all]
• zabbix[queue,1m] number of items delayed for more
than 1 minute
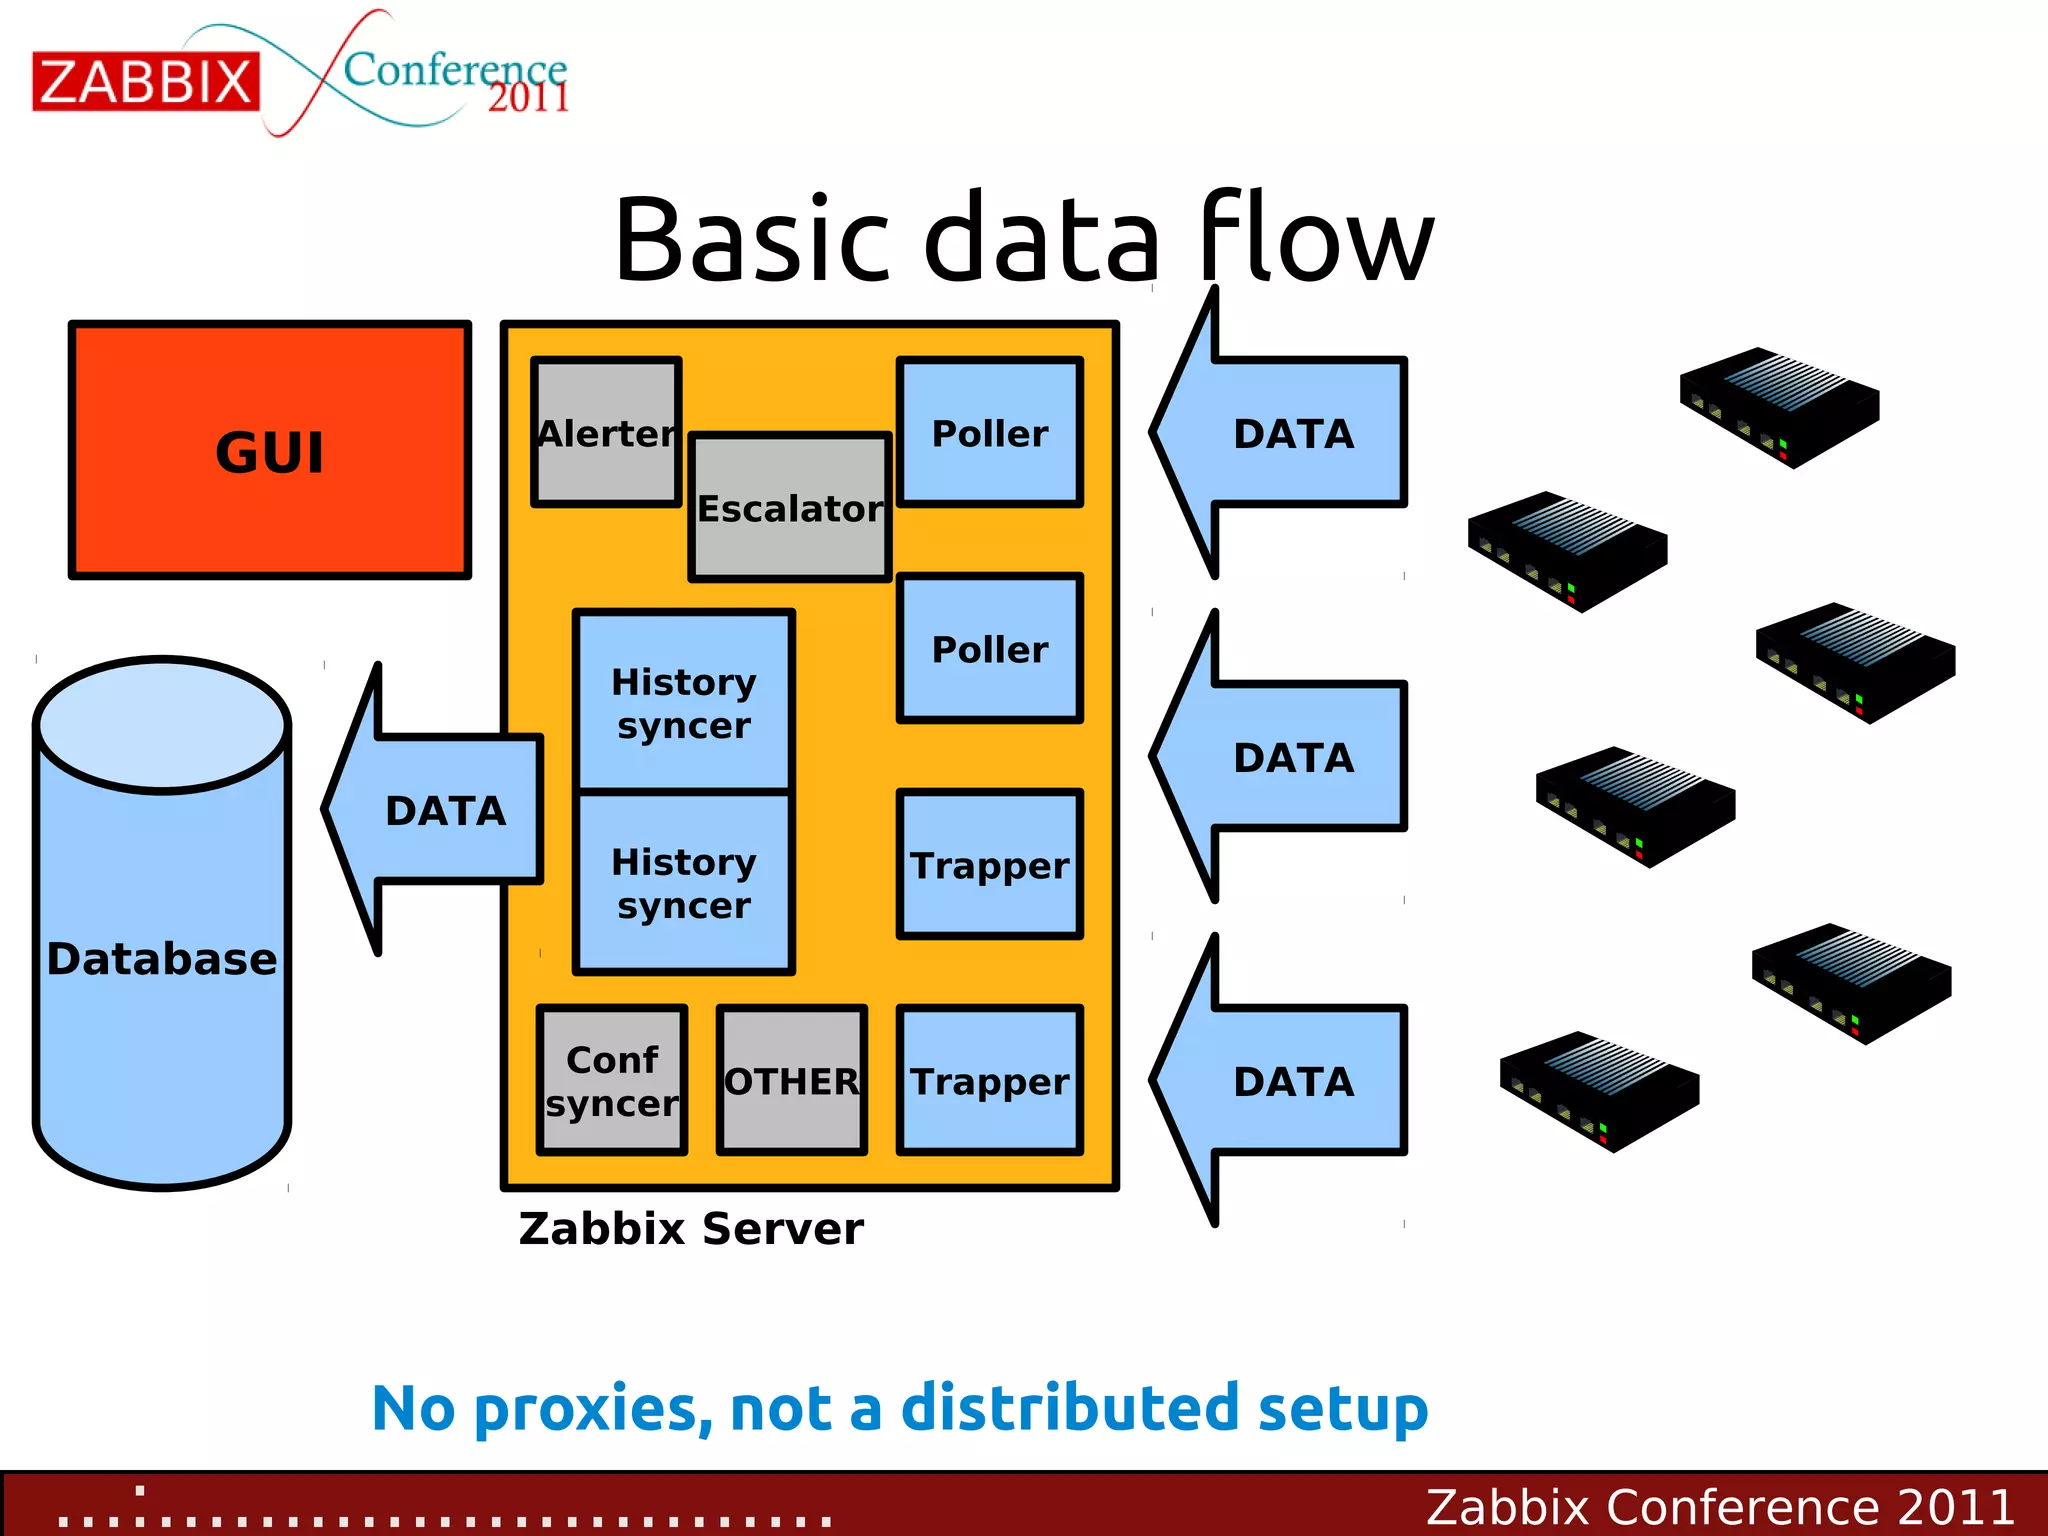
• Zabbix Server components
• Alerter, Configuration syncer, DB watchdog,
discoverer, escalator, history syncer, http poller,
housekeeper, icmp pinger, ipmi poller, poller, trapper
................:.............. Zabbix Conference 2011](https://image.slidesharecdn.com/alexeivladishev-zabbixperformancetuning-111026222518-phpapp02/75/Zabbix-Performance-Tuning-17-2048.jpg)
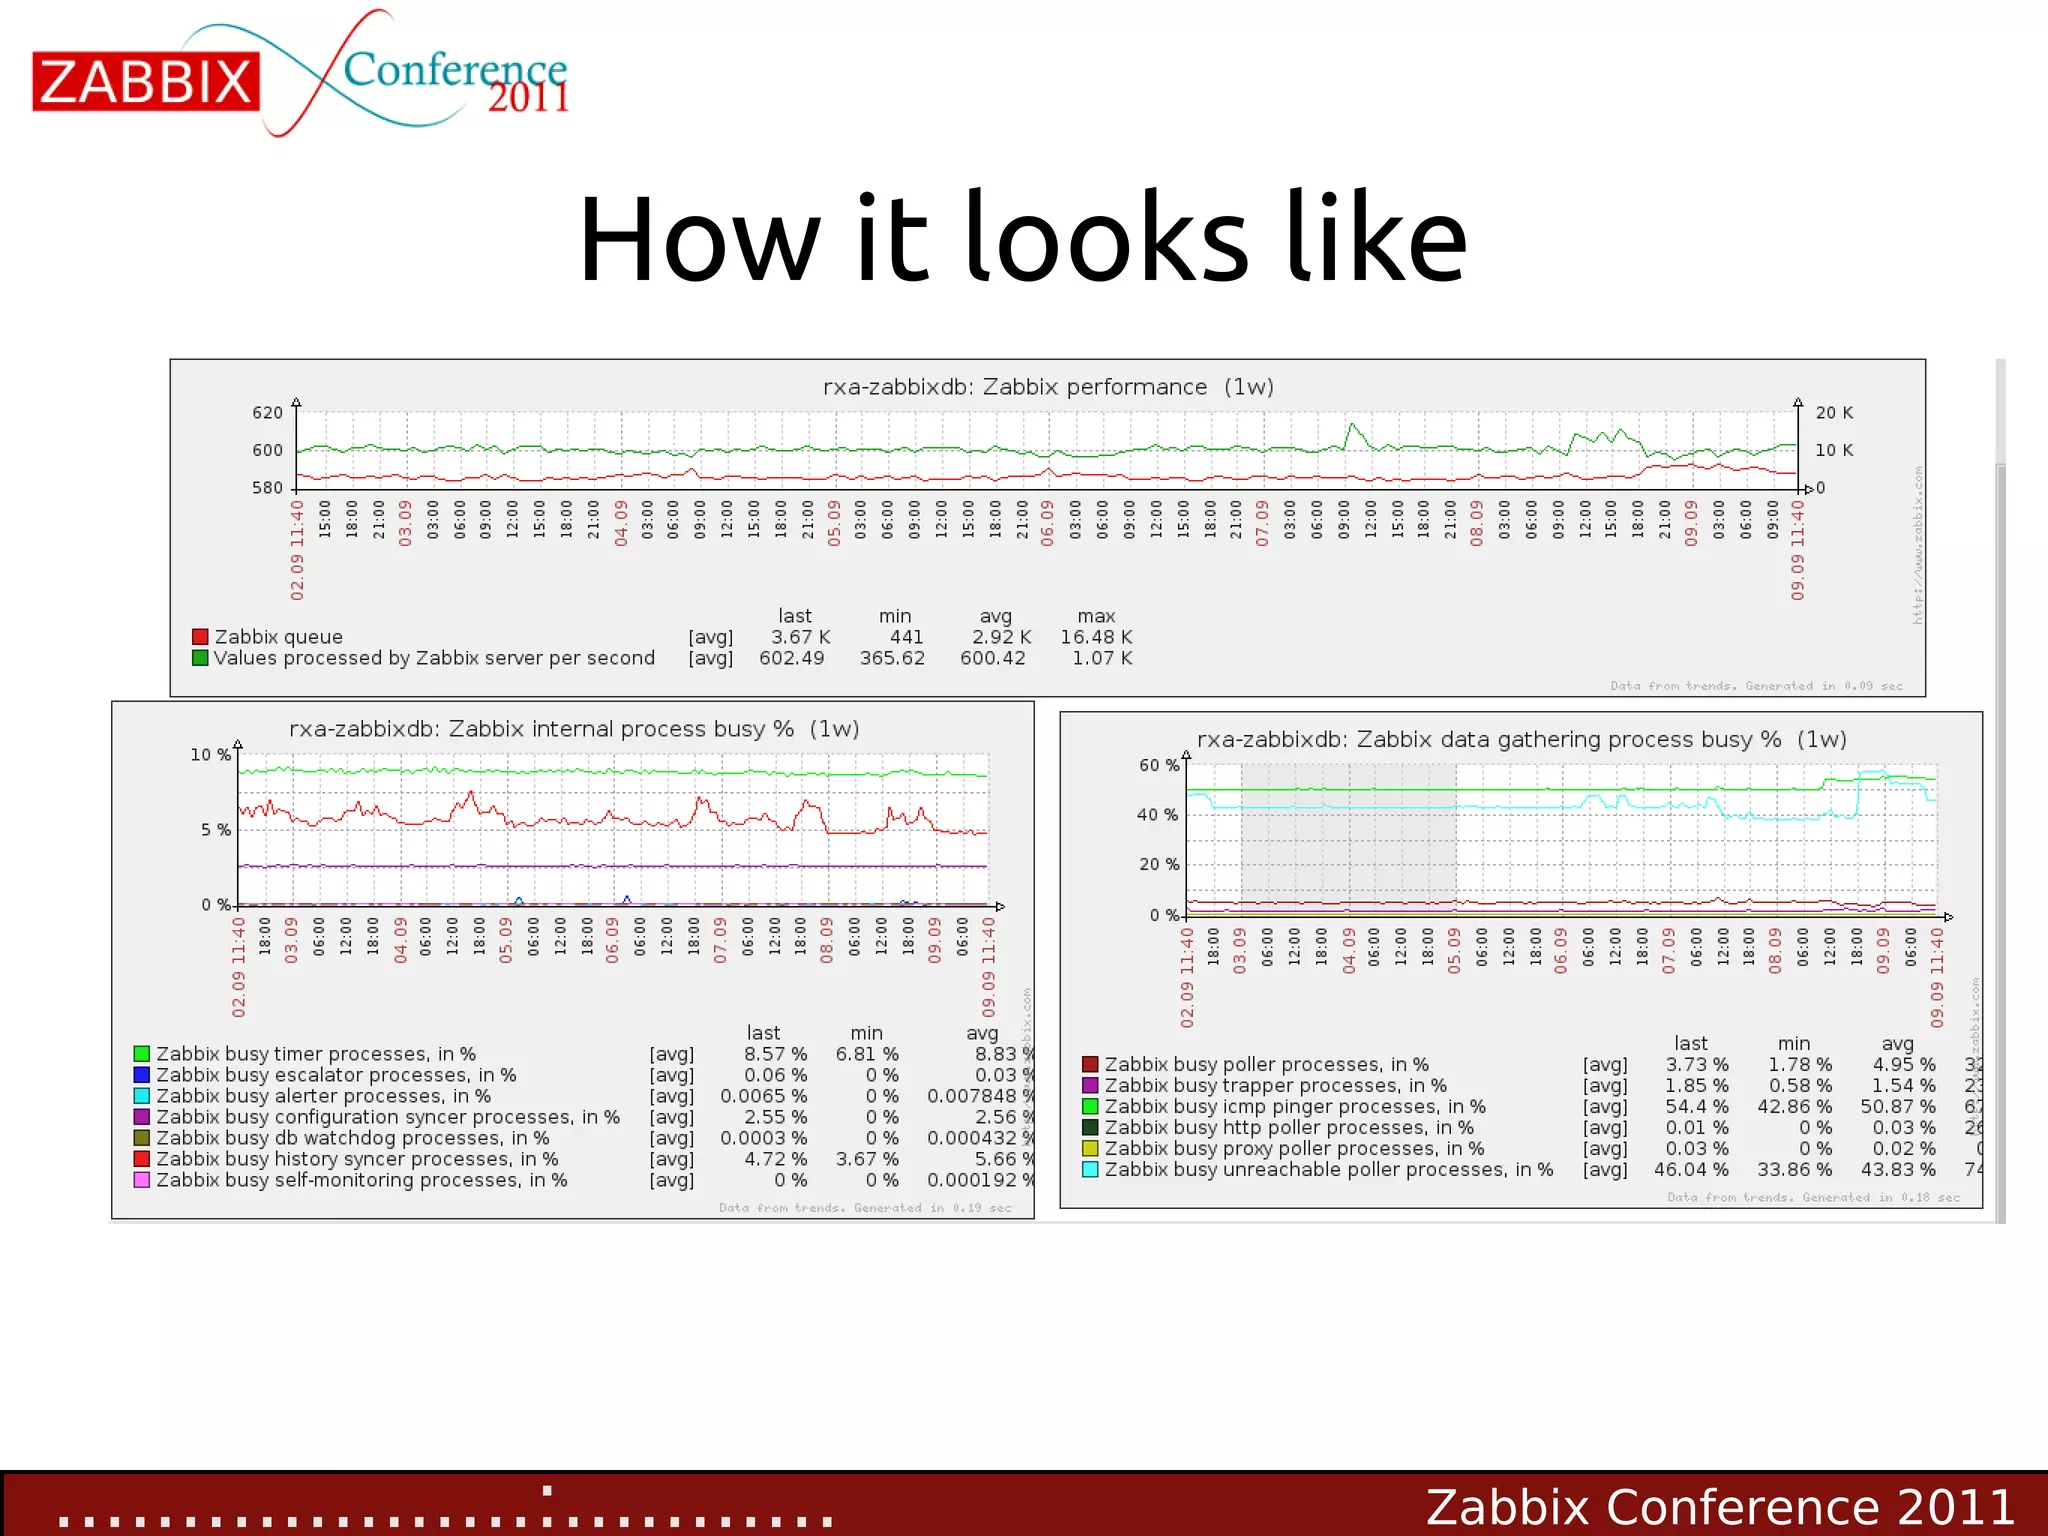
![Get internal stats
• Now we have a very nice way of monitoring internal
performance
• Percentage of time a component is in BUSY state
• zabbix[process,<type>,<mode>,<state>]
• <type> - trapper, discoverer, escalator, alerter, etc
• <mode> - avg, count, min, max
• <state> - busy, idle
..................:............ Zabbix Conference 2011](https://image.slidesharecdn.com/alexeivladishev-zabbixperformancetuning-111026222518-phpapp02/75/Zabbix-Performance-Tuning-19-2048.jpg)
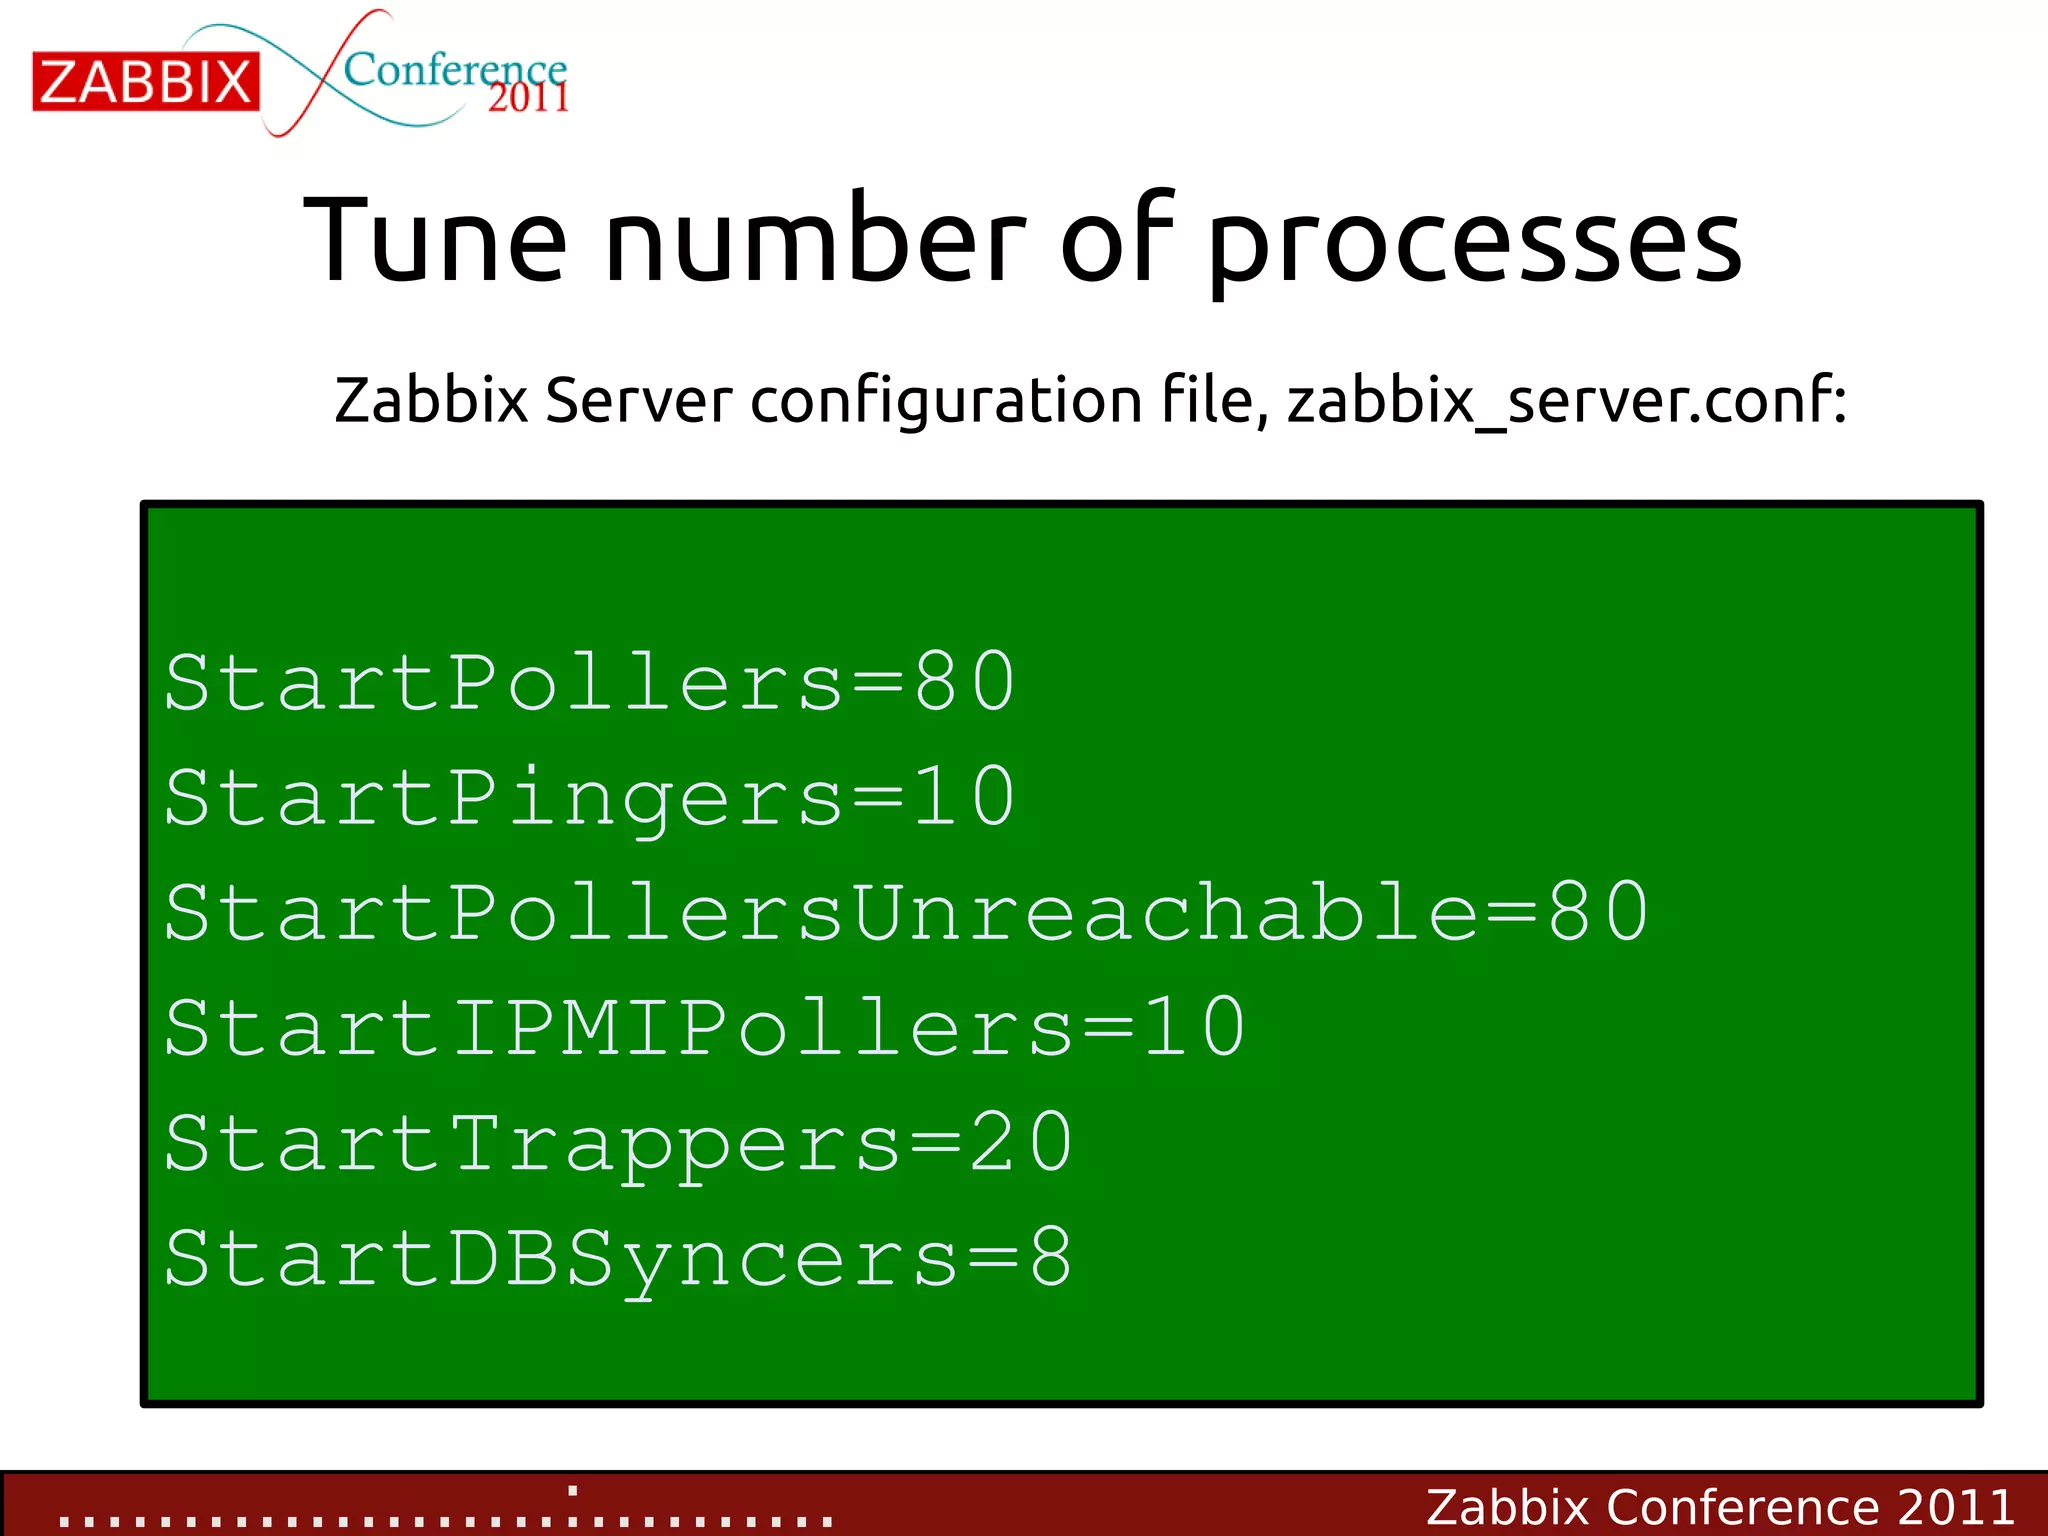

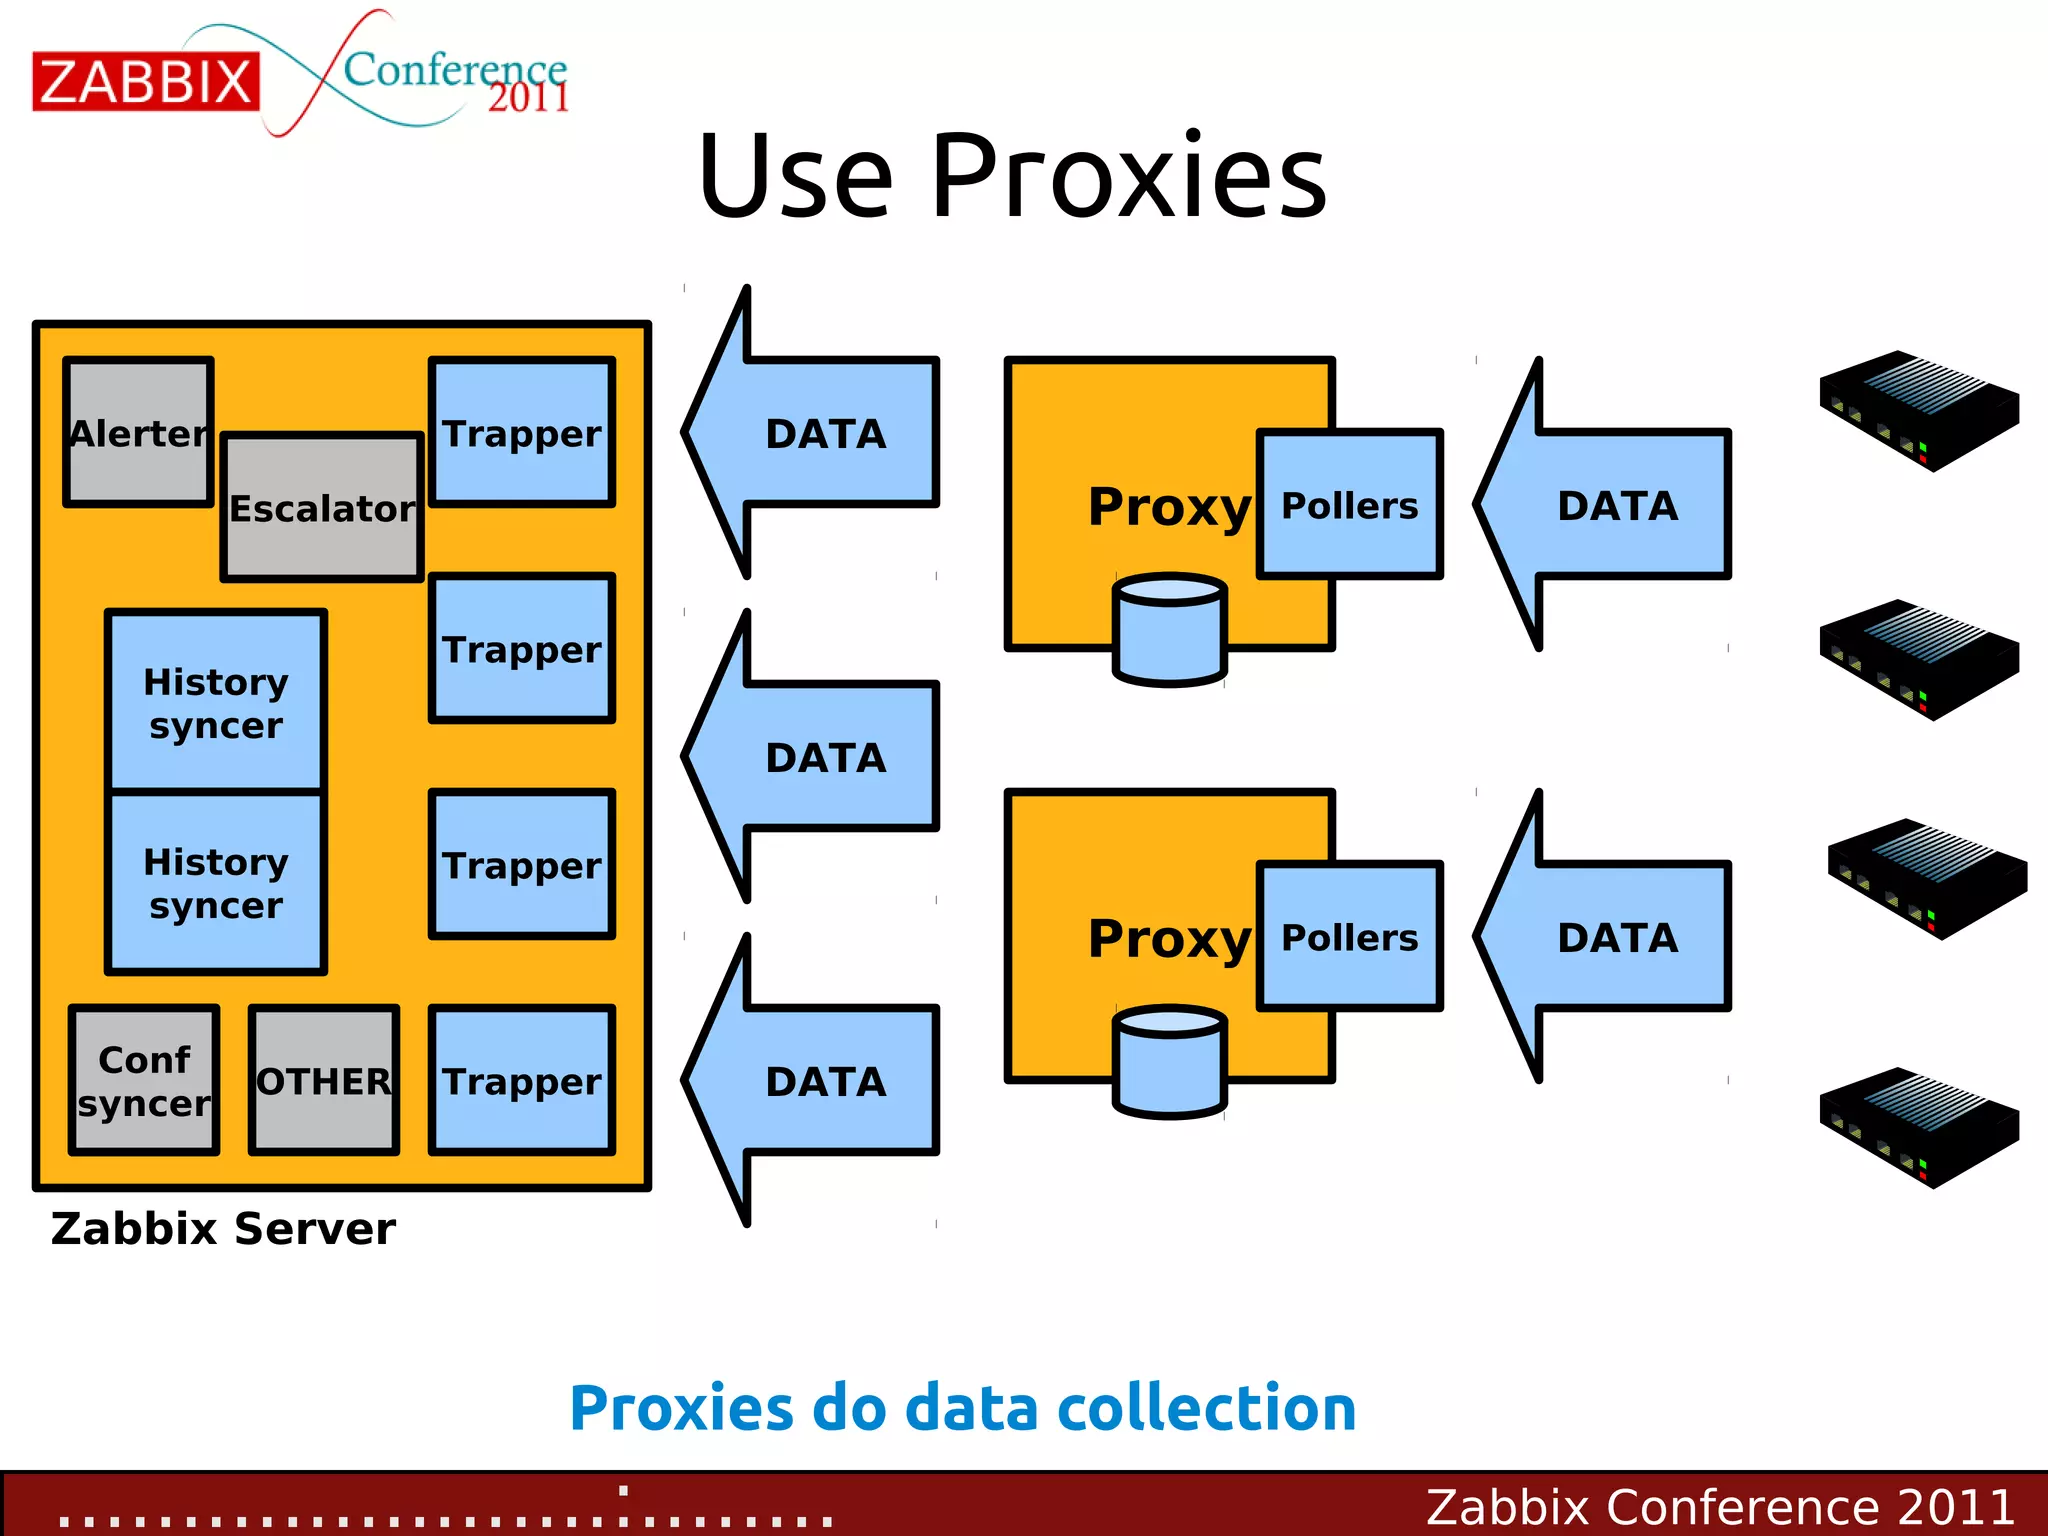

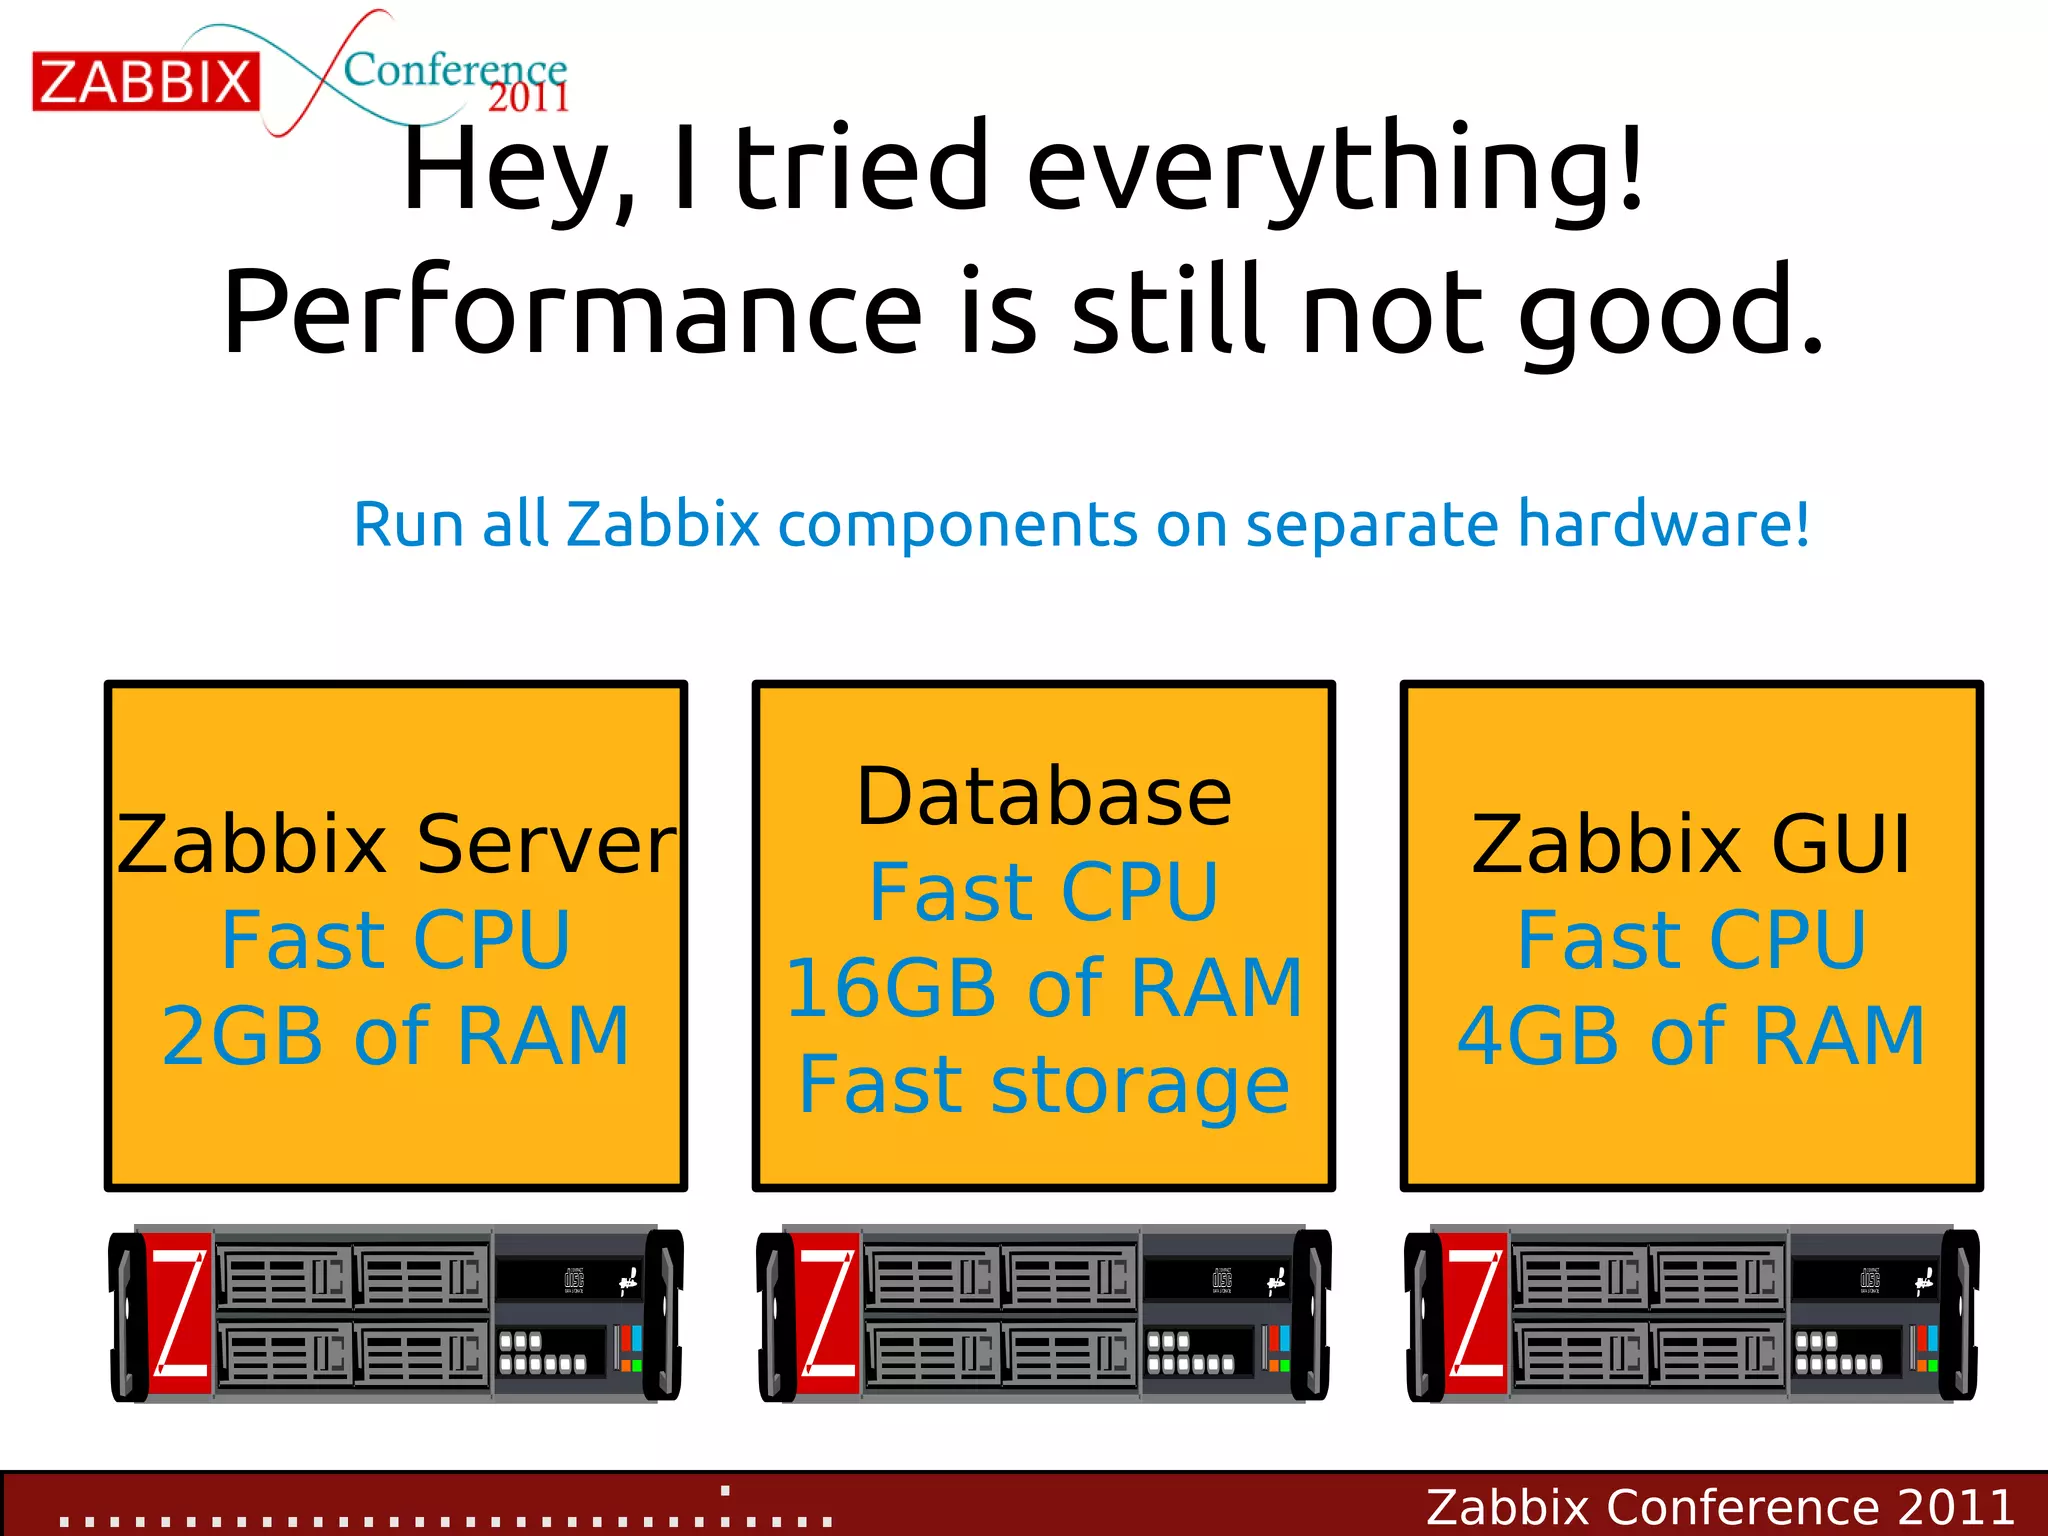


This document summarizes a presentation on optimizing Zabbix performance through tuning. It discusses identifying and fixing common problems like default templates and database settings. Next, it covers tuning Zabbix configuration by adjusting the number of server processes and monitoring internal stats. Additional optimizations include using proxies to distribute load, partitioning historical tables, and running Zabbix components on separate hardware. The summary emphasizes monitoring internal stats, tuning configurations and databases, disabling housekeeping, and reviewing additional reading on tuning MySQL, PostgreSQL and Zabbix internals.


![[오픈소스컨설팅]Day #1 MySQL 엔진소개, 튜닝, 백업 및 복구, 업그레이드방법](https://cdn.slidesharecdn.com/ss_thumbnails/day1mysqlintroduction-141212003401-conversion-gate02-thumbnail.jpg?width=640&height=640&fit=bounds)


![[OpenStack 하반기 스터디] Interoperability with ML2: LinuxBridge, OVS and SDN](https://cdn.slidesharecdn.com/ss_thumbnails/openstackteam5interoperabilitywithml2-151221120433-thumbnail.jpg?width=640&height=640&fit=bounds)


