Download as PDF, PPTX
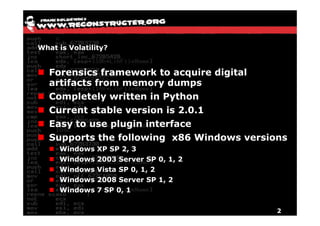
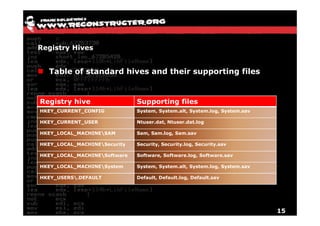
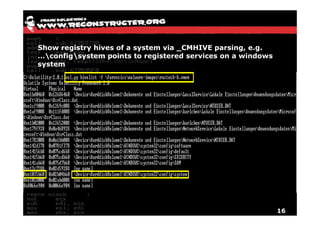
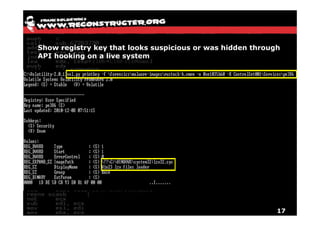
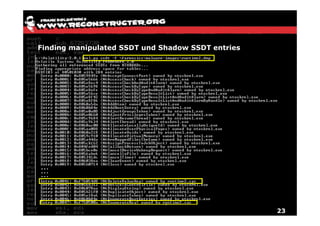
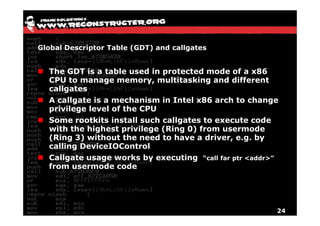
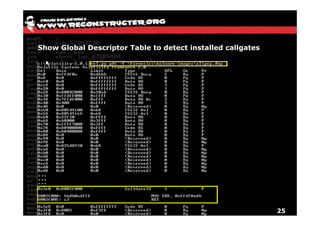
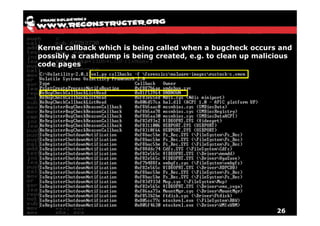
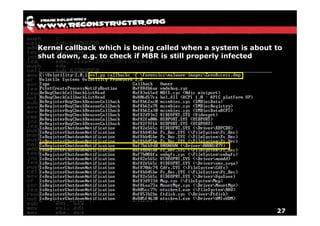
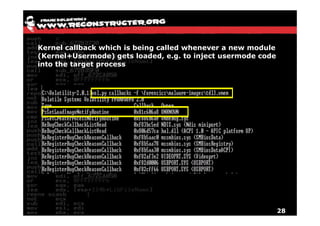
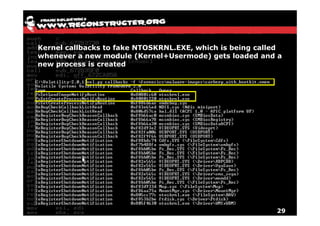
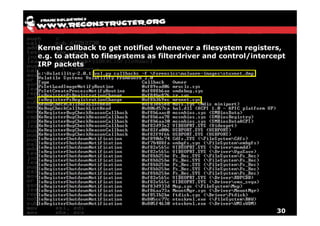


The document discusses Volatility v2.0, a Python-based forensics framework for analyzing memory dumps to detect malware. It explains the advanced scanning techniques used in Volatility to identify malicious activity through various kernel structures and plugins, such as malfind and yara for code injection detection. The conclusion emphasizes the importance of a skilled analyst in effectively using Volatility to discern genuine threats from potential false positives.