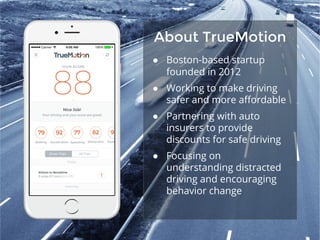
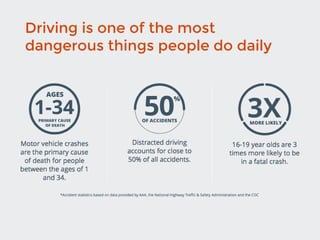
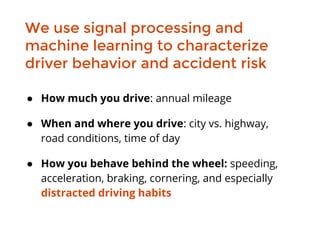
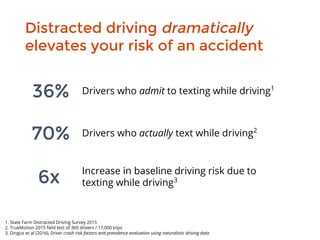
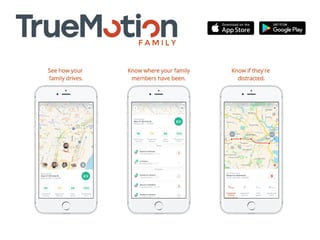
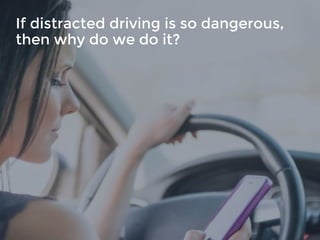
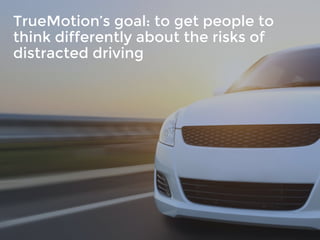
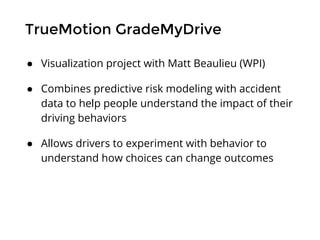
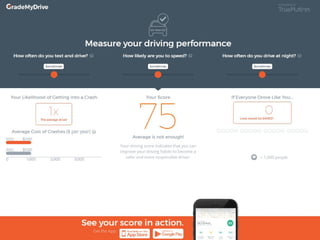
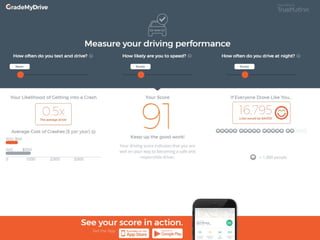
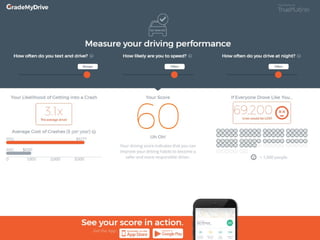
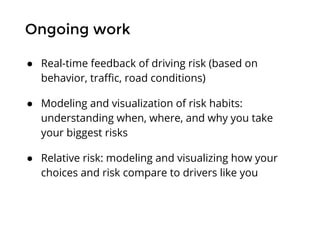
Visualizing Risk: How Data Visualization
Can Help Fight Distracted Driving
Nicholas Arcolano, Ph.D.
Senior Data Scientist, TrueMotion
@arcolano
● Boston-based startup
founded in 2012
● Working to make driving
safer and more affordable
● Partnering with auto
insurers to provide
discounts for safe driving
● Focusing on
understanding distracted
driving and encouraging
behavior change
About TrueMotion
Driving is one of the most
dangerous things people do daily
We use signal processing and
machine learning to characterize
driver behavior and accident risk
● How much you drive: annual mileage
● When and where you drive: city vs. highway,
road conditions, time of day
● How you behave behind the wheel: speeding,
acceleration, braking, cornering, and especially
distracted driving habits
Distracted driving dramatically
elevates your risk of an accident
Drivers who admit to texting while driving1
36%
Drivers who actually text while driving2
70%
Increase in baseline driving risk due to
texting while driving36x
1. State Farm Distracted Driving Survey 2015
2. TrueMotion 2015 field test of 360 drivers / 17,000 trips
3. Dingus et al (2016), Driver crash risk factors and prevalence evaluation using naturalistic driving data
If distracted driving is so dangerous,
then why do we do it?
Let’s take a short detour...
Behavioral economics
● Why do people make
irrational / sub-optimal
decisions?
● Biases: information we
use to make decisions is
often not representative
● Heuristics: we often
approximate hard
decisions with simpler
ones
Biases and heuristics
Optimistic bias / overconfidence
● We often think we have more control over events than we
really do (“illusion of control”)
● Thinking we have too much control while driving can lead us
to make poor decisions while behind the wheel
Availability heuristic
● We estimate true probabilities using the frequencies of our
real-world experiences
● By driving without getting into an accident, we believe driving
is less risky than it actually is
TrueMotion’s goal: to get people to
think differently about the risks of
distracted driving
Data visualization helps counteract
our cognitive biases by allowing us to
explore complex causes and effects
Data visualization can help us to...
● Show drivers how individual choices aggregate
into long-term behavior
● Help drivers understand how their actions
affect their risk of an accident
● Illustrate how changes in risk equate to
real-world consequences
TrueMotion distraction insights
and context
What about understanding
long-term accident risk?
Years You Have Left to Live, Probably
http://flowingdata.com/2015/09/23/years-you-have-left-to-live-probably/
How You Will Die
http://flowingdata.com/2016/01/19/how-you-will-die/
How Other People Die
http://flowingdata.com/2016/01/05/causes-of-death/
TrueMotion GradeMyDrive
● Visualization project with Matt Beaulieu (WPI)
● Combines predictive risk modeling with accident
data to help people understand the impact of their
driving behaviors
● Allows drivers to experiment with behavior to
understand how choices can change outcomes
Ongoing work
● Real-time feedback of driving risk (based on
behavior, traffic, road conditions)
● Modeling and visualization of risk habits:
understanding when, where, and why you take
your biggest risks
● Relative risk: modeling and visualizing how your
choices and risk compare to drivers like you
THANK YOU!

Visualizing Risk (2016 Boston Data Visualization Summit)

  • 1.
    Visualizing Risk: HowData Visualization Can Help Fight Distracted Driving Nicholas Arcolano, Ph.D. Senior Data Scientist, TrueMotion @arcolano
  • 2.
    ● Boston-based startup foundedin 2012 ● Working to make driving safer and more affordable ● Partnering with auto insurers to provide discounts for safe driving ● Focusing on understanding distracted driving and encouraging behavior change About TrueMotion
  • 3.
    Driving is oneof the most dangerous things people do daily
  • 4.
    We use signalprocessing and machine learning to characterize driver behavior and accident risk ● How much you drive: annual mileage ● When and where you drive: city vs. highway, road conditions, time of day ● How you behave behind the wheel: speeding, acceleration, braking, cornering, and especially distracted driving habits
  • 5.
    Distracted driving dramatically elevatesyour risk of an accident Drivers who admit to texting while driving1 36% Drivers who actually text while driving2 70% Increase in baseline driving risk due to texting while driving36x 1. State Farm Distracted Driving Survey 2015 2. TrueMotion 2015 field test of 360 drivers / 17,000 trips 3. Dingus et al (2016), Driver crash risk factors and prevalence evaluation using naturalistic driving data
  • 7.
    If distracted drivingis so dangerous, then why do we do it?
  • 8.
    Let’s take ashort detour...
  • 9.
    Behavioral economics ● Whydo people make irrational / sub-optimal decisions? ● Biases: information we use to make decisions is often not representative ● Heuristics: we often approximate hard decisions with simpler ones
  • 10.
    Biases and heuristics Optimisticbias / overconfidence ● We often think we have more control over events than we really do (“illusion of control”) ● Thinking we have too much control while driving can lead us to make poor decisions while behind the wheel Availability heuristic ● We estimate true probabilities using the frequencies of our real-world experiences ● By driving without getting into an accident, we believe driving is less risky than it actually is
  • 11.
    TrueMotion’s goal: toget people to think differently about the risks of distracted driving
  • 12.
    Data visualization helpscounteract our cognitive biases by allowing us to explore complex causes and effects
  • 13.
    Data visualization canhelp us to... ● Show drivers how individual choices aggregate into long-term behavior ● Help drivers understand how their actions affect their risk of an accident ● Illustrate how changes in risk equate to real-world consequences
  • 14.
  • 15.
  • 16.
    Years You HaveLeft to Live, Probably http://flowingdata.com/2015/09/23/years-you-have-left-to-live-probably/
  • 17.
    How You WillDie http://flowingdata.com/2016/01/19/how-you-will-die/
  • 18.
    How Other PeopleDie http://flowingdata.com/2016/01/05/causes-of-death/
  • 19.
    TrueMotion GradeMyDrive ● Visualizationproject with Matt Beaulieu (WPI) ● Combines predictive risk modeling with accident data to help people understand the impact of their driving behaviors ● Allows drivers to experiment with behavior to understand how choices can change outcomes
  • 23.
    Ongoing work ● Real-timefeedback of driving risk (based on behavior, traffic, road conditions) ● Modeling and visualization of risk habits: understanding when, where, and why you take your biggest risks ● Relative risk: modeling and visualizing how your choices and risk compare to drivers like you
  • 24.