Download to read offline

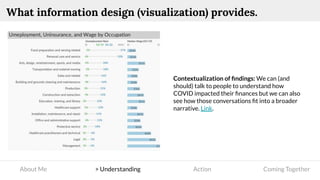
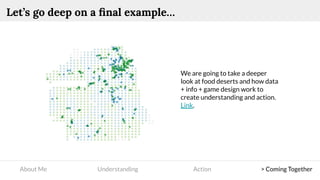
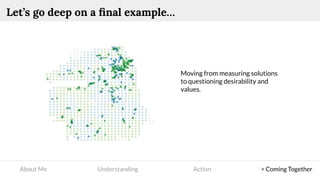


The document discusses the intersection of information design, systems design, and game design to improve understanding and action within complex systems, particularly regarding sustainable protein production and human behavior. It emphasizes the importance of visualizing data to contextualize experiences and facilitate decision-making in collaborative environments. The text also highlights various tools and examples that merge qualitative and quantitative approaches to address real-world problems.


