Downloaded 16 times


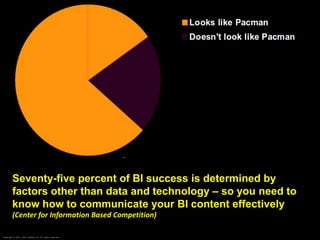


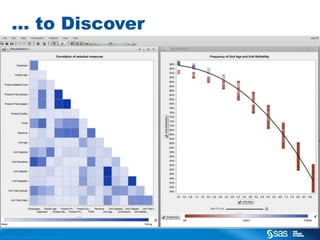
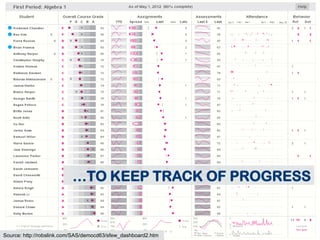
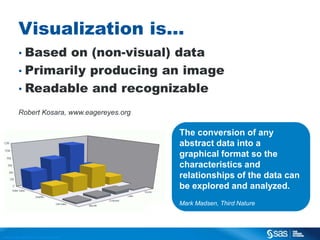
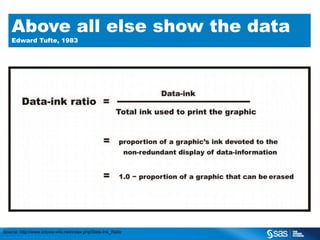
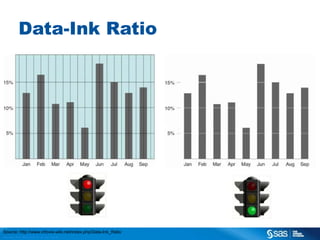
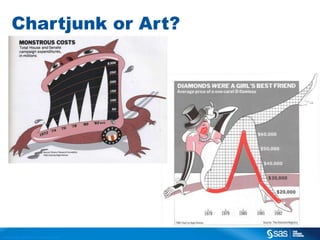
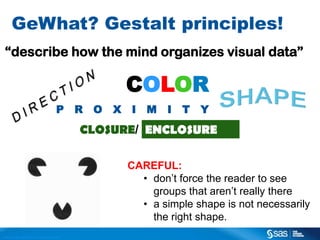

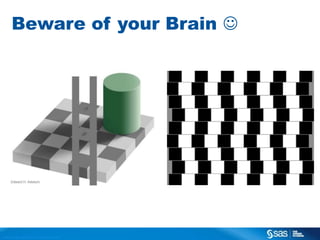
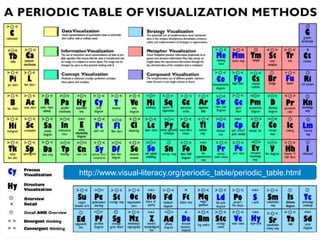


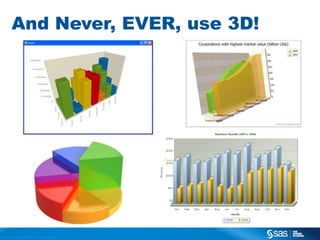
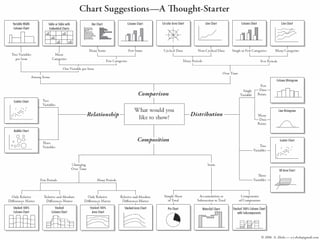
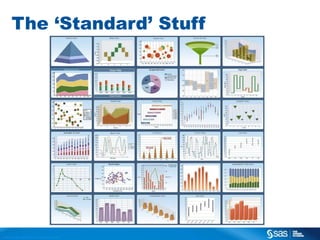
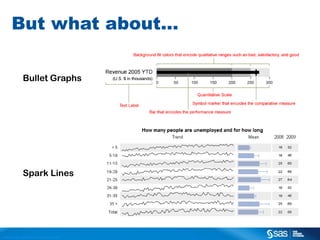
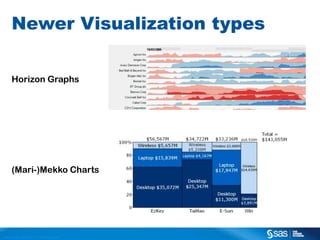
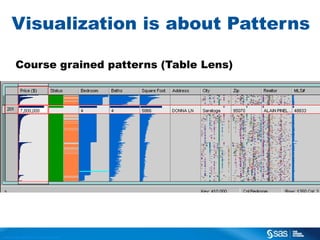
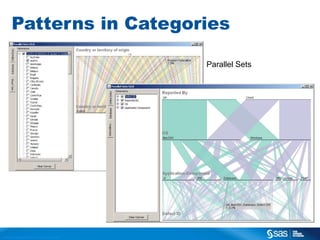
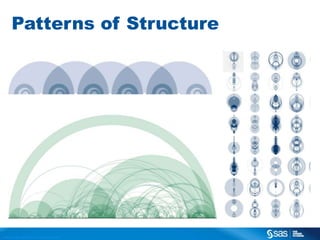
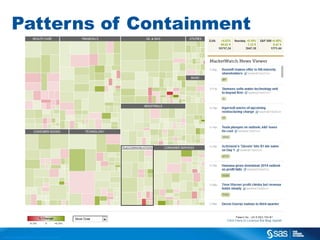
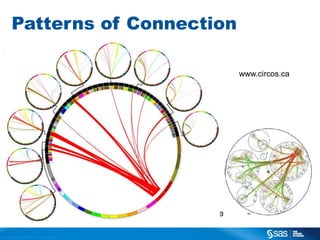
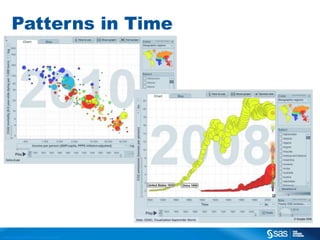
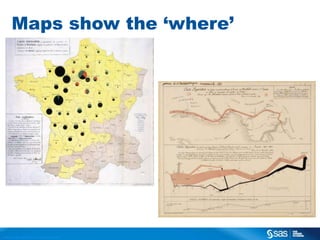

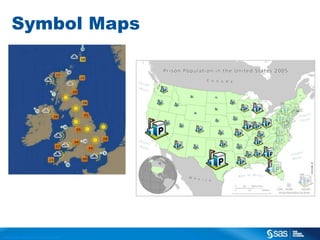
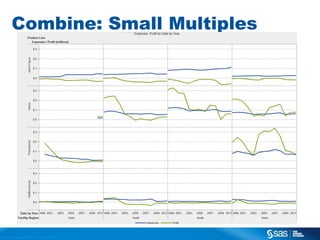


The document discusses visualization techniques for business intelligence projects. It notes that 70-80% of BI projects fail and that 75% of BI success is determined by non-data factors like effective communication. Visualization is important for communication as 70% of human sensory receptors are in the eyes. The document covers best practices and guidelines for visualization including using the appropriate chart type, avoiding chartjunk, leveraging Gestalt principles, and showing data patterns through techniques like maps, small multiples and connected graphs. Effective visualization is key to discovery, display and success of BI projects.


![[db tech showcase Tokyo 2015] A14:Amazon Redshiftの元となったスケールアウト型カラムナーDB徹底解説 その...](https://cdn.slidesharecdn.com/ss_thumbnails/dbts-tokyo-2015a14actian-matrix-insight-technology-150618094408-lva1-app6891-thumbnail.jpg?width=640&height=640&fit=bounds)