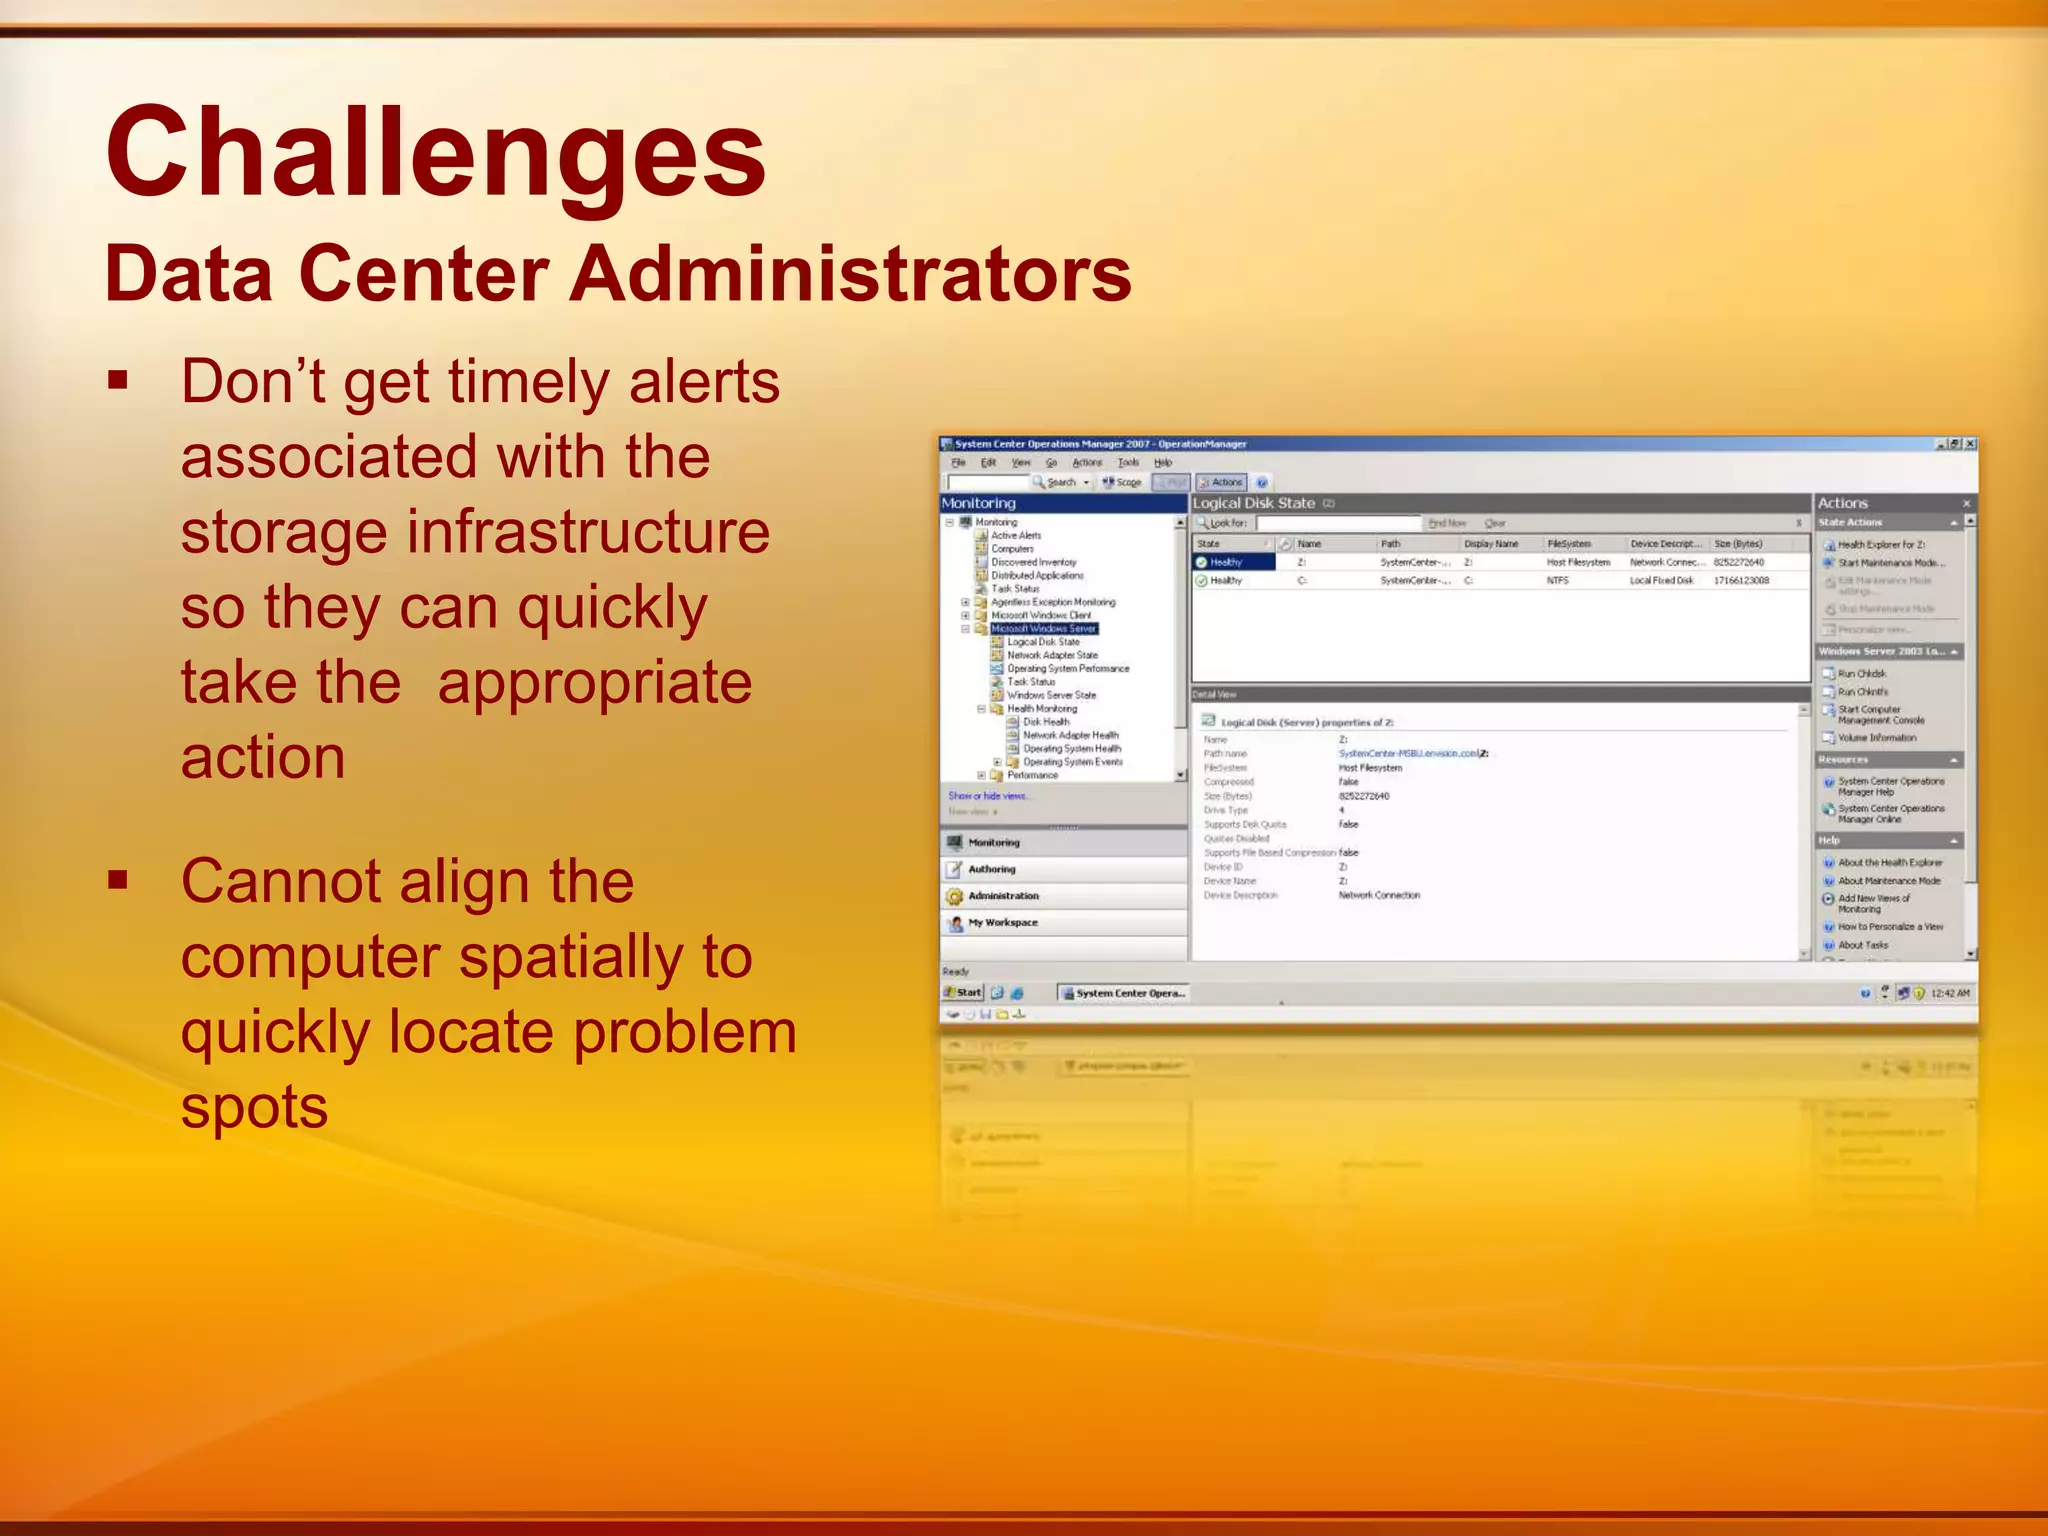
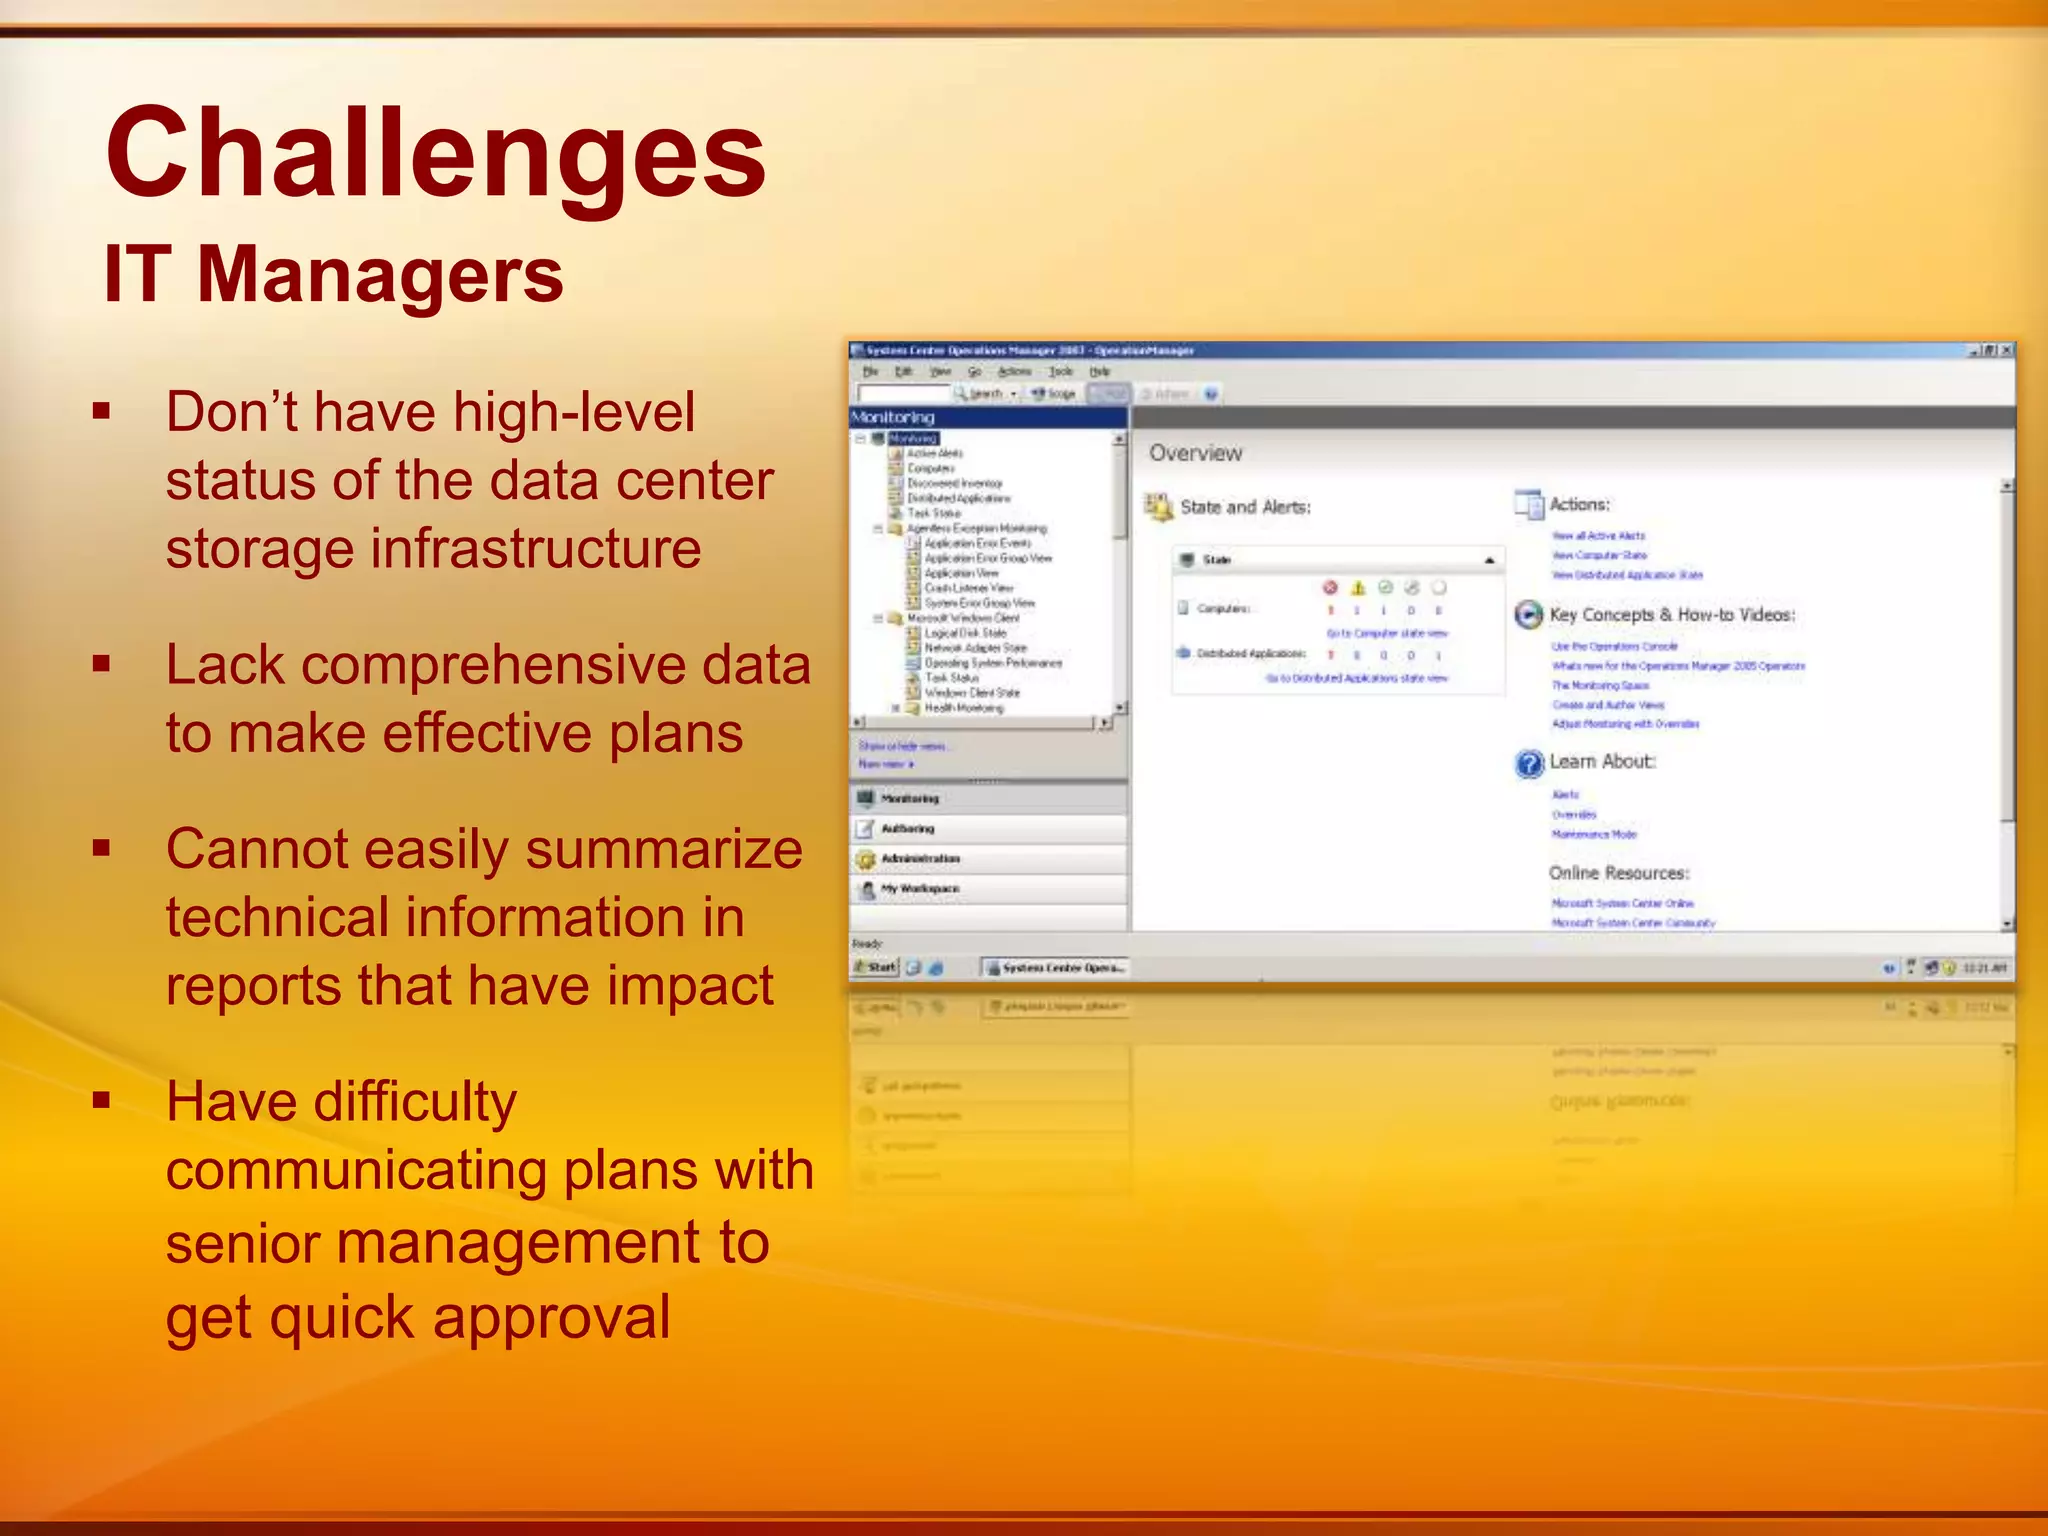
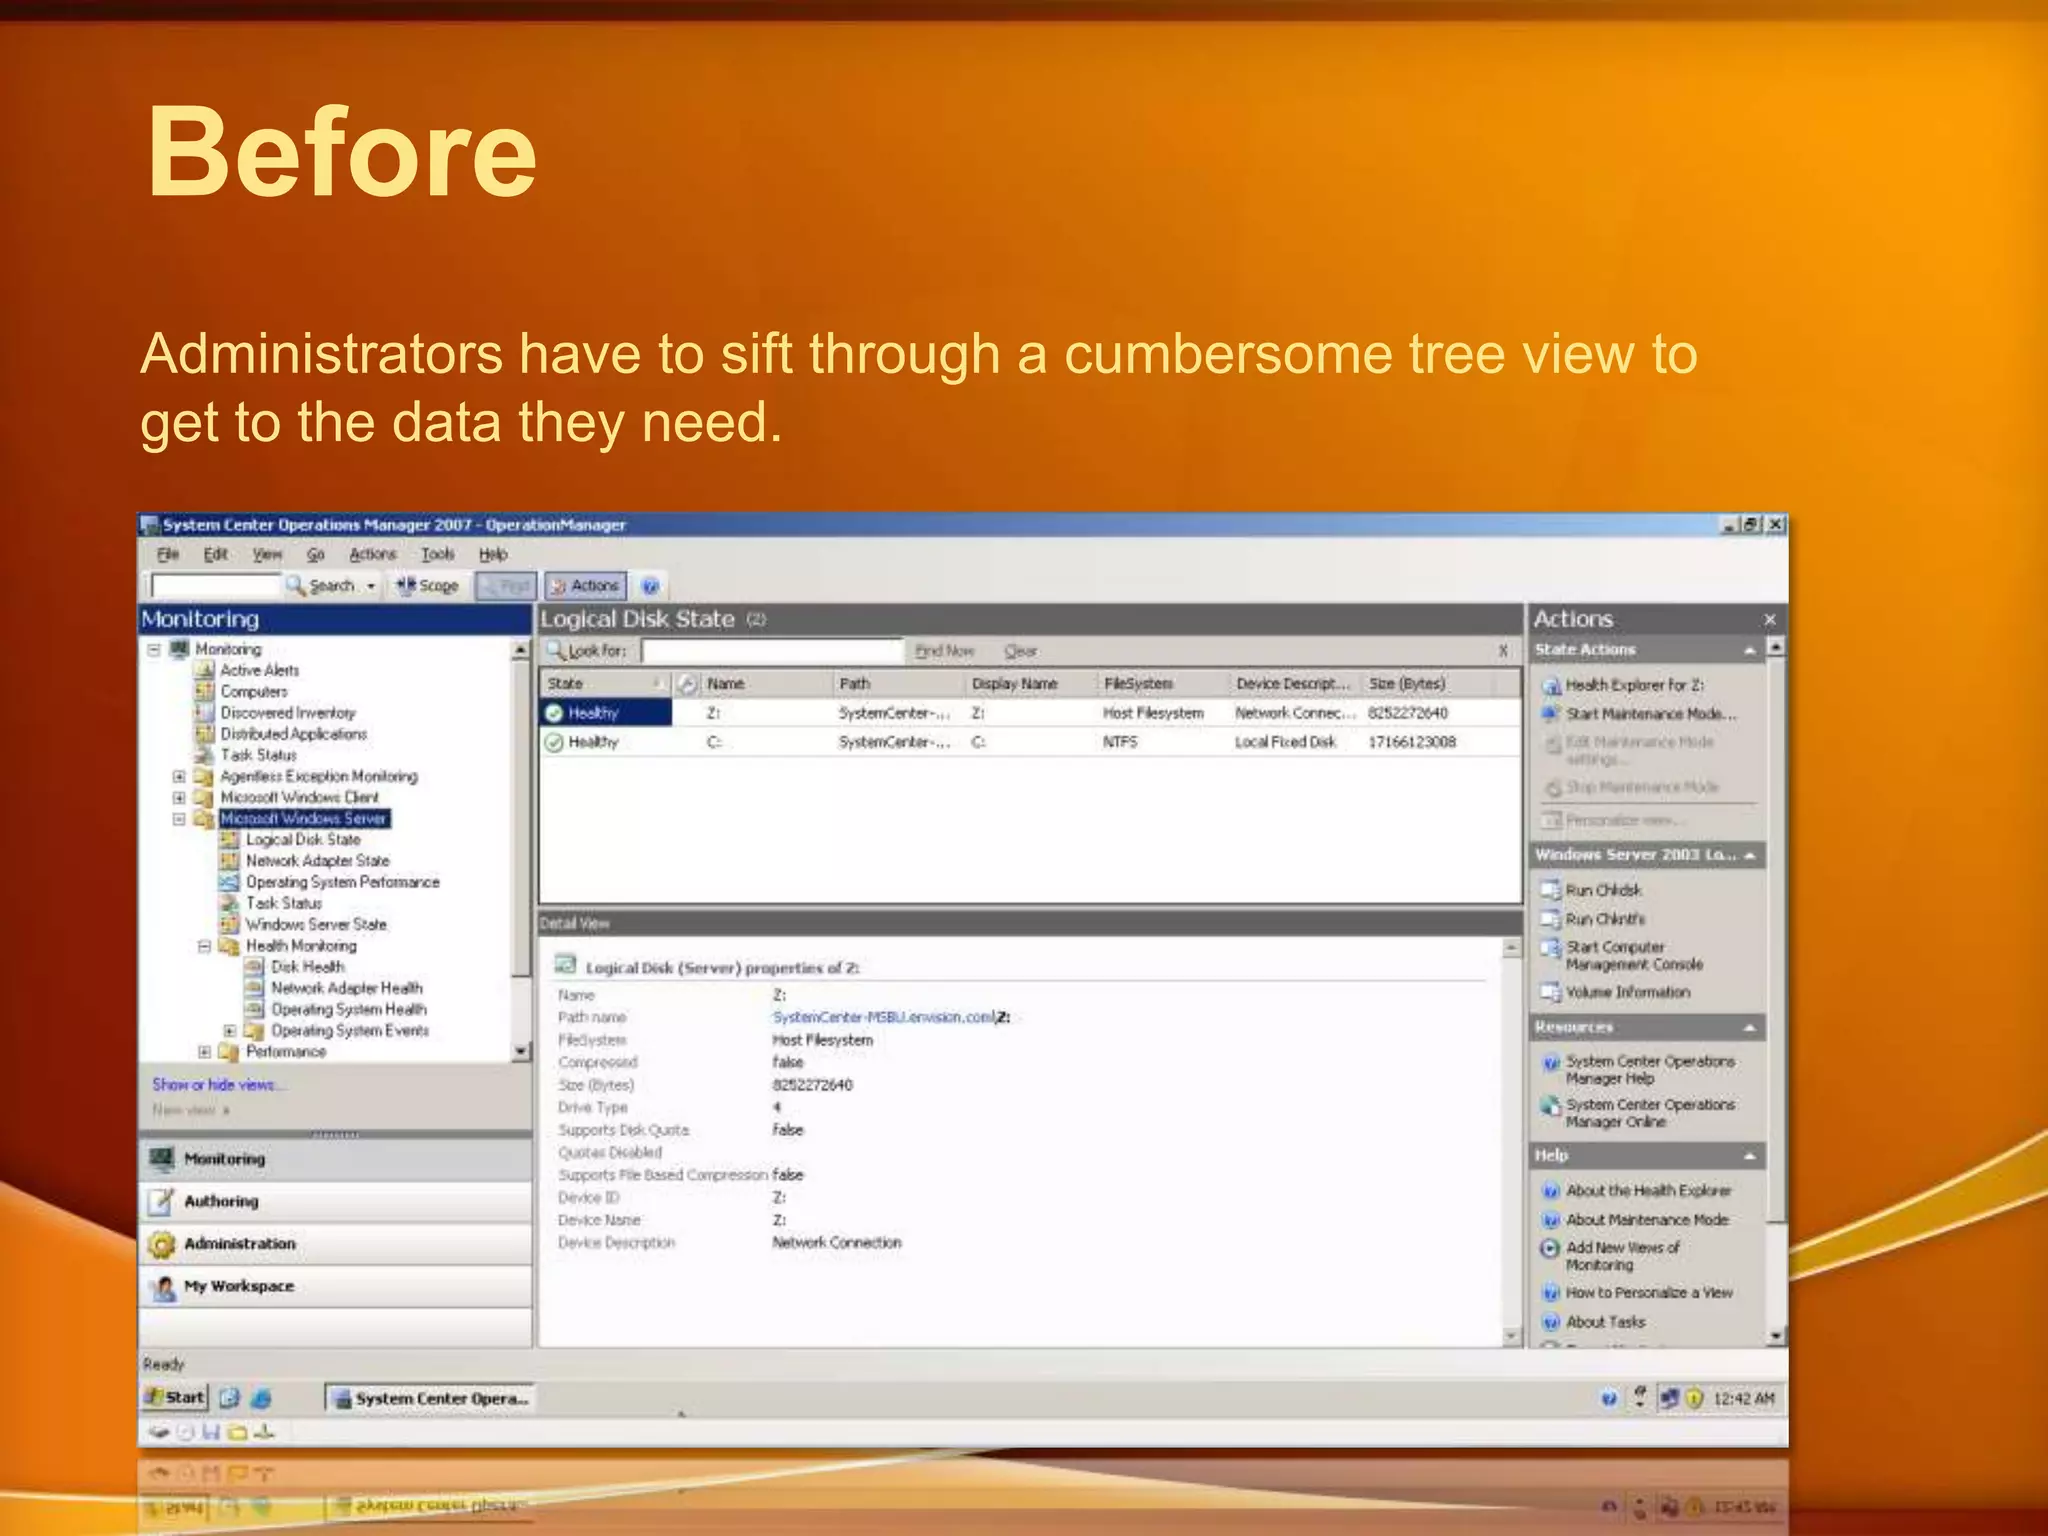
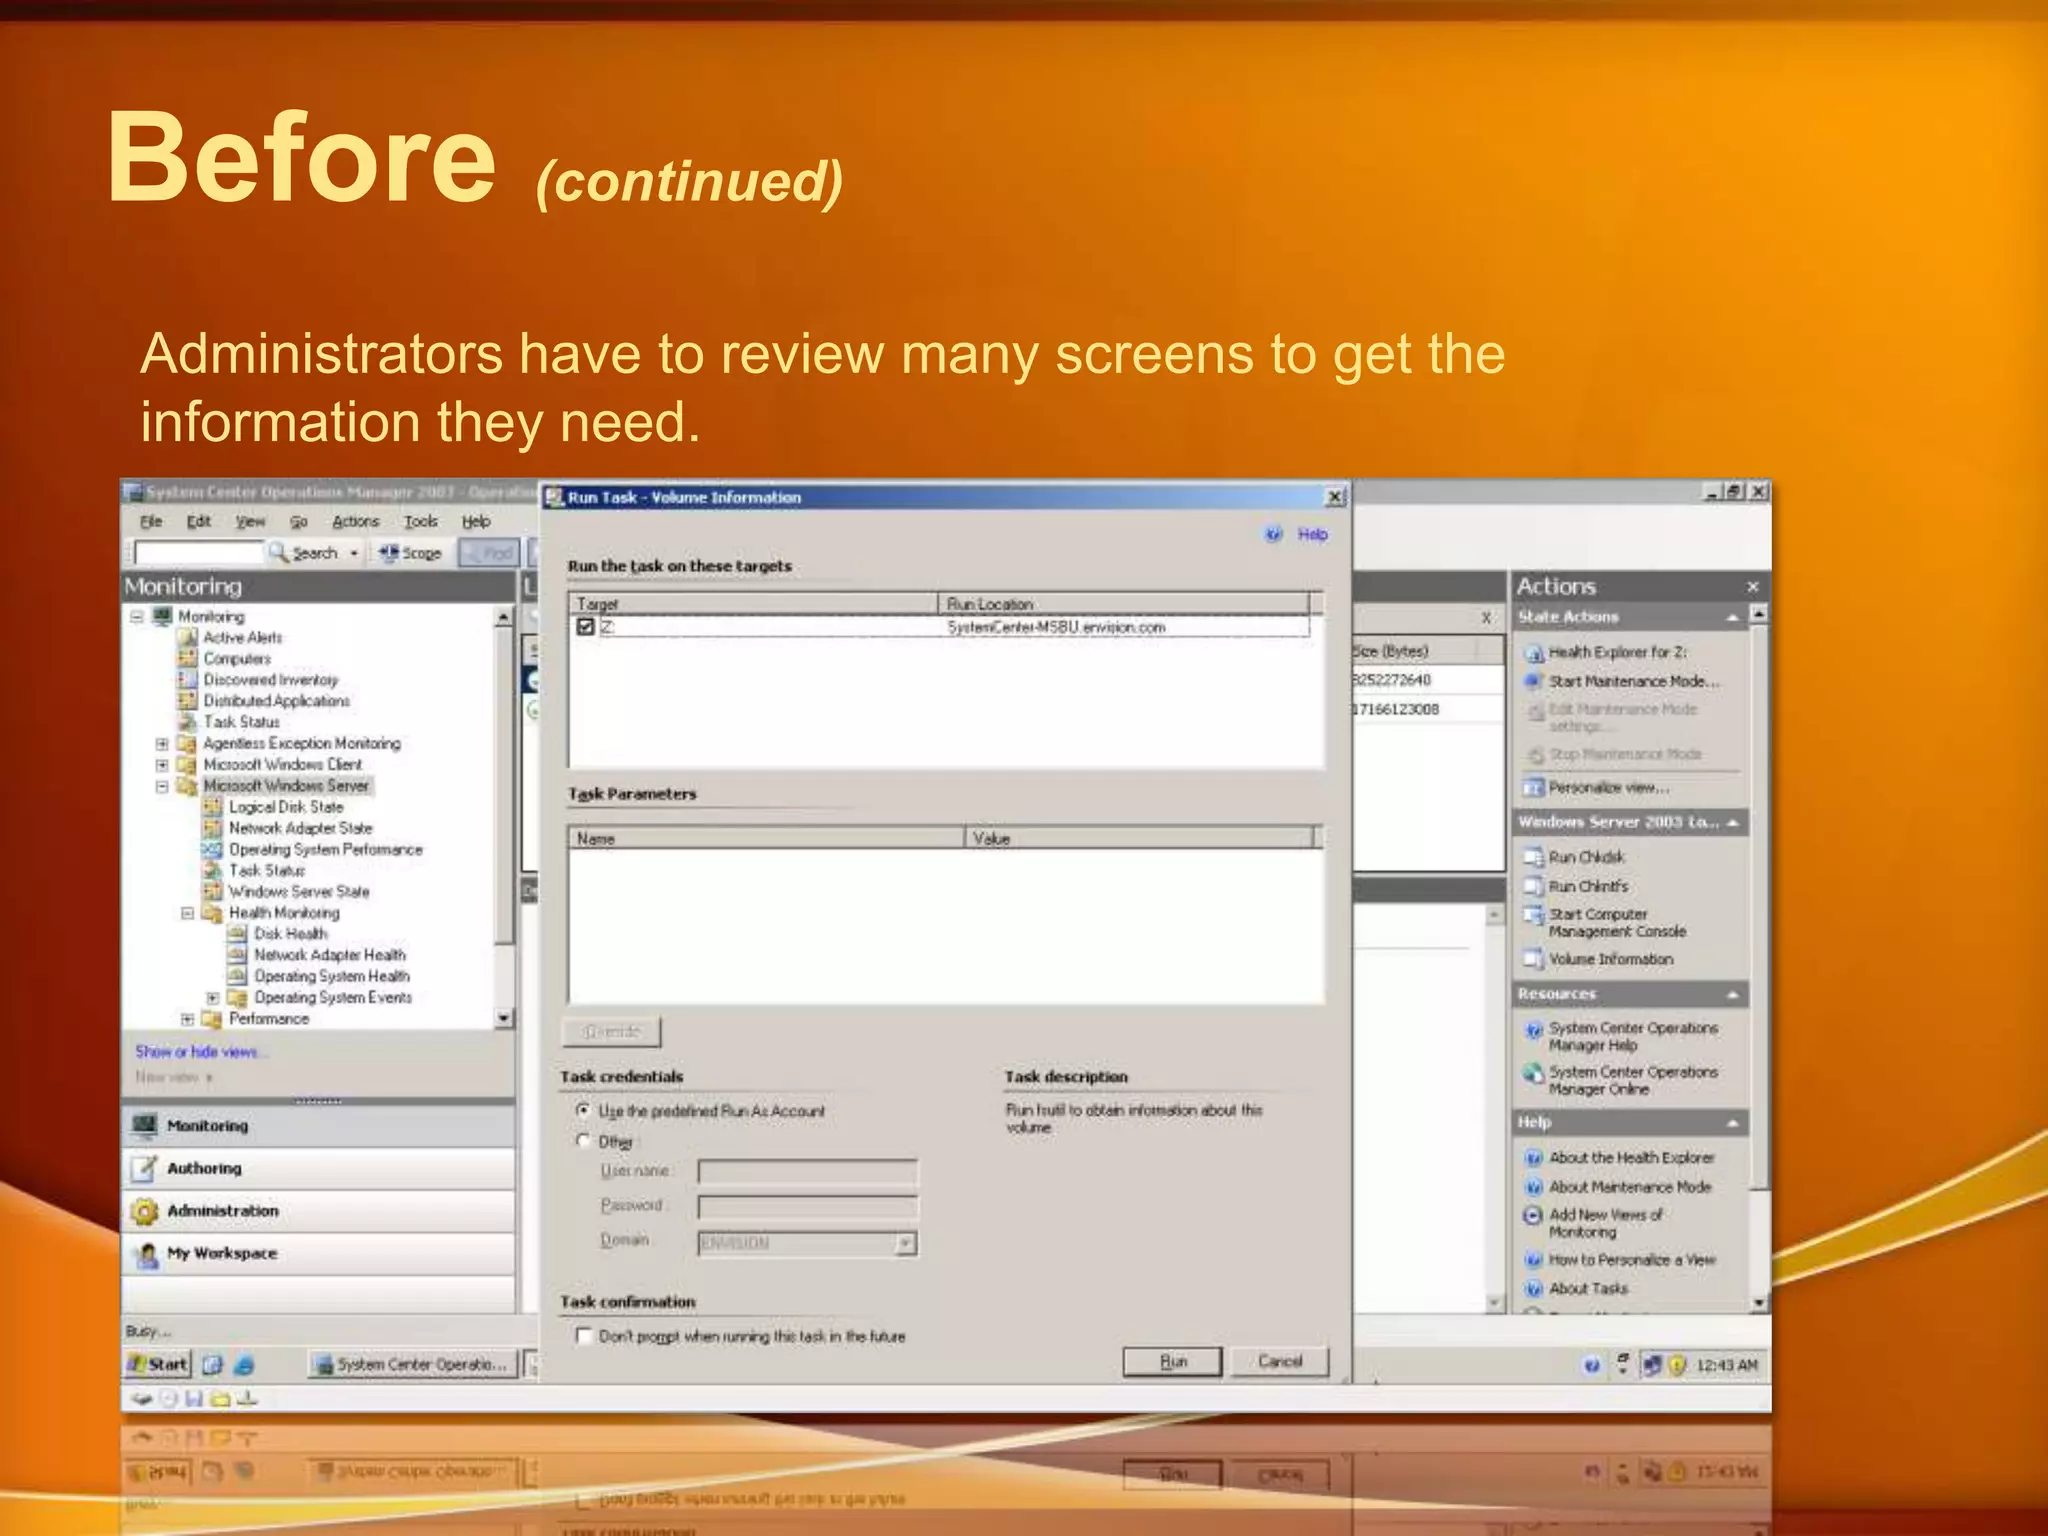
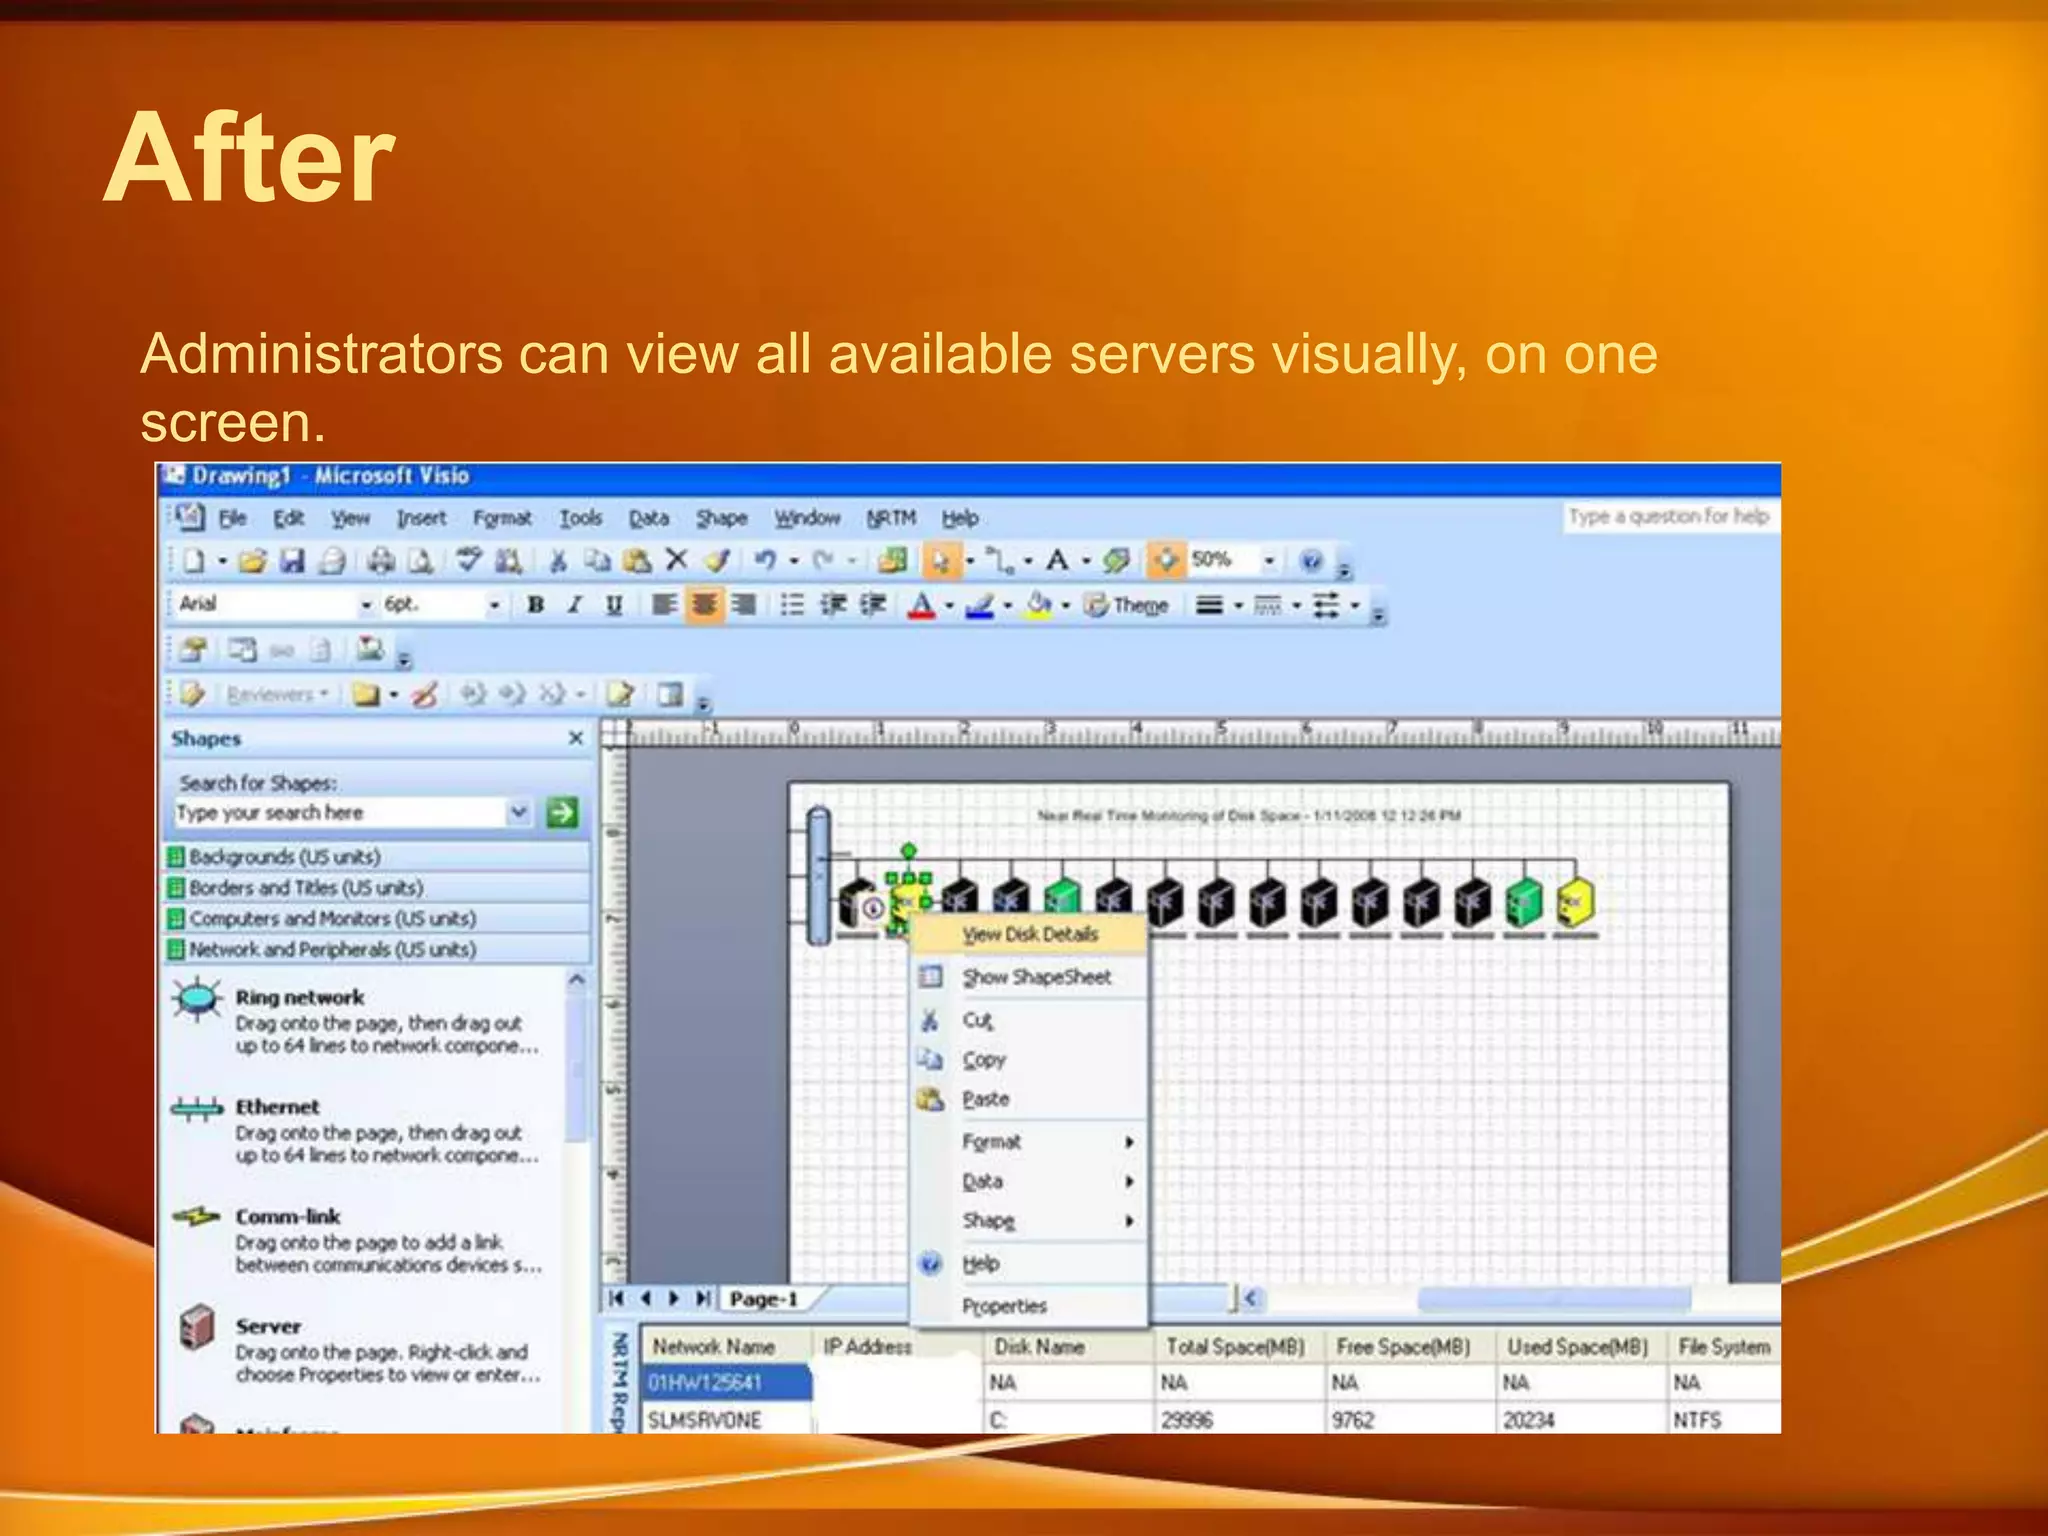
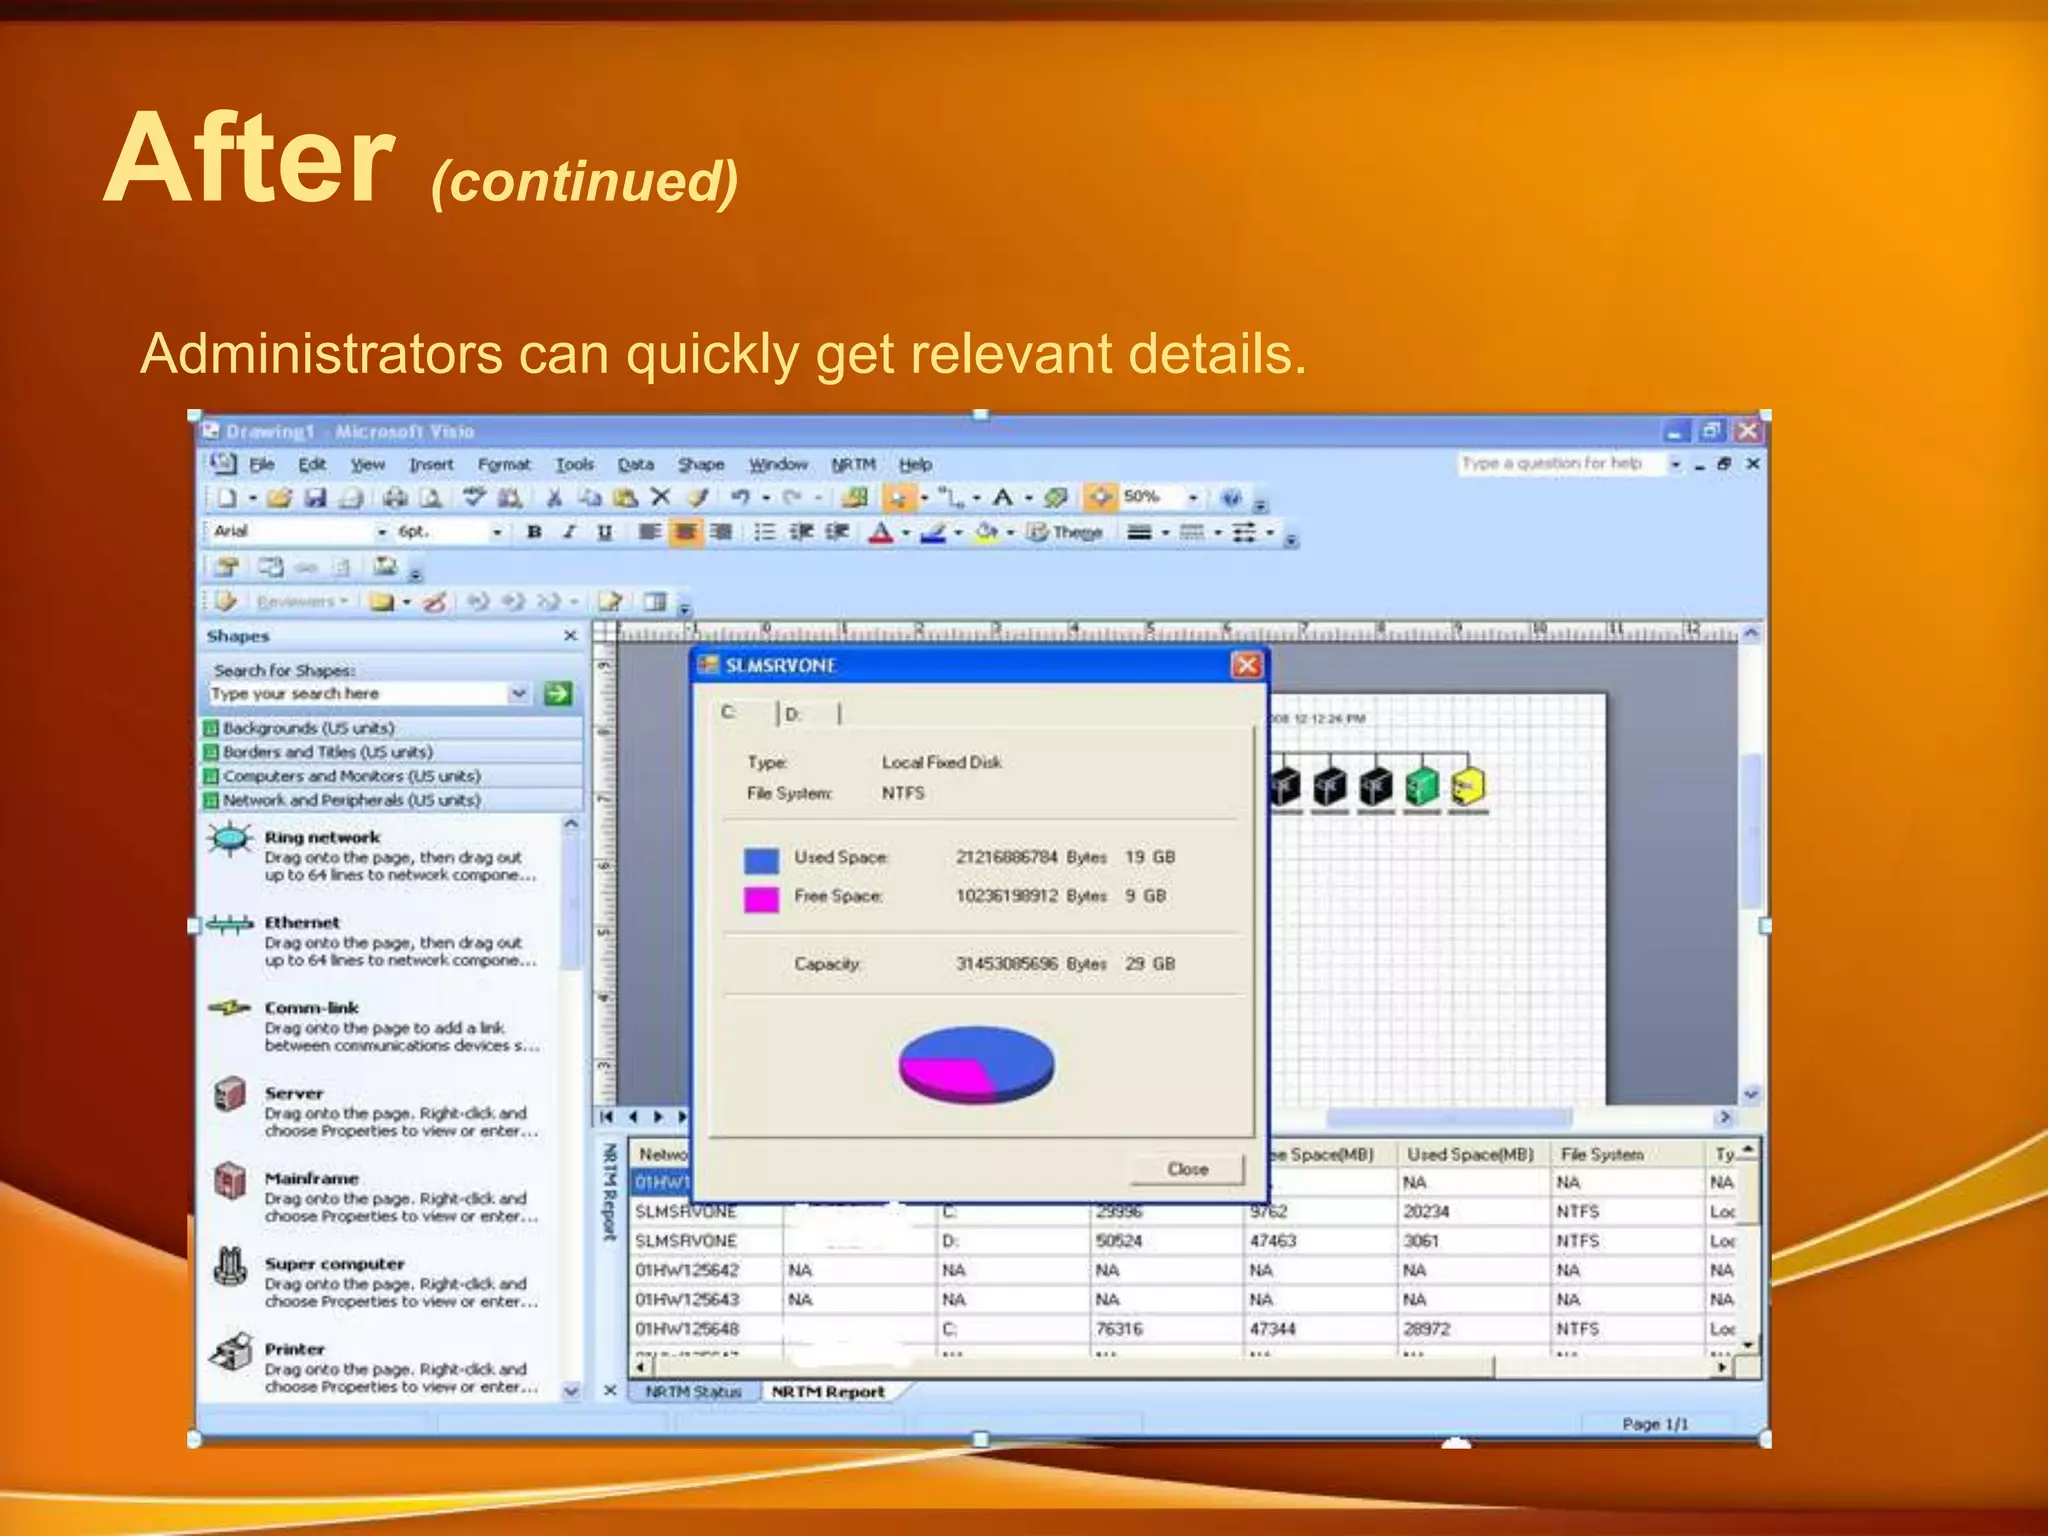
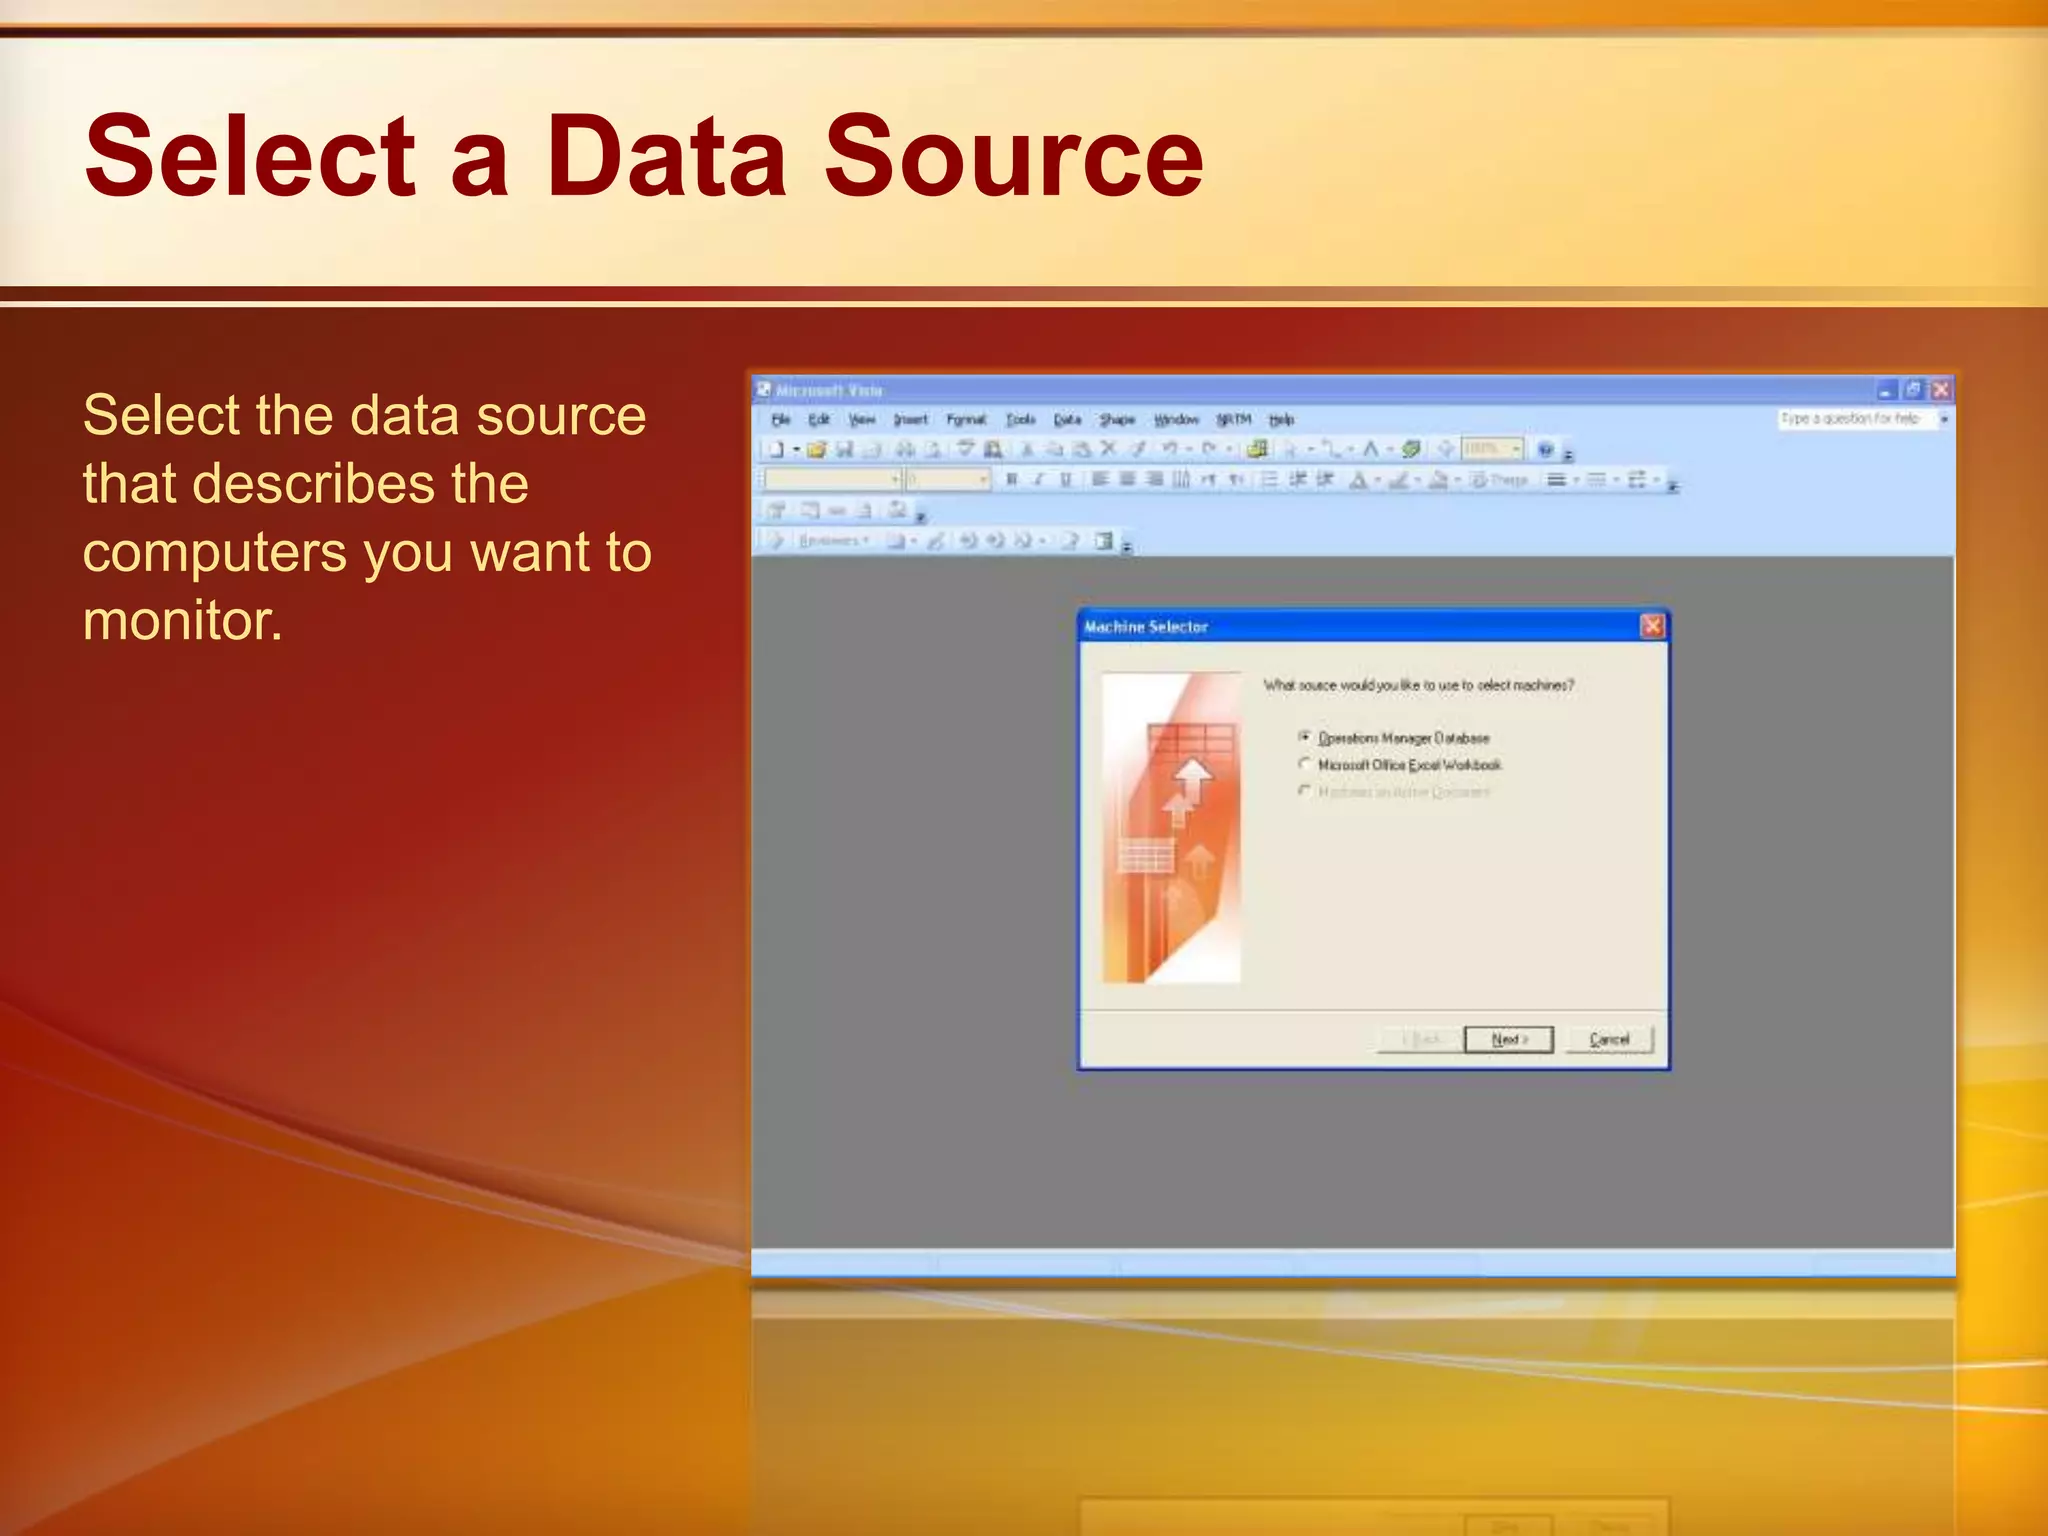
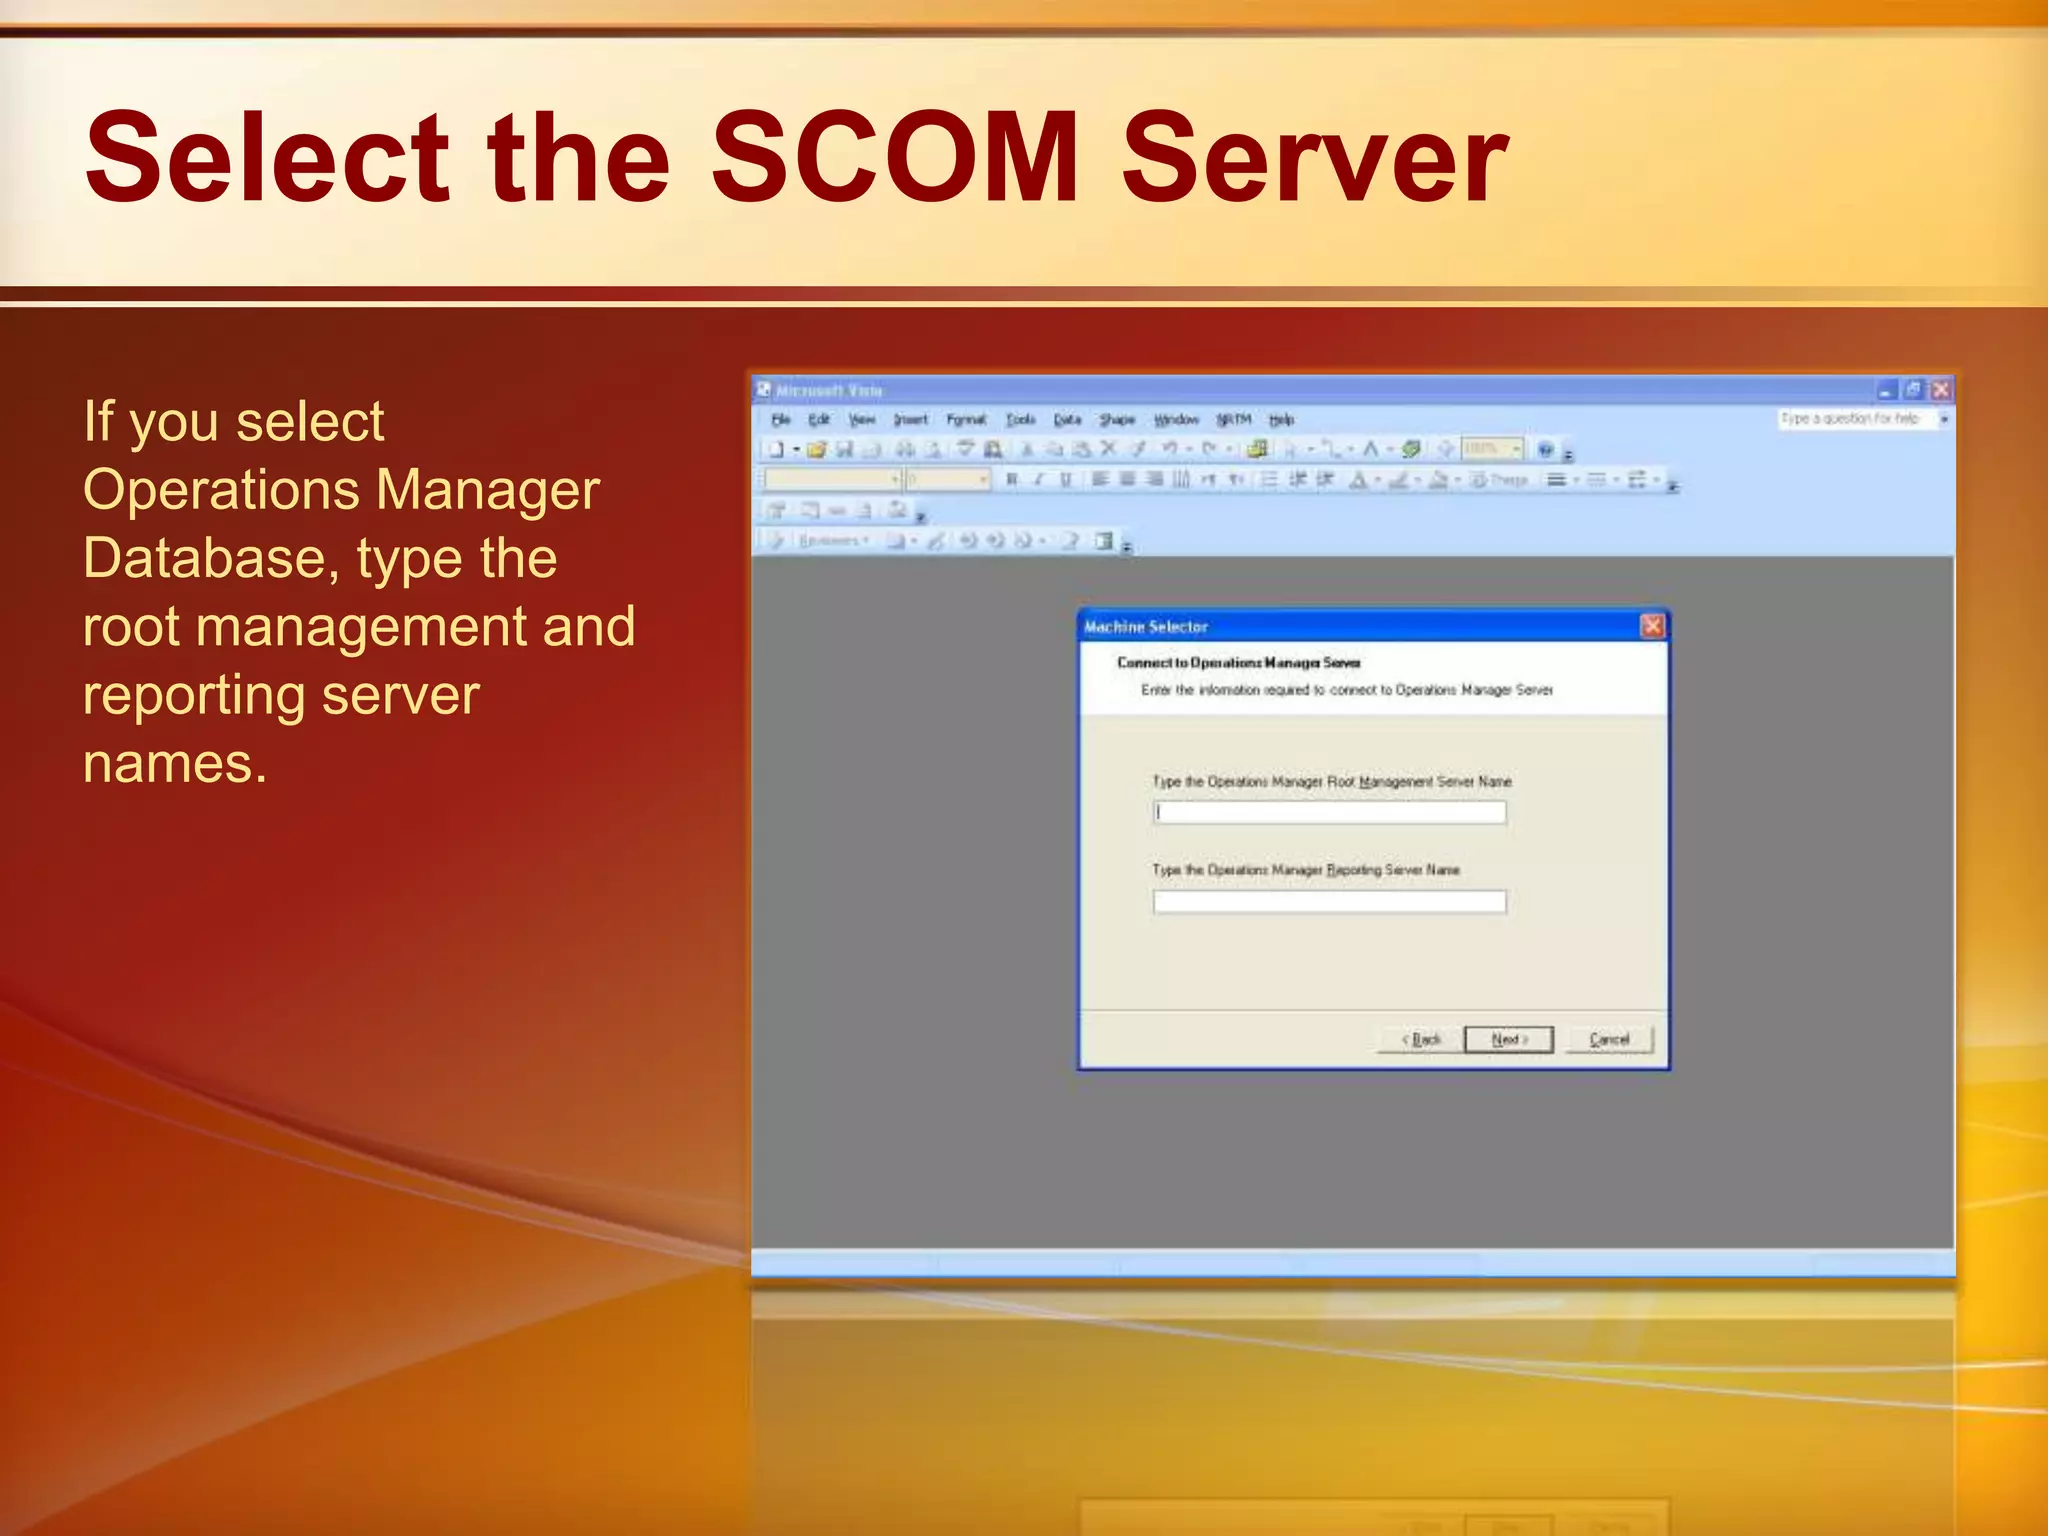
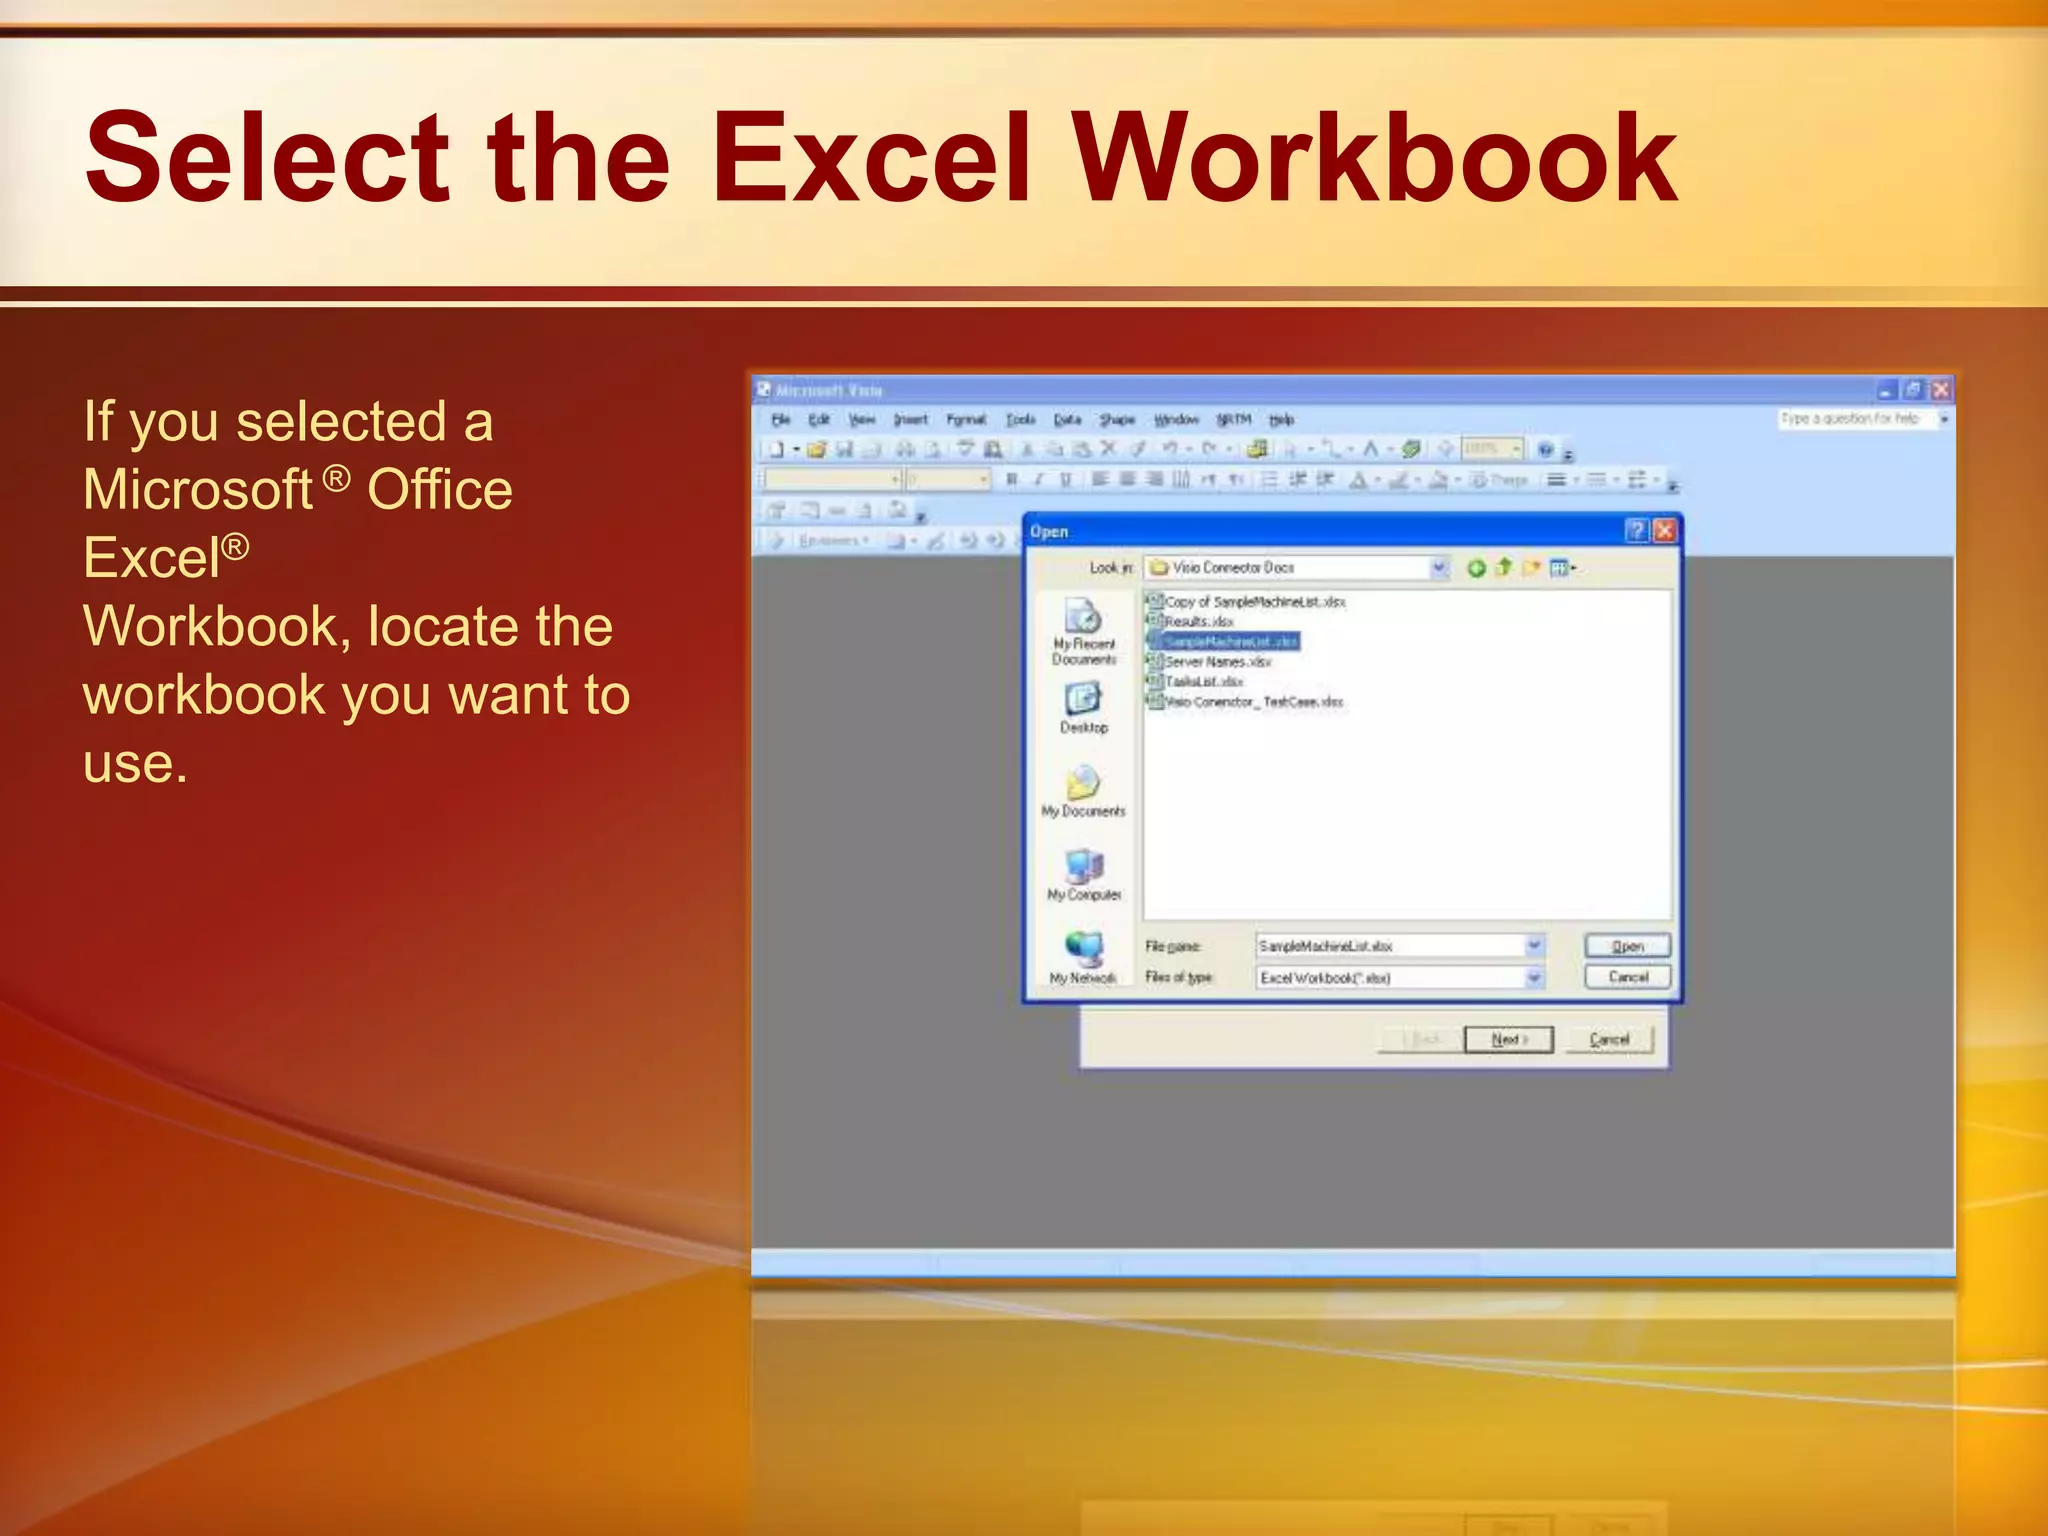
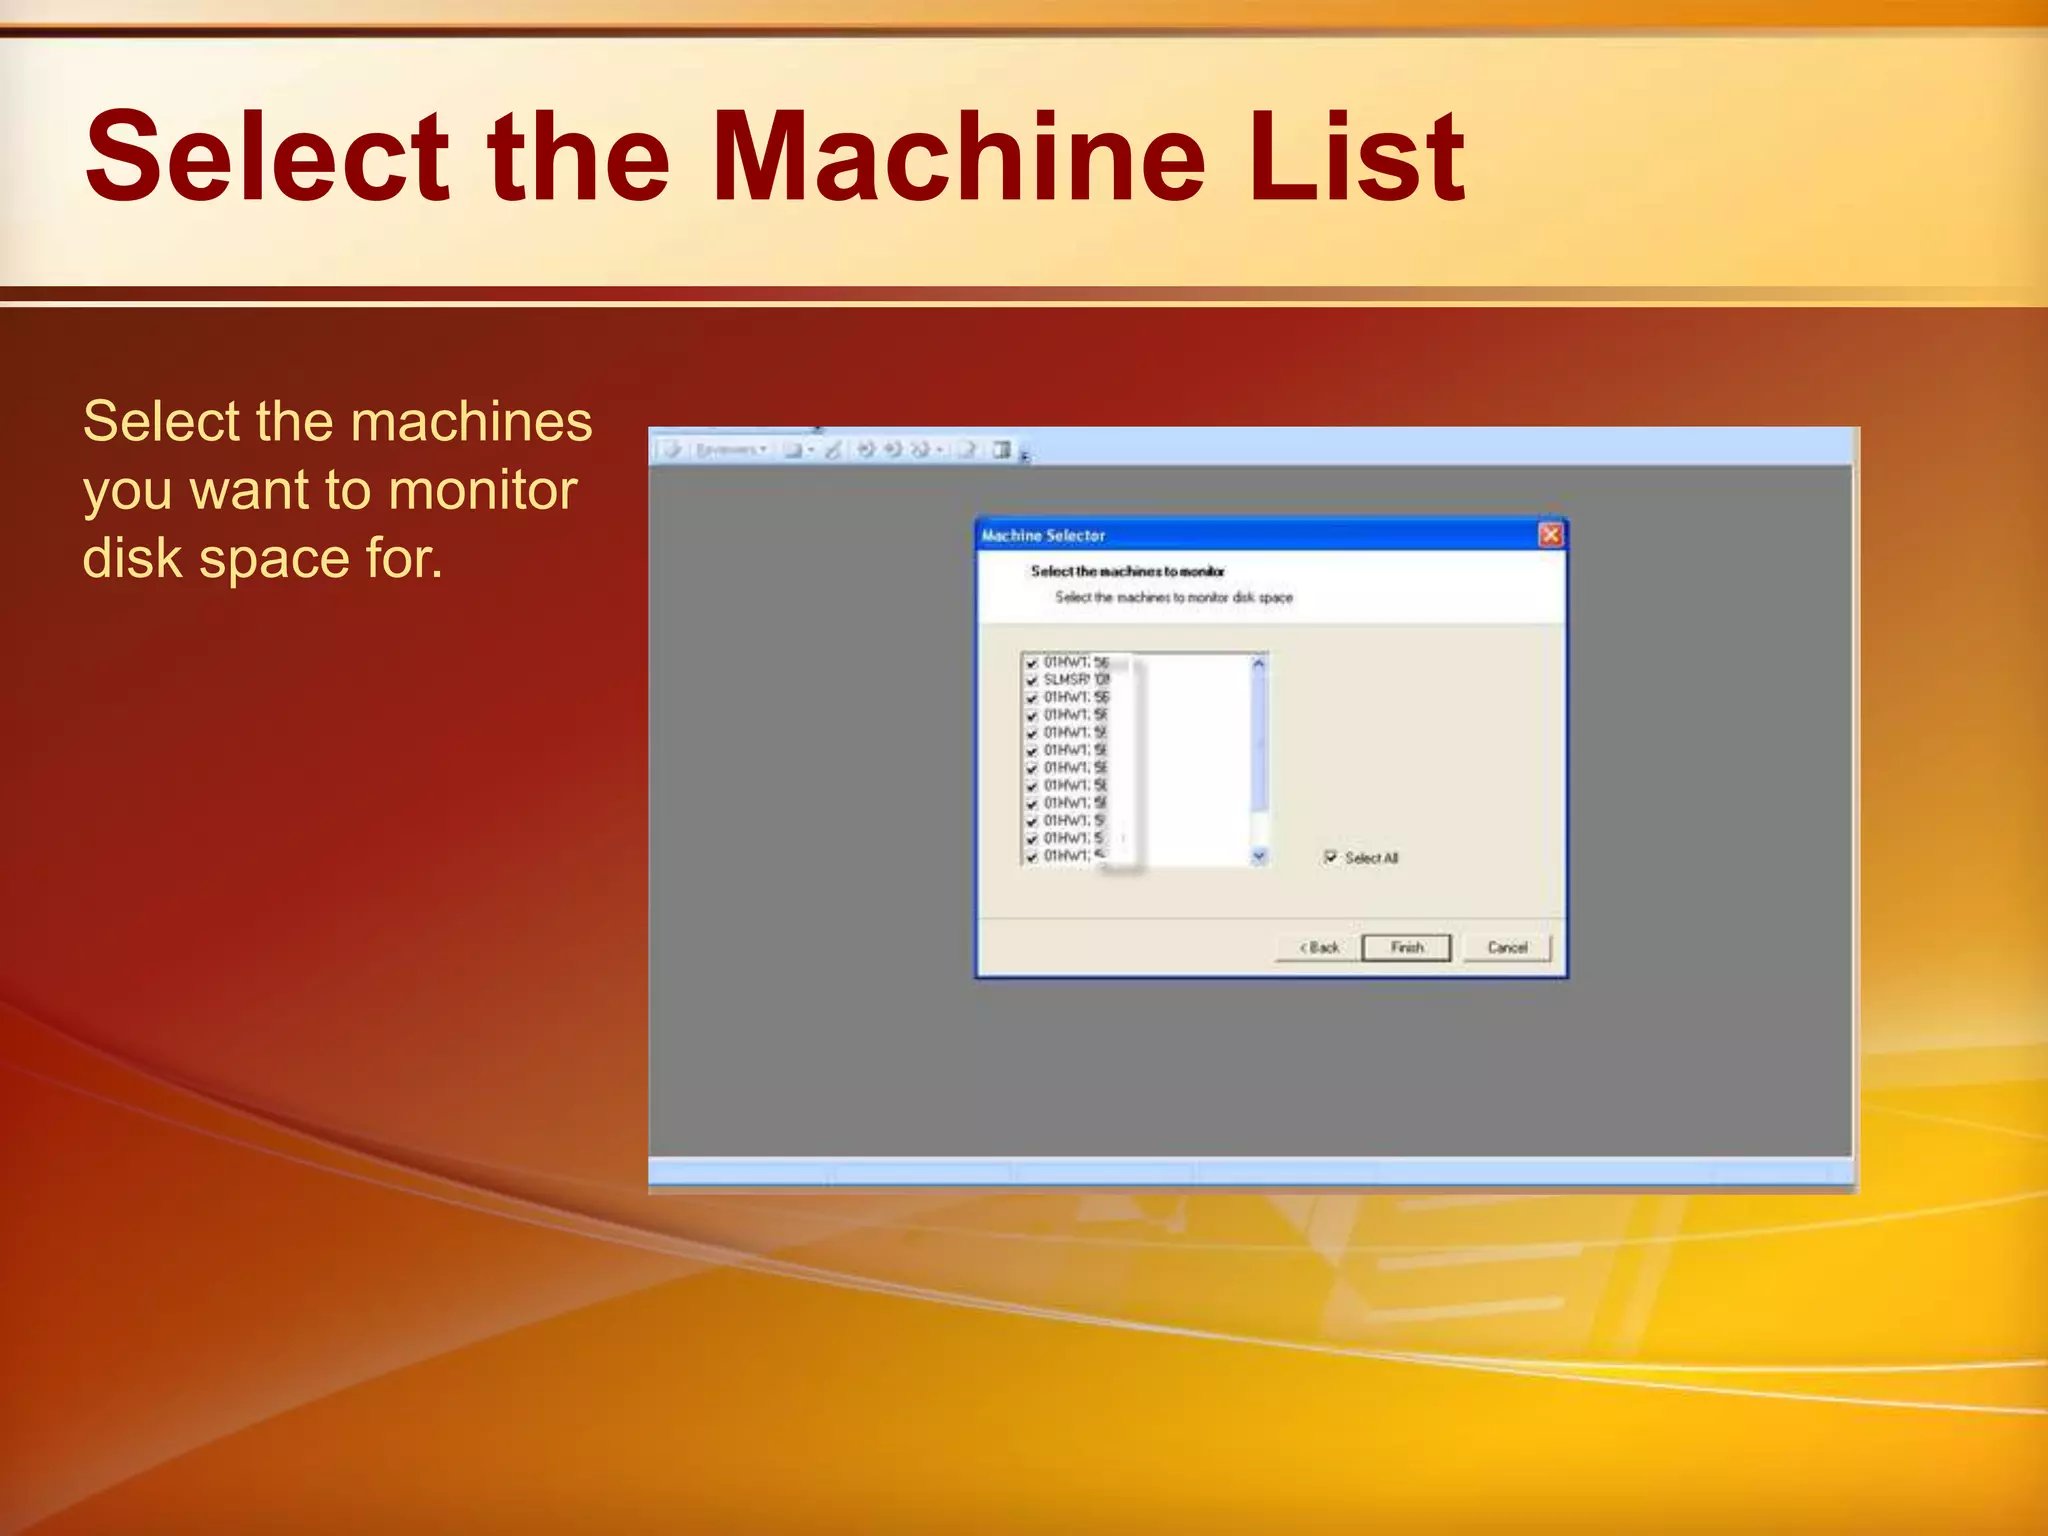
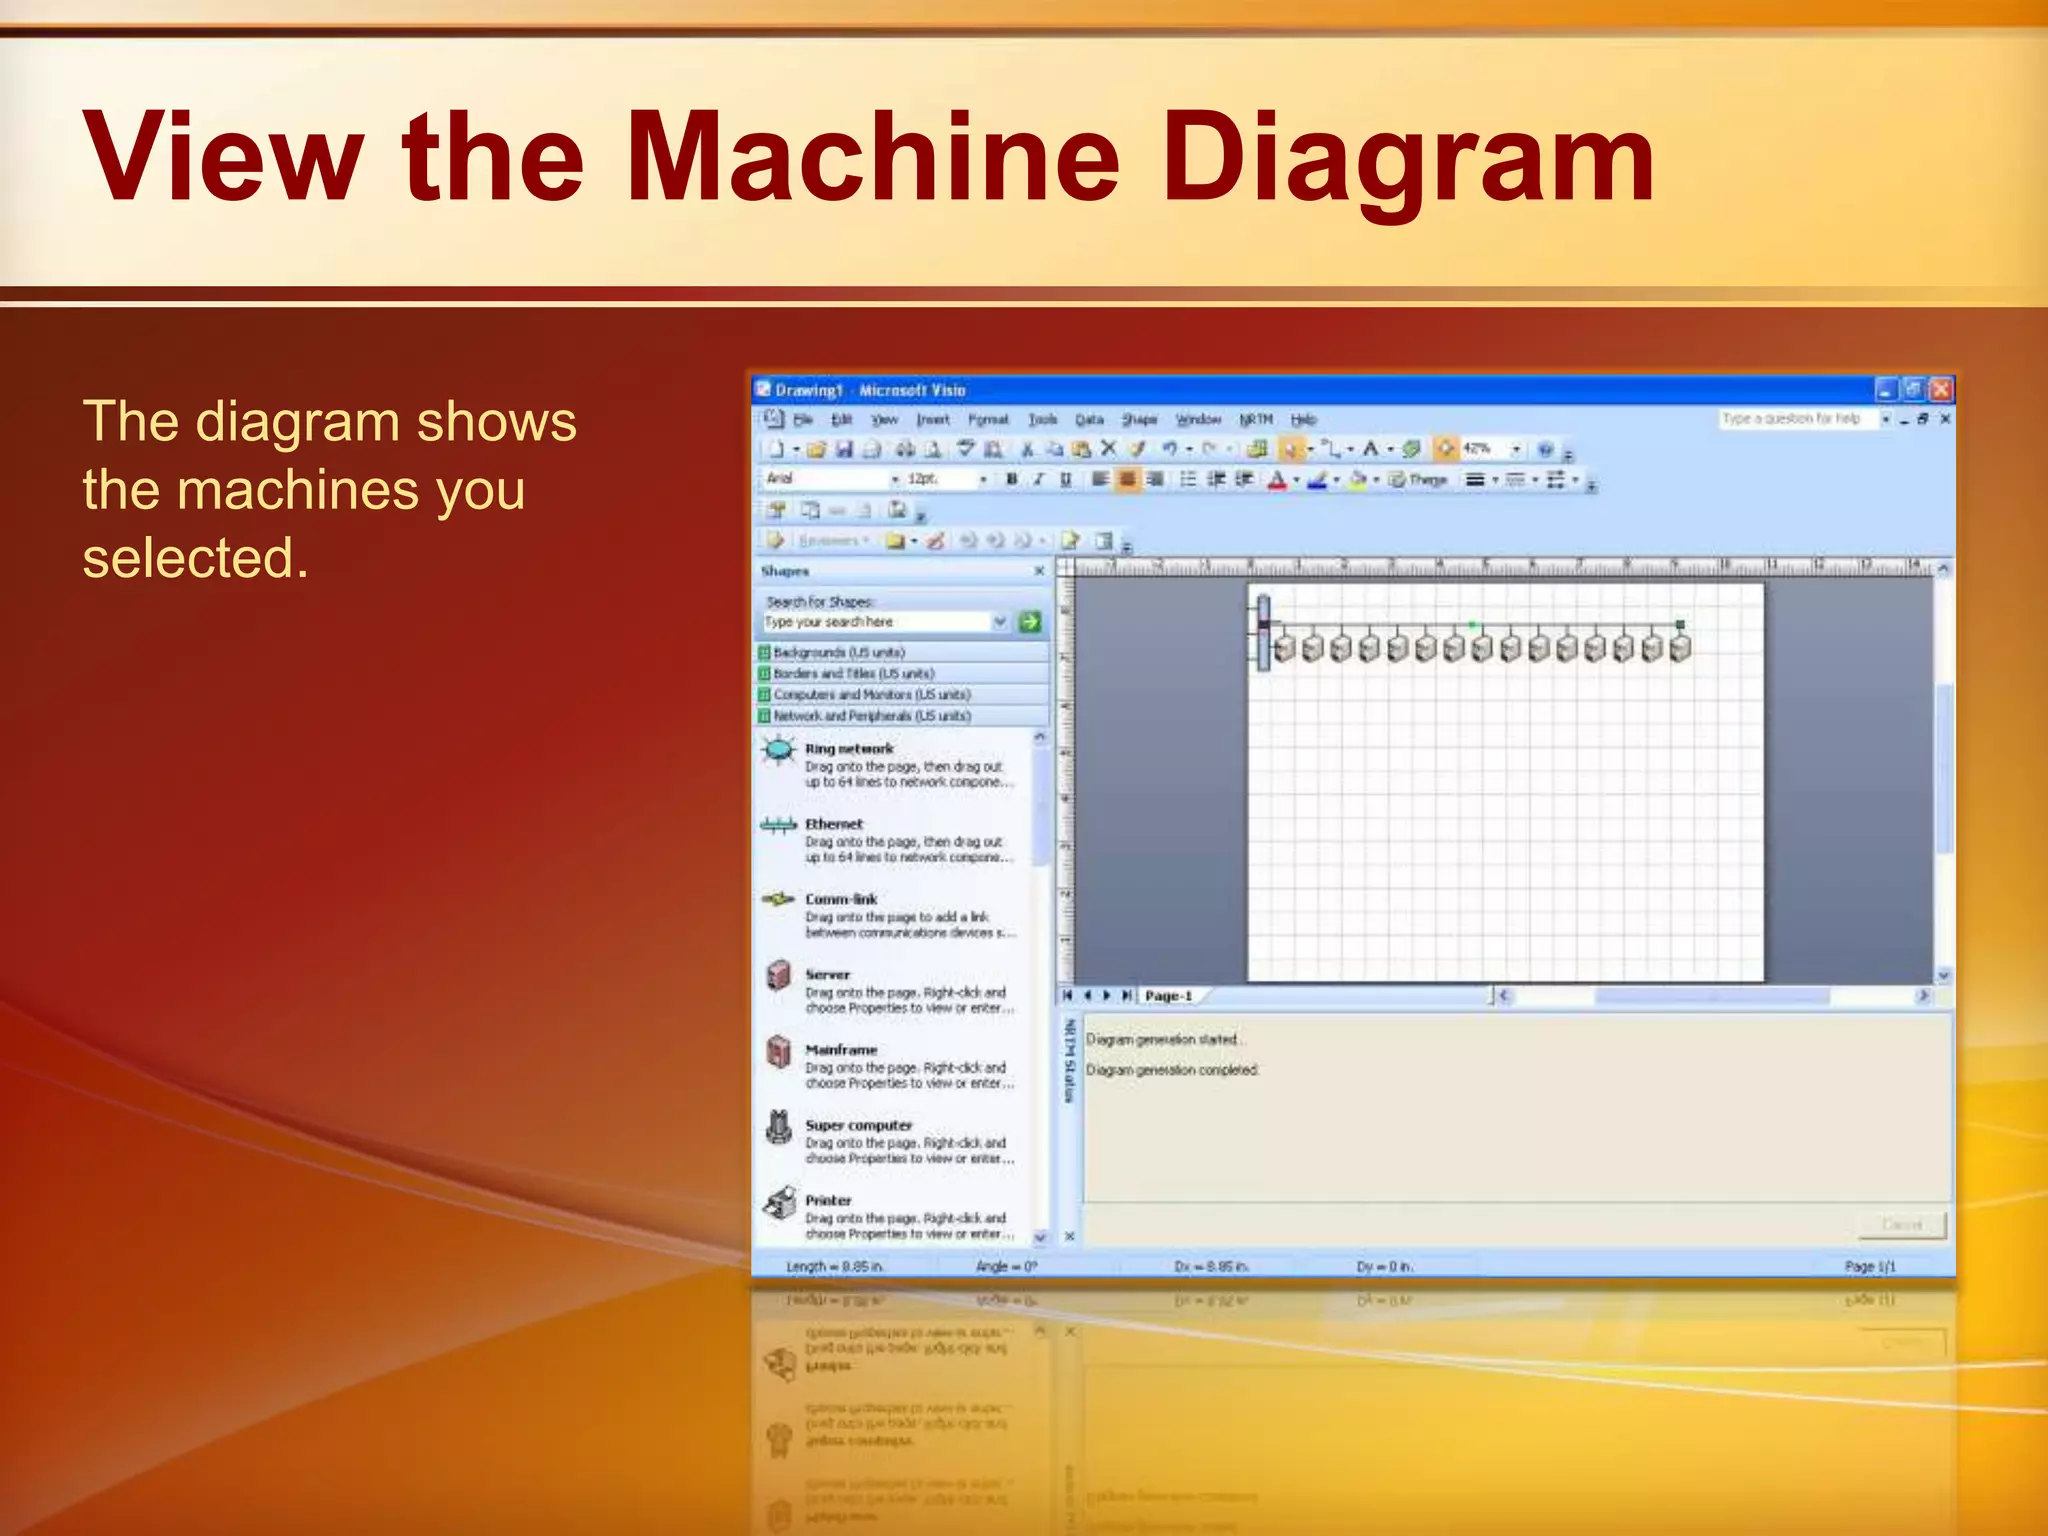
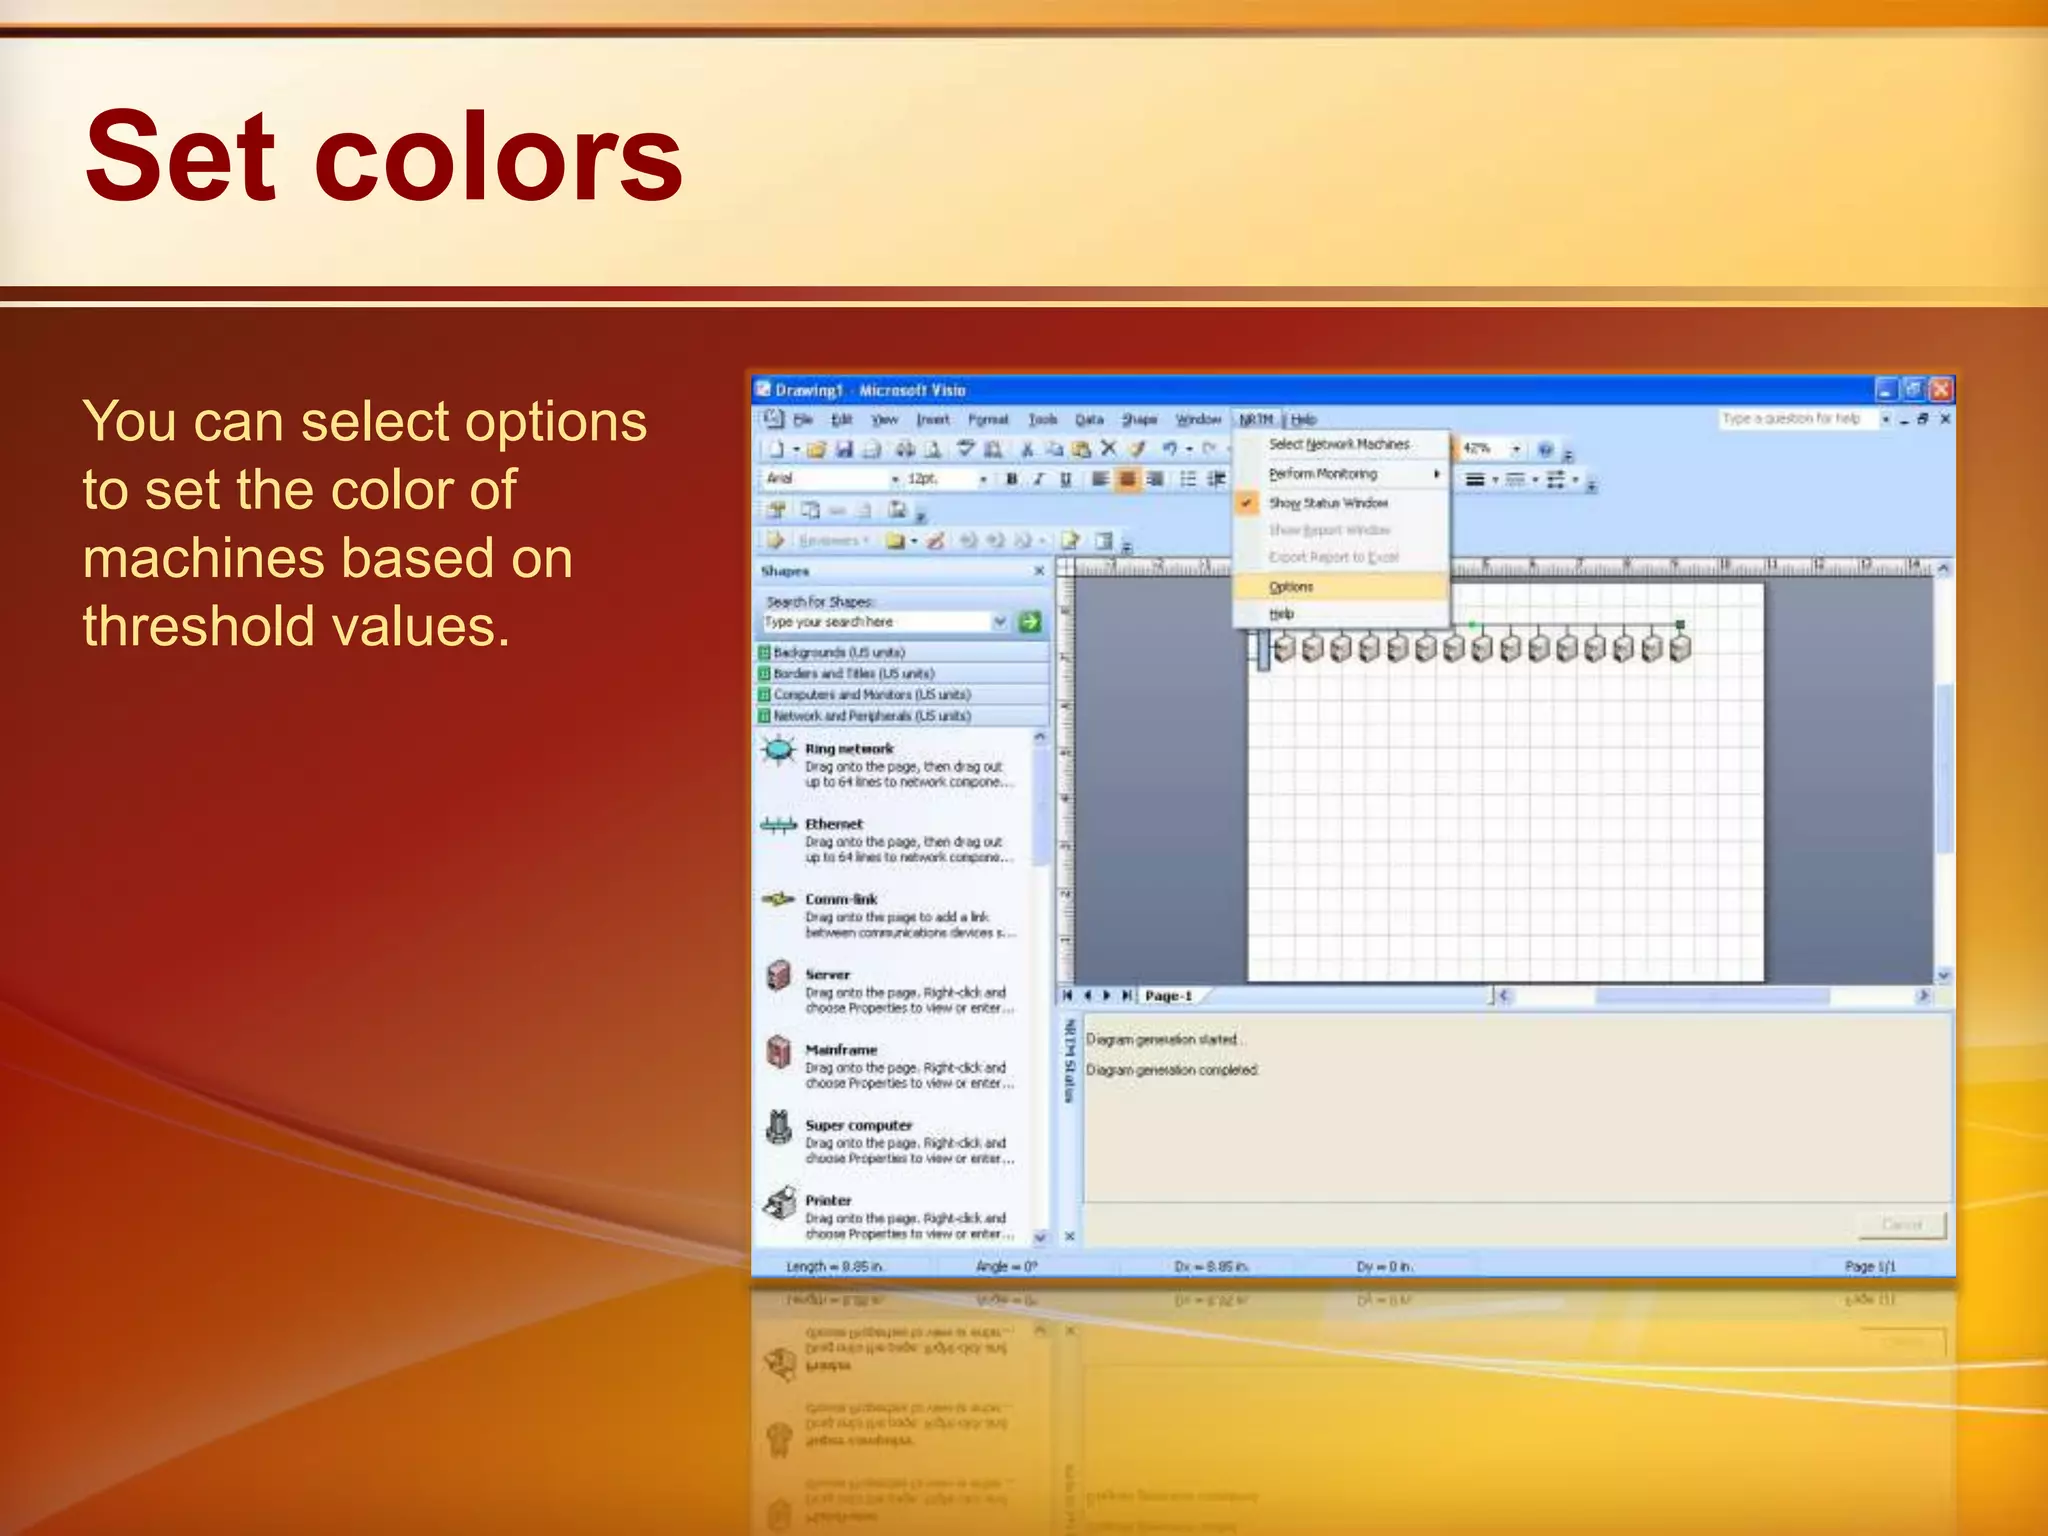
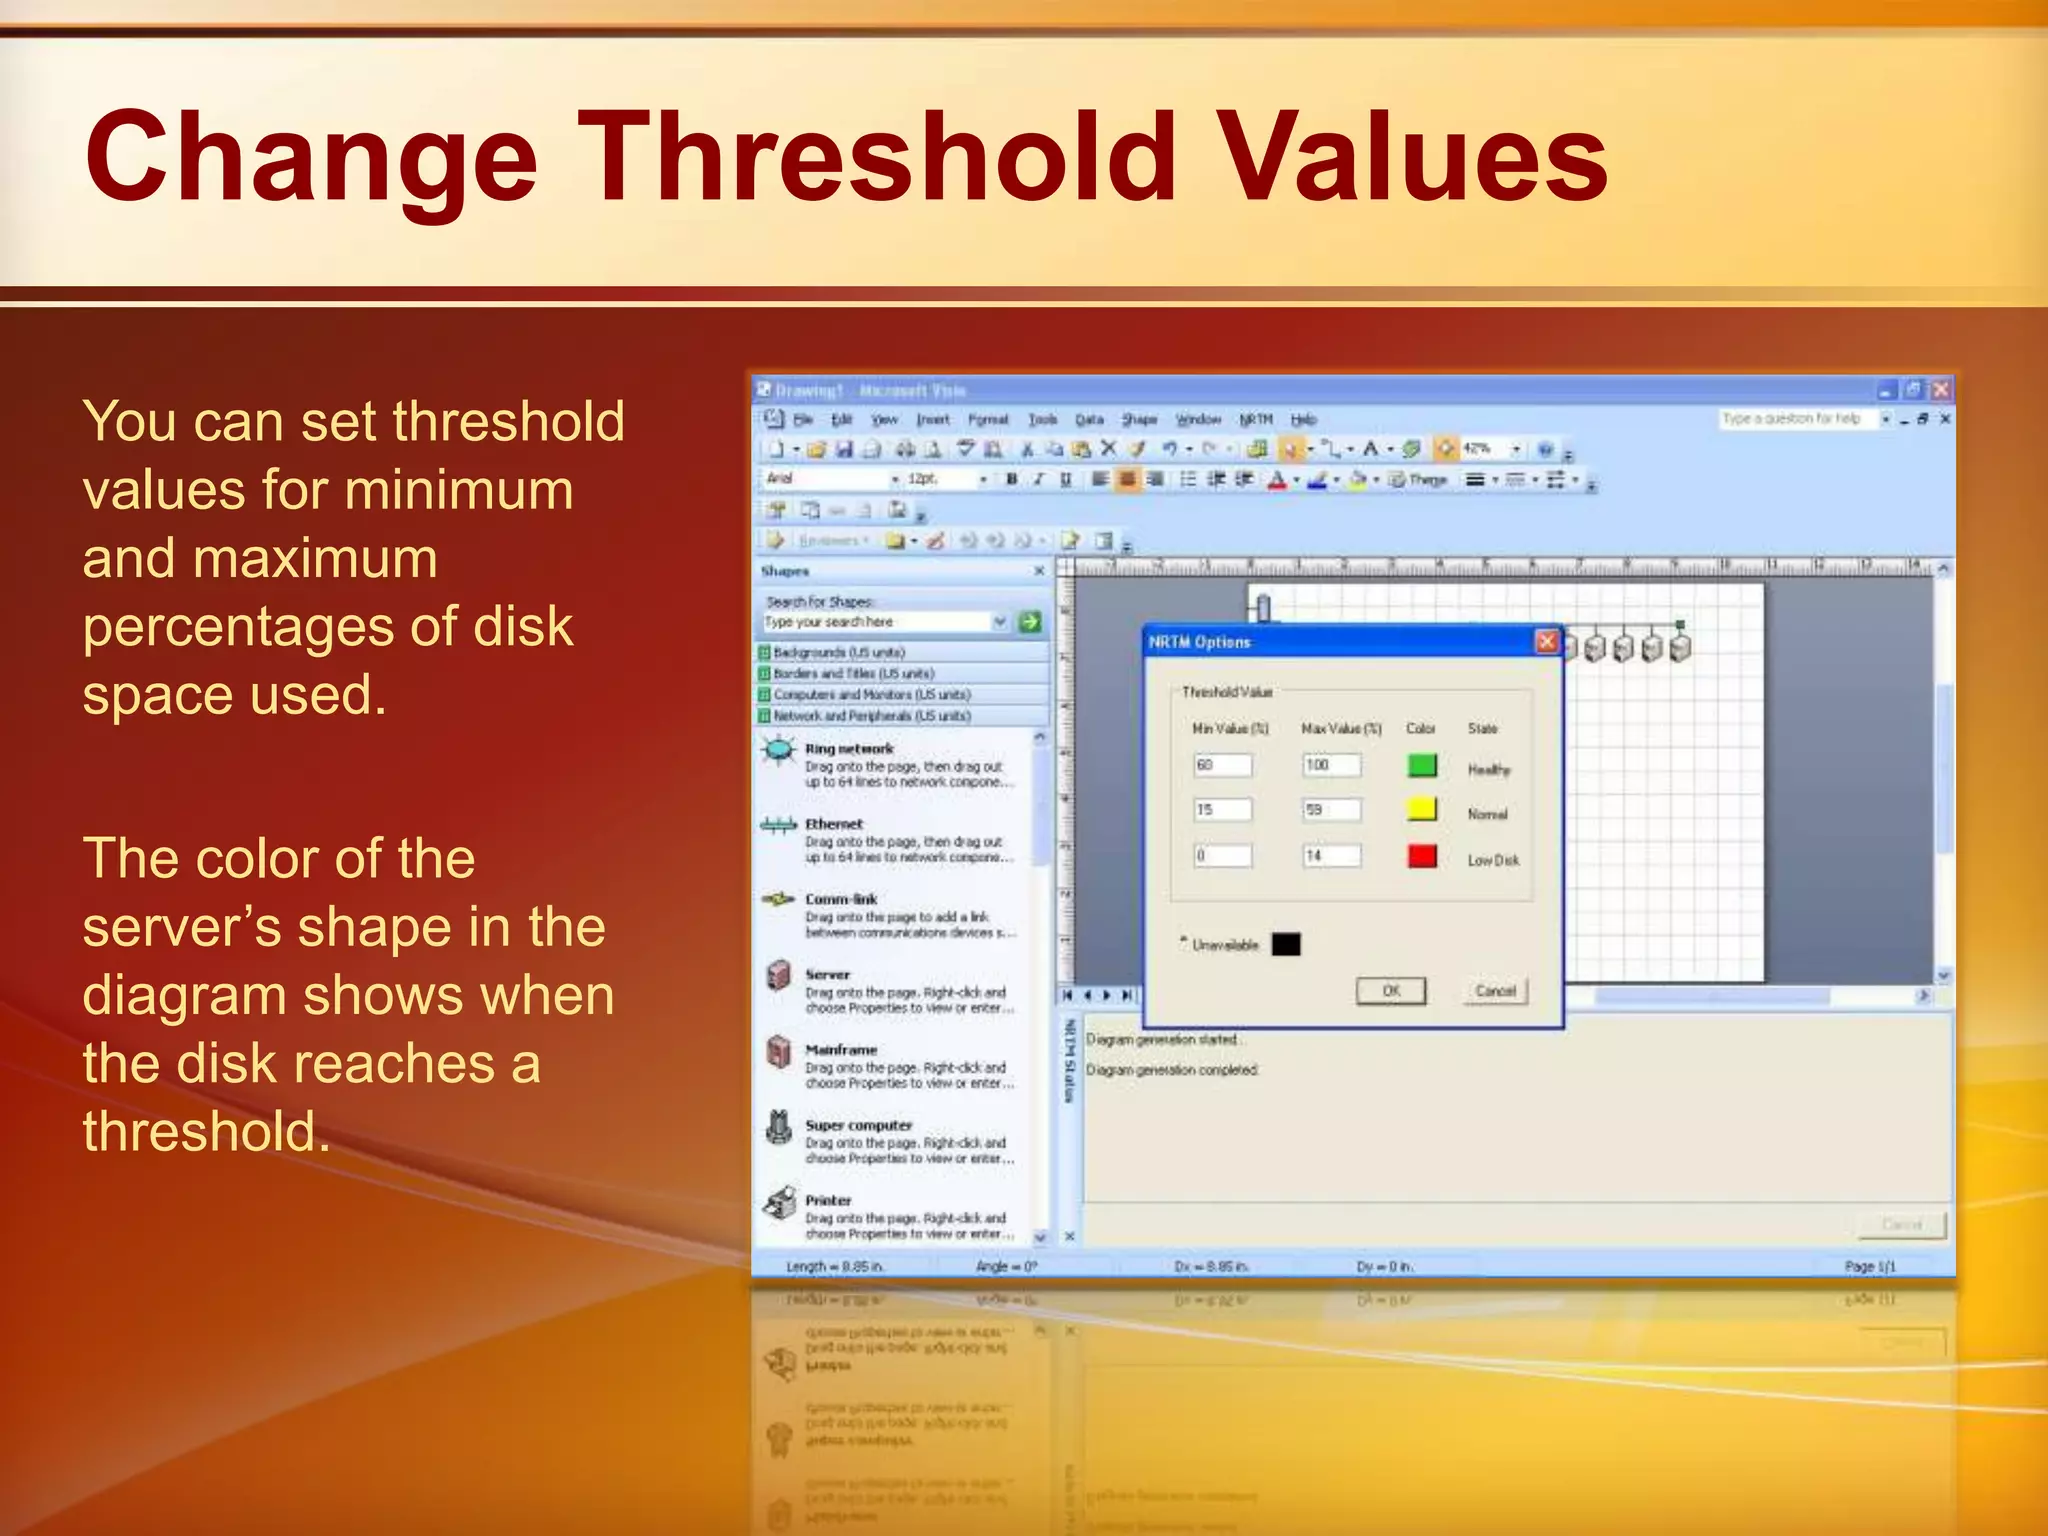
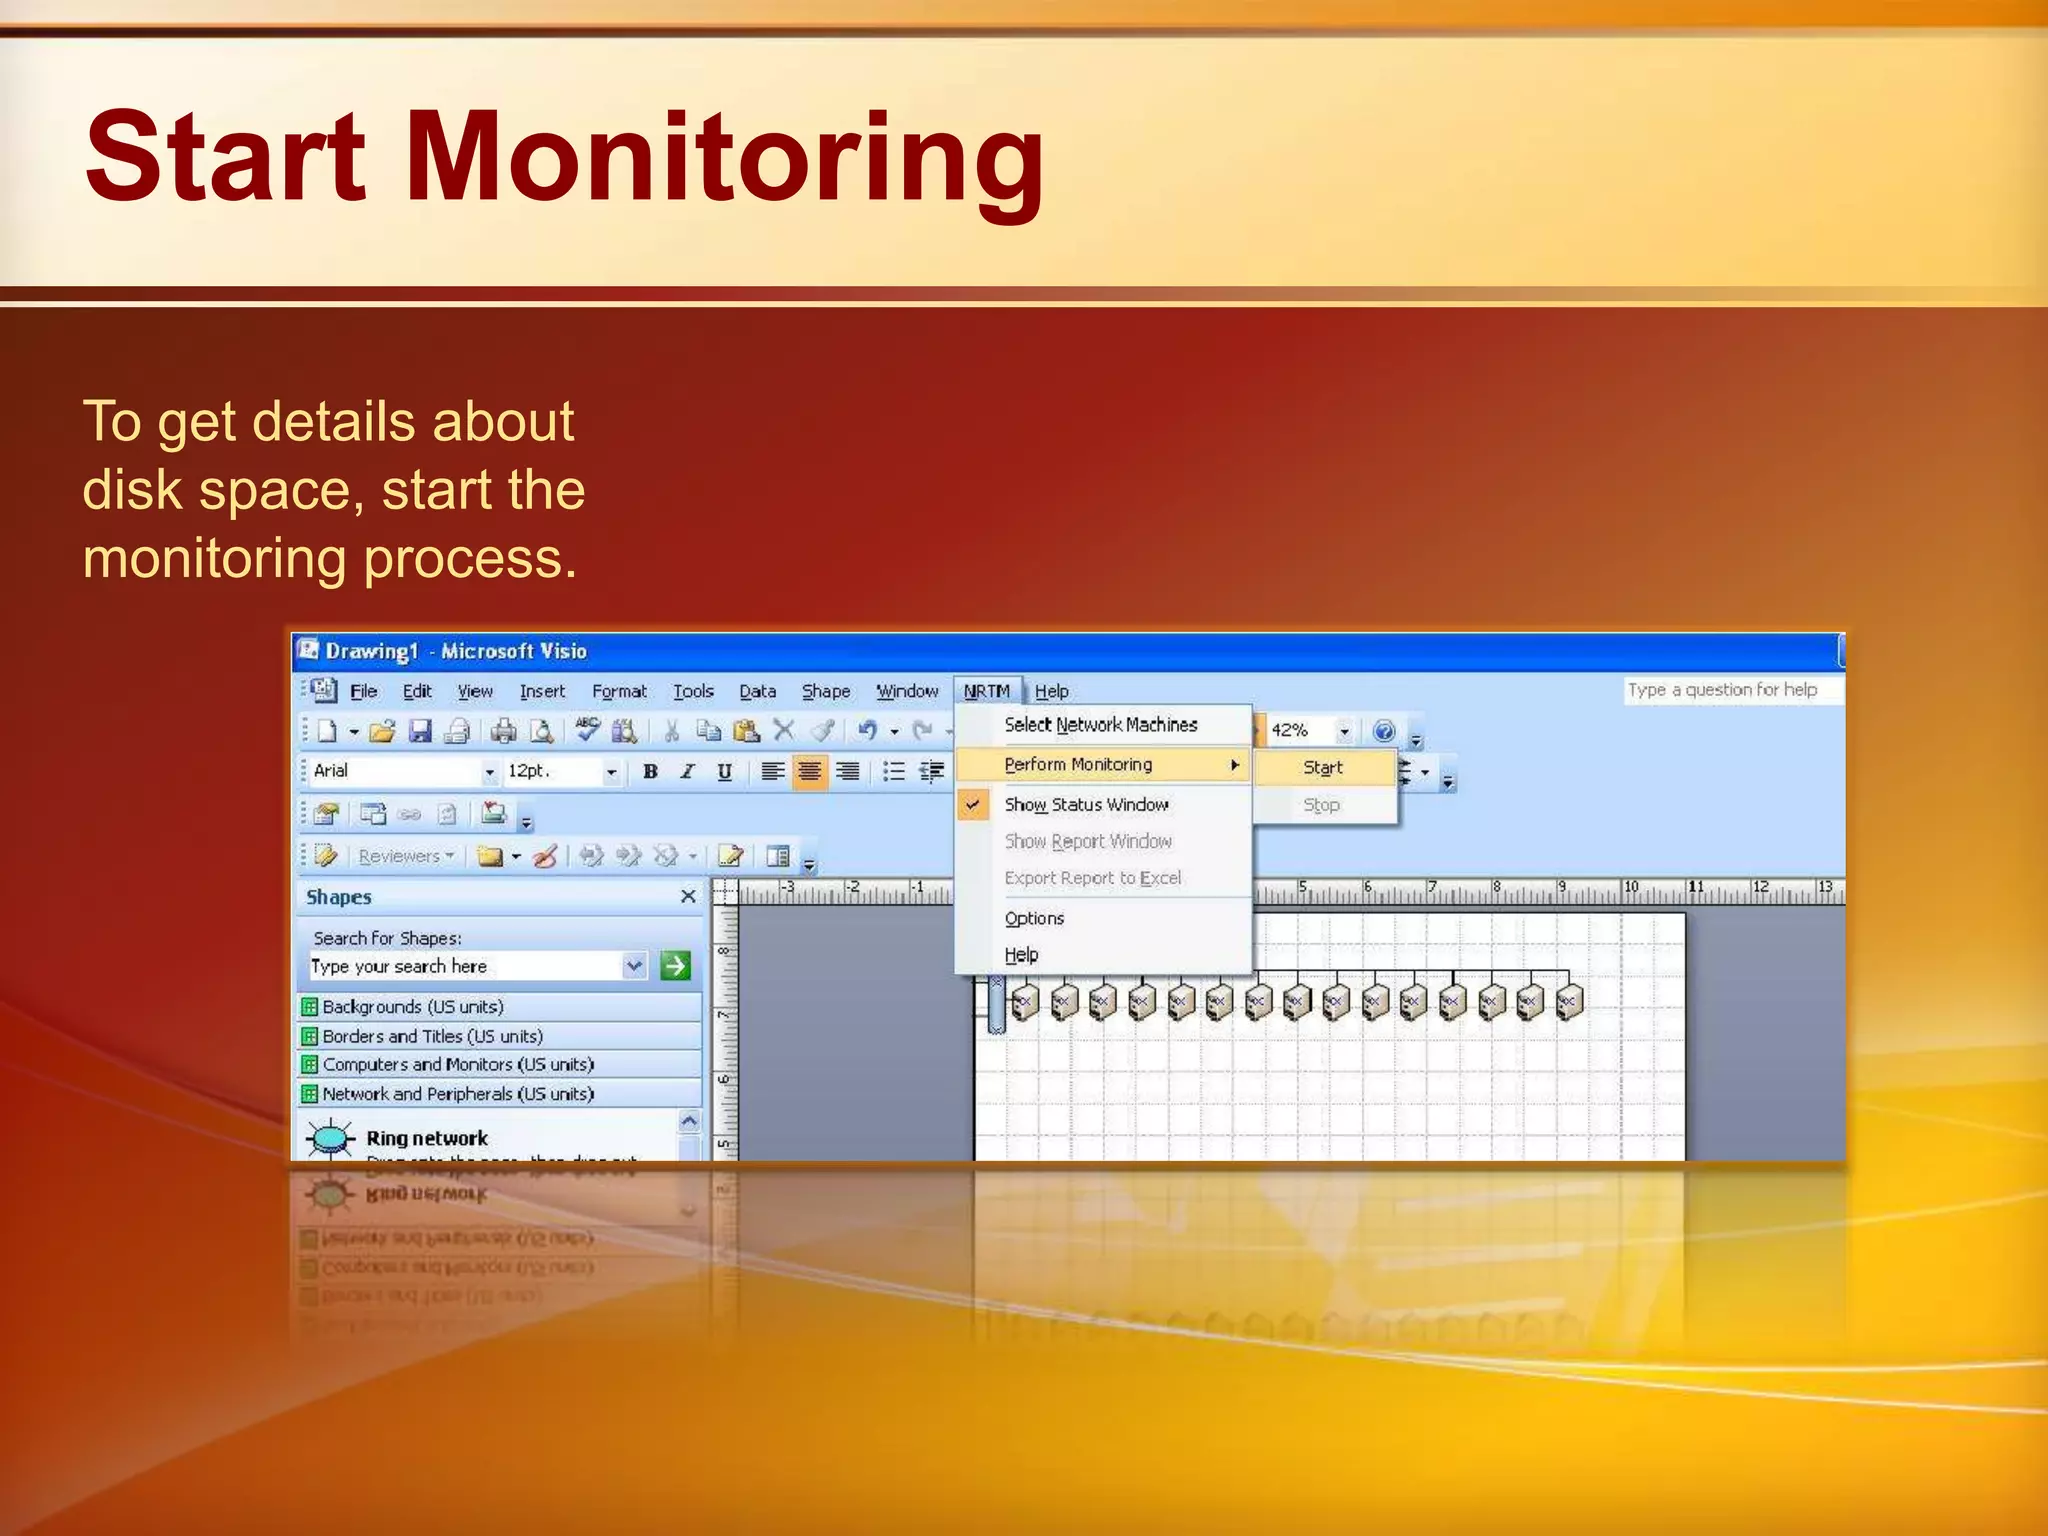
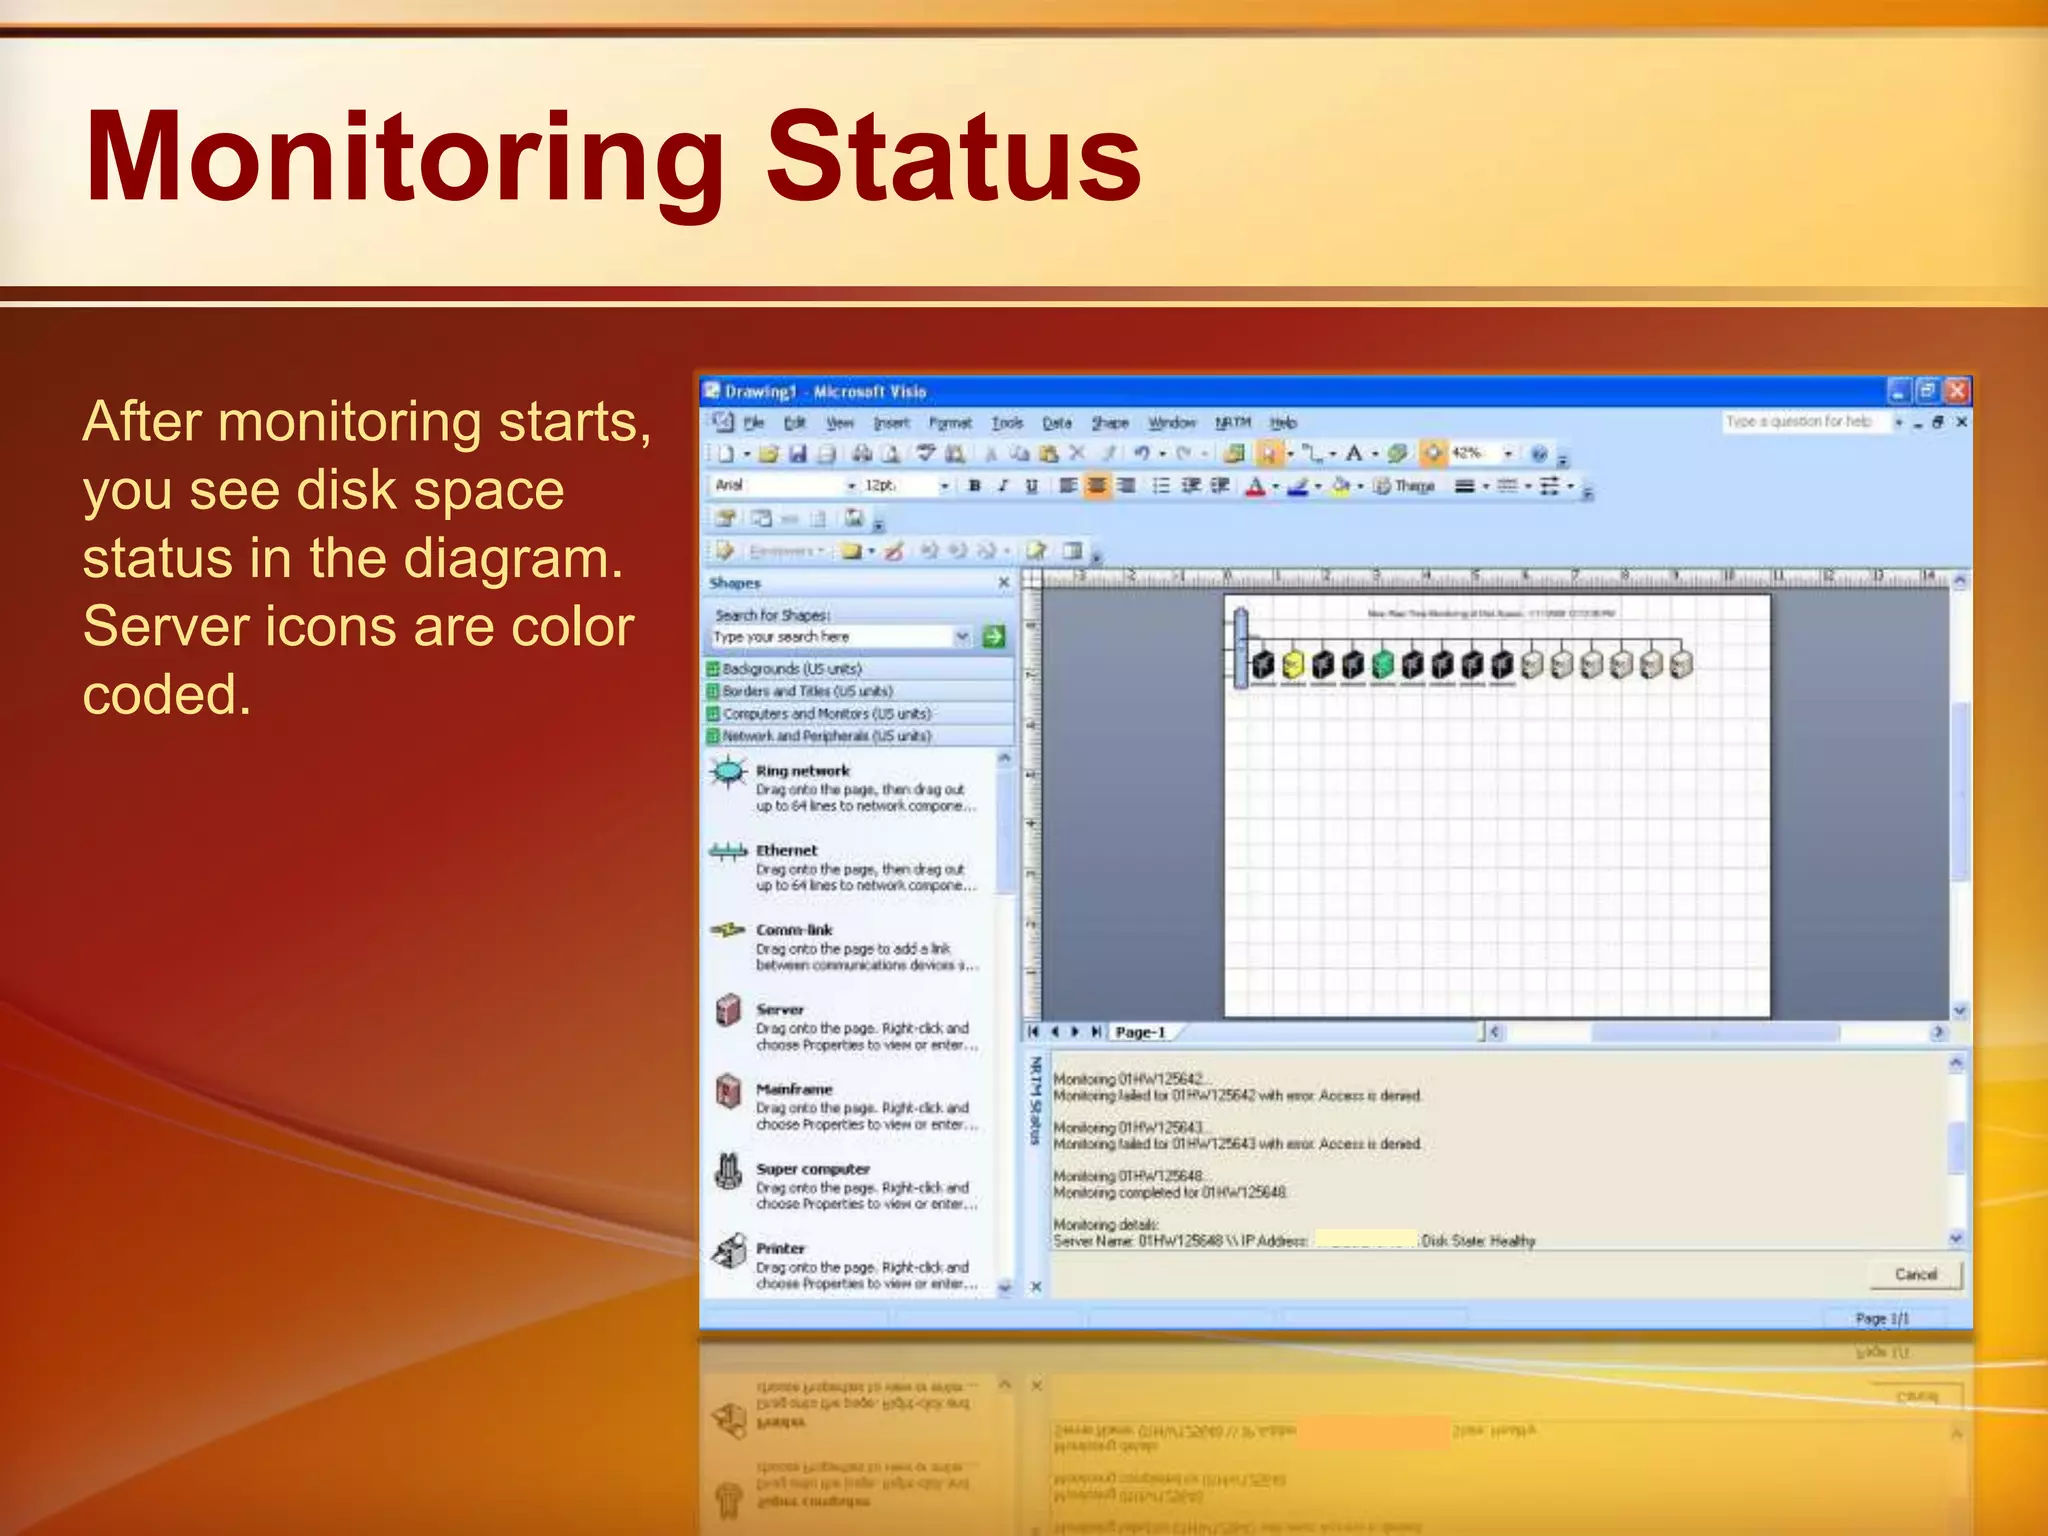
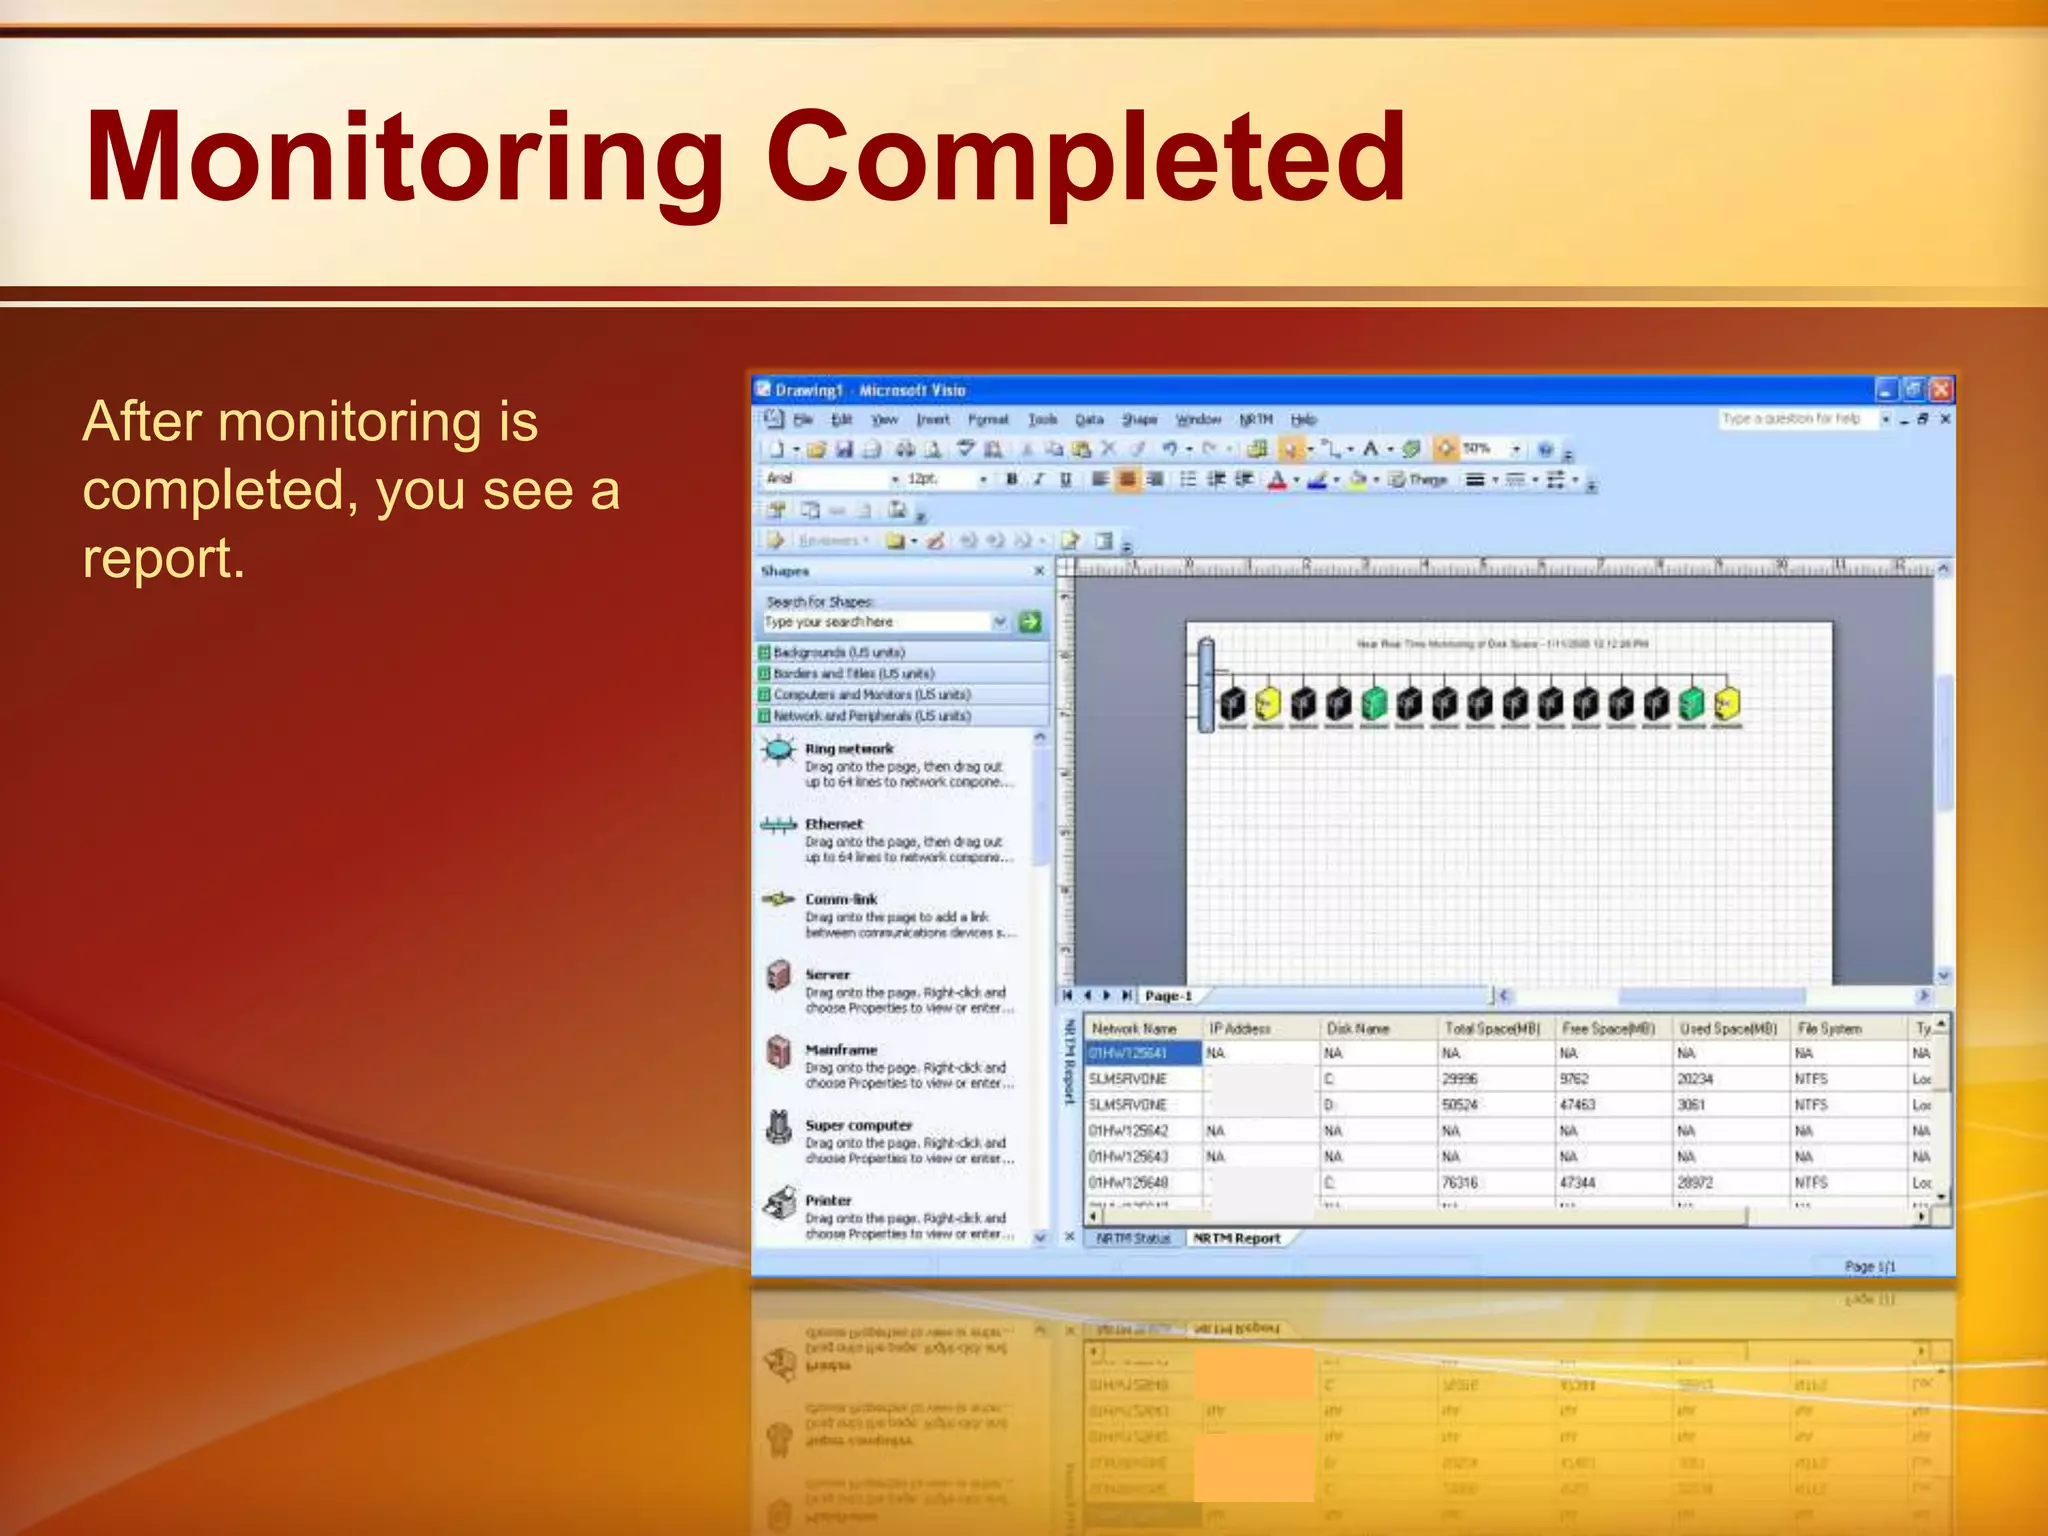
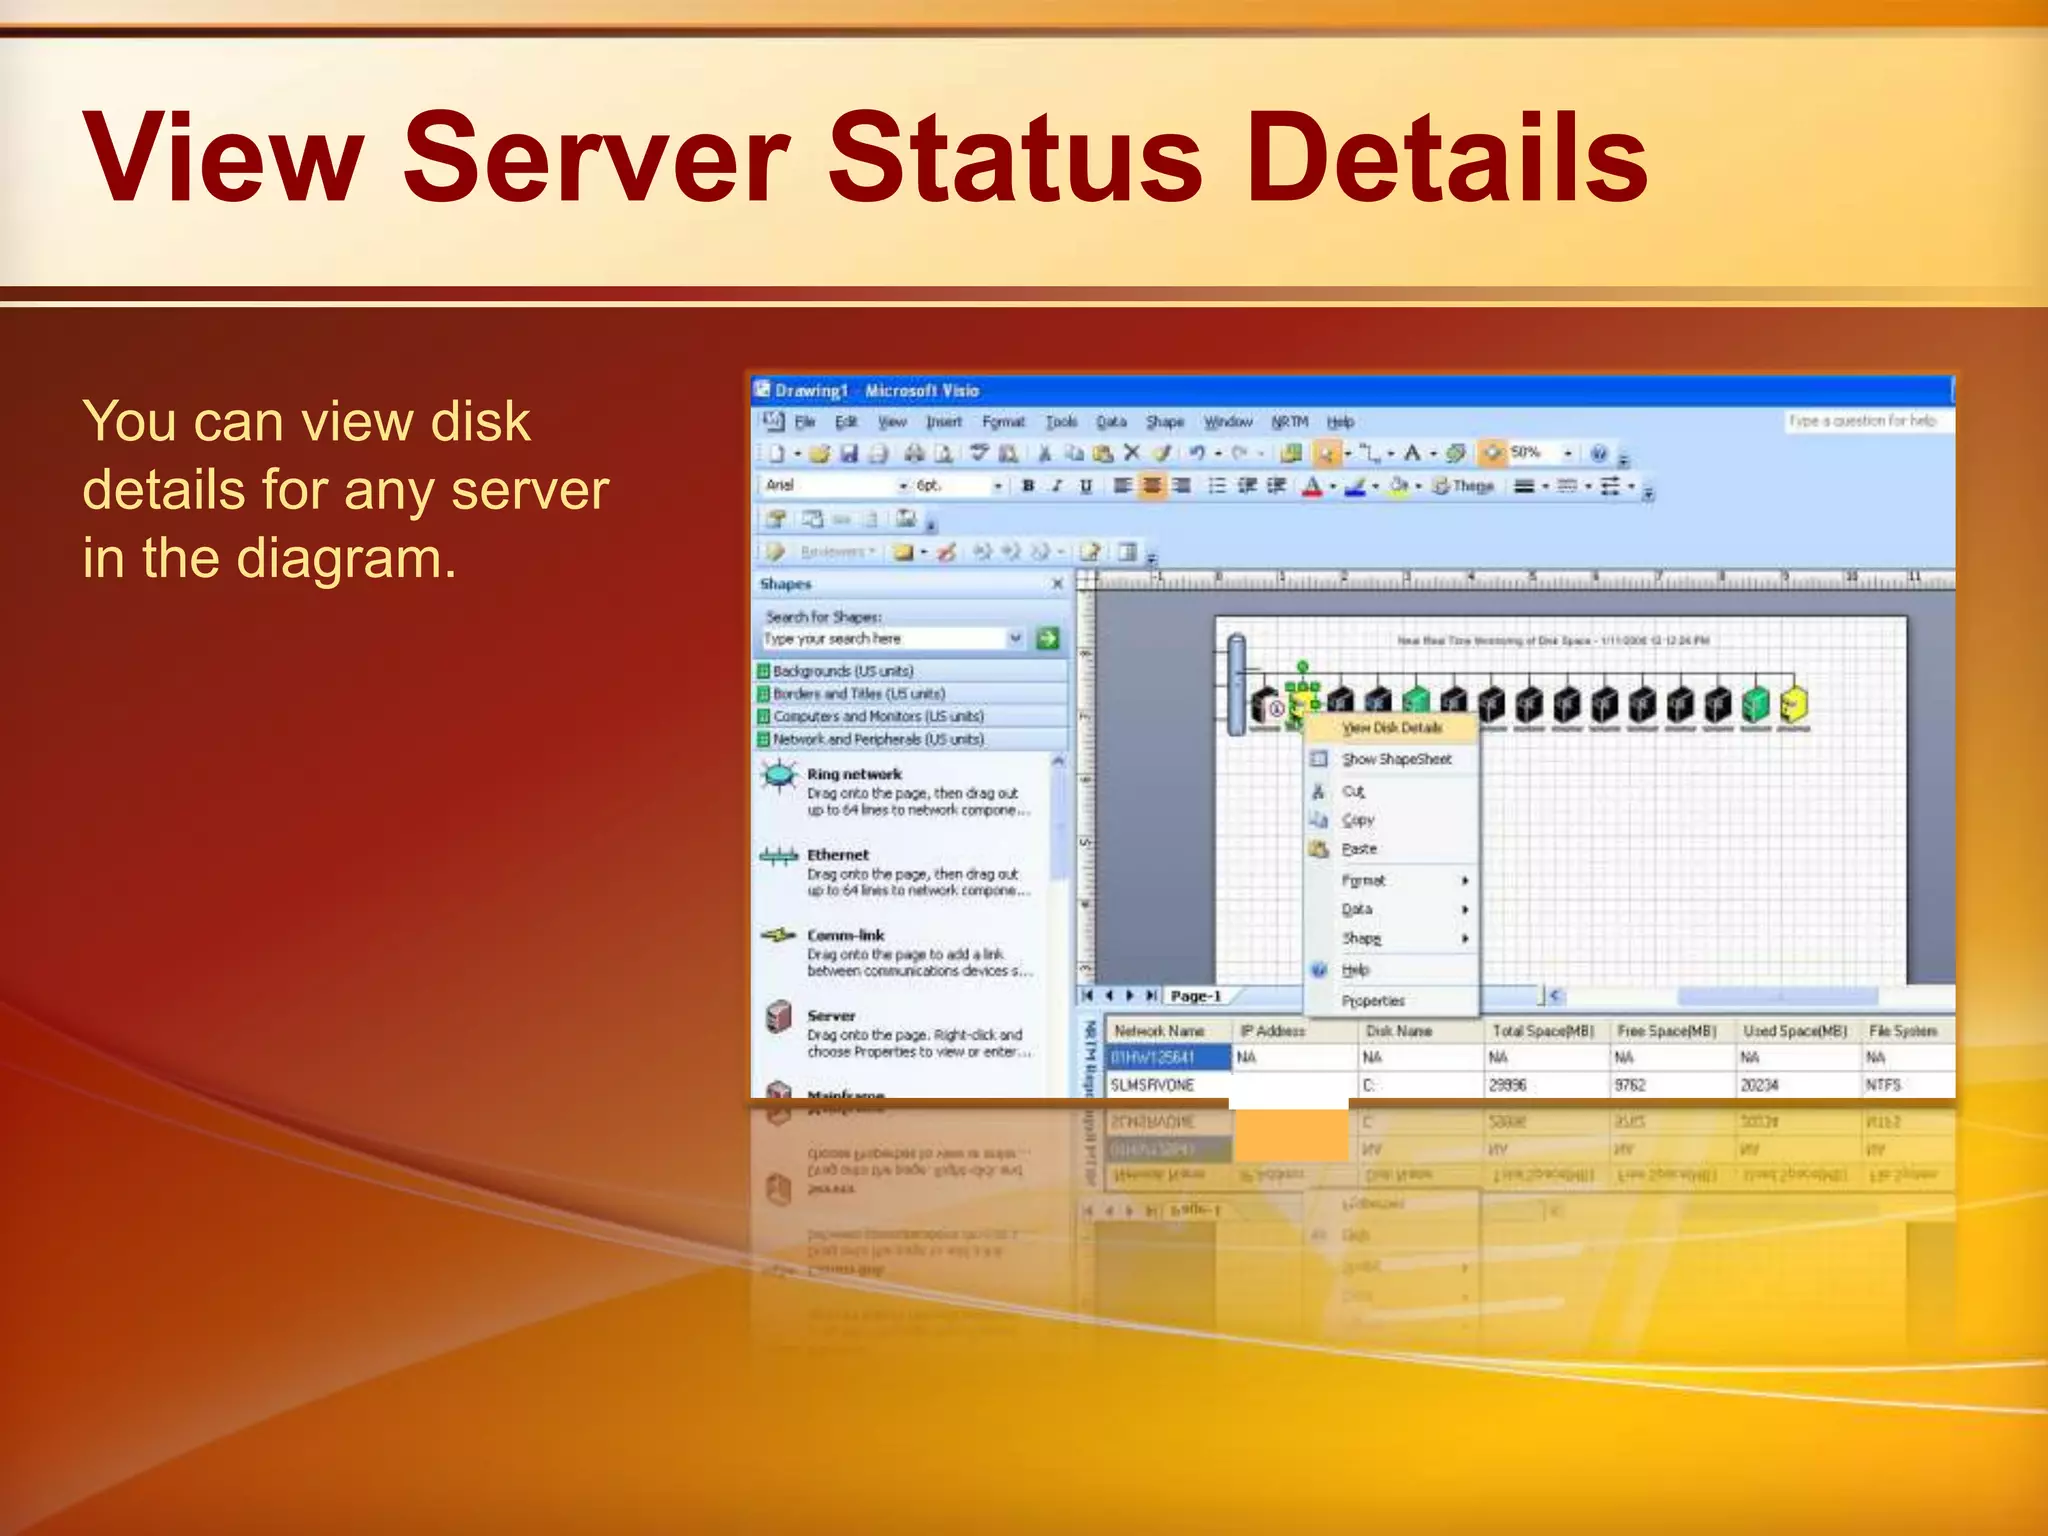
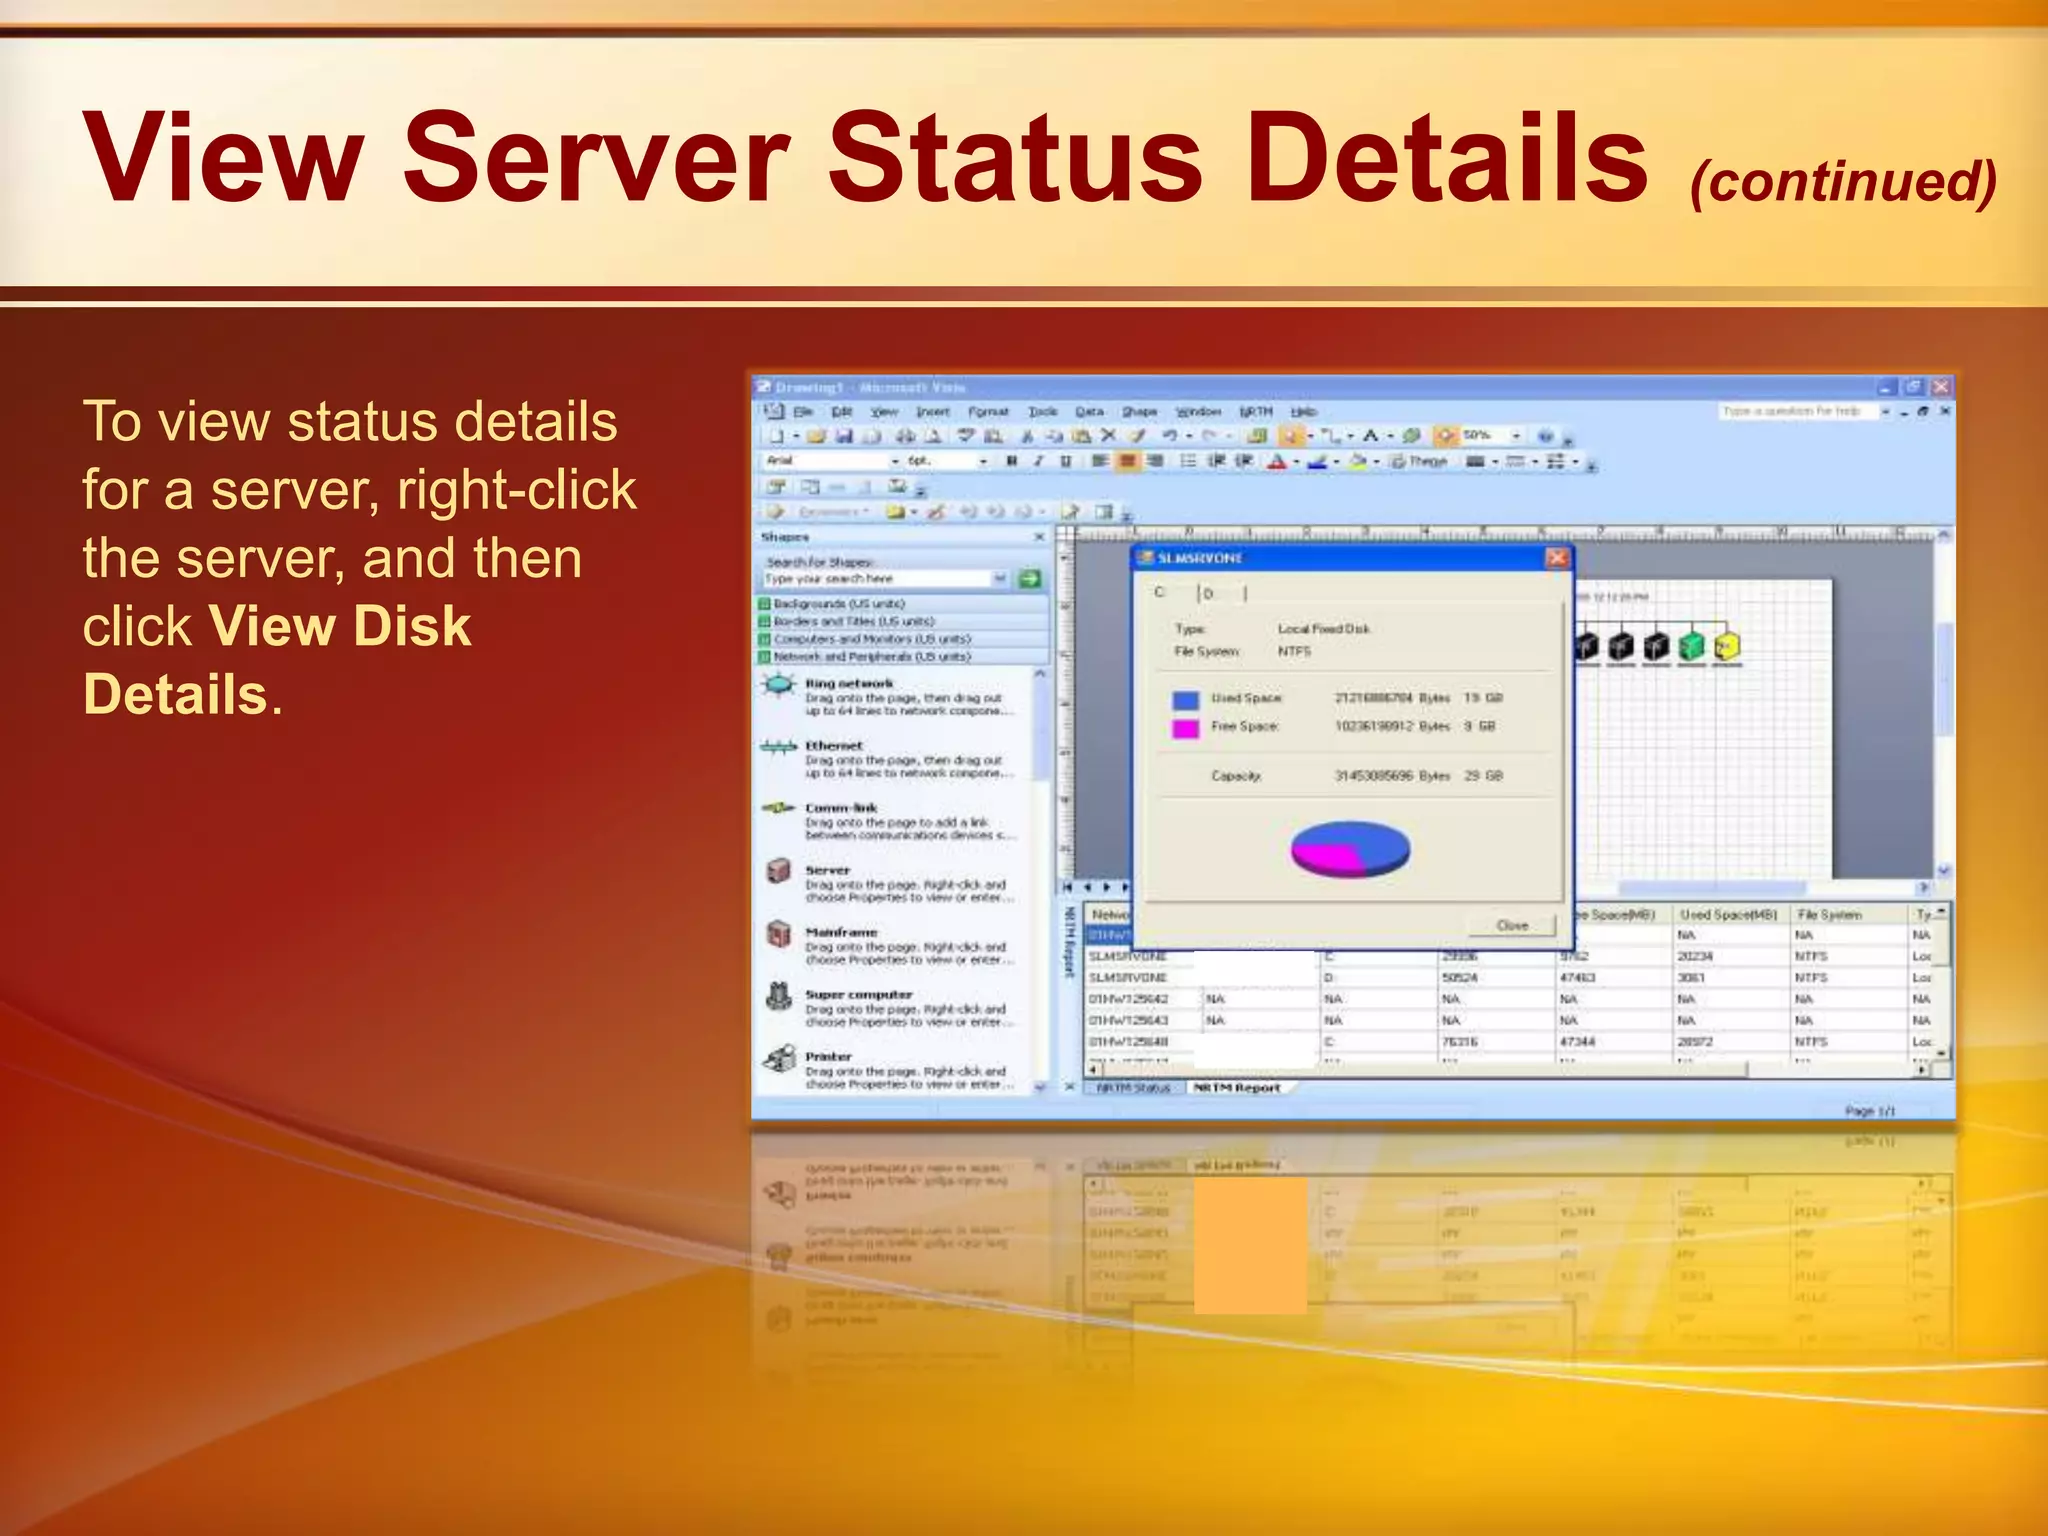
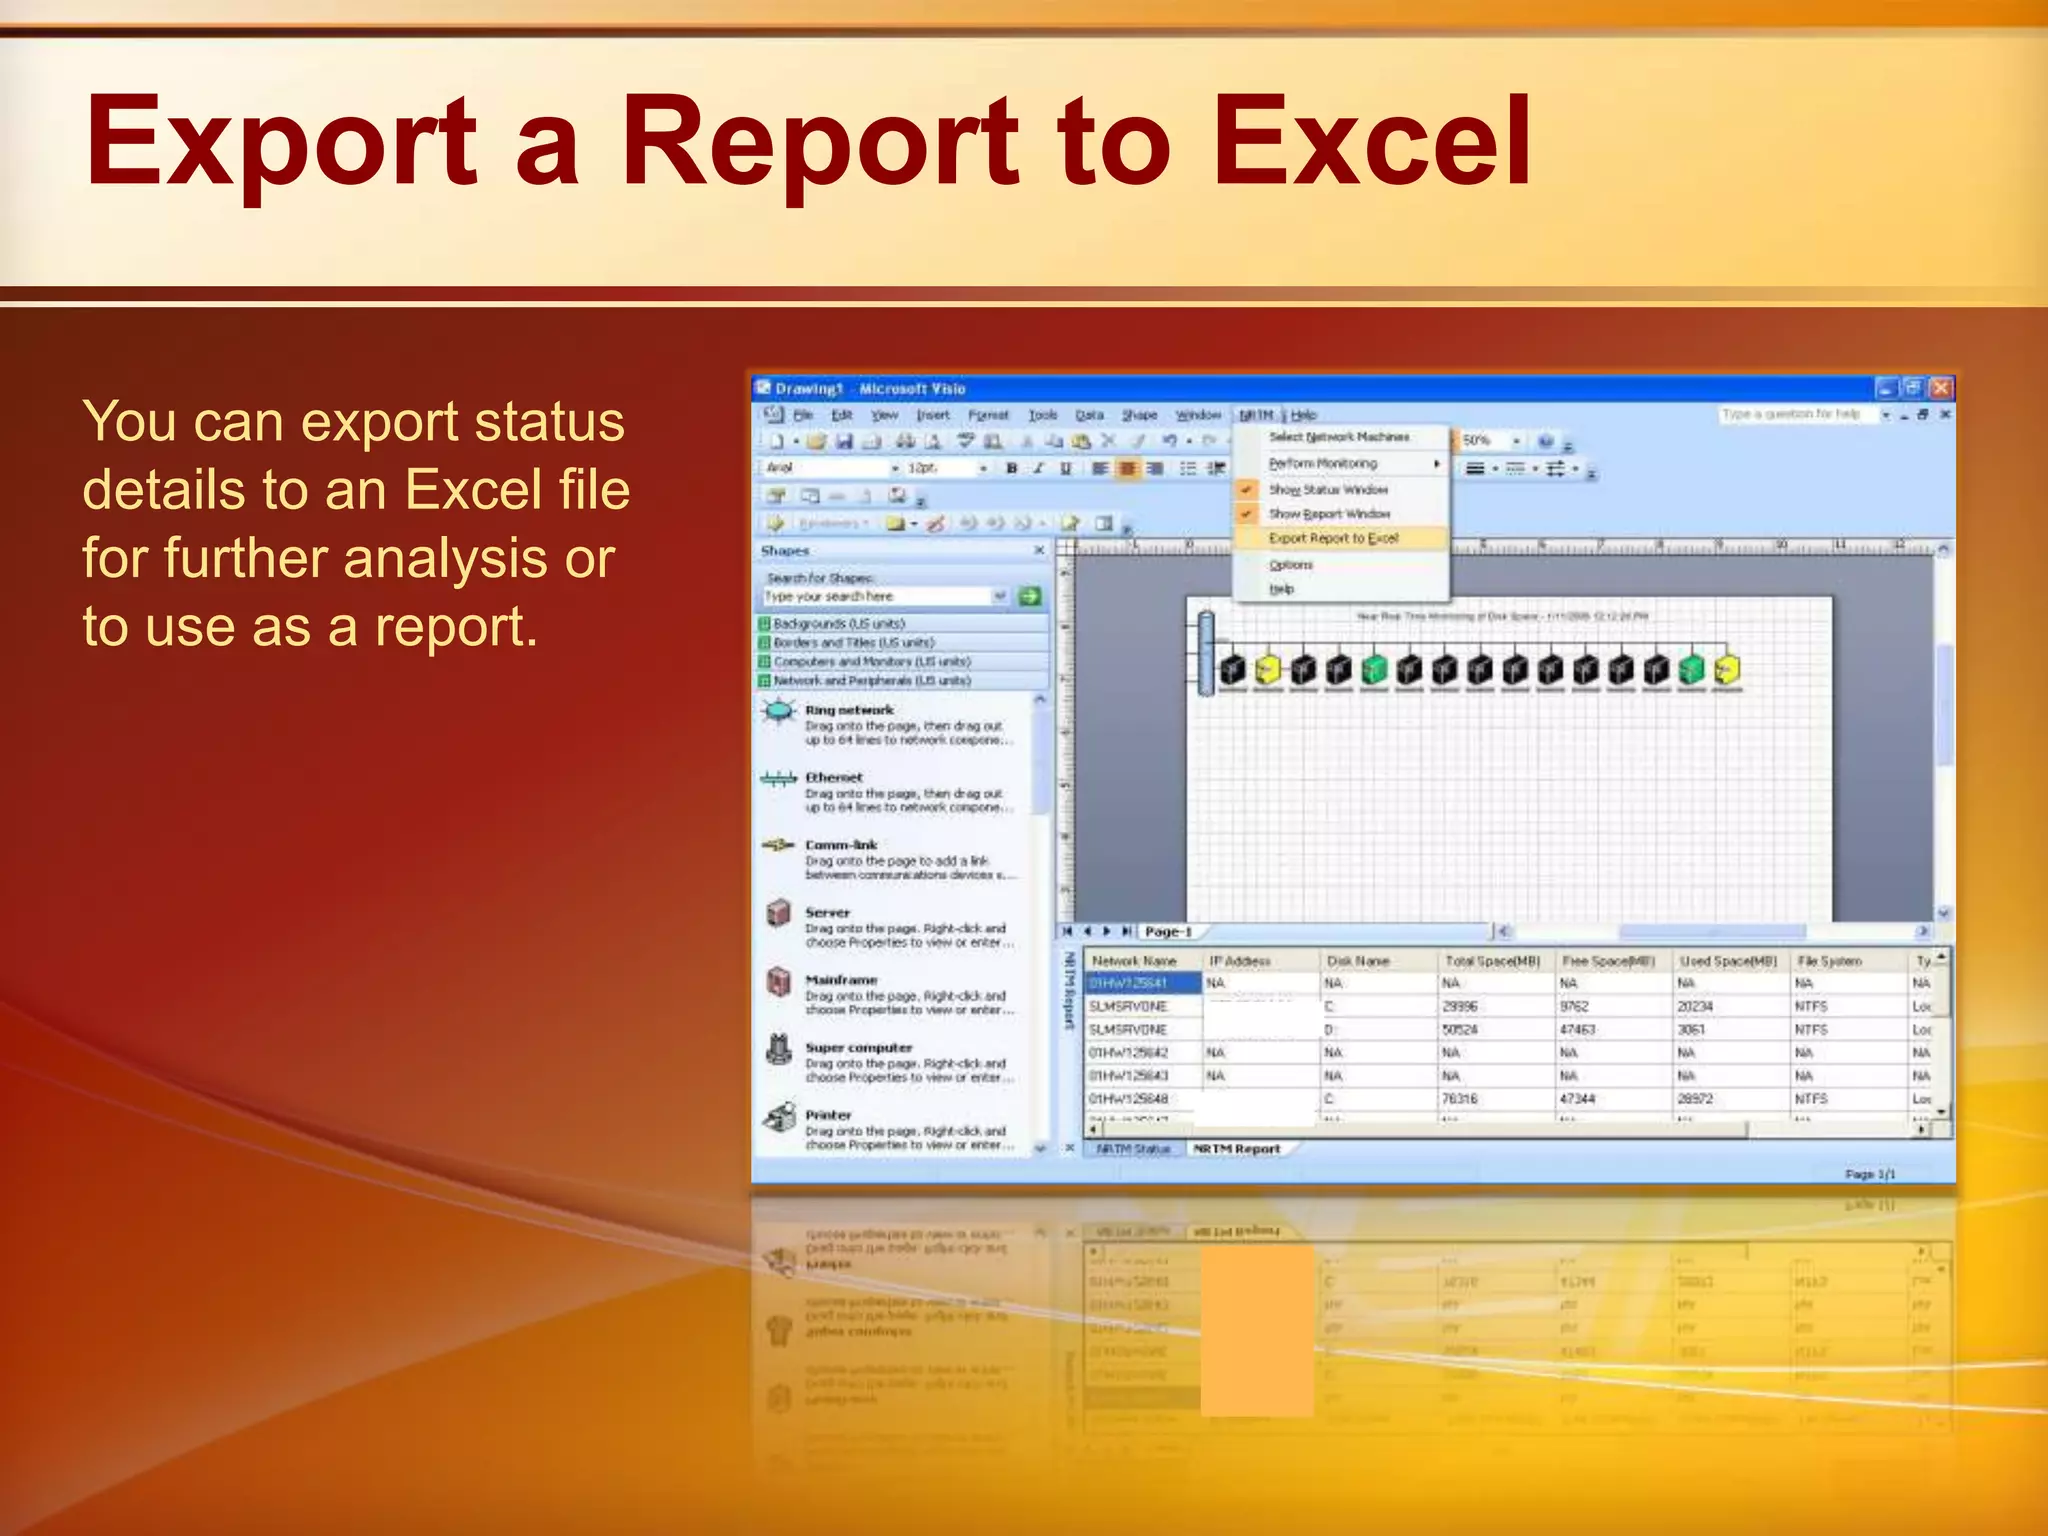
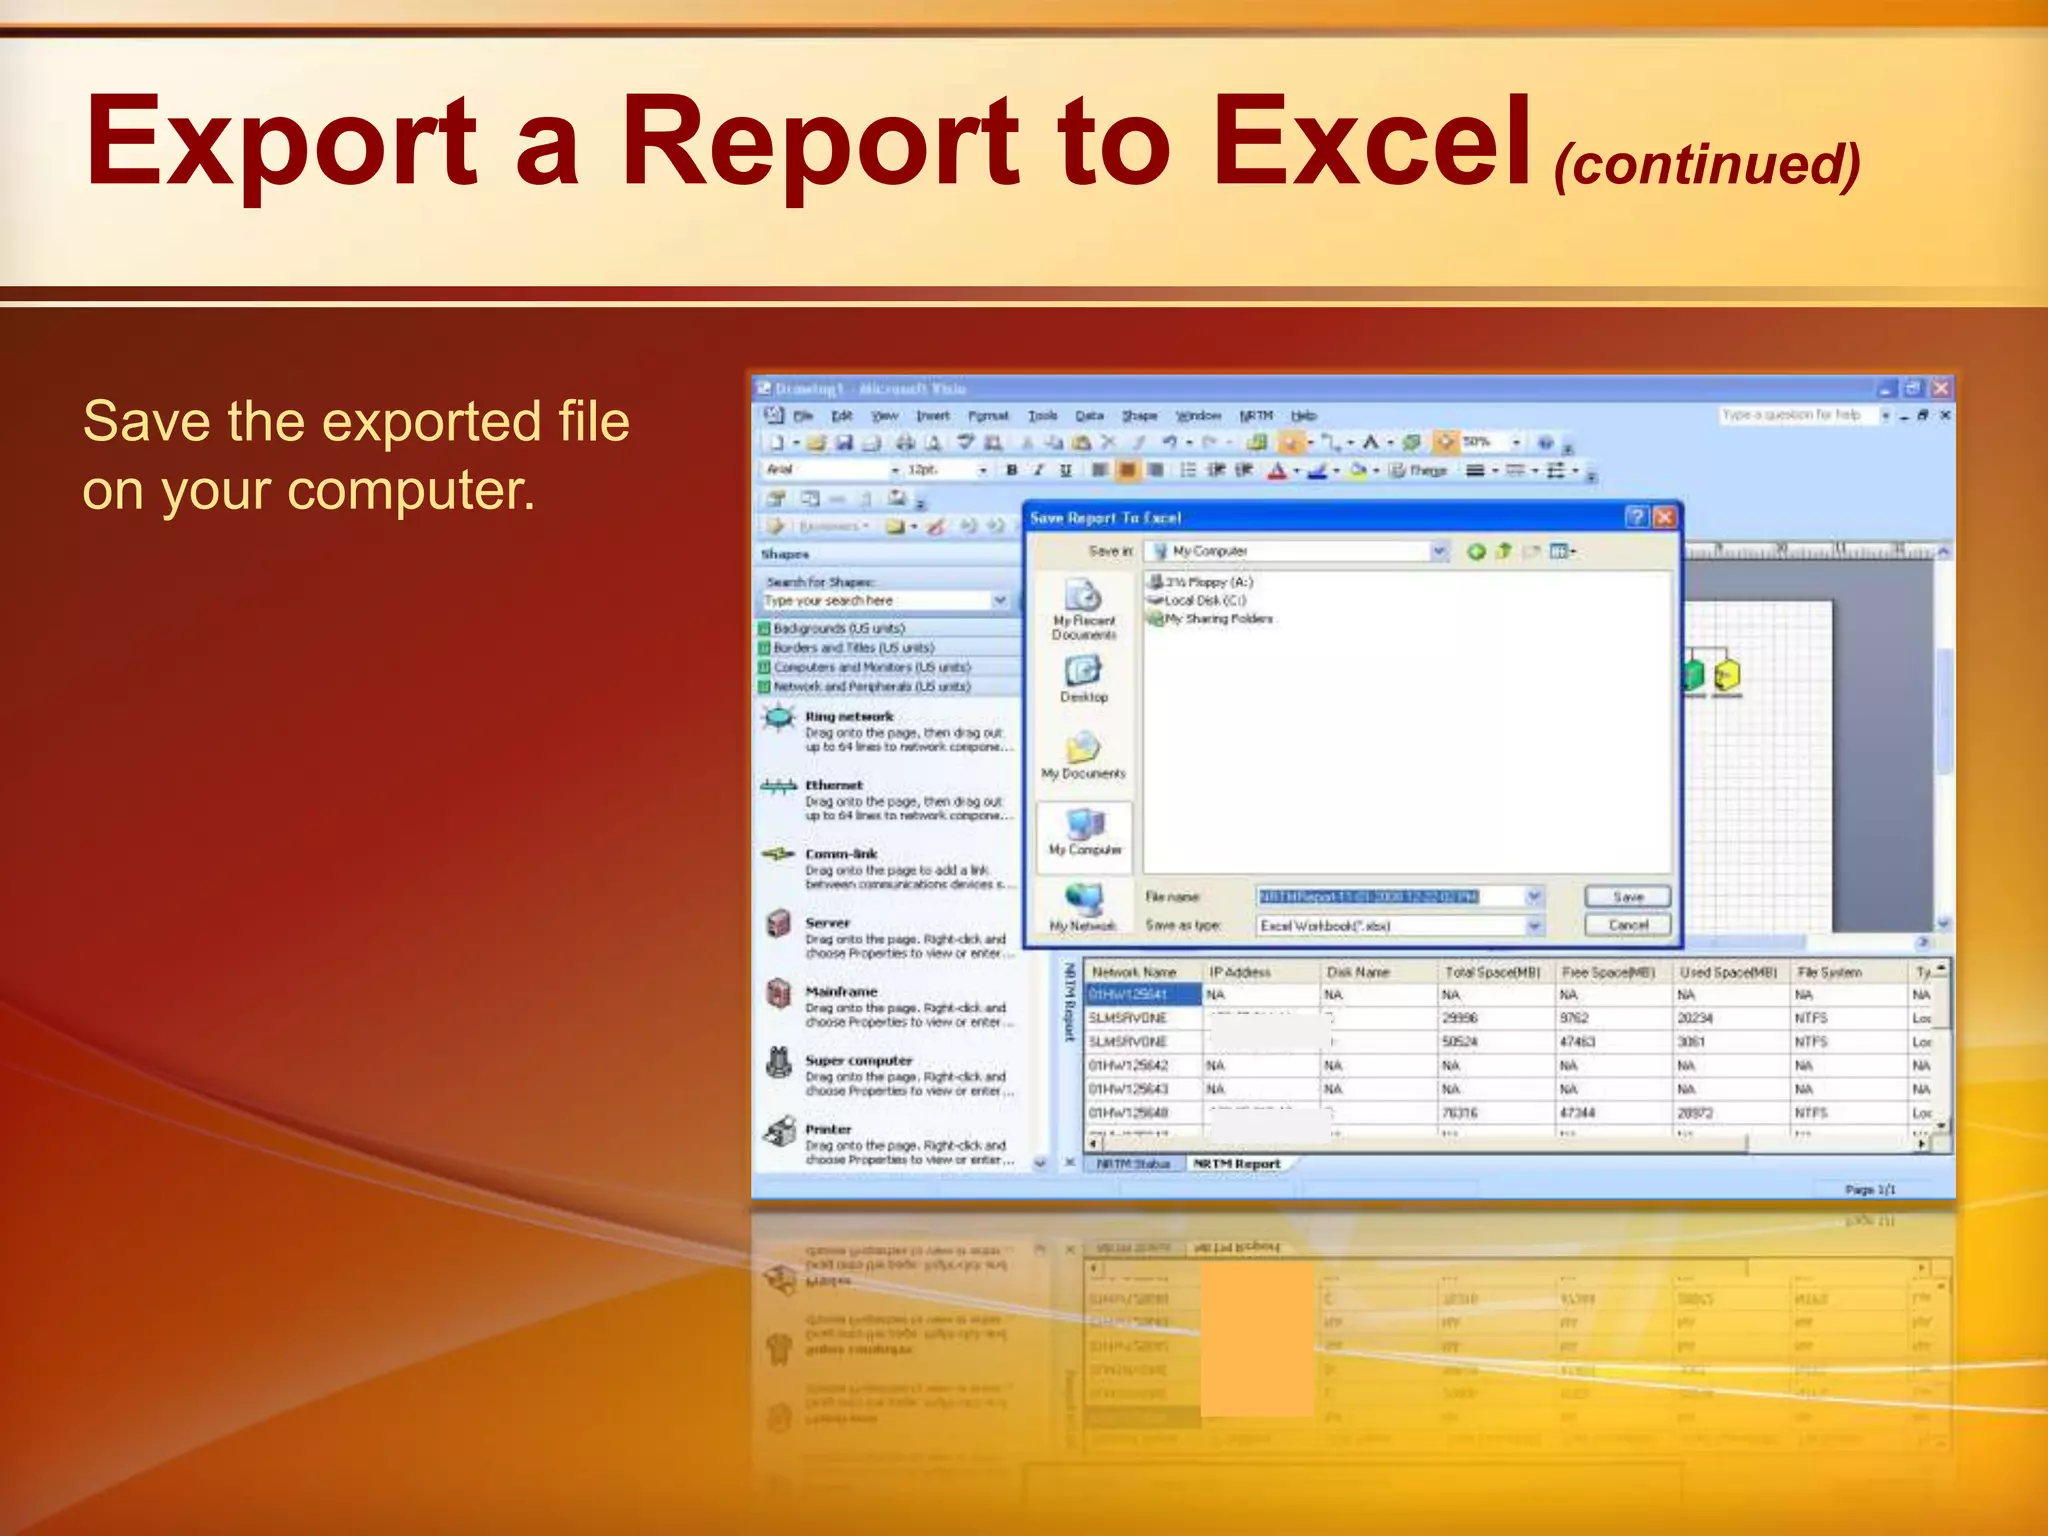
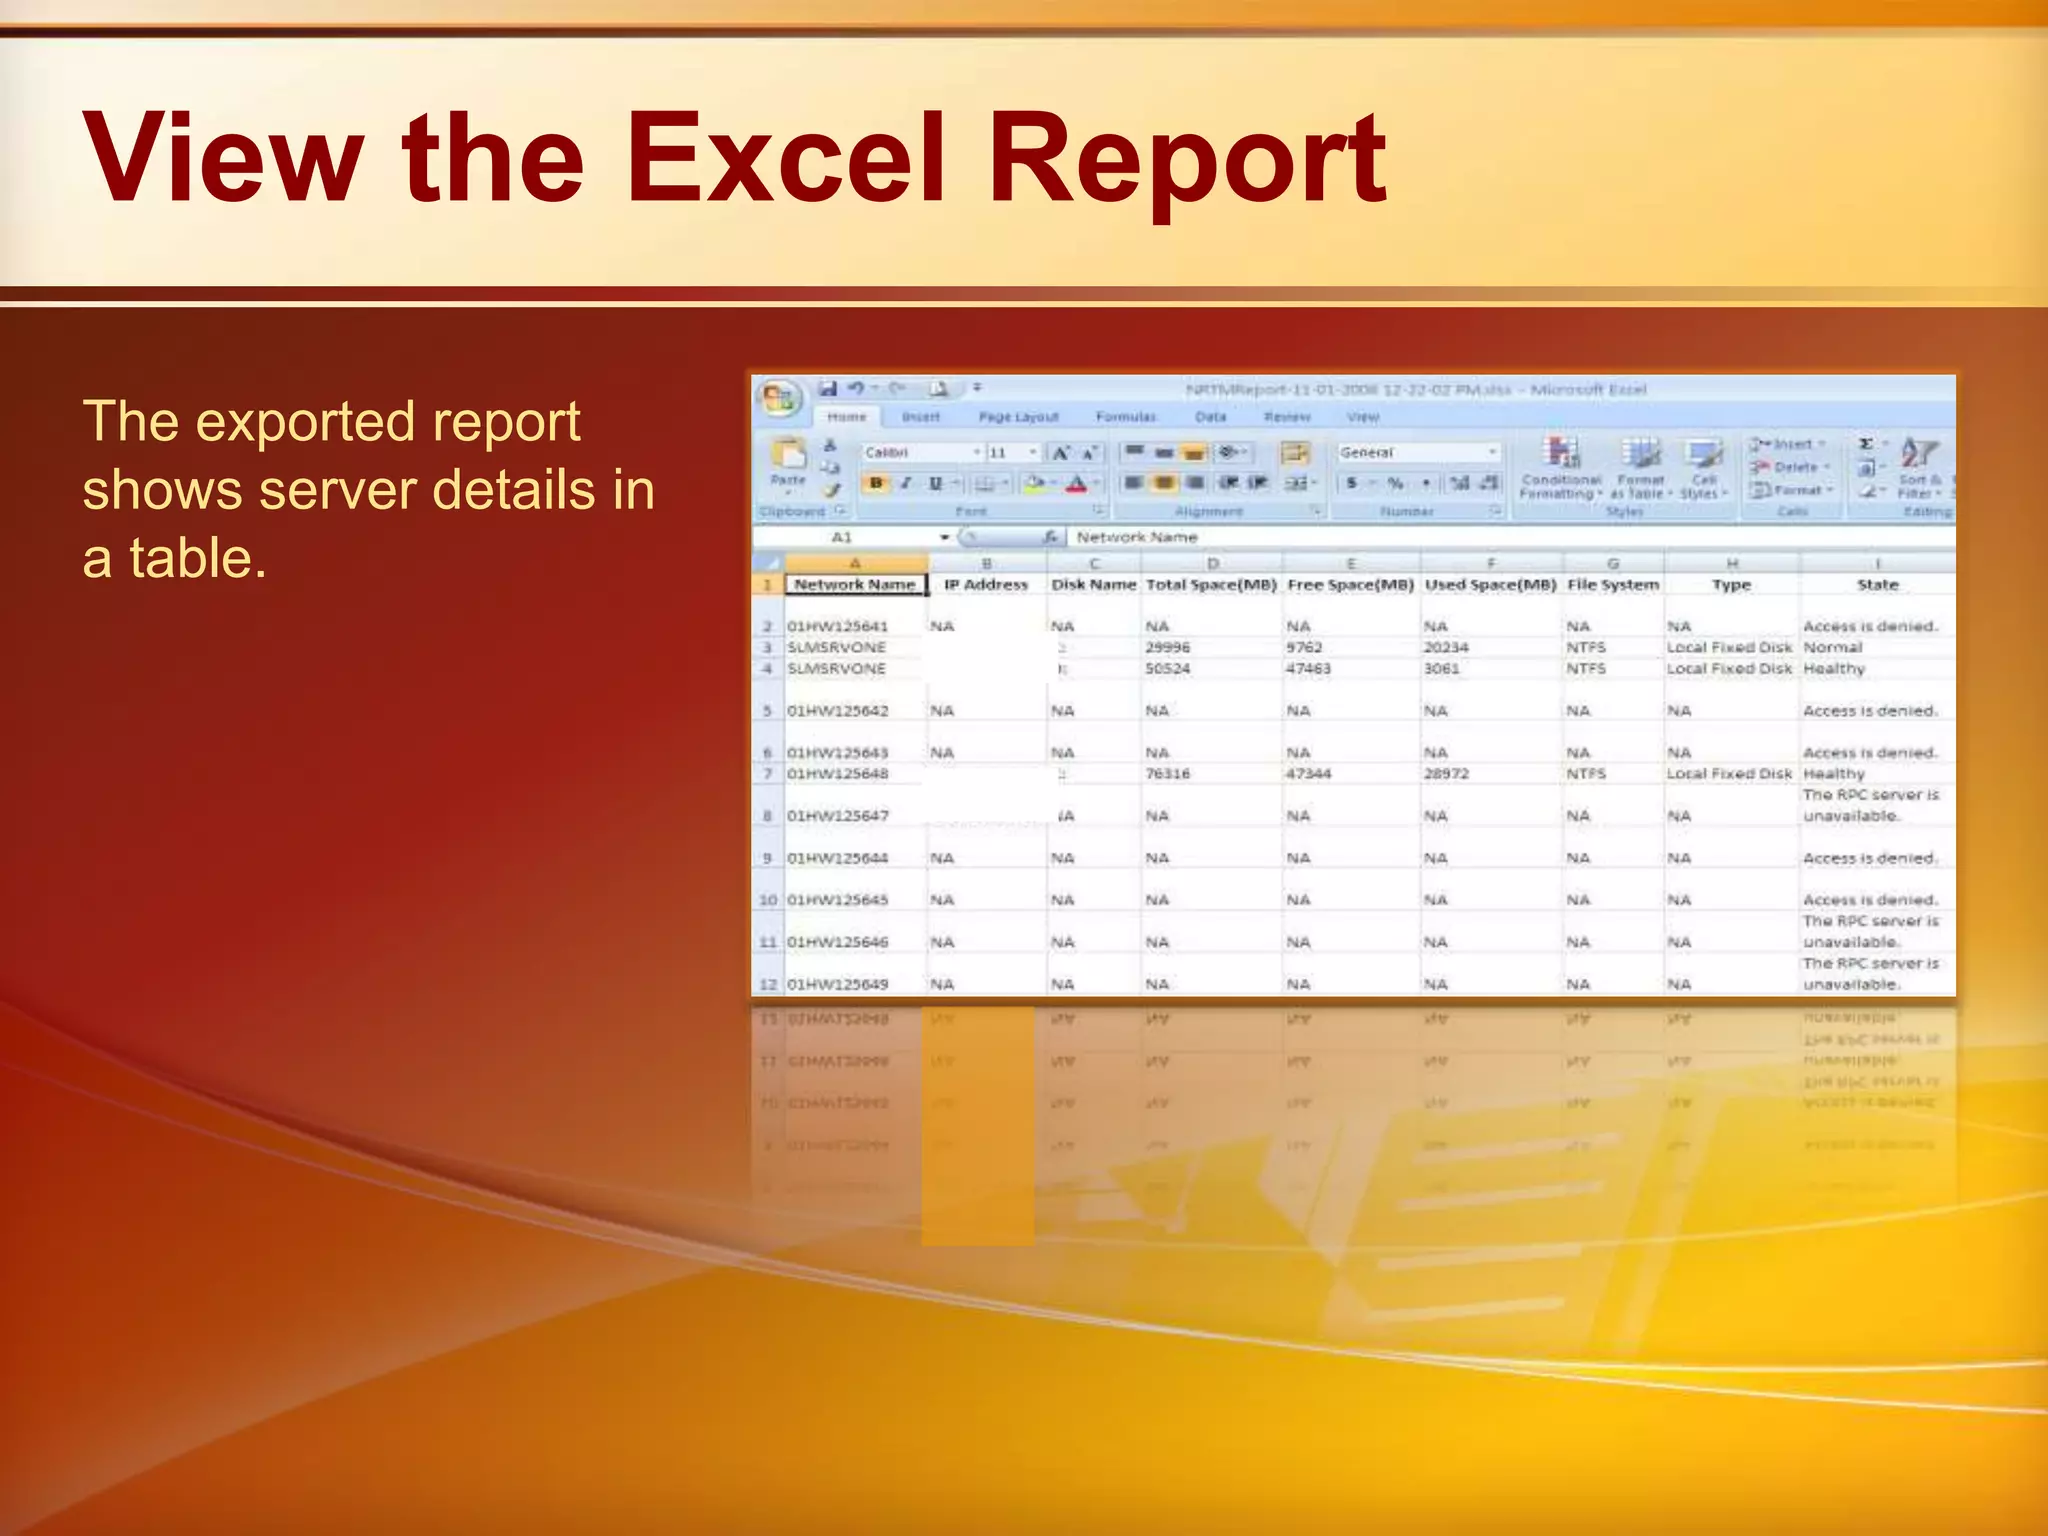
Microsoft®Office Visio®2007ConnectorAdd-in for Data Center Disk Space Monitoring (NRTM)
AgendaChallengesBefore StoryAfter StorySolutionResources
ChallengesData Center AdministratorsDon’t get timely alerts associated with the storage infrastructure so they can quickly take the  appropriate action
Cannot align the computer spatially to quickly locate problem spotsChallengesIT ManagersDon’t have high-level status of the data center storage infrastructure
Lack comprehensive data to make effective plans
Cannot easily summarize technical information in reports that have impact
Have difficulty communicating plans with senior management to get quick approvalAgendaChallengesBefore StoryAfter StorySolutionResources
BeforeAdministrators have to sift through a cumbersome tree view to get to the data they need.
Before (continued)Administrators have to review many screens to get the information they need.
AgendaChallengesBefore StoryAfter StorySolutionResources
AfterAdministrators can view all available servers visually, on one screen.
After (continued)Administrators can quickly get relevant details.
AgendaChallengesBefore StoryAfter StorySolutionResources
Solution OverviewTheData Center Disk Space Monitoring Connector does the following:Uses Visio data graphics to show server details
Enables effective integration of Visio with System Center Operations Manager
Shows server data in a clear, comprehensive diagramSelect a Data SourceSelect the data source that describes the computers you want to monitor.
Select the SCOM ServerIf you select Operations Manager Database, type the root management and reporting server names.
Select the Excel WorkbookIf you selected a Microsoft®Office Excel® Workbook, locate the workbook you want to use.
Format Excel DataThe Excel worksheet you select needs two columns:Column Name1 : Network Name
Column Name2 : IP AddressSelect the Machine ListSelect the machines you want to monitor disk space for.
View the Machine DiagramThe diagram shows the machines you selected.
Set colorsYou can select options to set the color of machines based on threshold values.
Change Threshold ValuesYou can set threshold values for minimum and maximum percentages of disk space used.The color of the server’s shape in the diagram shows when the disk reaches a threshold.
Start MonitoringTo get details about disk space, start the monitoring process.
Monitoring StatusAfter monitoring starts, you see disk space status in the diagram. Server icons are color coded.
Monitoring CompletedAfter monitoring is completed, you see a report.
View Server Status DetailsYou can view disk details for any server in the diagram.
View Server Status Details (continued)To view status details for a server, right-click the server, and then click View Disk Details.
Export a Report to ExcelYou can export status details to an Excel file for further analysis or to use as a report.
Export a Report to Excel(continued)Save the exported file on your computer.
View the Excel ReportThe exported report shows server details in a table.

Visio 2007 It Pro Connector Nrtm

Editor's Notes

  • #4 Microsoft® System Center Operations Manager and other data center tools provide the data center administrator with a quick way to get alerts about storage metrics such as drive space availability, but these tools do not provide information visually. The administrator has to sift through a tree view and use embedded data to figure out what is happening and where.
  • #5 IT managers can see the System Center Operations Manager console at a high level and check whether everything is okay. However, they are unable to share details with senior management because the information is too technical. They are also unable to plan effectively from the information. They need to extract relevant details and then create a business case to share with senior management.
  • #7 The administrator has to sift through a tree view and use embedded data to figure out what is happening and where.
  • #8 The administrator has to go to multiple screens to get the necessary information.
  • #10 Administrators can view all the available servers visually on one screen with smart tags that show additional information.
  • #11 Additional information:TypeFile SystemUsed Space (bytes and GB)Free Space (bytes and GB)Capacity (bytes and GB)
  • #13 The Data Center Disk Space Monitoring Connector forMicrosoft Office Visio® 2007 uses Visio data graphics to display the results of server monitoring. The connector enables effective integration of Microsoft Office Visio 2007 with the service management solution System Center Operations Manager 2007. The connector helps to view the results of monitoring servers in a clear, comprehensive Visio network diagram.
  • #14 Select one of the following data sources:Operations Manager Server DatabaseMicrosoft®Office Excel®WorkbookMachines on Active DocumentThen, click Next.
  • #15 Select Operations Manager Database and then click Next.Type valid server names in the Type theOperations Manager Root Management ServerName and Type theOperations Manager Reporting Server Name boxes and then click Next.All the machines that are monitored by Operations Manager Server are displayed.
  • #16 Select Microsoft Office Excel Workbook and click Next.Select the Excel workbook that contains the list of machines you want to monitor.You can find a sample Excel workbook in the installation path.The Excel work book should be in the following format:Column Name1 Heading: Network NameColumn Name2 Heading: IP AddressAfter you select the Excel workbook, click Open.
  • #18 Visio generates a diagram for all selected machines:All the shapes in the diagram are configured for near real-time monitoring; that is, the network name and IP Address are added to the Visio shape. Each page can contain up to 102 machines. If the number of shapes exceeds 102, a Visio adds a new page to the drawing. While Visio generates the diagram, you see a status window.To cancel the current diagram, click Cancel.
  • #19 Diagram of the selected machines.
  • #21 Before you start the monitoring process, you can change the color of the data graphics according to a threshold value for the percentage of disk space used.To change the threshold value:On the NRTM menu, click Options.For each server state, type threshold values forMin Value (%) and Max Value (%). Note: If data is unavailable for any machine or access is denied, the shape color will change to black.
  • #22 To start monitoring the selected machines:On the NRTM menu, click Perform Monitoring, and then click Start.Note: You can also start monitoring by moving the mouse pointer over the server shape and clicking Start Disk Space Monitoring.
  • #23 The status window shows thecurrent monitoring status. To cancel the current scan, click Cancel.
  • #24 After monitoring is completed, the Report window displays the disk space details of all drives for each selected machine.
  • #25 Move the mouse pointer over any machine to view the status of the machine.
  • #26 To view the details of a machine, right-click its shape, and then click View Disk Details.For each disk in the monitored machine, the following details are displayed:TypeFile SystemUsed Space (bytes and GB)Free Space (bytes and GB)Capacity (bytes and GB)
  • #28 Save the report in the desired location. The default path is the installation path. The default report name is NRTMReport-Date-Time.xlsx.
  • #29 The exported report is in table format.