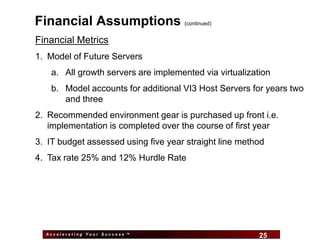
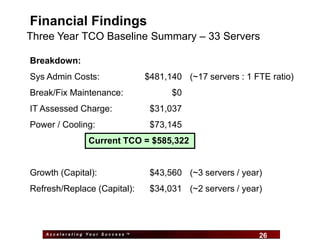
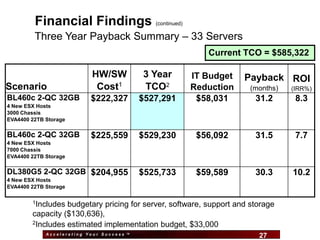
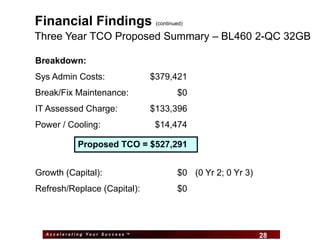
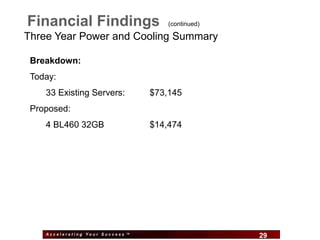
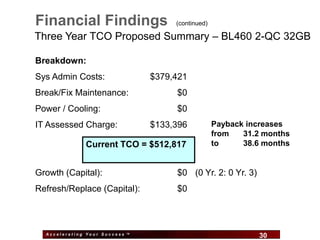
Customer in Cincinnati, OH
Windows® Server Consolidation Project
Initial Presentation
 David Koester         Account Manger
 Jim Wallburg          Project Manager
 Tom Lorenz            Technology Architect
 Mike Fee              IT Financial Consultant    November 14, 2008


                                                 Accelerating Your Success™
Agenda

•   Introductions
•   Overview of Project
•   Review and discuss captured performance metrics
•   Review initial analysis and confirm architecture assumptions
•   Review initial analysis and confirm financial assumptions
•   Solicit changes to prepare for the final presentation and report
•   Next Steps


     Accelerating Your Success ™
                                      2                          2
Business Goals of Consolidation
•Server hardware approaching end of life
•Control data center footprint
•Reduce electricity and cooling expense


  Accelerating Your Success ™
                                 3         3
Consolidation Impact Assessment
•   Considers both the Technical and Financial Impact of Server and
    Storage Consolidation
•   Uses the VMware Capacity Planner tool
    – Non-disruptively captures hardware and software inventory from current
      environment
    – Measures actual utilization of servers and records the peak workloads
    – Uses peak workloads to create consolidation scenario(s)
    – Used data collected by VMware from July 19 to September 5, 2008
•   Model Financial Impact using Brigham-Gapenski Methodology
    –   Based on Intermediate Financial Management, 5th Edition (1996)
    –   Follows the model for evaluating asset replacement “Investment Decisions”
    –   Provides a familiar analysis for those in finance who support IT
    –   Develops a Total Cost of Ownership (TCO) baseline of current environment
    –   Compares the baseline to the TCO of the recommended environment(s)
    –   Provides a detailed Return On Investment analysis


          Accelerating Your Success ™
                                           4                           4
High Level View – A Dashboard


 Accelerating Your Success ™
                               5   5
Inventory Details - Chassis


 Accelerating Your Success ™
                               6   6
Inventory Details – CPU


 Accelerating Your Success ™
                               7   7
Inventory Details – NIC’s


 Accelerating Your Success ™
                               8   8
Weekly Loads – Business Hours


Accelerating Your Success ™
                              9   9
Weekly Loads – Peak Hours


 Accelerating Your Success ™
                               10   10
Processor Peak Load & Peak Hour


Accelerating Your Success ™
                              11   11
Vintage System


 Accelerating Your Success ™
                               12   12
Created Scenarios

                                                                                           Consolida
                                        Servers                      Not         New          tion
Name                                      In      Consolidated   Consolidated   Servers    Ratios x:1
All servers to BL460c 3.0Ghz (2-QC)
32GB                                      33          33              0          3 (*)         10

All servers to DL380 G5 3.0Ghz (2-QC)
32GB                                      33          33              0          3 (*)         10
All servers to BL460c 3.0Ghz (2-QC)
16GB                                      33          32              1           5            >6
All servers to DL380 G5 3.0Ghz (2-QC)
16GB                                      33          32              1           5            >6

                              * NOTE: Add (N+1) BL460c Server for redundancy


           Accelerating Your Success ™
                                                     13                                   13
Defining Target Server and Thresholds
BL460c 2QC 32GB Servers


Accelerating Your Success ™
                              14   14
Consolidation Recommendations Server Assignments


 Accelerating Your Success ™
                               15     15
Server Disk Inventory


          Path    Type       Total Size (MB)        Total Free (MB)   Count
           C:     NTFS           1,557,806             1,090,814       33

           D:     FAT32           13,134                 9,964          1

           D:     NTFS            503,876               395,683         9

           D:      UDF             445                    0             1


                  Totals         2,075,261            1,496,461


                            Total Used Space           578,800


   Accelerating Your Success ™
                                               16                             16
Current External Storage Capacity
             Path              Type    Total Size (MB)   Total Free (MB)    Count

               E:              NTFS        4,990,394       2,830,960            18

               F:              NTFS        1,647,389        508,033             6

              G:               NTFS        2,024,914        835,385             8

               H:              NTFS        2,485,956        150,833             5

               I:              NTFS        2,919,520        973,370             5

               J:              NTFS         669,984         254,506             4

               K:              NTFS         389,984         146,663             4

               L:              NTFS         558,357         261,729             4

          All Local and Local Attached Storage = 3TB
            M:           NTFS     629,978    378,900                            3

               N:              NTFS         629,978         356,598             3

              O:               NTFS         757,674         156,897             4

               P:              NTFS         374,416         321,211             3

              Q:               NTFS         147,352         128,076             3

               R:              NTFS         139,424         137,218             2

               T:              NTFS         230,227          22,027             3

               U:              NTFS         416,561         255,711             2

               V:              NTFS         842,232         328,476             3

              W:               NTFS         139,973         104,840             1

               Z:              NTFS         476,938         140,368             1


        External Storage                   20,471,251      8,291,801


 Accelerating Your Success ™
                                      17                                   17
Example C3000, C7000, EVA4400 Rack Placement

C7000 Chassis                    EVA4400   C3000 Chassis


   Accelerating Your Success ™
                                    18         18
End of Technical Portion


                        Questions?


 Accelerating Your Success ™
                               19    19
Financial Assumptions
Windows Server Budget (built from following)
1. System Administration
2. Growth
3. Lifecycle Management / Replacement
4. Maintenance
5. Power and Cooling


  Accelerating Your Success ™
                                20             20
Financial Assumptions                (continued)


System Administration Windows Server Budget
1. Three (3) Full Time Equivalent (FTE) for Core Windows System
   Management (50 servers)
2. 100% utilized for actual server management
3. $75,000 assumed average annual fully burdened cost per FTE
4. Prorated to the actual number of servers modeled for each
   consolidation scenario


  Accelerating Your Success ™
                                21                     21
Financial Assumptions                (continued)


Growth and Replacement Budget
1. 8% net new physical server annual growth rate
2. 6.3% Lifecycle Management rate (16 years)
   a) Average four year expected useful life
   b) Using one fourth of servers as candidates for replacements
   c) IT actually replaces 25% of the replacement candidates
3. $5,500 average current server cost
   a) Hardware only
   b) Includes any warranty uplift
   c) No OS, middleware, application, etc.


  Accelerating Your Success ™
                                22                    22
Financial Assumptions                 (continued)


Maintenance Budget
1. 24 months average server age calculated from Average
   Server CPU MHz (2647)
2. Servers greater than 36 months in age
    a. On average calculated to be 24.8% of total
    b. Using $0 per server per year
3. Servers less than or equal to 36 months in age
    a. On average calculated to be 75.2% of total
    b. Using $0 per server per year


  Accelerating Your Success ™
                                23                   23
Financial Assumptions                  (continued)


Power and Cooling Budget
 Not Assessed to IT Budget – Included in Analysis
1. $0.09 per KWH
2. Use server plate input wattage
    $684.11 average per
     existing server per year (33)


     Accelerating Your Success ™
                                    24                 24
Financial Assumptions                 (continued)


Financial Metrics
1. Model of Future Servers
    a. All growth servers are implemented via virtualization
    b. Model accounts for additional VI3 Host Servers for years two
       and three
2. Recommended environment gear is purchased up front i.e.
   implementation is completed over the course of first year
3. IT budget assessed using five year straight line method
4. Tax rate 25% and 12% Hurdle Rate


  Accelerating Your Success ™
                                25                       25
Financial Findings
Three Year TCO Baseline Summary – 33 Servers

Breakdown:
Sys Admin Costs:                  $481,140 (~17 servers : 1 FTE ratio)
Break/Fix Maintenance:                     $0
IT Assessed Charge:                $31,037
Power / Cooling:                   $73,145
                 Current TCO = $585,322


Growth (Capital):                  $43,560 (~3 servers / year)
Refresh/Replace (Capital):         $34,031 (~2 servers / year)


    Accelerating Your Success ™
                                      26                     26
Financial Findings                   (continued)

         Three Year Payback Summary – 33 Servers
                                                               Current TCO = $585,322

                           HW/SW           3 Year           IT Budget   Payback ROI
Scenario                    Cost1          TCO2             Reduction   (months)   (IRR%)
BL460c 2-QC 32GB           $222,327        $527,291          $58,031     31.2       8.3
4 New ESX Hosts
3000 Chassis
EVA4400 22TB Storage

BL460c 2-QC 32GB           $225,559        $529,230          $56,092     31.5       7.7
4 New ESX Hosts
7000 Chassis
EVA4400 22TB Storage

DL380G5 2-QC 32GB $204,955                 $525,733          $59,589     30.3      10.2
4 New ESX Hosts
EVA4400 22TB Storage

        1Includes budgetary pricing for server, software, support and storage
        capacity ($130,636),
        2Includes estimated implementation budget, $33,000

             Accelerating Your Success ™
                                                 27                       27
Financial Findings               (continued)

Three Year TCO Proposed Summary – BL460 2-QC 32GB

Breakdown:
Sys Admin Costs:                $379,421
Break/Fix Maintenance:                   $0
IT Assessed Charge:             $133,396
Power / Cooling:                 $14,474

            Proposed TCO = $527,291


Growth (Capital):                        $0 (0 Yr 2; 0 Yr 3)
Refresh/Replace (Capital):               $0


  Accelerating Your Success ™
                                    28                         28
Financial Findings                    (continued)

Three Year Power and Cooling Summary

 Breakdown:
 Today:
    33 Existing Servers:          $73,145
 Proposed:
    4 BL460 32GB                  $14,474


    Accelerating Your Success ™
                                    29              29
Financial Findings                     (continued)

Three Year TCO Proposed Summary – BL460 2-QC 32GB

Breakdown:
Sys Admin Costs:                $379,421
Break/Fix Maintenance:                 $0
Power / Cooling:                       $0
IT Assessed Charge:             $133,396             Payback increases
                                                     from   31.2 months
              Current TCO = $512,817                 to     38.6 months


Growth (Capital):                      $0 (0 Yr. 2: 0 Yr. 3)
Refresh/Replace (Capital):             $0


  Accelerating Your Success ™
                                  30                           30
Thank you for your time!


                        Questions?


 Accelerating Your Success ™
                               31    31
Server Administration Tasks                   (for reference only)


1. Deploying servers,
2. Software installation and configuration,
3. Physical installation (conventional server),
4. Proactive upgrading servers (patches/service packs/applications),
5. Monitoring,
6. Backup/Recovery,
7. Labor hours for unplanned downtime,
8. Problem resolution,
9. User Support,
10.Training, Security,
11.HW Procurement/Inventory, and
12.Miscellaneous (e-mail, staff meetings/reporting, etc.)


  Accelerating Your Success ™
                                32                             32

Virtualization Assessment Example

  • 1.
    Customer in Cincinnati,OH Windows® Server Consolidation Project Initial Presentation David Koester Account Manger Jim Wallburg Project Manager Tom Lorenz Technology Architect Mike Fee IT Financial Consultant November 14, 2008 Accelerating Your Success™
  • 2.
    Agenda • Introductions • Overview of Project • Review and discuss captured performance metrics • Review initial analysis and confirm architecture assumptions • Review initial analysis and confirm financial assumptions • Solicit changes to prepare for the final presentation and report • Next Steps Accelerating Your Success ™ 2 2
  • 3.
    Business Goals ofConsolidation •Server hardware approaching end of life •Control data center footprint •Reduce electricity and cooling expense Accelerating Your Success ™ 3 3
  • 4.
    Consolidation Impact Assessment • Considers both the Technical and Financial Impact of Server and Storage Consolidation • Uses the VMware Capacity Planner tool – Non-disruptively captures hardware and software inventory from current environment – Measures actual utilization of servers and records the peak workloads – Uses peak workloads to create consolidation scenario(s) – Used data collected by VMware from July 19 to September 5, 2008 • Model Financial Impact using Brigham-Gapenski Methodology – Based on Intermediate Financial Management, 5th Edition (1996) – Follows the model for evaluating asset replacement “Investment Decisions” – Provides a familiar analysis for those in finance who support IT – Develops a Total Cost of Ownership (TCO) baseline of current environment – Compares the baseline to the TCO of the recommended environment(s) – Provides a detailed Return On Investment analysis Accelerating Your Success ™ 4 4
  • 5.
    High Level View– A Dashboard Accelerating Your Success ™ 5 5
  • 6.
    Inventory Details -Chassis Accelerating Your Success ™ 6 6
  • 7.
    Inventory Details –CPU Accelerating Your Success ™ 7 7
  • 8.
    Inventory Details –NIC’s Accelerating Your Success ™ 8 8
  • 9.
    Weekly Loads –Business Hours Accelerating Your Success ™ 9 9
  • 10.
    Weekly Loads –Peak Hours Accelerating Your Success ™ 10 10
  • 11.
    Processor Peak Load& Peak Hour Accelerating Your Success ™ 11 11
  • 12.
    Vintage System AcceleratingYour Success ™ 12 12
  • 13.
    Created Scenarios Consolida Servers Not New tion Name In Consolidated Consolidated Servers Ratios x:1 All servers to BL460c 3.0Ghz (2-QC) 32GB 33 33 0 3 (*) 10 All servers to DL380 G5 3.0Ghz (2-QC) 32GB 33 33 0 3 (*) 10 All servers to BL460c 3.0Ghz (2-QC) 16GB 33 32 1 5 >6 All servers to DL380 G5 3.0Ghz (2-QC) 16GB 33 32 1 5 >6 * NOTE: Add (N+1) BL460c Server for redundancy Accelerating Your Success ™ 13 13
  • 14.
    Defining Target Serverand Thresholds BL460c 2QC 32GB Servers Accelerating Your Success ™ 14 14
  • 15.
    Consolidation Recommendations ServerAssignments Accelerating Your Success ™ 15 15
  • 16.
    Server Disk Inventory Path Type Total Size (MB) Total Free (MB) Count C: NTFS 1,557,806 1,090,814 33 D: FAT32 13,134 9,964 1 D: NTFS 503,876 395,683 9 D: UDF 445 0 1 Totals 2,075,261 1,496,461 Total Used Space 578,800 Accelerating Your Success ™ 16 16
  • 17.
    Current External StorageCapacity Path Type Total Size (MB) Total Free (MB) Count E: NTFS 4,990,394 2,830,960 18 F: NTFS 1,647,389 508,033 6 G: NTFS 2,024,914 835,385 8 H: NTFS 2,485,956 150,833 5 I: NTFS 2,919,520 973,370 5 J: NTFS 669,984 254,506 4 K: NTFS 389,984 146,663 4 L: NTFS 558,357 261,729 4 All Local and Local Attached Storage = 3TB M: NTFS 629,978 378,900 3 N: NTFS 629,978 356,598 3 O: NTFS 757,674 156,897 4 P: NTFS 374,416 321,211 3 Q: NTFS 147,352 128,076 3 R: NTFS 139,424 137,218 2 T: NTFS 230,227 22,027 3 U: NTFS 416,561 255,711 2 V: NTFS 842,232 328,476 3 W: NTFS 139,973 104,840 1 Z: NTFS 476,938 140,368 1 External Storage 20,471,251 8,291,801 Accelerating Your Success ™ 17 17
  • 18.
    Example C3000, C7000,EVA4400 Rack Placement C7000 Chassis EVA4400 C3000 Chassis Accelerating Your Success ™ 18 18
  • 19.
    End of TechnicalPortion Questions? Accelerating Your Success ™ 19 19
  • 20.
    Financial Assumptions Windows ServerBudget (built from following) 1. System Administration 2. Growth 3. Lifecycle Management / Replacement 4. Maintenance 5. Power and Cooling Accelerating Your Success ™ 20 20
  • 21.
    Financial Assumptions (continued) System Administration Windows Server Budget 1. Three (3) Full Time Equivalent (FTE) for Core Windows System Management (50 servers) 2. 100% utilized for actual server management 3. $75,000 assumed average annual fully burdened cost per FTE 4. Prorated to the actual number of servers modeled for each consolidation scenario Accelerating Your Success ™ 21 21
  • 22.
    Financial Assumptions (continued) Growth and Replacement Budget 1. 8% net new physical server annual growth rate 2. 6.3% Lifecycle Management rate (16 years) a) Average four year expected useful life b) Using one fourth of servers as candidates for replacements c) IT actually replaces 25% of the replacement candidates 3. $5,500 average current server cost a) Hardware only b) Includes any warranty uplift c) No OS, middleware, application, etc. Accelerating Your Success ™ 22 22
  • 23.
    Financial Assumptions (continued) Maintenance Budget 1. 24 months average server age calculated from Average Server CPU MHz (2647) 2. Servers greater than 36 months in age a. On average calculated to be 24.8% of total b. Using $0 per server per year 3. Servers less than or equal to 36 months in age a. On average calculated to be 75.2% of total b. Using $0 per server per year Accelerating Your Success ™ 23 23
  • 24.
    Financial Assumptions (continued) Power and Cooling Budget  Not Assessed to IT Budget – Included in Analysis 1. $0.09 per KWH 2. Use server plate input wattage  $684.11 average per existing server per year (33) Accelerating Your Success ™ 24 24
  • 25.
    Financial Assumptions (continued) Financial Metrics 1. Model of Future Servers a. All growth servers are implemented via virtualization b. Model accounts for additional VI3 Host Servers for years two and three 2. Recommended environment gear is purchased up front i.e. implementation is completed over the course of first year 3. IT budget assessed using five year straight line method 4. Tax rate 25% and 12% Hurdle Rate Accelerating Your Success ™ 25 25
  • 26.
    Financial Findings Three YearTCO Baseline Summary – 33 Servers Breakdown: Sys Admin Costs: $481,140 (~17 servers : 1 FTE ratio) Break/Fix Maintenance: $0 IT Assessed Charge: $31,037 Power / Cooling: $73,145 Current TCO = $585,322 Growth (Capital): $43,560 (~3 servers / year) Refresh/Replace (Capital): $34,031 (~2 servers / year) Accelerating Your Success ™ 26 26
  • 27.
    Financial Findings (continued) Three Year Payback Summary – 33 Servers Current TCO = $585,322 HW/SW 3 Year IT Budget Payback ROI Scenario Cost1 TCO2 Reduction (months) (IRR%) BL460c 2-QC 32GB $222,327 $527,291 $58,031 31.2 8.3 4 New ESX Hosts 3000 Chassis EVA4400 22TB Storage BL460c 2-QC 32GB $225,559 $529,230 $56,092 31.5 7.7 4 New ESX Hosts 7000 Chassis EVA4400 22TB Storage DL380G5 2-QC 32GB $204,955 $525,733 $59,589 30.3 10.2 4 New ESX Hosts EVA4400 22TB Storage 1Includes budgetary pricing for server, software, support and storage capacity ($130,636), 2Includes estimated implementation budget, $33,000 Accelerating Your Success ™ 27 27
  • 28.
    Financial Findings (continued) Three Year TCO Proposed Summary – BL460 2-QC 32GB Breakdown: Sys Admin Costs: $379,421 Break/Fix Maintenance: $0 IT Assessed Charge: $133,396 Power / Cooling: $14,474 Proposed TCO = $527,291 Growth (Capital): $0 (0 Yr 2; 0 Yr 3) Refresh/Replace (Capital): $0 Accelerating Your Success ™ 28 28
  • 29.
    Financial Findings (continued) Three Year Power and Cooling Summary Breakdown: Today: 33 Existing Servers: $73,145 Proposed: 4 BL460 32GB $14,474 Accelerating Your Success ™ 29 29
  • 30.
    Financial Findings (continued) Three Year TCO Proposed Summary – BL460 2-QC 32GB Breakdown: Sys Admin Costs: $379,421 Break/Fix Maintenance: $0 Power / Cooling: $0 IT Assessed Charge: $133,396 Payback increases from 31.2 months Current TCO = $512,817 to 38.6 months Growth (Capital): $0 (0 Yr. 2: 0 Yr. 3) Refresh/Replace (Capital): $0 Accelerating Your Success ™ 30 30
  • 31.
    Thank you foryour time! Questions? Accelerating Your Success ™ 31 31
  • 32.
    Server Administration Tasks (for reference only) 1. Deploying servers, 2. Software installation and configuration, 3. Physical installation (conventional server), 4. Proactive upgrading servers (patches/service packs/applications), 5. Monitoring, 6. Backup/Recovery, 7. Labor hours for unplanned downtime, 8. Problem resolution, 9. User Support, 10.Training, Security, 11.HW Procurement/Inventory, and 12.Miscellaneous (e-mail, staff meetings/reporting, etc.) Accelerating Your Success ™ 32 32