2. Ј
¯
= −
TЈ
T¯
= ͑␥ − 1͒M2uЈ
u¯
, ͑1͒
where , T, and u are the density, temperature, and stream-
wise velocity and M is the mean flow Mach number. Overbar
represents Reynolds averaging, while prime indicates the
fluctuating part.
Mahesh et al.10
found that the presence of upstream en-
tropy fluctuations significantly affects shock/turbulence inter-
actions. A negative correlation between the upstream veloc-
ity and temperature fluctuations is found to cause higher
levels of turbulence amplification across the shock, whereas
a positive correlation is seen to have the opposite effect. In
this paper, we study the effect of upstream velocity-
temperature correlation on the amplification of k in the
RANS framework. The objective is to use linear inviscid
analysis to improve model predictions in the presence of
temperature fluctuations in the incoming turbulent flow.
The paper is organized as follows. A comprehensive
statement of the problem is given in the next section. This is
followed by an analysis of the governing equation for turbu-
lent kinetic energy across a shock wave. The source term
corresponding to the production mechanism due to the mean
pressure gradient is found to be the dominant mechanism
through which the velocity-temperature correlation affects k
amplification across the shock. A model is then developed
for this term using linear analysis results. The dissipation rate
equation is also modified in a similar way. The resulting
model is finally applied to predict the evolution of turbulent
kinetic energy in shock/homogeneous turbulence interaction,
and results are compared with the available DNS data.
II. PROBLEM DESCRIPTION
We consider uniform mean flow upstream and down-
stream of a normal shock. The shock wave is steady in the
mean and undergoes small deviations from its mean position
in response to the turbulent fluctuations. The turbulence up-
stream of the shock is assumed to be homogeneous and iso-
tropic, with the thermodynamic field related to the velocity
fluctuations by
Ј
¯
= −
TЈ
T¯
= AuT
uЈ
u¯
. ͑2͒
Here, the acoustic fluctuations are neglected ͑pЈ=0͒ and
Morkovin’s hypothesis is satisfied for AuT=͑␥−1͒M2
. AuT
can be interpreted as the ratio of normalized temperature and
velocity fluctuations, and it can be readily seen that
uЈTЈ
u¯T¯
= − AuT
uЈ2
u¯2
. ͑3͒
We choose constant values of AuT and study the effect of
uЈTЈ on the amplification in k across a normal shock as a
function of the upstream Mach number. Both positive and
negative values of AuT are considered, which correspond to
uЈTЈϽ0 and uЈTЈϾ0, respectively. A quadratic variation of
AuT with Mach number that is consistent with Morkovin’s
hypothesis, Eq. ͑1͒, is also presented.
Mahesh et al.11
considered the interaction of vorticity-
entropy waves with a normal shock. The ratio of entropy to
vorticity magnitudes of each wave is defined as Ar and the
phase difference is given by r. It can be shown that Areir
=AuT sin , where is the angle made by the wave number
vector with the shock-normal direction. Thus r=0 for the
positive AuT values considered in this work, while negative
AuT values correspond to r=. In both cases, the sin
functional dependence results in an axisymmetric entropy
field for an isotropic vortical flow.
III. TRANSPORT EQUATION FOR k
For turbulent fluctuations passing through a normal
shock wave, the unsteady distortion of the shock from its
mean position can be written as x=͑y,z,t͒, where x is the
shock-normal direction. To account for the shock-
unsteadiness effects, Sinha et al.5
derived a transport equa-
tion for k in the frame of reference attached to the instanta-
neous shock wave. The key results are reproduced below for
the sake of completeness.
Assuming that the shock undergoes small deviations
from its mean position, the linearized momentum conserva-
tion equation is written in the frame of reference that is at-
tached to the shock. This equation is then used to derive the
following transport equation for uЉ2
:
¯u˜
ץ
ץx
uЉ2
2
= − ¯uЉ2ץu˜
ץx
+ ¯uЉt
ץu˜
ץx
− uЉ
ץp¯
ץx
− uЈp,xЈ , ͑4͒
where p is pressure and t is the linear velocity of the shock
in the streamwise direction. Tilde represents Favre averag-
ing, with double prime being Favre fluctuations. Note that
higher order and viscous terms are neglected in the vicinity
of the shock wave.
The source terms on the right hand side are identified as
the production due to mean compression, the shock-
unsteadiness term, the production due to mean pressure gra-
dient, and the pressure-velocity term. These are denoted by
Pk, Sk
1
, ⌸k
3
, and ⌸k
1
, respectively. The production due to mean
pressure gradient can be written as
⌸k
3
= − uЉ
ץp¯
ץx
=
ЈuЈ
¯
ץp¯
ץx
=
uЈTЈ
T¯
¯u˜
ץu˜
ץx
, ͑5͒
where Ј/¯ =−TЈ/T¯ is based on the assumption that pressure
fluctuations are negligible in the inflow turbulence. Note that
negatively correlated velocity and temperature fluctuations
͑uЈTЈϽ0͒ result in a positive source term, thus enhancing
the amplification of uЉ2
. On the other hand, a positive uЈTЈ
correlation has a damping effect on uЉ2
. This is identical to
the trend observed in linear analysis11
and DNSs.10,12
A similar transport equation is derived for the transverse
velocity fluctuations vЉ2
,
025101-2 V. K. Veera and K. Sinha Phys. Fluids 21, 025101 ͑2009͒
Downloaded 05 Nov 2010 to 129.169.126.158. Redistribution subject to AIP license or copyright; see http://pof.aip.org/about/rights_and_permissions
3. ¯u˜
ץ
ץx
vЉ2
2
= − ¯u˜vЉy
ץu˜
ץx
, ͑6͒
where y is the angular distortion of the shock, and the
source term due to shock distortion is denoted by Sk
2
. Note
that wЉ2
follows an equation similar to vЉ2
.
The linearized Rankine–Hugoniot relations presented by
Mahesh et al.10
are used to write the following equations for
the change in uЈ2
and vЈ2
across a shock:
¯1u¯1
1
2
͑u2Ј2
− u1Ј2
͒ = − ¯1u1ЈumЈ⌬u¯ + ¯1umЈt⌬u¯
+
umЈT1Ј
T¯
1
¯1u¯1⌬u¯ − umЈ͑p2Ј − p1Ј͒, ͑7͒
¯1u¯1
1
2 ͑v2Ј2
− v1Ј2
͒ = − ¯1u¯1
1
2 ͑v1Ј + v2Ј͒y⌬u¯, ͑8͒
where umЈ =͑u1Ј+u2Ј͒/2 and ⌬u¯ =͑u¯2−u¯1͒; subscripts 1 and 2
denote shock upstream and downstream locations. The above
equations can be interpreted as integrated forms of Eqs. ͑4͒
and ͑6͒, with one-to-one correspondence between the terms
on the left and right hand sides. Note that uЉ=uЈ and u˜ =u¯ in
the linear limit.
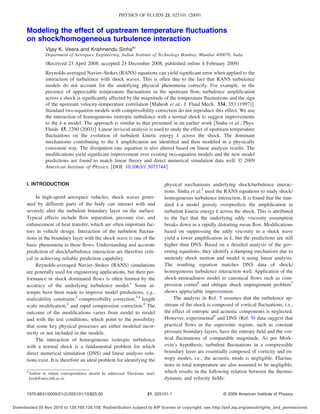
Figure 1 shows the budget of the above equations as a
function of the upstream Mach number M1. The data ͑nor-
malized by ¯1u¯1
3
͒ are presented for different AuT values. AuT
=0 corresponds to purely vortical turbulence upstream of the
shock. Positive values of AuT ͑0.58, 1.0, 2.0, and 4.0͒ are
chosen for detailed analysis and model development. Nega-
tive AuT and a quadratic variation of AuT with Mach number
are subsequently discussed. Note that the AuT=0.58 case was
analyzed by Mahesh et al.11
The budget of source terms for AuT=0 ͓Fig. 1͑a͔͒ is iden-
tical to that presented in Ref. 5. The production due to mean
compression amplifies turbulence, while the shock-
unsteadiness term reduces uЉ2
. The pressure-velocity term is
negative except at low Mach numbers, whereas the shock-
distortion mechanism is found to amplify k. The production
due to mean pressure gradient is identically zero for this
case. As expected, ⌸k
3
has an amplifying effect on uЉ2
for
AuTϾ0. Its magnitude increases rapidly with AuT to become
one of the dominant effects at AuT=2 and above. By com-
parison, the production due to mean compression is rela-
tively unchanged across the range of AuT considered. The
remaining source terms retain their qualitative variation with
Mach number, but their magnitude is enhanced progressively
as AuT increases.
The turbulent kinetic energy shows a rapid nonmono-
tonic variation behind the shock. Mahesh et al.11
explained
this variation by noting that
␥M
2
ͫ2k
a˜2
+
pЈ2
␥2
p¯2ͬ+
pЈuЈ
p¯a˜
= const ͑9͒
downstream of the shock wave. The interaction of vortical
and entropy waves with a shock generates acoustic energy,
i.e., pЈ2
0 and pЈuЈ 0 immediately downstream of the
shock. Majority of the acoustic energy decays rapidly and is
transferred to the kinetic form as per the above equation. The
change in k due to this energy transfer mechanism is denoted
by a source term, ⌸k
2
, in the k equation, and the total contri-
bution of this term is plotted as a function of Mach number
for different AuT values in Fig. 1.
The different mechanisms discussed above can be com-
bined with the viscous dissipation rate ⑀ to get an equation
for the turbulent kinetic energy k=͑uЉ2
+vЉ2
+wЉ2
͒/2. Thus,
¯u˜
ץk
ץx
= Pk + Sk
1
+ 2Sk
2
+ ⌸k
1
+ ⌸k
2
+ ⌸k
3
− ¯⑀ ͑10͒
governs the interaction of homogeneous isotropic turbulence
with a normal shock. A factor of 2 multiplies Sk
2
in order to
include the shock-distortion effects on wЉ2
.
IV. MODELING
Grasso and Falconit13
presented a model for the produc-
tion due to mean pressure gradient, where the Favre velocity
fluctuations are modeled in terms of the mean density gradi-
ent,
⌸k
3
= −
T
¯2
1
ץ¯
ץxj
ץp¯
ץxj
. ͑11͒
Here T is the turbulent eddy viscosity, is 0.5, and sub-
script j=1,2,3 represents the three spatial directions. When
applied to the evolution of homogeneous turbulence through
a normal shock, this term has a damping effect on k, since
the gradients of mean density and pressure are positive
across the shock. Thus, the model does not reproduce the
amplifying effect of upstream entropy fluctuations when the
velocity-temperature correlation is negative. Because of this
nonphysical behavior, we do not pursue the above model
further. Instead we develop an alternate model for ⌸k
3
.
The production due to mean pressure gradient is a func-
tion of uЈTЈ/T¯. For a given AuT, uЈTЈ can be assumed to be
proportional to the streamwise velocity fluctuations in the
upstream turbulence ͑see Sec. II͒. Using Eq. ͑3͒ therefore
results in
⌸k
3
=
uЈTЈ
T¯
¯u˜
ץu˜
ץx
= − AuT¯uЉ2ץu˜
ץx
. ͑12͒
Sinha et al.5
modeled the shock-unsteadiness term as
Sk
1
= ¯uЉ2ץu˜
ץx
b1, ͑13͒
where the modeling coefficient b1 is obtained as a curve fit to
the ratio u1Јt/u1Ј2
. Values of this ratio are computed using
linear analysis for different cases of AuT and are plotted as a
function of Mach number in Fig. 2. The AuT=0 case is once
again identical to that presented earlier.5
For AuTϾ0, the
effect of incident temperature fluctuations is to amplify the
unsteady shock motion, such that u1Јt exceeds incident ve-
locity fluctuations for high values of AuT. In all cases, b1
asymptotes to a limiting value as M1→ϱ. The asymptotic
value b1,ϱ increases linearly with AuT ͑see Fig. 3͒, and the
variation is closely approximated by
025101-3 Modeling the effect of upstream temperature fluctuations Phys. Fluids 21, 025101 ͑2009͒
Downloaded 05 Nov 2010 to 129.169.126.158. Redistribution subject to AIP license or copyright; see http://pof.aip.org/about/rights_and_permissions
4. b1,ϱ = 0.4 + 0.2AuT. ͑14͒
The other terms Sk
2
, ⌸k
1
, and ⌸k
2
are modeled in Ref. 5 by
modifying the coefficient b1 to
b1Ј = b1,ϱ͑1 − e1−M1͒. ͑15͒
The same form is retained here with b1,ϱ given above as a
function of AuT.
Introducing these models into Eq. ͑10͒ we get
¯u˜
ץk
ץx
= − ¯uЉ2
͑1 − b1Ј + AuT͒
ץu˜
ץx
− ¯⑀. ͑16͒
Using the isotropic form of Reynolds stress, uЉ2
=2k/3 ͑by
setting T=0 as in Ref. 5͒ and neglecting the viscous dissi-
pation results in the following closed form solution for k
amplification across the shock:
k2
k1
= ͩu˜1
u˜2
ͪ͑2/3͒͑1−b1Ј+AuT͒
. ͑17͒
M1
1 2 3 4 5
-0.15
-0.1
-0.05
0
0.05
0.1
0.15
∫Sk
2
∫Pk
∫Πk
2
∫Sk
1
∫Πk
1
∫Πk
3
AuT = 0
M1
1 2 3 4 5
-0.2
-0.1
0
0.1
0.2
∫Sk
2
∫Pk
∫Πk
2
∫Sk
1
∫Πk
1
∫Πk
3
AuT = 0.58
M1
1 2 3 4 5
-0.2
-0.1
0
0.1
0.2
∫Sk
2
∫Pk ∫Πk
2
∫Sk
1
∫Πk
1
∫Πk
3
AuT = 1
M1
1 2 3 4 5
-0.3
0.15
0
0.15
0.3
∫Sk
2
∫Pk
∫Πk
2
∫Sk
1
∫Πk
1
∫Πk
3
AuT
= 2
M1
1 2 3 4 5
-0.9
-0.6
-0.3
0
0.3
0.6
0.9
∫Sk
2
∫Pk
∫Πk
2
∫Sk
1
∫Πk
1
∫Πk
3
AuT
= 4
(b)
(a)
(c)
(d)
(e)
FIG. 1. Budget of Eqs. ͑7͒ and ͑8͒ as a function of upstream Mach number for different values of AuT. Pk =production due to mean compression, Sk
1
=shock-unsteadiness term, Sk
2
=shock distortion term, ⌸k
1
=pressure-velocity term, ⌸k
3
=production due to mean pressure gradient, and ͐ represents the
integration across the shock. ͐⌸k
2
is the total contribution of the energy exchange mechanism downstream of the shock. All terms are normalized by ¯1u¯1
3
.
025101-4 V. K. Veera and K. Sinha Phys. Fluids 21, 025101 ͑2009͒
Downloaded 05 Nov 2010 to 129.169.126.158. Redistribution subject to AIP license or copyright; see http://pof.aip.org/about/rights_and_permissions
5. As per Boussinesq approximation, the Reynolds stress
uЉ2
is given by14
uЉ2
= −
4
3
T
ץu˜
ץx
+
2
3
¯k. ͑18͒
On substitution in the modeled k equation ͑16͒, it results in a
source term that is proportional to ͑ץu˜ /ץx͒2
. At a shock
wave, the source term assumes very large values ͑ϰ1/␦2
,
where ␦ is the mean shock thickness͒. This leads to very high
amplification of turbulent kinetic energy. As discussed in
Ref. 5, the production term in the standard k-⑀ model exhib-
its identical trend, and the amplification of k increases rap-
idly as the computational grid is refined to get a thinner
shock.5
It is argued that this nonphysical behavior of the k
equation is primarily caused by the breakdown of the eddy
viscosity assumption in a highly nonequilibrium flow such as
a shock wave. One means to avoid this trend is to suppress
eddy viscosity in the region of rapid compression. Setting
T=0 in the shock wave thus results in the isotropic form of
the Reynolds stress, which is used to obtain the k amplifica-
tion given in Eq. ͑17͒.
Figure 4 compares the model predictions with linear
analysis results. For AuT=0 the above equation is identical to
the model presented in Ref. 5 and compares well with the
linear theory results. For AuTϾ0, the model matches the the-
oretical values only at low Mach numbers and overpredicts
the amplification in k at higher Mach numbers. The magni-
tude of overprediction rapidly increases with the level of
temperature fluctuations in the upstream flow. Results ob-
tained for AuT=0 using a realizable k-⑀ model and by setting
T=0 are reproduced from Ref. 5. These models signifi-
cantly overpredict the amplification in k at higher Mach
numbers, and the model predictions are insensitive to up-
stream temperature fluctuations. They are therefore omitted
from AuTϾ0 plots.
Next, we attempt to improve the modeling of ⌸k
3
. Instead
of using the upstream value of uЈTЈ/T¯ given by Eq. ͑3͒,
taking the average of upstream and downstream quantities
may give a better estimate of uЈTЈ/T¯,
uЈTЈ
T¯
Ӎ
1
2ͫu1ЈT1Ј
T¯
1
+
u2ЈT2Ј
T¯
2
ͬ=
1
2
u1ЈT1Ј
T¯
1
ͫ1 +
u2ЈT2Ј
u1ЈT1Ј
T¯
1
T¯
2
ͬ. ͑19͒
The ratio of the correlations u2ЈT2Ј/u1ЈT1Ј is computed from
linear analysis and plotted in Fig. 5 as a function of M1 and
AuT. The ratio is of the order unity except for high Mach
numbers, especially at low values of AuT ͑for example, AuT
=0.58͒. As a first approximation we assume u2ЈT2Јϳu1ЈT1Ј. The
limitations and justifications of this assumption in the AuT
→ 0 limit are described below. Thus,
uЈTЈ
T¯
Ӎ
1
2
u1ЈT1Ј
T¯
1
ͫ1 +
T¯
1
T¯
2
ͬӍ −
AuT
2
ͩ1 +
T¯
1
T¯
2
ͪuЉ2
u˜
, ͑20͒
where Eq. ͑3͒ is used to arrive at the final form of the mod-
eled term. The mean temperature ratio across the shock is
close to 1 at low Mach numbers, and the new model ap-
proaches Eq. ͑12͒. At higher Mach numbers T¯
1/T¯
2Ͻ1.
Hence the above model is expected to yield improved pre-
dictions than Eq. ͑12͒ by reducing the amplifying effect of
⌸k
3
. Incorporating this model gives the final form of the k
equation,
¯u˜i
ץk
ץxi
= −
2
3
¯kSjjͫ1 − b1Ј +
AuT
2
ͩ1 +
1
Tr
ͪͬ− ¯⑀, ͑21͒
where Tr=T¯
2/T¯
1 is the mean temperature ratio across the
shock and is a function of upstream Mach number. Sjj
=ץu˜j /ץxj is the mean dilatation and is used to write the
frame-independent form of the equation.
Integration of the above equation across the shock ͑with
⑀=0͒ yields an amplification in k which has a form similar to
Eq. ͑17͒ and is plotted in Fig. 4. The model results match Eq.
͑17͒ and linear theory for AuT=0. The predictions also match
theory within Ϯ10% for AuT=0.58, 1, and 2. At higher AuT,
the model is found to overpredict the theory. The M1→ϱ
prediction of the model for varying AuT is compared with the
asymptotic linear theory results in Fig. 6. The model equa-
tion ͑21͒ yields accurate amplification in k up to AuT=3, after
which it deviates from the theoretical result. By comparison,
Eq. ͑17͒ grossly overpredicts turbulence amplification except
for very low levels of temperature fluctuations.
M1
u´1ξt/u´1
2
1 2 3 4 5
0
0.5
1
1.5
2
2.5
3
3.5
AuT = 4
AuT = 2AuT = 1
AuT = 0.58 AuT = 0
FIG. 2. The ratio u1Јt /u1Ј2
computed from linear analysis ͑Ref. 11͒ as a
function of upstream Mach number for different values of AuT.
AuT
b1,∞
0 1 2 3 4 5
0.5
1
1.5
0.4 + 0.2AuT
FIG. 3. Variation of the high Mach number limiting value of b1 as a function
of AuT.
025101-5 Modeling the effect of upstream temperature fluctuations Phys. Fluids 21, 025101 ͑2009͒
Downloaded 05 Nov 2010 to 129.169.126.158. Redistribution subject to AIP license or copyright; see http://pof.aip.org/about/rights_and_permissions
6. The above model is based on the assumption that u2ЈT2Ј
ϳu1ЈT1Ј, which may not be valid in the limit AuT→0. This is
because the interaction of vortical turbulence with a shock
wave produces entropy fluctuations behind the shock. As a
result, u2ЈT2Ј may not be negligible for vanishingly small u1ЈT1Ј
͑when AuTӍ0͒. However, at low AuT the contribution of the
⌸k
3
source term to the k budget is small compared to the
production and shock-unsteadiness terms. The shock-
unsteadiness model presented in Ref. 5 accounts for the
dominant effects of Pk and Sk
1
and yields correct amplifica-
tion in k when AuT=0. In this limit, the current model col-
lapses to the shock-unsteadiness model, such that the limita-
tion in ⌸k
3
modeling has negligible effect on the final result.
This is corroborated by the close match between linear
theory and model predictions in Fig. 6.
A. Upstream flow with negative AuT
We study a negative AuT case, which corresponds to a
positive velocity-temperature correlation upstream of the
shock. Following Mahesh et al.,11
AuT=−0.58 is used for the
analysis. The main effect of negative AuT is a negative ⌸k
3
term in the budget of turbulent kinetic energy ͑see Fig. 7͒.
The production term remains unchanged, and the other
M1
k2/k1
1 2 3 4 5
1
2
3
4
5
Realizable
model
µT = 0
Linear
analysis
Eq. (17)
AuT
= 0
M1
k2/k1
1 2 3 4 5
1
2
3
4
5
Eq. (17)
Eq. (21)
Linear
Analysis
AuT = 0.58
M1
k2/k1
1 2 3 4 5
1
2
3
4
5
Linear
Analysis
Eq. (17)
Eq. (21)
AuT = 1
M1
k2/k1
1 2 3 4 5
2
4
6
8
10
Linear
Analysis
Eq. (21)
Eq. (17)
AuT = 2
M1
k2
/k1
1 2 3 4 5
5
10
15
20
Linear
Analysis
Eq. (21)
Eq. (17)
AuT
= 4
(b)
(a)
(c)
(d)
(e)
FIG. 4. Turbulent kinetic energy amplification in shock/homogeneous turbulence interaction as a function of the upstream Mach number for different values
of AuT. Two improvements to the k-⑀ model are compared to linear analysis ͑Ref. 11͒.
025101-6 V. K. Veera and K. Sinha Phys. Fluids 21, 025101 ͑2009͒
Downloaded 05 Nov 2010 to 129.169.126.158. Redistribution subject to AIP license or copyright; see http://pof.aip.org/about/rights_and_permissions
7. source terms Sk
1
, Sk
2
, ⌸k
1
, and ⌸k
2
retain their qualitative varia-
tion with Mach number but are reduced in magnitude com-
pared to the AuT=0 case ͓Fig. 1͑a͔͒. Negative ⌸k
3
has a damp-
ing effect on the turbulent kinetic energy, which is consistent
with the observations of Mahesh et al.10
The model equation
͑21͒ is applied to this case with b1,ϱ given by Eq. ͑14͒. The
results presented in Fig. 8 show that the model matches lin-
ear theory within Ϯ10% up to M1Ӎ4 and overpredicts the k
amplification at higher Mach numbers. Comparison with the
AuT=0 case highlights the damping effect of negative AuT.
Note that Eq. ͑14͒ may be used only for AuTϾ−2 for which
b1,ϱϾ0.
B. Upstream flow satisfying Morkovin’s hypothesis
The thermodynamic and velocity fluctuations upstream
of the shock satisfy Morkovin’s hypothesis when AuT=͑␥
−1͒M1
2
. The model equation ͑21͒ is applied with b1,ϱ=0.4
+0.2͑␥−1͒M1
2
and the resulting k amplification is presented
in Fig. 9. The model predictions are within 10% of linear
analysis for Mach numbers up to 2.2, for which AuTՅ2.0. At
higher Mach numbers, and therefore higher AuT, the model
overpredicts the amplification of turbulent kinetic energy
across the shock. This is consistent with the trend observed
for different AuT cases presented in Fig. 4.
V. TURBULENT DISSIPATION RATE
The turbulent dissipation rate consists of a solenoidal
part, a compressible part, and contributions due to inhomo-
geneity and fluctuations in viscosity. Sinha et al.5
assumed
that the solenoidal dissipation rate is the dominant dissipa-
tive mechanism. It is given by ⑀s=¯iЈiЈ, where ¯ is the
mean kinematic viscosity and iЈ is the vorticity fluctuation.
The modeled transport equation for the solenoidal dissi-
pation rate for one-dimensional mean flow through a normal
shock is given by14
¯u˜
ץ⑀s
ץx
= − c⑀1¯uЉ2ץu˜
ץx
⑀s
k
− c⑀2
⑀s
2
k
, ͑22͒
where c⑀1=1.35 and c⑀2=1.8 are model constants.15
The
terms on the right hand side denote the production and dis-
sipation mechanisms, respectively. The production term is
dominant in a shock wave and can be integrated using the
M1
u´2T´2/u´1T´1
1 2 3 4 5
10
-2
10-1
100
101
AuT = 4
AuT = 1
AuT = 0.58
AuT = 2
High Mach
No. Range
FIG. 5. The ratio of velocity-temperature correlation magnitude downstream
and upstream of the shock, u2ЈT2Ј/u1ЈT1Ј, as a function of M1 for different
values of AuT.
AuT
k2/k1
0 1 2 3 4 5
0
10
20
30
Eq. (17)
Eq. (21)
Linear
Analysis
FIG. 6. Asymptotic ͑M1 →ϱ͒ model prediction for k amplification across a
shock as a function of AuT. Equations ͑17͒ and ͑21͒ are compared with the
linear theory results.
M1
1 2 3 4 5
-0.1
-0.05
0
0.05
0.1
∫S2
k
∫S
1
k
∫Pk
∫ ∏1
k
∫∏2
k
∫∏3
k
FIG. 7. Budget of Eqs. ͑7͒ and ͑8͒ at different Mach numbers for AuT
=−0.58 ͑see Fig. 1 for reference͒.
M1
k2/k1
1 2 3 4 5
1
2
3
4
Linear
AnalysisEq. (21)
AuT = 0
FIG. 8. Turbulent kinetic energy amplification predicted by Eq. ͑21͒ is com-
pared with linear theory for different Mach numbers when AuT =−0.58.
025101-7 Modeling the effect of upstream temperature fluctuations Phys. Fluids 21, 025101 ͑2009͒
Downloaded 05 Nov 2010 to 129.169.126.158. Redistribution subject to AIP license or copyright; see http://pof.aip.org/about/rights_and_permissions
8. isotropic form of the Reynolds stress ͑uЉ2
=2k/3͒. The result-
ing amplification in ⑀s across the shock is
⑀s2
⑀s1
= ͩu˜1
u˜2
ͪ͑2/3͒c⑀1
. ͑23͒
In the absence of upstream temperature fluctuations, Sinha et
al.5
proposed the following form of c⑀1 to match linear
theory prediction for ⑀s amplification across the shock,
c⑀1 = 1.25 + 0.2͑M1 − 1͒. ͑24͒
The resulting model matches well with DNS data for shock/
isotropic turbulence interaction.
We study the effect of uЈTЈ correlation on ⑀s amplifica-
tion. The incident velocity-temperature correlation is shown
to affect the amplification of vorticity fluctuations in the
same way as turbulent kinetic energy.10
uЈTЈϽ0 enhances
the vorticity amplification and uЈTЈϾ0 has the opposite ef-
fect. Linear analysis is used to compute the amplification in
⑀s across the shock as a function of upstream Mach number
for different values of AuT, and the results are plotted in Fig.
10. Following the approach in Ref. 5, we modify the coeffi-
cient c⑀1 to incorporate the effect of velocity-temperature
correlation such that ⑀s2/⑀s1 given by Eq. ͑23͒ matches linear
theory results.
c⑀1 = ͓1.25 + 0.2͑M1 − 1͔͒
+ AuT͑1 − 0.1AuT͒͑0.5 + e1−M1͒, ͑25͒
where the first part is identical to the AuT=0 case given
above, and the second part brings in the effect of velocity-
temperature correlation. For AuTϽ10, positive AuT increases
c⑀1 and thus enhances ⑀s amplification, and negative AuT has
a damping effect on the dissipation rate. As shown in Fig. 10,
the above model reproduces linear theory results for 1ՅM
Յ5 and −0.58ՅAuTՅ4 reasonably well. A more rigorous
approach would be to identify and model the physical
mechanisms that affect ⑀s amplification across the shock.
Such an analysis is beyond the scope of the current paper.
Note that the modifications to the k-⑀ equations pre-
sented above as well as the shock-unsteadiness modification
developed earlier5
are applicable only in shock waves.
Implementing them in a practical scenario therefore involves
identifying the high compression regions in the flowfield.
The modifications are then cast in a form such that they are
effective only in these regions, and the original model is
recovered elsewhere. References 6 and 7 delineate this
method by applying the shock-unsteadiness modification to
compression ramp and oblique shock wave impinging on a
turbulent boundary layer. A similar approach can be followed
for the current model. Also, the modifications are strictly
valid only when the mean flow is uniform on either side of
the shock wave, and the upstream turbulence field is homo-
geneous. Application to more complex flows may require
further modifications and are beyond the scope of this paper.
VI. COMPARISON WITH DNS DATA
We check the efficacy of the new modification intro-
duced in the k-⑀ model by comparing its prediction with
DNS data of shock/homogeneous turbulence interaction.10,12
Of the three cases listed in Table I, the first two are at Mach
number 1.29 and the third case is at Mach number 1.5. Case
1.29A has essentially vortical inflow turbulence, while cases
1.29B and 1.5 have an entropic thermodynamic field along
with a vortical velocity field upstream of the shock. Mork-
ovin’s hypothesis holds in the weak form, i.e., urms and Trms
in the incoming flow satisfy Eq. ͑1͒. The cross correlation
coefficient RuЈTЈ is given for each case such that
uЈTЈ
u¯T¯
= RuЈTЈ
urms
u¯
Trms
T¯
= ͑␥ − 1͒M1
2
RuЈTЈ
uЈ2
u¯2
. ͑26͒
The above equation is compared with Eq. ͑3͒ to obtain the
equivalent AuT for the three cases, and they are listed in Table
I. The values of Reynolds number based on the Taylor mi-
croscale, Re, and turbulent Mach number, Mt, at the inflow
station are also tabulated. These are used to compute the inlet
values of k and ⑀s at x=0,
kin = Mt
2
/2, ͑27͒
M1
k2/k1
1 2 3 4 5
10
20
30
40
Linear
Analysis
Eq. (21)
FIG. 9. Amplification of k predicted by Eq. ͑21͒ is compared with linear
theory for different Mach numbers when AuT =͑␥−1͒M1
2
.
M1
εs2/εs1
1 2 3 4 5
0
10
20
30
40
AuT = 4
AuT = 2
AuT = 1AuT = 0.58
AuT = 0
AuT = -0.58
FIG. 10. Amplification in solenoidal dissipation rate in shock/homogeneous
turbulence interaction as a function of the upstream Mach number. A curve
fit for c⑀1 ͑lines͒ is obtained to match the linear theory predictions ͑symbols͒
for different AuT.
025101-8 V. K. Veera and K. Sinha Phys. Fluids 21, 025101 ͑2009͒
Downloaded 05 Nov 2010 to 129.169.126.158. Redistribution subject to AIP license or copyright; see http://pof.aip.org/about/rights_and_permissions
9. ⑀in = 15
¯
¯
urms
2
2
L
a3 =
Ά
5
3
Mt
4
ReL/Re
2
for M1 = 1.29
10
ͱ3
Mt
3
/Re for M1 = 1.5. ·͑28͒
Here, the mean flow variables and k and ⑀ are normalized
using upstream values of ¯, a˜, and ¯ , where a˜ is the mean
speed of sound and ¯ is the mean viscosity of the fluid. The
reference length scale L in cases 1.29A and 1.29B is chosen
such that the Reynolds number based on the reference quan-
tities, ReL, is 750. Case 1.5 uses a characteristic length of 2
as reference, where is the Taylor microscale as defined in
Ref. 16.
The normalized model equations ͑21͒ and ͑22͒ are inte-
grated through the shock, which is specified as hyperbolic
tangent profiles of mean flow quantities. The mean shock
thickness is obtained from DNS data. By comparison, the
shock thickness obtained by solving the mean flow equations
depends on the numerics of the computation and the reso-
lution of the computational grid in the vicinity of the shock
wave. The k and ⑀s amplifications given by Eqs. ͑21͒ and
͑23͒ are independent of the shock thickness. Therefore the
new model results presented below are identical to the solu-
tion of the fully coupled mean flow and turbulence model
equations. The same is true for the realizable model and the
shock-unsteadiness modification results. On the contrary, the
standard k-⑀ model predictions are sensitive to the shock
thickness, such that the postshock k value and its decay rate
increase dramatically when the shock becomes thinner.5
The evolution of k obtained by integrating the model
equations across the shock wave is plotted in Fig. 11, where
the data are normalized by the value of k immediately up-
stream of the shock. For case 1.29A with negligible upstream
entropy fluctuation, the new model is almost identical to the
shock-unsteadiness modification proposed by Sinha et al.5
Both models match the k amplification across the shock ͑at
x=2.7͒ obtained from DNS. The models do not reproduce
the rapid variation in k immediately behind the shock ͑2
ϽxϽ2.7͒ because they do not model the decay of acoustic
energy in this region. Also, the high k values reported by
DNS in the shock region are not predicted by the models.
These values are an artifact of the unsteady shock motion
and do not represent turbulent fluctuations. The standard k-⑀
model and the realizable model results, reproduced from Ref.
5, show a higher value of k downstream of the shock. The
above results serve as a baseline for studying the effect of
AuT.
TABLE I. Mean and turbulent flow quantities for the interaction of homogeneous turbulence with a normal
shock. The inflow turbulence is normalized by the upstream values of ¯, a˜, and ¯ .
Case M1 AuT Mt Re kin ⑀in
1.29A 1.29 0.04 0.14 19.1 9.8ϫ10−3
1.3ϫ10−3
1.29B 1.29 0.56 0.14 19.1 9.8ϫ10−3
1.3ϫ10−3
1.5 1.50 0.82 0.17 6.7 15.0ϫ10−3
4.2ϫ10−3
x
k
0 1 2 3 4 5 6
0.5
1
1.5
2
2.5
(a) M1 = 1.29
AuT = 0.04
DNS
Realizable
model
Unsteadiness modification
New model &
Standard
model
x
k
0 1 2 3 4 5 6
0.5
1
1.5
2
2.5
New
model
Unsteadiness
modification
(b) M1 = 1.29
AuT = 0.56
DNS
Standard
model
x
k
0 1 2 3 4 5 6
0.5
1
1.5
2
2.5
3
(c) M1 = 1.50
AuT = 0.82
Unsteadiness
modification
New
model
DNS
Standard
model
(b)
(a)
(c)
FIG. 11. Evolution of k in the interaction of homogeneous turbulence with
a normal shock for cases 1.29A, 1.29B, and 1.5 listed in Table I. Different
versions of the k-⑀ models ͑lines͒ are compared with DNS data ͑Refs. 10
and 12͒ ͑symbols͒.
025101-9 Modeling the effect of upstream temperature fluctuations Phys. Fluids 21, 025101 ͑2009͒
Downloaded 05 Nov 2010 to 129.169.126.158. Redistribution subject to AIP license or copyright; see http://pof.aip.org/about/rights_and_permissions
10. For case 1.29B with AuTϾ0, the new model predicts a
higher amplification in turbulent kinetic energy across the
shock than case 1.29A. This matches DNS data, for example,
at xӍ3. By comparison, the standard k-⑀ and the shock-
unsteadiness model results are insensitive to the variation in
AuT and therefore identical to case 1.29A. The realizable
model results are also independent of AuT and are not shown
in the figure. Downstream of the shock, the current model
predicts a slower decay of turbulent kinetic energy as com-
pared to DNS. The same is true for the shock-unsteadiness
model and it matches the trend observed at Mach 1.29 in
Ref. 5.
At Mach 1.5 and AuT=0.82, the new model slightly un-
derpredicts the DNS data downstream of the shock. By com-
parison, the shock-unsteadiness model results are signifi-
cantly lower, whereas the standard k-⑀ model grossly
overpredicts k amplification across the shock. For this case,
c⑀2=1.5 is used in the model equation ͑22͒. Jamme et al.12
noted that this value of c⑀2 matches the turbulence decay rate
obtained by their DNS.
VII. CONCLUSIONS
The magnitude of upstream entropy fluctuations and the
sign of the velocity-temperature correlation are known to af-
fect the amplification of turbulence across a shock wave. We
study the effect of this correlation and its modeling in the
RANS framework by considering the interaction of homoge-
neous turbulence with a normal shock. A parameter AuT is
defined to relate the incident velocity and temperature fluc-
tuations. Budget of the turbulent kinetic energy k amplifica-
tion shows that the primary effect of velocity-temperature
correlation comes in via the production due to mean pressure
gradient. The source term is positive for negatively corre-
lated velocity and temperature fluctuations ͑AuTϾ0͒ up-
stream of the shock and has a damping effect for positive
correlation ͑AuTϽ0͒. Existing turbulence models do not ac-
count for this effect correctly. Linear analysis is used to de-
velop a new physically consistent model for the production
due to mean pressure gradient. The shock-unsteadiness pa-
rameter and the solenoidal dissipation rate equation devel-
oped earlier are also updated to account for the effect of
upstream temperature fluctuations. The resulting two-
equation model reproduces the enhanced turbulence amplifi-
cation for AuTϾ0 as well as the damping effect of AuTϽ0.
The model predictions match linear theory well for AuT in the
range 0–2 but overpredicts the k amplification for higher AuT
and for AuTϽ0. The new k-⑀ model is found to reproduce
DNS data of shock/homogeneous turbulence interaction
well.
ACKNOWLEDGMENTS
The authors wish to thank Professor Krishnan Mahesh of
the University of Minnesota for useful discussions and the
linear analysis code.
1
D. Knight, H. Yan, A. Panaras, and A. Zheltovodov, “Advances in CFD
prediction of shockwave turbulent boundary layer interactions,” Prog.
Aerosp. Sci. 39, 121 ͑2003͒.
2
W. W. Liou, P. G. Huang, and T.-H. Shih, “Turbulence model assessment
for shock-wave/turbulent boundary layer interaction in transonic and su-
personic flows,” Comput. Fluids 29, 275 ͑2000͒.
3
J. Forsythe, K. Hoffmann, and H.-M. Damevin, “An assessment of several
turbulence models for supersonic compression ramp flow,” AIAA Paper
No. 98-2648, 1998.
4
T. J. Coakley and P. G. Huang, “Turbulence modeling for high speed
flows,” AIAA Paper No. 92-0436, 1992.
5
K. Sinha, K. Mahesh, and G. V. Candler, “Modeling shock unsteadiness in
shock turbulence interaction,” Phys. Fluids 15, 2290 ͑2003͒.
6
K. Sinha, K. Mahesh, and G. V. Candler, “Modeling the effect of shock
unsteadiness in shock/turbulent boundary layer interactions,” AIAA J. 43,
586 ͑2005͒.
7
A. Ali Pasha and K. Sinha, “Shock-unsteadiness model applied to oblique
shock-wave/turbulent boundary layer interaction,” Int. J. Comput. Fluid
Dyn. 22, 569 ͑2008͒.
8
P. Bradshaw, “Compressible turbulent shear layers,” Annu. Rev. Fluid
Mech. 9, 33 ͑1977͒.
9
P. Martin, “Direct numerical simulation of hypersonic turbulent boundary
layers. Part 1. Initialization and comparison with experiments,” J. Fluid
Mech. 570, 347 ͑2007͒.
10
K. Mahesh, S. K. Lele, and P. Moin, “The influence of entropy fluctuations
on the interaction of turbulence with a shock wave,” J. Fluid Mech. 334,
353 ͑1997͒.
11
K. Mahesh, P. Moin, and S. K. Lele, “The interaction of a shock wave with
a turbulent shear flow,” Thermosciences Division, Department of Me-
chanical Engineering, Stanford University, Report No. TF-69, Stanford,
CA, 1996.
12
S. Jamme, J.-B. Cazalbou, F. Torres, and P. Chassaing, “Direct numerical
simulation of the interaction between a shock wave and various types of
isotropic turbulence,” Flow, Turbul. Combust. 68, 227 ͑2002͒.
13
F. Grasso and D. Falconit, “High-speed turbulence modeling of shock-
wave boundary-layer interaction,” AIAA J. 31, 1199 ͑1993͒.
14
D. C. Wilcox, Turbulence Modeling for CFD, 2nd ed. ͑DCW, La Canada,
1998͒, p. 236.
15
K. Y. Chien, “Prediction of channel and boundary layer flows with a low
Reynolds number turbulence model,” AIAA J. 20, 33 ͑1982͒.
16
H. Tennekes and J. L. Lumley, A First Course in Turbulence ͑MIT, Cam-
bridge, 1972͒, p. 66.
025101-10 V. K. Veera and K. Sinha Phys. Fluids 21, 025101 ͑2009͒
Downloaded 05 Nov 2010 to 129.169.126.158. Redistribution subject to AIP license or copyright; see http://pof.aip.org/about/rights_and_permissions