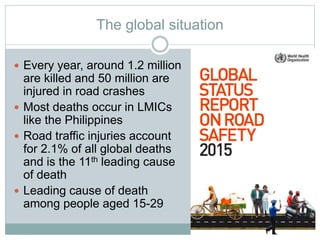
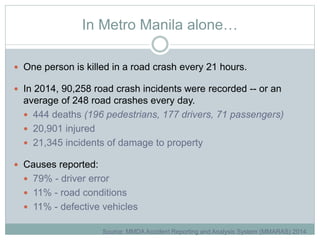
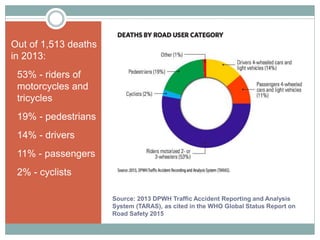
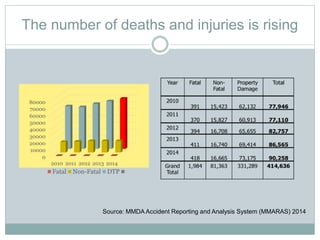
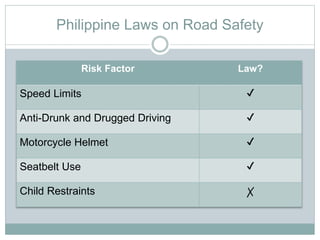
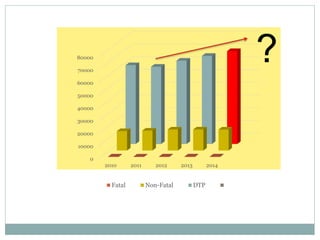
20th National Press Forum  June 23, 2016
Evita Ricafort
Policy Adviser, ImagineLaw
Road Safety
ImagineLaw
 A non-stock, non-profit organization that aims to
utilize legal and policy expertise in aid of
development in the Philippines.
 Public policy development and advocacy
 Research
 Knowledge and capacity building
 Information, education, and communication campaigns
Image from www.crashnotaccident.com
The global situation
 Every year, around 1.2 million
are killed and 50 million are
injured in road crashes
 Most deaths occur in LMICs
like the Philippines
 Road traffic injuries account
for 2.1% of all global deaths
and is the 11th leading cause
of death
 Leading cause of death
among people aged 15-29
The Philippine situation
 In 2008, DOH reported road crashes as the 4th
leading cause of death in the Philippines
 Current data suggests that 300,000 Filipinos will die
of road crashes by 2020 if preventive measures are
not taken
In Metro Manila alone…
 One person is killed in a road crash every 21 hours.
 In 2014, 90,258 road crash incidents were recorded -- or an
average of 248 road crashes every day.
 444 deaths (196 pedestrians, 177 drivers, 71 passengers)
 20,901 injured
 21,345 incidents of damage to property
 Causes reported:
 79% - driver error
 11% - road conditions
 11% - defective vehicles
Source: MMDA Accident Reporting and Analysis System (MMARAS) 2014
In 2013, the DPWH recorded 1,513 deaths.
Source: DPWH – Traffic Accident Reporting and Analysis System (TARAS)
Source: 2013 DPWH Traffic Accident Reporting and Analysis
System (TARAS), as cited in the WHO Global Status Report on
Road Safety 2015
Out of 1,513 deaths
in 2013:
• 53% - riders of
motorcycles and
tricycles
• 19% - pedestrians
• 14% - drivers
• 11% - passengers
• 2% - cyclists
The number of deaths and injuries is rising
0
10000
20000
30000
40000
50000
60000
70000
80000
2010 2011 2012 2013 2014
Fatal Non-Fatal DTP
Source: MMDA Accident Reporting and Analysis System (MMARAS) 2014
Social and economic costs
 Globally, direct economic cost of road crashes is
estimated at $518 billion.
 The cost of road crash injuries is estimated at
roughly 1% of the GNP in low-income countries, and
1.5% in middle-income countries.
 In the Philippines, the estimated GDP lost due to
road traffic crashes is 2.6% (2009, Sigua, NTCS)
 In 2015, the cost of road crashes in the Philippines amounted to over
Php392 billion, based on a GDP of PhP15.1 trillion
Road Safety Risk Factors
 WHO has identified risk factors where proper
intervention or countermeasures have been shown
to effectively reduce road traffic crashes.
 Speeding
 Use of restraints
 Helmets
 Driving under the influence of alcohol or drugs
Speeding
 Crash risk increases as speed
increases
 The relative risk of crash
involvement doubles for each
increase of 5kph above 60kph.
 Car occupants in a crash with an
impact speed of 80kph are 20 times
more likely to die than if the impact
speed were 30kph.
 Pedestrians have a 90% chance of
surviving impacts at 30kph, but less
than 50% chance of surviving those
at 45kph or above. Image source: International Institute for
Legislative Affairs (www.grsproadsafety.org)
Use of Restraints
 Seatbelt use reduces the risk of death among drivers and
front-seat occupants by 45-50%. For rear-seat occupants,
the risk of death and serious injury is reduced by 25% and
minor injuries by up to 75%. (GRSP)
 The use of safety seats in cars reduce infant deaths by
approximately 71%, while deaths of small children are
reduced by 54%. (WHO)
Image source: National Road Safety Committee Bahamas
(www.grsproadsafety.org)
Helmets
• Use of helmets has been shown to
reduce fatal and serious head
injuries by between 20% to 45%
and to be the most successful
approach for preventing injury
among motorized two-wheeler
riders.
• Head trauma is the main cause of
death and morbidity, contributing to
around 75% of deaths.
• Bicycle helmets reduce the risk of
head and brain injuries by between
63% and 88%.
World Report on Road Traffic
Injury Prevention (2004)
Image source: 7-percent.org
(www.grsproadsafety.org)
Drunk or Drugged Driving
 Drivers who had consumed
alcohol had a higher risk of
involvement in crashes than
those with a zero BAC.
 Each 0.02% increase in BAC
level approximately doubled the
risk of involvement in a fatal
crash.
 Alcohol was present in between
33% and 69% of fatally injured
drivers, and in between 8% and
29% of non-fatally injured.
World Report on Road Traffic
Injury Prevention (2004)
Image source: SomersetRoad Safety
(www.grsproadsafety.org)
Philippine Laws on Road Safety
Risk Factor Law?
Speed Limits ✔
Anti-Drunk and Drugged Driving ✔
Motorcycle Helmet ✔
Seatbelt Use ✔
Child Restraints ✗
0
10000
20000
30000
40000
50000
60000
70000
80000
2010 2011 2012 2013 2014
Fatal Non-Fatal DTP
?

Vera files road safety presentation (2016.06.20)

  • 1.
    20th National PressForum  June 23, 2016 Evita Ricafort Policy Adviser, ImagineLaw Road Safety
  • 2.
    ImagineLaw  A non-stock,non-profit organization that aims to utilize legal and policy expertise in aid of development in the Philippines.  Public policy development and advocacy  Research  Knowledge and capacity building  Information, education, and communication campaigns
  • 3.
  • 4.
    The global situation Every year, around 1.2 million are killed and 50 million are injured in road crashes  Most deaths occur in LMICs like the Philippines  Road traffic injuries account for 2.1% of all global deaths and is the 11th leading cause of death  Leading cause of death among people aged 15-29
  • 5.
    The Philippine situation In 2008, DOH reported road crashes as the 4th leading cause of death in the Philippines  Current data suggests that 300,000 Filipinos will die of road crashes by 2020 if preventive measures are not taken
  • 6.
    In Metro Manilaalone…  One person is killed in a road crash every 21 hours.  In 2014, 90,258 road crash incidents were recorded -- or an average of 248 road crashes every day.  444 deaths (196 pedestrians, 177 drivers, 71 passengers)  20,901 injured  21,345 incidents of damage to property  Causes reported:  79% - driver error  11% - road conditions  11% - defective vehicles Source: MMDA Accident Reporting and Analysis System (MMARAS) 2014
  • 7.
    In 2013, theDPWH recorded 1,513 deaths. Source: DPWH – Traffic Accident Reporting and Analysis System (TARAS)
  • 8.
    Source: 2013 DPWHTraffic Accident Reporting and Analysis System (TARAS), as cited in the WHO Global Status Report on Road Safety 2015 Out of 1,513 deaths in 2013: • 53% - riders of motorcycles and tricycles • 19% - pedestrians • 14% - drivers • 11% - passengers • 2% - cyclists
  • 9.
    The number ofdeaths and injuries is rising 0 10000 20000 30000 40000 50000 60000 70000 80000 2010 2011 2012 2013 2014 Fatal Non-Fatal DTP Source: MMDA Accident Reporting and Analysis System (MMARAS) 2014
  • 10.
    Social and economiccosts  Globally, direct economic cost of road crashes is estimated at $518 billion.  The cost of road crash injuries is estimated at roughly 1% of the GNP in low-income countries, and 1.5% in middle-income countries.  In the Philippines, the estimated GDP lost due to road traffic crashes is 2.6% (2009, Sigua, NTCS)  In 2015, the cost of road crashes in the Philippines amounted to over Php392 billion, based on a GDP of PhP15.1 trillion
  • 11.
    Road Safety RiskFactors  WHO has identified risk factors where proper intervention or countermeasures have been shown to effectively reduce road traffic crashes.  Speeding  Use of restraints  Helmets  Driving under the influence of alcohol or drugs
  • 12.
    Speeding  Crash riskincreases as speed increases  The relative risk of crash involvement doubles for each increase of 5kph above 60kph.  Car occupants in a crash with an impact speed of 80kph are 20 times more likely to die than if the impact speed were 30kph.  Pedestrians have a 90% chance of surviving impacts at 30kph, but less than 50% chance of surviving those at 45kph or above. Image source: International Institute for Legislative Affairs (www.grsproadsafety.org)
  • 13.
    Use of Restraints Seatbelt use reduces the risk of death among drivers and front-seat occupants by 45-50%. For rear-seat occupants, the risk of death and serious injury is reduced by 25% and minor injuries by up to 75%. (GRSP)  The use of safety seats in cars reduce infant deaths by approximately 71%, while deaths of small children are reduced by 54%. (WHO) Image source: National Road Safety Committee Bahamas (www.grsproadsafety.org)
  • 14.
    Helmets • Use ofhelmets has been shown to reduce fatal and serious head injuries by between 20% to 45% and to be the most successful approach for preventing injury among motorized two-wheeler riders. • Head trauma is the main cause of death and morbidity, contributing to around 75% of deaths. • Bicycle helmets reduce the risk of head and brain injuries by between 63% and 88%. World Report on Road Traffic Injury Prevention (2004) Image source: 7-percent.org (www.grsproadsafety.org)
  • 15.
    Drunk or DruggedDriving  Drivers who had consumed alcohol had a higher risk of involvement in crashes than those with a zero BAC.  Each 0.02% increase in BAC level approximately doubled the risk of involvement in a fatal crash.  Alcohol was present in between 33% and 69% of fatally injured drivers, and in between 8% and 29% of non-fatally injured. World Report on Road Traffic Injury Prevention (2004) Image source: SomersetRoad Safety (www.grsproadsafety.org)
  • 16.
    Philippine Laws onRoad Safety Risk Factor Law? Speed Limits ✔ Anti-Drunk and Drugged Driving ✔ Motorcycle Helmet ✔ Seatbelt Use ✔ Child Restraints ✗
  • 17.

Editor's Notes

  • #9 Caveat: The numbers could be an underestimation of road crash deaths and road crash injuries due to unreliable data collection and underreporting.