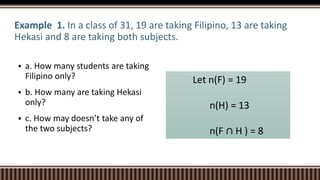
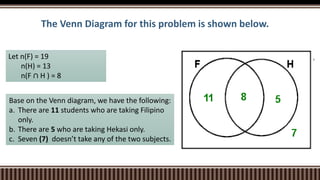
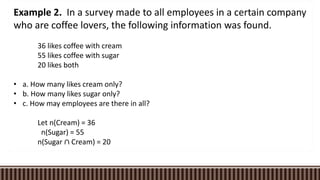
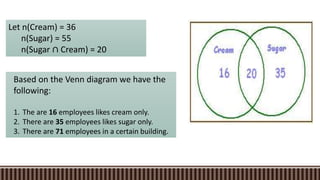
This document provides two examples of using Venn diagrams to solve problems involving sets. The first example involves students taking Filipino and Hekasi courses. It is determined that 11 students take Filipino only, 5 take Hekasi only, and 7 do not take either. The second example surveys coffee drinker preferences at a company. It finds that 16 like cream only, 35 like sugar only, and there are a total of 71 employees.